Pay Versus Performance Disclosure
As required by Section 953(a) of the Dodd-Frank Act and Item 402(v) of Regulation S-K, we are providing the following disclosure regarding the relationship between executive “compensation actually paid” (“CAP”) to our principal executive officer (“PEO”) and our other named executive officers (the “Non-PEO NEOs”) and Company financial performance for the fiscal years listed below. As a smaller reporting company for purposes of fiscal year 2025 reporting, the following table sets forth information with respect to the alignment between our executive compensation and our financial performance for the past three fiscal years.
| Fiscal Year | Summary | Compensation | Average | Average | Value of | Net Income | ||||||||||
| 2025 | 2,494,099 | (3,542,747 | ) | 1,370,035 | (2,078,013 | ) | (77 | ) | (75.8 | ) | ||||||
| 2024 | 3,215,003 | 3,843,460 |
| 1,316,564 | 2,487,071 |
| 343 |
| (71.3 | ) | ||||||
| 2023 | 3,369,990 | 2,415,149 |
| 935,185 | 762,127 |
| 63 |
| (64.5 | ) | ||||||
____________
(1) For each of the fiscal years presented in the table above, Ronald Martell was our only PEO. The individuals comprising the Non-PEO NEOs for each of 2025, 2024 and 2023 were Jeet Mahal, Herb Cross and Edwin Tucker, M.D.
(2) Represents the amount of the CAP to our PEO or the Non-PEO NEOs, as computed in accordance with Item 402(v) of Regulation S-K, and does not reflect compensation actually earned, realized or received by our PEO or the Non-PEO NEOs during the applicable fiscal year. These amounts reflect the total amount of compensation for our named executive officers reported in the Summary Compensation Table, with certain adjustments as described in footnote 3 below.
(3) The following table summarizes the adjustments required to be made to the amounts reported in the Summary Compensation Table for the applicable fiscal year in accordance with Item 402(v) of Regulation S-K in order to determine the amounts shown in the table above as being the CAP. Equity values are calculated in accordance with FASB ASC Topic 718.
| Fiscal Year | Summary | Exclusion of | Inclusion of | Compensation | |||||||
| 2025 | 2,494,099 | (1,766,827 | ) | (4,270,019 | ) | (3,542,747 | ) | ||||
| 2024 | 3,215,003 | (2,178,640 | ) | 2,807,097 |
| 3,843,460 |
| ||||
| 2023 | 3,369,990 | (2,361,818 | ) | 1,406,977 |
| 2,415,149 |
| ||||
| Fiscal Year | Average | Average | Average | Average | |||||||
| 2025 | 1,370,035 | (679,549 | ) | (2,768,499 | ) | (2,078,013 | ) | ||||
| 2024 | 1,316,564 | (638,263 | ) | 1,808,770 |
| 2,487,071 |
| ||||
| 2023 | 935,185 | (480,782 | ) | 307,724 |
| 762,127 |
| ||||
____________
(a) Represents the aggregate amount of the “Stock Awards” and “Option Awards” columns for our PEO reported in the Summary Compensation Table for the applicable fiscal year.
(b) Amounts reported in this column are derived from the amounts set forth in the following table for the applicable fiscal year:
| Fiscal Year | Year-End | Change in Fair Value from the Last Day of the Prior Year to the Last Day of the Year of Unvested Equity | Change in Fair Value from the Last Day of the Prior Year to the Vesting Date of Unvested Equity Awards that Vested During the Year for PEO | Total Inclusion of Equity Values for PEO | |||||||
| 2025 | 390,152 | (2,579,609 | ) | (2,080,562 | ) | (4,270,019 | ) | ||||
| 2024 | 2,034,880 | 778,601 |
| (6,384 | ) | 2,807,097 |
| ||||
| 2023 | 797,566 | 987 |
| 608,424 |
| 1,406,977 |
| ||||
(c) The following adjustments are not applicable and are therefore omitted: (i) the fair value as of the vesting date for awards that are granted and vest in the same year; (ii) the amount equal to the fair value at the end of the prior fiscal year for any awards granted in any prior fiscal year that fail to meet the applicable vesting conditions during the covered fiscal year; and (iii) the dollar value of any dividends or other earnings paid on stock or option awards in the covered fiscal year prior to the vesting date that are not otherwise included in the total compensation for the covered fiscal year.
(d) Represents the average of the aggregate amount of the “Stock Awards” and “Option Awards” columns for the Non-PEO NEOs reported in the Summary Compensation Table for the applicable fiscal year.
(e) Amounts reported in this column are derived from the amounts set forth in the following table for the applicable fiscal year:
| Fiscal Year | Average Year-End Fair Value of Equity Awards Granted During the Year That Remained Unvested as of the Last Day of the Year for Non-PEO | Average Change in Fair Value from the Last Day of the Prior Year to the Last Day of the Year of Unvested Equity Awards for Non-PEO NEOs | Average Change in Fair Value from the Last Day of the Prior Year to the Vesting Date of Unvested Equity | Total Average Inclusion of Equity Values for Non-PEO NEOs | |||||||
| 2025 | 149,958 | (1,522,970 | ) | (1,395,486 | ) | (2,768,499 | ) | ||||
| 2024 | 1,561,405 | 220,019 |
| 27,346 |
| 1,808,770 |
| ||||
| 2023 | 232,814 | 5,685 |
| 69,225 |
| 307,724 |
| ||||
(4) The TSR assumes $100 was invested in our Company for the period from the beginning of the measurement period through the end of the listed measurement period. The TSR is calculated by dividing (i) the difference between the stock price at the end of each measurement period shown and the beginning of the measurement period by (ii) the stock price at the beginning of the measurement period. Historical stock performance is not necessarily indicative of future stock performance.
| Fiscal Year | Summary | Exclusion of | Inclusion of | Compensation | |||||||
| 2025 | 2,494,099 | (1,766,827 | ) | (4,270,019 | ) | (3,542,747 | ) | ||||
| 2024 | 3,215,003 | (2,178,640 | ) | 2,807,097 |
| 3,843,460 |
| ||||
| 2023 | 3,369,990 | (2,361,818 | ) | 1,406,977 |
| 2,415,149 |
| ||||
(a) Represents the aggregate amount of the “Stock Awards” and “Option Awards” columns for our PEO reported in the Summary Compensation Table for the applicable fiscal year.
(b) Amounts reported in this column are derived from the amounts set forth in the following table for the applicable fiscal year:
| Fiscal Year | Year-End | Change in Fair Value from the Last Day of the Prior Year to the Last Day of the Year of Unvested Equity | Change in Fair Value from the Last Day of the Prior Year to the Vesting Date of Unvested Equity Awards that Vested During the Year for PEO | Total Inclusion of Equity Values for PEO | |||||||
| 2025 | 390,152 | (2,579,609 | ) | (2,080,562 | ) | (4,270,019 | ) | ||||
| 2024 | 2,034,880 | 778,601 |
| (6,384 | ) | 2,807,097 |
| ||||
| 2023 | 797,566 | 987 |
| 608,424 |
| 1,406,977 |
| ||||
(c) The following adjustments are not applicable and are therefore omitted: (i) the fair value as of the vesting date for awards that are granted and vest in the same year; (ii) the amount equal to the fair value at the end of the prior fiscal year for any awards granted in any prior fiscal year that fail to meet the applicable vesting conditions during the covered fiscal year; and (iii) the dollar value of any dividends or other earnings paid on stock or option awards in the covered fiscal year prior to the vesting date that are not otherwise included in the total compensation for the covered fiscal year.
| Fiscal Year | Average | Average | Average | Average | |||||||
| 2025 | 1,370,035 | (679,549 | ) | (2,768,499 | ) | (2,078,013 | ) | ||||
| 2024 | 1,316,564 | (638,263 | ) | 1,808,770 |
| 2,487,071 |
| ||||
| 2023 | 935,185 | (480,782 | ) | 307,724 |
| 762,127 |
| ||||
(c) The following adjustments are not applicable and are therefore omitted: (i) the fair value as of the vesting date for awards that are granted and vest in the same year; (ii) the amount equal to the fair value at the end of the prior fiscal year for any awards granted in any prior fiscal year that fail to meet the applicable vesting conditions during the covered fiscal year; and (iii) the dollar value of any dividends or other earnings paid on stock or option awards in the covered fiscal year prior to the vesting date that are not otherwise included in the total compensation for the covered fiscal year.
(d) Represents the average of the aggregate amount of the “Stock Awards” and “Option Awards” columns for the Non-PEO NEOs reported in the Summary Compensation Table for the applicable fiscal year.
(e) Amounts reported in this column are derived from the amounts set forth in the following table for the applicable fiscal year:
| Fiscal Year | Average Year-End Fair Value of Equity Awards Granted During the Year That Remained Unvested as of the Last Day of the Year for Non-PEO | Average Change in Fair Value from the Last Day of the Prior Year to the Last Day of the Year of Unvested Equity Awards for Non-PEO NEOs | Average Change in Fair Value from the Last Day of the Prior Year to the Vesting Date of Unvested Equity | Total Average Inclusion of Equity Values for Non-PEO NEOs | |||||||
| 2025 | 149,958 | (1,522,970 | ) | (1,395,486 | ) | (2,768,499 | ) | ||||
| 2024 | 1,561,405 | 220,019 |
| 27,346 |
| 1,808,770 |
| ||||
| 2023 | 232,814 | 5,685 |
| 69,225 |
| 307,724 |
| ||||
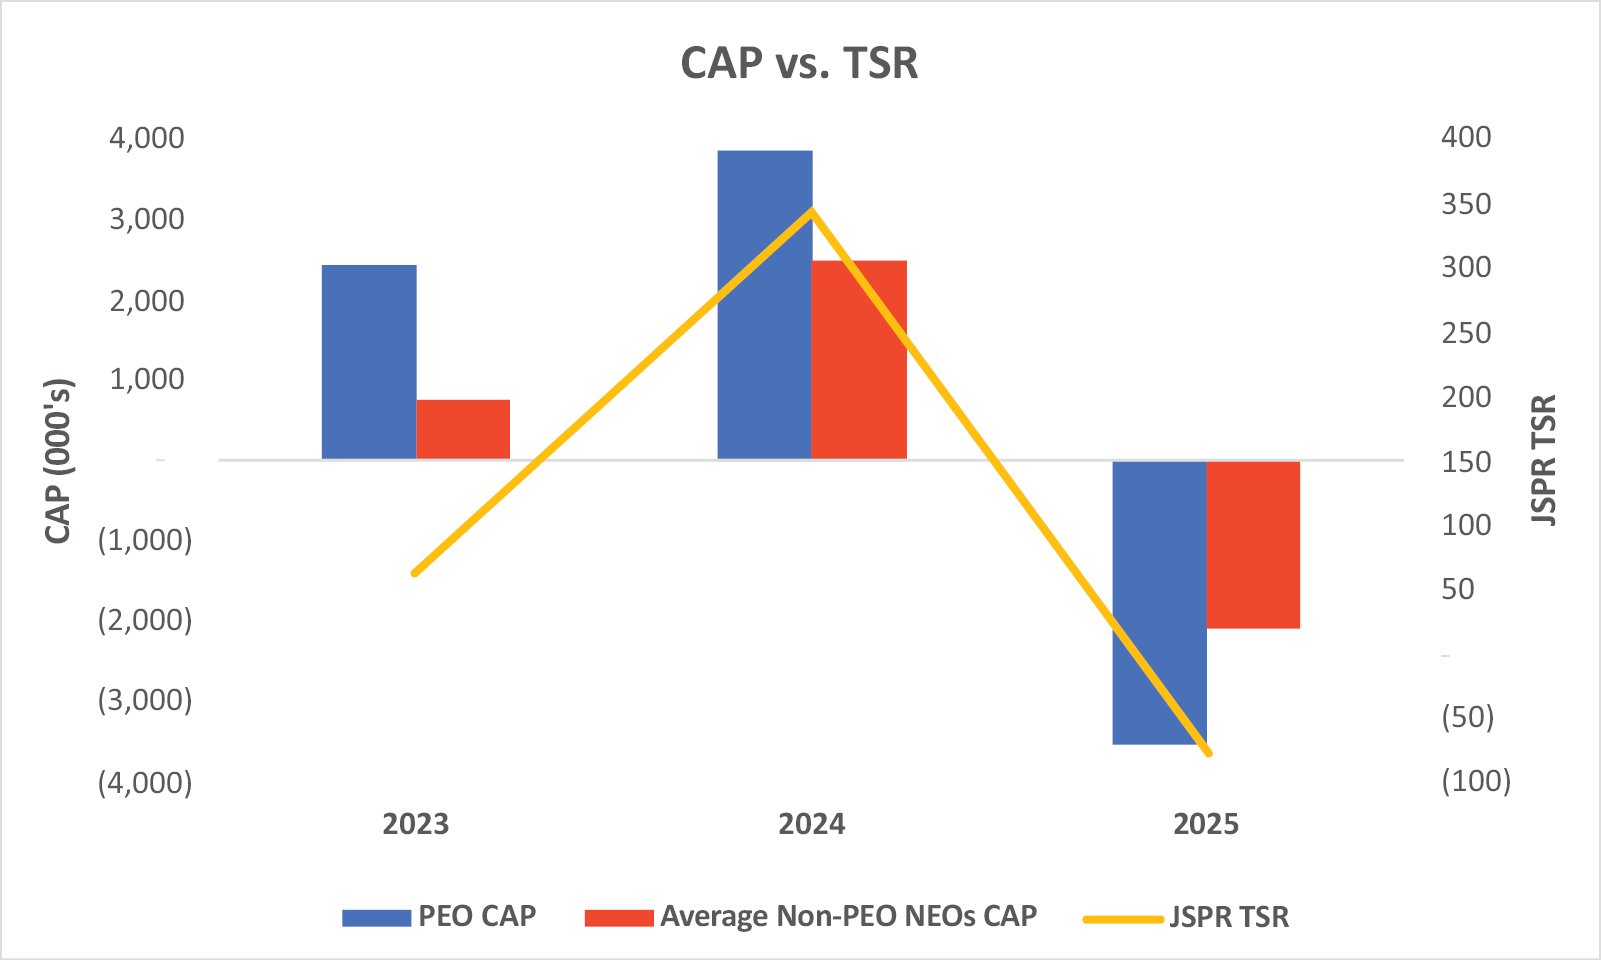
Description of Relationship Between the CAP to PEO and Non-PEO NEOs and the TSR
The following chart sets forth the relationship between the CAP to our PEO, the average of the CAP to our Non-PEO NEOs, and our cumulative TSR over the three most recently completed fiscal years.
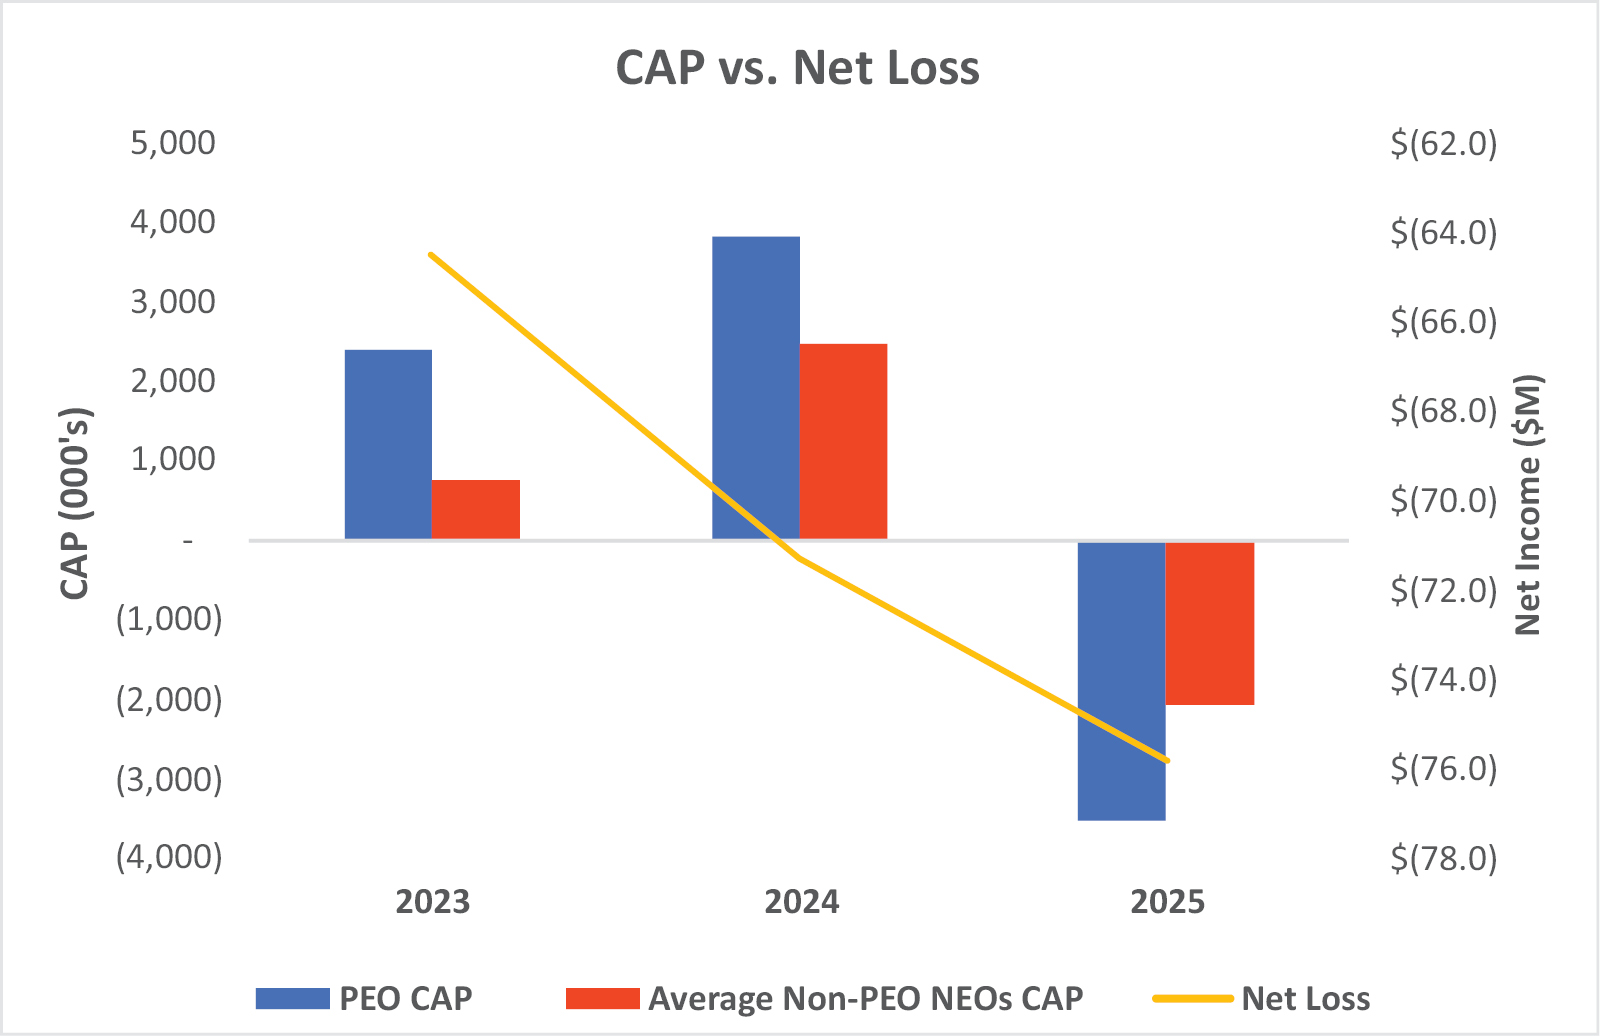
Description of Relationship Between the CAP to PEO and Non-PEO NEOs and Net Income
The following chart sets forth the relationship between the CAP to our PEO, the average of the CAP to our Non-PEO NEOs, and our Net Income during the three most recently completed fiscal years.
| [1] | For each of the fiscal years presented in the table above, Ronald Martell was our only PEO. The individuals comprising the Non-PEO NEOs for each of 2025, 2024 and 2023 were Jeet Mahal, Herb Cross and Edwin Tucker, M.D. | ||||||||||||||||||||||||||||||||||||||||||||||||||||||||||||||||||||||||||||||||||||||||||||||||||||||||||||||||||||||||||||||||||||||||||||||||||||||||||||||||||||||||||||||||||||||||||||||||
| [2] | Represents the amount of the CAP to our PEO or the Non-PEO NEOs, as computed in accordance with Item 402(v) of Regulation S-K, and does not reflect compensation actually earned, realized or received by our PEO or the Non-PEO NEOs during the applicable fiscal year. These amounts reflect the total amount of compensation for our named executive officers reported in the Summary Compensation Table, with certain adjustments as described in footnote 3 below. | ||||||||||||||||||||||||||||||||||||||||||||||||||||||||||||||||||||||||||||||||||||||||||||||||||||||||||||||||||||||||||||||||||||||||||||||||||||||||||||||||||||||||||||||||||||||||||||||||
| [3] | The following adjustments are not applicable and are therefore omitted: (i) the fair value as of the vesting date for awards that are granted and vest in the same year; (ii) the amount equal to the fair value at the end of the prior fiscal year for any awards granted in any prior fiscal year that fail to meet the applicable vesting conditions during the covered fiscal year; and (iii) the dollar value of any dividends or other earnings paid on stock or option awards in the covered fiscal year prior to the vesting date that are not otherwise included in the total compensation for the covered fiscal year. | ||||||||||||||||||||||||||||||||||||||||||||||||||||||||||||||||||||||||||||||||||||||||||||||||||||||||||||||||||||||||||||||||||||||||||||||||||||||||||||||||||||||||||||||||||||||||||||||||
| [4] | The following table summarizes the adjustments required to be made to the amounts reported in the Summary Compensation Table for the applicable fiscal year in accordance with Item 402(v) of Regulation S-K in order to determine the amounts shown in the table above as being the CAP. Equity values are calculated in accordance with FASB ASC Topic 718.
____________ (a) Represents the aggregate amount of the “Stock Awards” and “Option Awards” columns for our PEO reported in the Summary Compensation Table for the applicable fiscal year. (b) Amounts reported in this column are derived from the amounts set forth in the following table for the applicable fiscal year:
(c) The following adjustments are not applicable and are therefore omitted: (i) the fair value as of the vesting date for awards that are granted and vest in the same year; (ii) the amount equal to the fair value at the end of the prior fiscal year for any awards granted in any prior fiscal year that fail to meet the applicable vesting conditions during the covered fiscal year; and (iii) the dollar value of any dividends or other earnings paid on stock or option awards in the covered fiscal year prior to the vesting date that are not otherwise included in the total compensation for the covered fiscal year. (d) Represents the average of the aggregate amount of the “Stock Awards” and “Option Awards” columns for the Non-PEO NEOs reported in the Summary Compensation Table for the applicable fiscal year. (e) Amounts reported in this column are derived from the amounts set forth in the following table for the applicable fiscal year:
|
||||||||||||||||||||||||||||||||||||||||||||||||||||||||||||||||||||||||||||||||||||||||||||||||||||||||||||||||||||||||||||||||||||||||||||||||||||||||||||||||||||||||||||||||||||||||||||||||
| [5] | The TSR assumes $100 was invested in our Company for the period from the beginning of the measurement period through the end of the listed measurement period. The TSR is calculated by dividing (i) the difference between the stock price at the end of each measurement period shown and the beginning of the measurement period by (ii) the stock price at the beginning of the measurement period. Historical stock performance is not necessarily indicative of future stock performance. | ||||||||||||||||||||||||||||||||||||||||||||||||||||||||||||||||||||||||||||||||||||||||||||||||||||||||||||||||||||||||||||||||||||||||||||||||||||||||||||||||||||||||||||||||||||||||||||||||
| [6] | Represents the aggregate amount of the “Stock Awards” and “Option Awards” columns for our PEO reported in the Summary Compensation Table for the applicable fiscal year. | ||||||||||||||||||||||||||||||||||||||||||||||||||||||||||||||||||||||||||||||||||||||||||||||||||||||||||||||||||||||||||||||||||||||||||||||||||||||||||||||||||||||||||||||||||||||||||||||||
| [7] | Amounts reported in this column are derived from the amounts set forth in the following table for the applicable fiscal year:
|
||||||||||||||||||||||||||||||||||||||||||||||||||||||||||||||||||||||||||||||||||||||||||||||||||||||||||||||||||||||||||||||||||||||||||||||||||||||||||||||||||||||||||||||||||||||||||||||||
| [8] | Represents the average of the aggregate amount of the “Stock Awards” and “Option Awards” columns for the Non-PEO NEOs reported in the Summary Compensation Table for the applicable fiscal year. | ||||||||||||||||||||||||||||||||||||||||||||||||||||||||||||||||||||||||||||||||||||||||||||||||||||||||||||||||||||||||||||||||||||||||||||||||||||||||||||||||||||||||||||||||||||||||||||||||
| [9] | Amounts reported in this column are derived from the amounts set forth in the following table for the applicable fiscal year:
|
||||||||||||||||||||||||||||||||||||||||||||||||||||||||||||||||||||||||||||||||||||||||||||||||||||||||||||||||||||||||||||||||||||||||||||||||||||||||||||||||||||||||||||||||||||||||||||||||