Shareholder Report
Apr. 30, 2026
USD ($)
Holding
What were the fund costs during the last six months ?
(Based on a hypothetical $10,000 investment)
| Fund (Class) | Costs of a $10,000 investment | Costs paid as a percentage of a $10,000 investment |
| International Dynamic Growth Fund (Class R6/JIJRX) |
$43 | 0.80% |
Fund Statistics
| Fund net assets | $4,608,481,938 |
| Total number of portfolio holdings | 45 |
| Portfolio turnover rate | 44% |
Graphical Representation of Holdings
The tables below show the investment makeup of the fund, representing a percentage of the total net assets of the fund.
Top Ten Holdings
| Taiwan Semiconductor Manufacturing Company, Ltd. | 8.2% |
| SK Hynix, Inc. | 5.5% |
| Fujikura, Ltd. | 5.1% |
| Siemens Energy AG | 5.0% |
| Mitsubishi Heavy Industries, Ltd. | 4.8% |
| Rolls-Royce Holdings PLC | 4.3% |
| Delta Electronics, Inc. | 3.9% |
| Societe Generale SA | 3.8% |
| AstraZeneca PLC | 3.5% |
| ASML Holding NV | 3.2% |
Sector Composition
| Industrials | 35.0% |
| Information technology | 33.7% |
| Financials | 17.6% |
| Health care | 4.9% |
| Materials | 2.9% |
| Real estate | 1.7% |
| Energy | 1.5% |
| Communication services | 1.0% |
| Consumer staples | 0.9% |
| Consumer discretionary | 0.2% |
| Other assets and liabilities, net | 0.6% |
Country Composition
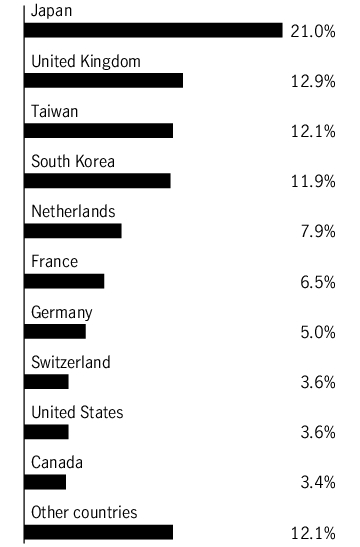
Holdings may not have been held by the fund for the entire period and are subject to change without notice. Portfolio composition is subject to review in accordance with the fund’s investment strategy and may vary in the future. Current and future portfolio holdings are subject to risk and may change at any time.
Top Ten Holdings
| Taiwan Semiconductor Manufacturing Company, Ltd. | 8.2% |
| SK Hynix, Inc. | 5.5% |
| Fujikura, Ltd. | 5.1% |
| Siemens Energy AG | 5.0% |
| Mitsubishi Heavy Industries, Ltd. | 4.8% |
| Rolls-Royce Holdings PLC | 4.3% |
| Delta Electronics, Inc. | 3.9% |
| Societe Generale SA | 3.8% |
| AstraZeneca PLC | 3.5% |
| ASML Holding NV | 3.2% |
What were the fund costs during the last six months ?
(Based on a hypothetical $10,000 investment)
| Fund (Class) | Costs of a $10,000 investment | Costs paid as a percentage of a $10,000 investment |
| International Dynamic Growth Fund (Class NAV) |
$43 | 0.80% |
Fund Statistics
| Fund net assets | $4,608,481,938 |
| Total number of portfolio holdings | 45 |
| Portfolio turnover rate | 44% |
Graphical Representation of Holdings
The tables below show the investment makeup of the fund, representing a percentage of the total net assets of the fund.
Top Ten Holdings
| Taiwan Semiconductor Manufacturing Company, Ltd. | 8.2% |
| SK Hynix, Inc. | 5.5% |
| Fujikura, Ltd. | 5.1% |
| Siemens Energy AG | 5.0% |
| Mitsubishi Heavy Industries, Ltd. | 4.8% |
| Rolls-Royce Holdings PLC | 4.3% |
| Delta Electronics, Inc. | 3.9% |
| Societe Generale SA | 3.8% |
| AstraZeneca PLC | 3.5% |
| ASML Holding NV | 3.2% |
Sector Composition
| Industrials | 35.0% |
| Information technology | 33.7% |
| Financials | 17.6% |
| Health care | 4.9% |
| Materials | 2.9% |
| Real estate | 1.7% |
| Energy | 1.5% |
| Communication services | 1.0% |
| Consumer staples | 0.9% |
| Consumer discretionary | 0.2% |
| Other assets and liabilities, net | 0.6% |
Country Composition

Holdings may not have been held by the fund for the entire period and are subject to change without notice. Portfolio composition is subject to review in accordance with the fund’s investment strategy and may vary in the future. Current and future portfolio holdings are subject to risk and may change at any time.
Top Ten Holdings
| Taiwan Semiconductor Manufacturing Company, Ltd. | 8.2% |
| SK Hynix, Inc. | 5.5% |
| Fujikura, Ltd. | 5.1% |
| Siemens Energy AG | 5.0% |
| Mitsubishi Heavy Industries, Ltd. | 4.8% |
| Rolls-Royce Holdings PLC | 4.3% |
| Delta Electronics, Inc. | 3.9% |
| Societe Generale SA | 3.8% |
| AstraZeneca PLC | 3.5% |
| ASML Holding NV | 3.2% |
What were the fund costs during the last six months ?
(Based on a hypothetical $10,000 investment)
| Fund (Class) | Costs of a $10,000 investment | Costs paid as a percentage of a $10,000 investment |
| International Dynamic Growth Fund (Class I/JIJIX) |
$49 | 0.91% |
Fund Statistics
| Fund net assets | $4,608,481,938 |
| Total number of portfolio holdings | 45 |
| Portfolio turnover rate | 44% |
Graphical Representation of Holdings
The tables below show the investment makeup of the fund, representing a percentage of the total net assets of the fund.
Top Ten Holdings
| Taiwan Semiconductor Manufacturing Company, Ltd. | 8.2% |
| SK Hynix, Inc. | 5.5% |
| Fujikura, Ltd. | 5.1% |
| Siemens Energy AG | 5.0% |
| Mitsubishi Heavy Industries, Ltd. | 4.8% |
| Rolls-Royce Holdings PLC | 4.3% |
| Delta Electronics, Inc. | 3.9% |
| Societe Generale SA | 3.8% |
| AstraZeneca PLC | 3.5% |
| ASML Holding NV | 3.2% |
Sector Composition
| Industrials | 35.0% |
| Information technology | 33.7% |
| Financials | 17.6% |
| Health care | 4.9% |
| Materials | 2.9% |
| Real estate | 1.7% |
| Energy | 1.5% |
| Communication services | 1.0% |
| Consumer staples | 0.9% |
| Consumer discretionary | 0.2% |
| Other assets and liabilities, net | 0.6% |
Country Composition

Holdings may not have been held by the fund for the entire period and are subject to change without notice. Portfolio composition is subject to review in accordance with the fund’s investment strategy and may vary in the future. Current and future portfolio holdings are subject to risk and may change at any time.
Top Ten Holdings
| Taiwan Semiconductor Manufacturing Company, Ltd. | 8.2% |
| SK Hynix, Inc. | 5.5% |
| Fujikura, Ltd. | 5.1% |
| Siemens Energy AG | 5.0% |
| Mitsubishi Heavy Industries, Ltd. | 4.8% |
| Rolls-Royce Holdings PLC | 4.3% |
| Delta Electronics, Inc. | 3.9% |
| Societe Generale SA | 3.8% |
| AstraZeneca PLC | 3.5% |
| ASML Holding NV | 3.2% |
What were the fund costs during the last six months ?
(Based on a hypothetical $10,000 investment)
| Fund (Class) | Costs of a $10,000 investment | Costs paid as a percentage of a $10,000 investment |
| International Dynamic Growth Fund (Class C/JIJCX) |
$102 | 1.91% |
Fund Statistics
| Fund net assets | $4,608,481,938 |
| Total number of portfolio holdings | 45 |
| Portfolio turnover rate | 44% |
Graphical Representation of Holdings
The tables below show the investment makeup of the fund, representing a percentage of the total net assets of the fund.
Top Ten Holdings
| Taiwan Semiconductor Manufacturing Company, Ltd. | 8.2% |
| SK Hynix, Inc. | 5.5% |
| Fujikura, Ltd. | 5.1% |
| Siemens Energy AG | 5.0% |
| Mitsubishi Heavy Industries, Ltd. | 4.8% |
| Rolls-Royce Holdings PLC | 4.3% |
| Delta Electronics, Inc. | 3.9% |
| Societe Generale SA | 3.8% |
| AstraZeneca PLC | 3.5% |
| ASML Holding NV | 3.2% |
Sector Composition
| Industrials | 35.0% |
| Information technology | 33.7% |
| Financials | 17.6% |
| Health care | 4.9% |
| Materials | 2.9% |
| Real estate | 1.7% |
| Energy | 1.5% |
| Communication services | 1.0% |
| Consumer staples | 0.9% |
| Consumer discretionary | 0.2% |
| Other assets and liabilities, net | 0.6% |
Country Composition

Holdings may not have been held by the fund for the entire period and are subject to change without notice. Portfolio composition is subject to review in accordance with the fund’s investment strategy and may vary in the future. Current and future portfolio holdings are subject to risk and may change at any time.
Top Ten Holdings
| Taiwan Semiconductor Manufacturing Company, Ltd. | 8.2% |
| SK Hynix, Inc. | 5.5% |
| Fujikura, Ltd. | 5.1% |
| Siemens Energy AG | 5.0% |
| Mitsubishi Heavy Industries, Ltd. | 4.8% |
| Rolls-Royce Holdings PLC | 4.3% |
| Delta Electronics, Inc. | 3.9% |
| Societe Generale SA | 3.8% |
| AstraZeneca PLC | 3.5% |
| ASML Holding NV | 3.2% |
What were the fund costs during the last six months ?
(Based on a hypothetical $10,000 investment)
| Fund (Class) | Costs of a $10,000 investment | Costs paid as a percentage of a $10,000 investment |
| International Dynamic Growth Fund (Class A/JIJAX) |
$62 | 1.16% |
Fund Statistics
| Fund net assets | $4,608,481,938 |
| Total number of portfolio holdings | 45 |
| Portfolio turnover rate | 44% |
Graphical Representation of Holdings
The tables below show the investment makeup of the fund, representing a percentage of the total net assets of the fund.
Top Ten Holdings
| Taiwan Semiconductor Manufacturing Company, Ltd. | 8.2% |
| SK Hynix, Inc. | 5.5% |
| Fujikura, Ltd. | 5.1% |
| Siemens Energy AG | 5.0% |
| Mitsubishi Heavy Industries, Ltd. | 4.8% |
| Rolls-Royce Holdings PLC | 4.3% |
| Delta Electronics, Inc. | 3.9% |
| Societe Generale SA | 3.8% |
| AstraZeneca PLC | 3.5% |
| ASML Holding NV | 3.2% |
Sector Composition
| Industrials | 35.0% |
| Information technology | 33.7% |
| Financials | 17.6% |
| Health care | 4.9% |
| Materials | 2.9% |
| Real estate | 1.7% |
| Energy | 1.5% |
| Communication services | 1.0% |
| Consumer staples | 0.9% |
| Consumer discretionary | 0.2% |
| Other assets and liabilities, net | 0.6% |
Country Composition

Holdings may not have been held by the fund for the entire period and are subject to change without notice. Portfolio composition is subject to review in accordance with the fund’s investment strategy and may vary in the future. Current and future portfolio holdings are subject to risk and may change at any time.
Top Ten Holdings
| Taiwan Semiconductor Manufacturing Company, Ltd. | 8.2% |
| SK Hynix, Inc. | 5.5% |
| Fujikura, Ltd. | 5.1% |
| Siemens Energy AG | 5.0% |
| Mitsubishi Heavy Industries, Ltd. | 4.8% |
| Rolls-Royce Holdings PLC | 4.3% |
| Delta Electronics, Inc. | 3.9% |
| Societe Generale SA | 3.8% |
| AstraZeneca PLC | 3.5% |
| ASML Holding NV | 3.2% |
What were the fund costs during the last six months ?
(Based on a hypothetical $10,000 investment)
| Fund (Class) | Costs of a $10,000 investment | Costs paid as a percentage of a $10,000 investment |
| Global Environmental Opportunities Fund (Class A/JABZX) |
$62 | 1.20% |
Fund Statistics
| Fund net assets | $57,785,988 |
| Total number of portfolio holdings | 43 |
| Portfolio turnover rate | 34% |
Graphical Representation of Holdings
The tables below show the investment makeup of the fund, representing a percentage of the total net assets of the fund.
Top Ten Holdings
| Taiwan Semiconductor Manufacturing Company, Ltd. | 4.9% |
| Schneider Electric SE | 3.9% |
| ASML Holding NV | 3.6% |
| Cadence Design Systems, Inc. | 3.2% |
| Eaton Corp. PLC | 3.1% |
| Hitachi, Ltd. | 3.0% |
| Applied Materials, Inc. | 2.9% |
| Trane Technologies PLC | 2.9% |
| Quanta Services, Inc. | 2.7% |
| Siemens AG | 2.6% |
Sector Composition
| Industrials | 43.1% |
| Information technology | 33.4% |
| Utilities | 9.0% |
| Materials | 4.3% |
| Health care | 2.0% |
| Real estate | 1.3% |
| Other assets and liabilities, net | 6.9% |
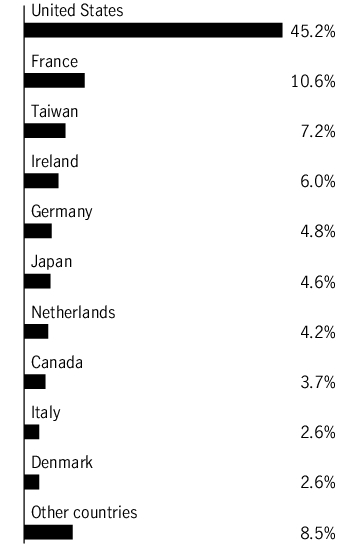
Country Composition

Holdings may not have been held by the fund for the entire period and are subject to change without notice. Portfolio composition is subject to review in accordance with the fund’s investment strategy and may vary in the future. Current and future portfolio holdings are subject to risk and may change at any time.
Top Ten Holdings
| Taiwan Semiconductor Manufacturing Company, Ltd. | 4.9% |
| Schneider Electric SE | 3.9% |
| ASML Holding NV | 3.6% |
| Cadence Design Systems, Inc. | 3.2% |
| Eaton Corp. PLC | 3.1% |
| Hitachi, Ltd. | 3.0% |
| Applied Materials, Inc. | 2.9% |
| Trane Technologies PLC | 2.9% |
| Quanta Services, Inc. | 2.7% |
| Siemens AG | 2.6% |
What were the fund costs during the last six months ?
(Based on a hypothetical $10,000 investment)
| Fund (Class) | Costs of a $10,000 investment | Costs paid as a percentage of a $10,000 investment |
| Global Environmental Opportunities Fund (Class C/JABYX) |
$100 | 1.95% |
Fund Statistics
| Fund net assets | $57,785,988 |
| Total number of portfolio holdings | 43 |
| Portfolio turnover rate | 34% |
Graphical Representation of Holdings
The tables below show the investment makeup of the fund, representing a percentage of the total net assets of the fund.
Top Ten Holdings
| Taiwan Semiconductor Manufacturing Company, Ltd. | 4.9% |
| Schneider Electric SE | 3.9% |
| ASML Holding NV | 3.6% |
| Cadence Design Systems, Inc. | 3.2% |
| Eaton Corp. PLC | 3.1% |
| Hitachi, Ltd. | 3.0% |
| Applied Materials, Inc. | 2.9% |
| Trane Technologies PLC | 2.9% |
| Quanta Services, Inc. | 2.7% |
| Siemens AG | 2.6% |
Sector Composition
| Industrials | 43.1% |
| Information technology | 33.4% |
| Utilities | 9.0% |
| Materials | 4.3% |
| Health care | 2.0% |
| Real estate | 1.3% |
| Other assets and liabilities, net | 6.9% |
Country Composition

Holdings may not have been held by the fund for the entire period and are subject to change without notice. Portfolio composition is subject to review in accordance with the fund’s investment strategy and may vary in the future. Current and future portfolio holdings are subject to risk and may change at any time.
Top Ten Holdings
| Taiwan Semiconductor Manufacturing Company, Ltd. | 4.9% |
| Schneider Electric SE | 3.9% |
| ASML Holding NV | 3.6% |
| Cadence Design Systems, Inc. | 3.2% |
| Eaton Corp. PLC | 3.1% |
| Hitachi, Ltd. | 3.0% |
| Applied Materials, Inc. | 2.9% |
| Trane Technologies PLC | 2.9% |
| Quanta Services, Inc. | 2.7% |
| Siemens AG | 2.6% |
What were the fund costs during the last six months ?
(Based on a hypothetical $10,000 investment)
| Fund (Class) | Costs of a $10,000 investment | Costs paid as a percentage of a $10,000 investment |
| Global Environmental Opportunities Fund (Class I/JABVX) |
$49 | 0.95% |
Fund Statistics
| Fund net assets | $57,785,988 |
| Total number of portfolio holdings | 43 |
| Portfolio turnover rate | 34% |
Graphical Representation of Holdings
The tables below show the investment makeup of the fund, representing a percentage of the total net assets of the fund.
Top Ten Holdings
| Taiwan Semiconductor Manufacturing Company, Ltd. | 4.9% |
| Schneider Electric SE | 3.9% |
| ASML Holding NV | 3.6% |
| Cadence Design Systems, Inc. | 3.2% |
| Eaton Corp. PLC | 3.1% |
| Hitachi, Ltd. | 3.0% |
| Applied Materials, Inc. | 2.9% |
| Trane Technologies PLC | 2.9% |
| Quanta Services, Inc. | 2.7% |
| Siemens AG | 2.6% |
Sector Composition
| Industrials | 43.1% |
| Information technology | 33.4% |
| Utilities | 9.0% |
| Materials | 4.3% |
| Health care | 2.0% |
| Real estate | 1.3% |
| Other assets and liabilities, net | 6.9% |
Country Composition
Holdings may not have been held by the fund for the entire period and are subject to change without notice. Portfolio composition is subject to review in accordance with the fund’s investment strategy and may vary in the future. Current and future portfolio holdings are subject to risk and may change at any time.
Top Ten Holdings
| Taiwan Semiconductor Manufacturing Company, Ltd. | 4.9% |
| Schneider Electric SE | 3.9% |
| ASML Holding NV | 3.6% |
| Cadence Design Systems, Inc. | 3.2% |
| Eaton Corp. PLC | 3.1% |
| Hitachi, Ltd. | 3.0% |
| Applied Materials, Inc. | 2.9% |
| Trane Technologies PLC | 2.9% |
| Quanta Services, Inc. | 2.7% |
| Siemens AG | 2.6% |
What were the fund costs during the last six months ?
(Based on a hypothetical $10,000 investment)
| Fund (Class) | Costs of a $10,000 investment | Costs paid as a percentage of a $10,000 investment |
| Global Environmental Opportunities Fund (Class R6/JACDX) |
$44 | 0.85% |
Fund Statistics
| Fund net assets | $57,785,988 |
| Total number of portfolio holdings | 43 |
| Portfolio turnover rate | 34% |
Graphical Representation of Holdings
The tables below show the investment makeup of the fund, representing a percentage of the total net assets of the fund.
Top Ten Holdings
| Taiwan Semiconductor Manufacturing Company, Ltd. | 4.9% |
| Schneider Electric SE | 3.9% |
| ASML Holding NV | 3.6% |
| Cadence Design Systems, Inc. | 3.2% |
| Eaton Corp. PLC | 3.1% |
| Hitachi, Ltd. | 3.0% |
| Applied Materials, Inc. | 2.9% |
| Trane Technologies PLC | 2.9% |
| Quanta Services, Inc. | 2.7% |
| Siemens AG | 2.6% |
Sector Composition
| Industrials | 43.1% |
| Information technology | 33.4% |
| Utilities | 9.0% |
| Materials | 4.3% |
| Health care | 2.0% |
| Real estate | 1.3% |
| Other assets and liabilities, net | 6.9% |
Country Composition

Holdings may not have been held by the fund for the entire period and are subject to change without notice. Portfolio composition is subject to review in accordance with the fund’s investment strategy and may vary in the future. Current and future portfolio holdings are subject to risk and may change at any time.
Top Ten Holdings
| Taiwan Semiconductor Manufacturing Company, Ltd. | 4.9% |
| Schneider Electric SE | 3.9% |
| ASML Holding NV | 3.6% |
| Cadence Design Systems, Inc. | 3.2% |
| Eaton Corp. PLC | 3.1% |
| Hitachi, Ltd. | 3.0% |
| Applied Materials, Inc. | 2.9% |
| Trane Technologies PLC | 2.9% |
| Quanta Services, Inc. | 2.7% |
| Siemens AG | 2.6% |