Shareholder Report
Apr. 30, 2026
USD ($)
Holding
What were the fund costs during the last six months ?
(Based on a hypothetical $10,000 investment)
| Fund (Class) | Costs of a $10,000 investment | Costs paid as a percentage of a $10,000 investment |
| Fundamental Large Cap Core Fund (Class R6/JLCWX) |
$33 | 0.65% |
Fund Statistics
| Fund net assets | $6,296,222,716 |
| Total number of portfolio holdings | 48 |
| Portfolio turnover rate | 29% |
Graphical Representation of Holdings
The tables below show the investment makeup of the fund, representing a percentage of the total net assets of the fund.
Top Ten Holdings
| Amazon.com, Inc. | 9.1% |
| Alphabet, Inc., Class A | 8.7% |
| Microsoft Corp. | 7.0% |
| Taiwan Semiconductor Manufacturing Company, Ltd., ADR | 4.6% |
| KKR & Company, Inc. | 4.1% |
| Cheniere Energy, Inc. | 4.1% |
| Meta Platforms, Inc., Class A | 3.7% |
| Broadcom, Inc. | 3.0% |
| Lennar Corp., Class A | 2.9% |
| Elevance Health, Inc. | 2.9% |
Sector Composition
| Information technology | 28.8% |
| Consumer discretionary | 15.7% |
| Communication services | 15.1% |
| Health care | 13.1% |
| Financials | 8.4% |
| Industrials | 7.8% |
| Energy | 4.1% |
| Real estate | 3.4% |
| Materials | 1.1% |
| Consumer staples | 0.6% |
| Short-term investments and other | 1.9% |
Holdings may not have been held by the fund for the entire period and are subject to change without notice. Portfolio composition is subject to review in accordance with the fund’s investment strategy and may vary in the future. Current and future portfolio holdings are subject to risk and may change at any time.
Top Ten Holdings
| Amazon.com, Inc. | 9.1% |
| Alphabet, Inc., Class A | 8.7% |
| Microsoft Corp. | 7.0% |
| Taiwan Semiconductor Manufacturing Company, Ltd., ADR | 4.6% |
| KKR & Company, Inc. | 4.1% |
| Cheniere Energy, Inc. | 4.1% |
| Meta Platforms, Inc., Class A | 3.7% |
| Broadcom, Inc. | 3.0% |
| Lennar Corp., Class A | 2.9% |
| Elevance Health, Inc. | 2.9% |
What were the fund costs during the last six months ?
(Based on a hypothetical $10,000 investment)
| Fund (Class) | Costs of a $10,000 investment | Costs paid as a percentage of a $10,000 investment |
| Fundamental Large Cap Core Fund (Class R5/JLCVX) |
$35 | 0.70% |
Fund Statistics
| Fund net assets | $6,296,222,716 |
| Total number of portfolio holdings | 48 |
| Portfolio turnover rate | 29% |
Graphical Representation of Holdings
The tables below show the investment makeup of the fund, representing a percentage of the total net assets of the fund.
Top Ten Holdings
| Amazon.com, Inc. | 9.1% |
| Alphabet, Inc., Class A | 8.7% |
| Microsoft Corp. | 7.0% |
| Taiwan Semiconductor Manufacturing Company, Ltd., ADR | 4.6% |
| KKR & Company, Inc. | 4.1% |
| Cheniere Energy, Inc. | 4.1% |
| Meta Platforms, Inc., Class A | 3.7% |
| Broadcom, Inc. | 3.0% |
| Lennar Corp., Class A | 2.9% |
| Elevance Health, Inc. | 2.9% |
Sector Composition
| Information technology | 28.8% |
| Consumer discretionary | 15.7% |
| Communication services | 15.1% |
| Health care | 13.1% |
| Financials | 8.4% |
| Industrials | 7.8% |
| Energy | 4.1% |
| Real estate | 3.4% |
| Materials | 1.1% |
| Consumer staples | 0.6% |
| Short-term investments and other | 1.9% |
Holdings may not have been held by the fund for the entire period and are subject to change without notice. Portfolio composition is subject to review in accordance with the fund’s investment strategy and may vary in the future. Current and future portfolio holdings are subject to risk and may change at any time.
Top Ten Holdings
| Amazon.com, Inc. | 9.1% |
| Alphabet, Inc., Class A | 8.7% |
| Microsoft Corp. | 7.0% |
| Taiwan Semiconductor Manufacturing Company, Ltd., ADR | 4.6% |
| KKR & Company, Inc. | 4.1% |
| Cheniere Energy, Inc. | 4.1% |
| Meta Platforms, Inc., Class A | 3.7% |
| Broadcom, Inc. | 3.0% |
| Lennar Corp., Class A | 2.9% |
| Elevance Health, Inc. | 2.9% |
What were the fund costs during the last six months ?
(Based on a hypothetical $10,000 investment)
| Fund (Class) | Costs of a $10,000 investment | Costs paid as a percentage of a $10,000 investment |
| Fundamental Large Cap Core Fund (Class R4/JLCFX) |
$45 | 0.90% |
Fund Statistics
| Fund net assets | $6,296,222,716 |
| Total number of portfolio holdings | 48 |
| Portfolio turnover rate | 29% |
Graphical Representation of Holdings
The tables below show the investment makeup of the fund, representing a percentage of the total net assets of the fund.
Top Ten Holdings
| Amazon.com, Inc. | 9.1% |
| Alphabet, Inc., Class A | 8.7% |
| Microsoft Corp. | 7.0% |
| Taiwan Semiconductor Manufacturing Company, Ltd., ADR | 4.6% |
| KKR & Company, Inc. | 4.1% |
| Cheniere Energy, Inc. | 4.1% |
| Meta Platforms, Inc., Class A | 3.7% |
| Broadcom, Inc. | 3.0% |
| Lennar Corp., Class A | 2.9% |
| Elevance Health, Inc. | 2.9% |
Sector Composition
| Information technology | 28.8% |
| Consumer discretionary | 15.7% |
| Communication services | 15.1% |
| Health care | 13.1% |
| Financials | 8.4% |
| Industrials | 7.8% |
| Energy | 4.1% |
| Real estate | 3.4% |
| Materials | 1.1% |
| Consumer staples | 0.6% |
| Short-term investments and other | 1.9% |
Holdings may not have been held by the fund for the entire period and are subject to change without notice. Portfolio composition is subject to review in accordance with the fund’s investment strategy and may vary in the future. Current and future portfolio holdings are subject to risk and may change at any time.
Top Ten Holdings
| Amazon.com, Inc. | 9.1% |
| Alphabet, Inc., Class A | 8.7% |
| Microsoft Corp. | 7.0% |
| Taiwan Semiconductor Manufacturing Company, Ltd., ADR | 4.6% |
| KKR & Company, Inc. | 4.1% |
| Cheniere Energy, Inc. | 4.1% |
| Meta Platforms, Inc., Class A | 3.7% |
| Broadcom, Inc. | 3.0% |
| Lennar Corp., Class A | 2.9% |
| Elevance Health, Inc. | 2.9% |
What were the fund costs during the last six months ?
(Based on a hypothetical $10,000 investment)
| Fund (Class) | Costs of a $10,000 investment | Costs paid as a percentage of a $10,000 investment |
| Fundamental Large Cap Core Fund (Class R2/JLCYX) |
$57 | 1.13% |
Fund Statistics
| Fund net assets | $6,296,222,716 |
| Total number of portfolio holdings | 48 |
| Portfolio turnover rate | 29% |
Graphical Representation of Holdings
The tables below show the investment makeup of the fund, representing a percentage of the total net assets of the fund.
Top Ten Holdings
| Amazon.com, Inc. | 9.1% |
| Alphabet, Inc., Class A | 8.7% |
| Microsoft Corp. | 7.0% |
| Taiwan Semiconductor Manufacturing Company, Ltd., ADR | 4.6% |
| KKR & Company, Inc. | 4.1% |
| Cheniere Energy, Inc. | 4.1% |
| Meta Platforms, Inc., Class A | 3.7% |
| Broadcom, Inc. | 3.0% |
| Lennar Corp., Class A | 2.9% |
| Elevance Health, Inc. | 2.9% |
Sector Composition
| Information technology | 28.8% |
| Consumer discretionary | 15.7% |
| Communication services | 15.1% |
| Health care | 13.1% |
| Financials | 8.4% |
| Industrials | 7.8% |
| Energy | 4.1% |
| Real estate | 3.4% |
| Materials | 1.1% |
| Consumer staples | 0.6% |
| Short-term investments and other | 1.9% |
Holdings may not have been held by the fund for the entire period and are subject to change without notice. Portfolio composition is subject to review in accordance with the fund’s investment strategy and may vary in the future. Current and future portfolio holdings are subject to risk and may change at any time.
Top Ten Holdings
| Amazon.com, Inc. | 9.1% |
| Alphabet, Inc., Class A | 8.7% |
| Microsoft Corp. | 7.0% |
| Taiwan Semiconductor Manufacturing Company, Ltd., ADR | 4.6% |
| KKR & Company, Inc. | 4.1% |
| Cheniere Energy, Inc. | 4.1% |
| Meta Platforms, Inc., Class A | 3.7% |
| Broadcom, Inc. | 3.0% |
| Lennar Corp., Class A | 2.9% |
| Elevance Health, Inc. | 2.9% |
What were the fund costs during the last six months ?
(Based on a hypothetical $10,000 investment)
| Fund (Class) | Costs of a $10,000 investment | Costs paid as a percentage of a $10,000 investment |
| Fundamental Large Cap Core Fund (Class NAV/JLCNX) |
$33 | 0.65% |
Fund Statistics
| Fund net assets | $6,296,222,716 |
| Total number of portfolio holdings | 48 |
| Portfolio turnover rate | 29% |
Graphical Representation of Holdings
The tables below show the investment makeup of the fund, representing a percentage of the total net assets of the fund.
Top Ten Holdings
| Amazon.com, Inc. | 9.1% |
| Alphabet, Inc., Class A | 8.7% |
| Microsoft Corp. | 7.0% |
| Taiwan Semiconductor Manufacturing Company, Ltd., ADR | 4.6% |
| KKR & Company, Inc. | 4.1% |
| Cheniere Energy, Inc. | 4.1% |
| Meta Platforms, Inc., Class A | 3.7% |
| Broadcom, Inc. | 3.0% |
| Lennar Corp., Class A | 2.9% |
| Elevance Health, Inc. | 2.9% |
Sector Composition
| Information technology | 28.8% |
| Consumer discretionary | 15.7% |
| Communication services | 15.1% |
| Health care | 13.1% |
| Financials | 8.4% |
| Industrials | 7.8% |
| Energy | 4.1% |
| Real estate | 3.4% |
| Materials | 1.1% |
| Consumer staples | 0.6% |
| Short-term investments and other | 1.9% |
Holdings may not have been held by the fund for the entire period and are subject to change without notice. Portfolio composition is subject to review in accordance with the fund’s investment strategy and may vary in the future. Current and future portfolio holdings are subject to risk and may change at any time.
Top Ten Holdings
| Amazon.com, Inc. | 9.1% |
| Alphabet, Inc., Class A | 8.7% |
| Microsoft Corp. | 7.0% |
| Taiwan Semiconductor Manufacturing Company, Ltd., ADR | 4.6% |
| KKR & Company, Inc. | 4.1% |
| Cheniere Energy, Inc. | 4.1% |
| Meta Platforms, Inc., Class A | 3.7% |
| Broadcom, Inc. | 3.0% |
| Lennar Corp., Class A | 2.9% |
| Elevance Health, Inc. | 2.9% |
What were the fund costs during the last six months ?
(Based on a hypothetical $10,000 investment)
| Fund (Class) | Costs of a $10,000 investment | Costs paid as a percentage of a $10,000 investment |
| Fundamental Large Cap Core Fund (Class I/JLVIX) |
$38 | 0.76% |
Fund Statistics
| Fund net assets | $6,296,222,716 |
| Total number of portfolio holdings | 48 |
| Portfolio turnover rate | 29% |
Graphical Representation of Holdings
The tables below show the investment makeup of the fund, representing a percentage of the total net assets of the fund.
Top Ten Holdings
| Amazon.com, Inc. | 9.1% |
| Alphabet, Inc., Class A | 8.7% |
| Microsoft Corp. | 7.0% |
| Taiwan Semiconductor Manufacturing Company, Ltd., ADR | 4.6% |
| KKR & Company, Inc. | 4.1% |
| Cheniere Energy, Inc. | 4.1% |
| Meta Platforms, Inc., Class A | 3.7% |
| Broadcom, Inc. | 3.0% |
| Lennar Corp., Class A | 2.9% |
| Elevance Health, Inc. | 2.9% |
Sector Composition
| Information technology | 28.8% |
| Consumer discretionary | 15.7% |
| Communication services | 15.1% |
| Health care | 13.1% |
| Financials | 8.4% |
| Industrials | 7.8% |
| Energy | 4.1% |
| Real estate | 3.4% |
| Materials | 1.1% |
| Consumer staples | 0.6% |
| Short-term investments and other | 1.9% |
Holdings may not have been held by the fund for the entire period and are subject to change without notice. Portfolio composition is subject to review in accordance with the fund’s investment strategy and may vary in the future. Current and future portfolio holdings are subject to risk and may change at any time.
Top Ten Holdings
| Amazon.com, Inc. | 9.1% |
| Alphabet, Inc., Class A | 8.7% |
| Microsoft Corp. | 7.0% |
| Taiwan Semiconductor Manufacturing Company, Ltd., ADR | 4.6% |
| KKR & Company, Inc. | 4.1% |
| Cheniere Energy, Inc. | 4.1% |
| Meta Platforms, Inc., Class A | 3.7% |
| Broadcom, Inc. | 3.0% |
| Lennar Corp., Class A | 2.9% |
| Elevance Health, Inc. | 2.9% |
What were the fund costs during the last six months ?
(Based on a hypothetical $10,000 investment)
| Fund (Class) | Costs of a $10,000 investment | Costs paid as a percentage of a $10,000 investment |
| Fundamental Large Cap Core Fund (Class C/JHLVX) |
$88 | 1.76% |
Fund Statistics
| Fund net assets | $6,296,222,716 |
| Total number of portfolio holdings | 48 |
| Portfolio turnover rate | 29% |
Graphical Representation of Holdings
The tables below show the investment makeup of the fund, representing a percentage of the total net assets of the fund.
Top Ten Holdings
| Amazon.com, Inc. | 9.1% |
| Alphabet, Inc., Class A | 8.7% |
| Microsoft Corp. | 7.0% |
| Taiwan Semiconductor Manufacturing Company, Ltd., ADR | 4.6% |
| KKR & Company, Inc. | 4.1% |
| Cheniere Energy, Inc. | 4.1% |
| Meta Platforms, Inc., Class A | 3.7% |
| Broadcom, Inc. | 3.0% |
| Lennar Corp., Class A | 2.9% |
| Elevance Health, Inc. | 2.9% |
Sector Composition
| Information technology | 28.8% |
| Consumer discretionary | 15.7% |
| Communication services | 15.1% |
| Health care | 13.1% |
| Financials | 8.4% |
| Industrials | 7.8% |
| Energy | 4.1% |
| Real estate | 3.4% |
| Materials | 1.1% |
| Consumer staples | 0.6% |
| Short-term investments and other | 1.9% |
Holdings may not have been held by the fund for the entire period and are subject to change without notice. Portfolio composition is subject to review in accordance with the fund’s investment strategy and may vary in the future. Current and future portfolio holdings are subject to risk and may change at any time.
Top Ten Holdings
| Amazon.com, Inc. | 9.1% |
| Alphabet, Inc., Class A | 8.7% |
| Microsoft Corp. | 7.0% |
| Taiwan Semiconductor Manufacturing Company, Ltd., ADR | 4.6% |
| KKR & Company, Inc. | 4.1% |
| Cheniere Energy, Inc. | 4.1% |
| Meta Platforms, Inc., Class A | 3.7% |
| Broadcom, Inc. | 3.0% |
| Lennar Corp., Class A | 2.9% |
| Elevance Health, Inc. | 2.9% |
What were the fund costs during the last six months ?
(Based on a hypothetical $10,000 investment)
| Fund (Class) | Costs of a $10,000 investment | Costs paid as a percentage of a $10,000 investment |
| Fundamental Large Cap Core Fund (Class A/TAGRX) |
$49 | 0.98% |
Fund Statistics
| Fund net assets | $6,296,222,716 |
| Total number of portfolio holdings | 48 |
| Portfolio turnover rate | 29% |
Graphical Representation of Holdings
The tables below show the investment makeup of the fund, representing a percentage of the total net assets of the fund.
Top Ten Holdings
| Amazon.com, Inc. | 9.1% |
| Alphabet, Inc., Class A | 8.7% |
| Microsoft Corp. | 7.0% |
| Taiwan Semiconductor Manufacturing Company, Ltd., ADR | 4.6% |
| KKR & Company, Inc. | 4.1% |
| Cheniere Energy, Inc. | 4.1% |
| Meta Platforms, Inc., Class A | 3.7% |
| Broadcom, Inc. | 3.0% |
| Lennar Corp., Class A | 2.9% |
| Elevance Health, Inc. | 2.9% |
Sector Composition
| Information technology | 28.8% |
| Consumer discretionary | 15.7% |
| Communication services | 15.1% |
| Health care | 13.1% |
| Financials | 8.4% |
| Industrials | 7.8% |
| Energy | 4.1% |
| Real estate | 3.4% |
| Materials | 1.1% |
| Consumer staples | 0.6% |
| Short-term investments and other | 1.9% |
Holdings may not have been held by the fund for the entire period and are subject to change without notice. Portfolio composition is subject to review in accordance with the fund’s investment strategy and may vary in the future. Current and future portfolio holdings are subject to risk and may change at any time.
Top Ten Holdings
| Amazon.com, Inc. | 9.1% |
| Alphabet, Inc., Class A | 8.7% |
| Microsoft Corp. | 7.0% |
| Taiwan Semiconductor Manufacturing Company, Ltd., ADR | 4.6% |
| KKR & Company, Inc. | 4.1% |
| Cheniere Energy, Inc. | 4.1% |
| Meta Platforms, Inc., Class A | 3.7% |
| Broadcom, Inc. | 3.0% |
| Lennar Corp., Class A | 2.9% |
| Elevance Health, Inc. | 2.9% |
What were the fund costs during the last six months ?
(Based on a hypothetical $10,000 investment)
| Fund (Class) | Costs of a $10,000 investment | Costs paid as a percentage of a $10,000 investment |
| Infrastructure Fund (Class A/JEEBX) |
$67 | 1.23% |
Fund Statistics
| Fund net assets | $1,235,698,563 |
| Total number of portfolio holdings | 39 |
| Portfolio turnover rate | 21% |
Graphical Representation of Holdings
The tables below show the investment makeup of the fund, representing a percentage of the total net assets of the fund.
Top Ten Holdings
| Targa Resources Corp. | 4.6% |
| The Williams Companies, Inc. | 3.9% |
| Dominion Energy, Inc. | 3.5% |
| E.ON SE | 3.5% |
| Sempra | 3.5% |
| Cia de Saneamento Basico do Estado de Sao Paulo | 3.4% |
| Engie SA | 3.4% |
| ENN Energy Holdings, Ltd. | 3.2% |
| Atmos Energy Corp. | 3.2% |
| Cheniere Energy, Inc. | 3.2% |
Sector Composition
| Utilities | 61.2% |
| Energy | 11.6% |
| Industrials | 11.6% |
| Communication services | 8.4% |
| Financials | 2.8% |
| Real estate | 0.7% |
| Short-term investments and other | 3.7% |
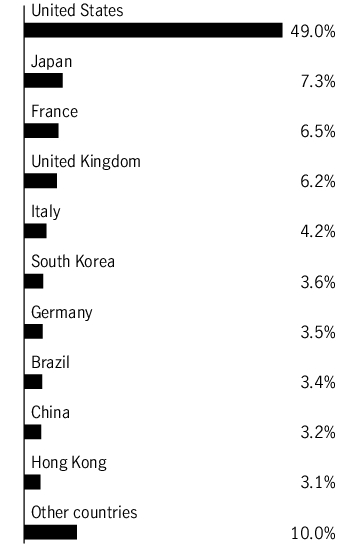
Country Composition

Holdings may not have been held by the fund for the entire period and are subject to change without notice. Portfolio composition is subject to review in accordance with the fund’s investment strategy and may vary in the future. Current and future portfolio holdings are subject to risk and may change at any time.
Top Ten Holdings
| Targa Resources Corp. | 4.6% |
| The Williams Companies, Inc. | 3.9% |
| Dominion Energy, Inc. | 3.5% |
| E.ON SE | 3.5% |
| Sempra | 3.5% |
| Cia de Saneamento Basico do Estado de Sao Paulo | 3.4% |
| Engie SA | 3.4% |
| ENN Energy Holdings, Ltd. | 3.2% |
| Atmos Energy Corp. | 3.2% |
| Cheniere Energy, Inc. | 3.2% |
What were the fund costs during the last six months ?
(Based on a hypothetical $10,000 investment)
| Fund (Class) | Costs of a $10,000 investment | Costs paid as a percentage of a $10,000 investment |
| Infrastructure Fund (Class C/JEEFX) |
$104 | 1.93% |
Fund Statistics
| Fund net assets | $1,235,698,563 |
| Total number of portfolio holdings | 39 |
| Portfolio turnover rate | 21% |
Graphical Representation of Holdings
The tables below show the investment makeup of the fund, representing a percentage of the total net assets of the fund.
Top Ten Holdings
| Targa Resources Corp. | 4.6% |
| The Williams Companies, Inc. | 3.9% |
| Dominion Energy, Inc. | 3.5% |
| E.ON SE | 3.5% |
| Sempra | 3.5% |
| Cia de Saneamento Basico do Estado de Sao Paulo | 3.4% |
| Engie SA | 3.4% |
| ENN Energy Holdings, Ltd. | 3.2% |
| Atmos Energy Corp. | 3.2% |
| Cheniere Energy, Inc. | 3.2% |
Sector Composition
| Utilities | 61.2% |
| Energy | 11.6% |
| Industrials | 11.6% |
| Communication services | 8.4% |
| Financials | 2.8% |
| Real estate | 0.7% |
| Short-term investments and other | 3.7% |
Country Composition

Holdings may not have been held by the fund for the entire period and are subject to change without notice. Portfolio composition is subject to review in accordance with the fund’s investment strategy and may vary in the future. Current and future portfolio holdings are subject to risk and may change at any time.
Top Ten Holdings
| Targa Resources Corp. | 4.6% |
| The Williams Companies, Inc. | 3.9% |
| Dominion Energy, Inc. | 3.5% |
| E.ON SE | 3.5% |
| Sempra | 3.5% |
| Cia de Saneamento Basico do Estado de Sao Paulo | 3.4% |
| Engie SA | 3.4% |
| ENN Energy Holdings, Ltd. | 3.2% |
| Atmos Energy Corp. | 3.2% |
| Cheniere Energy, Inc. | 3.2% |
What were the fund costs during the last six months ?
(Based on a hypothetical $10,000 investment)
| Fund (Class) | Costs of a $10,000 investment | Costs paid as a percentage of a $10,000 investment |
| Infrastructure Fund (Class I/JEEIX) |
$50 | 0.93% |
Fund Statistics
| Fund net assets | $1,235,698,563 |
| Total number of portfolio holdings | 39 |
| Portfolio turnover rate | 21% |
Graphical Representation of Holdings
The tables below show the investment makeup of the fund, representing a percentage of the total net assets of the fund.
Top Ten Holdings
| Targa Resources Corp. | 4.6% |
| The Williams Companies, Inc. | 3.9% |
| Dominion Energy, Inc. | 3.5% |
| E.ON SE | 3.5% |
| Sempra | 3.5% |
| Cia de Saneamento Basico do Estado de Sao Paulo | 3.4% |
| Engie SA | 3.4% |
| ENN Energy Holdings, Ltd. | 3.2% |
| Atmos Energy Corp. | 3.2% |
| Cheniere Energy, Inc. | 3.2% |
Sector Composition
| Utilities | 61.2% |
| Energy | 11.6% |
| Industrials | 11.6% |
| Communication services | 8.4% |
| Financials | 2.8% |
| Real estate | 0.7% |
| Short-term investments and other | 3.7% |
Country Composition

Holdings may not have been held by the fund for the entire period and are subject to change without notice. Portfolio composition is subject to review in accordance with the fund’s investment strategy and may vary in the future. Current and future portfolio holdings are subject to risk and may change at any time.
Top Ten Holdings
| Targa Resources Corp. | 4.6% |
| The Williams Companies, Inc. | 3.9% |
| Dominion Energy, Inc. | 3.5% |
| E.ON SE | 3.5% |
| Sempra | 3.5% |
| Cia de Saneamento Basico do Estado de Sao Paulo | 3.4% |
| Engie SA | 3.4% |
| ENN Energy Holdings, Ltd. | 3.2% |
| Atmos Energy Corp. | 3.2% |
| Cheniere Energy, Inc. | 3.2% |
What were the fund costs during the last six months ?
(Based on a hypothetical $10,000 investment)
| Fund (Class) | Costs of a $10,000 investment | Costs paid as a percentage of a $10,000 investment |
| Infrastructure Fund (Class NAV) |
$44 | 0.82% |
Fund Statistics
| Fund net assets | $1,235,698,563 |
| Total number of portfolio holdings | 39 |
| Portfolio turnover rate | 21% |
Graphical Representation of Holdings
The tables below show the investment makeup of the fund, representing a percentage of the total net assets of the fund.
Top Ten Holdings
| Targa Resources Corp. | 4.6% |
| The Williams Companies, Inc. | 3.9% |
| Dominion Energy, Inc. | 3.5% |
| E.ON SE | 3.5% |
| Sempra | 3.5% |
| Cia de Saneamento Basico do Estado de Sao Paulo | 3.4% |
| Engie SA | 3.4% |
| ENN Energy Holdings, Ltd. | 3.2% |
| Atmos Energy Corp. | 3.2% |
| Cheniere Energy, Inc. | 3.2% |
Sector Composition
| Utilities | 61.2% |
| Energy | 11.6% |
| Industrials | 11.6% |
| Communication services | 8.4% |
| Financials | 2.8% |
| Real estate | 0.7% |
| Short-term investments and other | 3.7% |
Country Composition

Holdings may not have been held by the fund for the entire period and are subject to change without notice. Portfolio composition is subject to review in accordance with the fund’s investment strategy and may vary in the future. Current and future portfolio holdings are subject to risk and may change at any time.
Top Ten Holdings
| Targa Resources Corp. | 4.6% |
| The Williams Companies, Inc. | 3.9% |
| Dominion Energy, Inc. | 3.5% |
| E.ON SE | 3.5% |
| Sempra | 3.5% |
| Cia de Saneamento Basico do Estado de Sao Paulo | 3.4% |
| Engie SA | 3.4% |
| ENN Energy Holdings, Ltd. | 3.2% |
| Atmos Energy Corp. | 3.2% |
| Cheniere Energy, Inc. | 3.2% |
What were the fund costs during the last six months ?
(Based on a hypothetical $10,000 investment)
| Fund (Class) | Costs of a $10,000 investment | Costs paid as a percentage of a $10,000 investment |
| Infrastructure Fund (Class R6/JEEDX) |
$45 | 0.83% |
Fund Statistics
| Fund net assets | $1,235,698,563 |
| Total number of portfolio holdings | 39 |
| Portfolio turnover rate | 21% |
Graphical Representation of Holdings
The tables below show the investment makeup of the fund, representing a percentage of the total net assets of the fund.
Top Ten Holdings
| Targa Resources Corp. | 4.6% |
| The Williams Companies, Inc. | 3.9% |
| Dominion Energy, Inc. | 3.5% |
| E.ON SE | 3.5% |
| Sempra | 3.5% |
| Cia de Saneamento Basico do Estado de Sao Paulo | 3.4% |
| Engie SA | 3.4% |
| ENN Energy Holdings, Ltd. | 3.2% |
| Atmos Energy Corp. | 3.2% |
| Cheniere Energy, Inc. | 3.2% |
Sector Composition
| Utilities | 61.2% |
| Energy | 11.6% |
| Industrials | 11.6% |
| Communication services | 8.4% |
| Financials | 2.8% |
| Real estate | 0.7% |
| Short-term investments and other | 3.7% |
Country Composition
Holdings may not have been held by the fund for the entire period and are subject to change without notice. Portfolio composition is subject to review in accordance with the fund’s investment strategy and may vary in the future. Current and future portfolio holdings are subject to risk and may change at any time.
Top Ten Holdings
| Targa Resources Corp. | 4.6% |
| The Williams Companies, Inc. | 3.9% |
| Dominion Energy, Inc. | 3.5% |
| E.ON SE | 3.5% |
| Sempra | 3.5% |
| Cia de Saneamento Basico do Estado de Sao Paulo | 3.4% |
| Engie SA | 3.4% |
| ENN Energy Holdings, Ltd. | 3.2% |
| Atmos Energy Corp. | 3.2% |
| Cheniere Energy, Inc. | 3.2% |
What were the fund costs during the last six months ?
(Based on a hypothetical $10,000 investment)
| Fund (Class) | Costs of a $10,000 investment | Costs paid as a percentage of a $10,000 investment |
| Small Cap Core Fund (Class R6/JORSX) |
$47 | 0.87% |
Fund Statistics
| Fund net assets | $1,996,894,499 |
| Total number of portfolio holdings | 75 |
| Portfolio turnover rate | 29% |
Graphical Representation of Holdings
The tables below show the investment makeup of the fund, representing a percentage of the total net assets of the fund.
Top Ten Holdings
| SouthState Bank Corp. | 2.1% |
| Ambarella, Inc. | 2.1% |
| Kulicke & Soffa Industries, Inc. | 2.1% |
| The Timken Company | 2.0% |
| Banner Corp. | 2.0% |
| Regal Rexnord Corp. | 1.9% |
| Generac Holdings, Inc. | 1.9% |
| Vicor Corp. | 1.9% |
| Adeia, Inc. | 1.9% |
| Braze, Inc., Class A | 1.8% |
Sector Composition
| Information technology | 25.9% |
| Industrials | 22.2% |
| Health care | 14.1% |
| Financials | 13.1% |
| Consumer discretionary | 9.1% |
| Energy | 3.9% |
| Real estate | 3.5% |
| Consumer staples | 3.5% |
| Materials | 1.7% |
| Communication services | 1.2% |
| Utilities | 1.1% |
| Short-term investments and other | 0.7% |
Holdings may not have been held by the fund for the entire period and are subject to change without notice. Portfolio composition is subject to review in accordance with the fund’s investment strategy and may vary in the future. Current and future portfolio holdings are subject to risk and may change at any time.
Top Ten Holdings
| SouthState Bank Corp. | 2.1% |
| Ambarella, Inc. | 2.1% |
| Kulicke & Soffa Industries, Inc. | 2.1% |
| The Timken Company | 2.0% |
| Banner Corp. | 2.0% |
| Regal Rexnord Corp. | 1.9% |
| Generac Holdings, Inc. | 1.9% |
| Vicor Corp. | 1.9% |
| Adeia, Inc. | 1.9% |
| Braze, Inc., Class A | 1.8% |
What were the fund costs during the last six months ?
(Based on a hypothetical $10,000 investment)
| Fund (Class) | Costs of a $10,000 investment | Costs paid as a percentage of a $10,000 investment |
| Small Cap Core Fund (Class NAV) |
$47 | 0.87% |
Fund Statistics
| Fund net assets | $1,996,894,499 |
| Total number of portfolio holdings | 75 |
| Portfolio turnover rate | 29% |
Graphical Representation of Holdings
The tables below show the investment makeup of the fund, representing a percentage of the total net assets of the fund.
Top Ten Holdings
| SouthState Bank Corp. | 2.1% |
| Ambarella, Inc. | 2.1% |
| Kulicke & Soffa Industries, Inc. | 2.1% |
| The Timken Company | 2.0% |
| Banner Corp. | 2.0% |
| Regal Rexnord Corp. | 1.9% |
| Generac Holdings, Inc. | 1.9% |
| Vicor Corp. | 1.9% |
| Adeia, Inc. | 1.9% |
| Braze, Inc., Class A | 1.8% |
Sector Composition
| Information technology | 25.9% |
| Industrials | 22.2% |
| Health care | 14.1% |
| Financials | 13.1% |
| Consumer discretionary | 9.1% |
| Energy | 3.9% |
| Real estate | 3.5% |
| Consumer staples | 3.5% |
| Materials | 1.7% |
| Communication services | 1.2% |
| Utilities | 1.1% |
| Short-term investments and other | 0.7% |
Holdings may not have been held by the fund for the entire period and are subject to change without notice. Portfolio composition is subject to review in accordance with the fund’s investment strategy and may vary in the future. Current and future portfolio holdings are subject to risk and may change at any time.
Top Ten Holdings
| SouthState Bank Corp. | 2.1% |
| Ambarella, Inc. | 2.1% |
| Kulicke & Soffa Industries, Inc. | 2.1% |
| The Timken Company | 2.0% |
| Banner Corp. | 2.0% |
| Regal Rexnord Corp. | 1.9% |
| Generac Holdings, Inc. | 1.9% |
| Vicor Corp. | 1.9% |
| Adeia, Inc. | 1.9% |
| Braze, Inc., Class A | 1.8% |
What were the fund costs during the last six months ?
(Based on a hypothetical $10,000 investment)
| Fund (Class) | Costs of a $10,000 investment | Costs paid as a percentage of a $10,000 investment |
| Small Cap Core Fund (Class I/JCCIX) |
$53 | 0.98% |
Fund Statistics
| Fund net assets | $1,996,894,499 |
| Total number of portfolio holdings | 75 |
| Portfolio turnover rate | 29% |
Graphical Representation of Holdings
The tables below show the investment makeup of the fund, representing a percentage of the total net assets of the fund.
Top Ten Holdings
| SouthState Bank Corp. | 2.1% |
| Ambarella, Inc. | 2.1% |
| Kulicke & Soffa Industries, Inc. | 2.1% |
| The Timken Company | 2.0% |
| Banner Corp. | 2.0% |
| Regal Rexnord Corp. | 1.9% |
| Generac Holdings, Inc. | 1.9% |
| Vicor Corp. | 1.9% |
| Adeia, Inc. | 1.9% |
| Braze, Inc., Class A | 1.8% |
Sector Composition
| Information technology | 25.9% |
| Industrials | 22.2% |
| Health care | 14.1% |
| Financials | 13.1% |
| Consumer discretionary | 9.1% |
| Energy | 3.9% |
| Real estate | 3.5% |
| Consumer staples | 3.5% |
| Materials | 1.7% |
| Communication services | 1.2% |
| Utilities | 1.1% |
| Short-term investments and other | 0.7% |
Holdings may not have been held by the fund for the entire period and are subject to change without notice. Portfolio composition is subject to review in accordance with the fund’s investment strategy and may vary in the future. Current and future portfolio holdings are subject to risk and may change at any time.
Top Ten Holdings
| SouthState Bank Corp. | 2.1% |
| Ambarella, Inc. | 2.1% |
| Kulicke & Soffa Industries, Inc. | 2.1% |
| The Timken Company | 2.0% |
| Banner Corp. | 2.0% |
| Regal Rexnord Corp. | 1.9% |
| Generac Holdings, Inc. | 1.9% |
| Vicor Corp. | 1.9% |
| Adeia, Inc. | 1.9% |
| Braze, Inc., Class A | 1.8% |
What were the fund costs during the last six months ?
(Based on a hypothetical $10,000 investment)
| Fund (Class) | Costs of a $10,000 investment | Costs paid as a percentage of a $10,000 investment |
| Small Cap Core Fund (Class A/JCCAX) |
$66 | 1.23% |
Fund Statistics
| Fund net assets | $1,996,894,499 |
| Total number of portfolio holdings | 75 |
| Portfolio turnover rate | 29% |
Graphical Representation of Holdings
The tables below show the investment makeup of the fund, representing a percentage of the total net assets of the fund.
Top Ten Holdings
| SouthState Bank Corp. | 2.1% |
| Ambarella, Inc. | 2.1% |
| Kulicke & Soffa Industries, Inc. | 2.1% |
| The Timken Company | 2.0% |
| Banner Corp. | 2.0% |
| Regal Rexnord Corp. | 1.9% |
| Generac Holdings, Inc. | 1.9% |
| Vicor Corp. | 1.9% |
| Adeia, Inc. | 1.9% |
| Braze, Inc., Class A | 1.8% |
Sector Composition
| Information technology | 25.9% |
| Industrials | 22.2% |
| Health care | 14.1% |
| Financials | 13.1% |
| Consumer discretionary | 9.1% |
| Energy | 3.9% |
| Real estate | 3.5% |
| Consumer staples | 3.5% |
| Materials | 1.7% |
| Communication services | 1.2% |
| Utilities | 1.1% |
| Short-term investments and other | 0.7% |
Holdings may not have been held by the fund for the entire period and are subject to change without notice. Portfolio composition is subject to review in accordance with the fund’s investment strategy and may vary in the future. Current and future portfolio holdings are subject to risk and may change at any time.
Top Ten Holdings
| SouthState Bank Corp. | 2.1% |
| Ambarella, Inc. | 2.1% |
| Kulicke & Soffa Industries, Inc. | 2.1% |
| The Timken Company | 2.0% |
| Banner Corp. | 2.0% |
| Regal Rexnord Corp. | 1.9% |
| Generac Holdings, Inc. | 1.9% |
| Vicor Corp. | 1.9% |
| Adeia, Inc. | 1.9% |
| Braze, Inc., Class A | 1.8% |