Pay vs Performance Disclosure - USD ($)
Mar. 31, 2026
Mar. 31, 2025
Mar. 31, 2024
Mar. 31, 2023
Mar. 31, 2022
Fiscal Year | Summary Compensation Table Total to PEO ($) | Compensation Actually Paid to PEO ($) | Average Summary Compensation Table Total for Non-PEO NEOs ($) | Average Compensation Actually Paid for Non-PEO NEOs ($) | Value of Initial Fixed $100 Investment Based On: | Net Income ($ in millions) | Adjusted EPS ($) | |||||||||||||||||||||||||
Company TSR ($) | Peer Group TSR ($) | |||||||||||||||||||||||||||||||
(a) | (b) | (c) | (d) | (e) | (f) | (g) | (h) | (i) | ||||||||||||||||||||||||
| 2026 | 24,213,044 | 48,925,847 | 5,493,345 | 10,568,800 | 456.33 | 136.77 | 4,762 | 39.11 | ||||||||||||||||||||||||
| 2025 | 20,161,714 | 39,170,522 | 4,960,023 | 8,345,708 | 353.49 | 133.68 | 3,295 | 33.05 | ||||||||||||||||||||||||
| 2024 | 18,997,543 | 51,712,052 | 5,203,982 | 8,863,859 | 280.69 | 133.15 | 3,002 | 27.44 | ||||||||||||||||||||||||
| 2023 | 20,221,325 | 38,806,464 | 4,898,008 | 8,070,799 | 185.15 | 114.69 | 3,560 | 26.37 | ||||||||||||||||||||||||
| 2022 | 18,152,082 | 65,282,708 | 4,509,999 | 14,158,069 | 158.27 | 119.10 | 1,114 | 23.26 | ||||||||||||||||||||||||
The non-PEO Named Executive Officers (Non-PEO NEOs) represented in columns (d) and (e) are the following individuals for each of the fiscal years presented:
•FY 2026 – Britt J. Vitalone, Michele Lau, LeAnn B. Smith and Thomas L. Rodgers;
•FY 2025 – Britt J. Vitalone, Michele Lau, LeAnn B. Smith and Thomas L. Rodgers;
•FY 2024 – Britt J. Vitalone, Michele Lau, LeAnn B. Smith, Thomas L. Rodgers, Lori A. Schechter and Nancy Avila;
•FY 2023 – Britt J. Vitalone, Lori A. Schechter, Nancy Avila and LeAnn B. Smith; and
•FY 2022 – Britt J. Vitalone, Lori A. Schechter, Tracy L. Faber and Nancy Avila.
PEO SCT Total to CAP Reconciliation
Fiscal Year | SCT Total ($) | Deductions from SCT Total ($) | Additions to SCT Total ($) | Compensation Actually Paid ($) | ||||||||||
| (i) | (ii) | |||||||||||||
| 2026 | 24,213,044 | 17,201,202 | 41,914,005 | 48,925,847 | ||||||||||
| 2025 | 20,161,714 | 14,500,512 | 33,509,320 | 39,170,522 | ||||||||||
| 2024 | 18,997,543 | 13,500,408 | 46,214,917 | 51,712,052 | ||||||||||
| 2023 | 20,221,325 | 13,000,596 | 31,585,735 | 38,806,464 | ||||||||||
| 2022 | 18,152,082 | 12,250,438 | 59,381,064 | 65,282,708 | ||||||||||
Average Non-PEO NEOs SCT Total to CAP Reconciliation
Fiscal Year | SCT Total ($) | Deductions from SCT Total ($) | Additions to SCT Total ($) | Compensation Actually Paid ($) | ||||||||||
| (i) | (ii) | |||||||||||||
| 2026 | 5,493,345 | 3,375,749 | 8,451,204 | 10,568,800 | ||||||||||
| 2025 | 4,960,023 | 2,988,555 | 6,374,240 | 8,345,708 | ||||||||||
| 2024 | 5,203,982 | 3,317,343 | 6,977,220 | 8,863,859 | ||||||||||
| 2023 | 4,898,008 | 2,664,524 | 5,837,315 | 8,070,799 | ||||||||||
| 2022 | 4,509,999 | 2,326,573 | 11,974,643 | 14,158,069 | ||||||||||
i.Represents the grant date fair value of equity-based awards granted in each fiscal year presented, as shown in the “Stock Awards” column of the SCT.
ii.Represents the value of equity calculated in accordance with Item 402(v) for each fiscal year presented. The assumptions used in calculating the fair value of the equity awards in FY 2026 did not differ in any material respect from the assumptions used to calculate the grant date fair value of the awards as reported in the Summary Compensation Table, except that the fair value calculations of (i) the TSR PSUs granted in FY 2025 and FY 2026 used an estimated volatility between 27% and 28%, as
compared to an estimated volatility between 21% to 23% used to calculate the grant date fair value of such awards, and (ii) the non-TSR PSUs granted in FY 2025 and FY 2026 assumed payouts between 98% and 172%, as compared to the grant date fair value calculations which assumed a payout at target.
PEO Equity Award Detail
| Fiscal Year | Year End Fair Value of Equity Awards Granted in the Year ($) | Change in Fair Value of Outstanding and Unvested Equity Awards Granted in Prior Years ($) | Fair Value as of Vesting Date of Equity Awards Granted and Vested in the Year ($) | Change in Fair Value as of the Vesting Date of Equity Awards Granted in Prior Fiscal Years that Vested in the Fiscal Year ($) | Fair Value at the End of the Prior Year of Equity Awards that Failed to Meet Vesting Conditions in the Year ($) | Value of Dividends or other Earnings Paid on Stock or Option Awards not Otherwise Reflected in Fair Value or Total Compensation ($) | Total Equity Award Adjustments ($) | ||||||||||||||||
| (i) | (ii) | (iii) | (iv) | (v) | (vi) | ||||||||||||||||||
| 2026 | 23,833,138 | 15,259,426 | -0 | - | 2,750,065 | -0 | - | 71,376 | 41,914,005 | ||||||||||||||
| 2025 | 18,727,156 | 12,743,644 | -0 | - | 1,951,197 | -0 | - | 87,323 | 33,509,320 | ||||||||||||||
| 2024 | 19,249,885 | 23,023,341 | -0 | - | 3,840,553 | -0 | - | 101,138 | 46,214,917 | ||||||||||||||
| 2023 | 14,913,714 | 13,443,829 | -0 | - | 3,032,450 | -0 | - | 195,742 | 31,585,735 | ||||||||||||||
| 2022 | 25,000,413 | 33,600,371 | -0 | - | 572,038 | -0 | - | 208,242 | 59,381,064 | ||||||||||||||
PEO SCT Total to CAP Reconciliation
Fiscal Year | SCT Total ($) | Deductions from SCT Total ($) | Additions to SCT Total ($) | Compensation Actually Paid ($) | ||||||||||
| (i) | (ii) | |||||||||||||
| 2026 | 24,213,044 | 17,201,202 | 41,914,005 | 48,925,847 | ||||||||||
| 2025 | 20,161,714 | 14,500,512 | 33,509,320 | 39,170,522 | ||||||||||
| 2024 | 18,997,543 | 13,500,408 | 46,214,917 | 51,712,052 | ||||||||||
| 2023 | 20,221,325 | 13,000,596 | 31,585,735 | 38,806,464 | ||||||||||
| 2022 | 18,152,082 | 12,250,438 | 59,381,064 | 65,282,708 | ||||||||||
Average Non-PEO NEOs SCT Total to CAP Reconciliation
Fiscal Year | SCT Total ($) | Deductions from SCT Total ($) | Additions to SCT Total ($) | Compensation Actually Paid ($) | ||||||||||
| (i) | (ii) | |||||||||||||
| 2026 | 5,493,345 | 3,375,749 | 8,451,204 | 10,568,800 | ||||||||||
| 2025 | 4,960,023 | 2,988,555 | 6,374,240 | 8,345,708 | ||||||||||
| 2024 | 5,203,982 | 3,317,343 | 6,977,220 | 8,863,859 | ||||||||||
| 2023 | 4,898,008 | 2,664,524 | 5,837,315 | 8,070,799 | ||||||||||
| 2022 | 4,509,999 | 2,326,573 | 11,974,643 | 14,158,069 | ||||||||||
i.Represents the grant date fair value of equity-based awards granted in each fiscal year presented, as shown in the “Stock Awards” column of the SCT.
ii.Represents the value of equity calculated in accordance with Item 402(v) for each fiscal year presented. The assumptions used in calculating the fair value of the equity awards in FY 2026 did not differ in any material respect from the assumptions used to calculate the grant date fair value of the awards as reported in the Summary Compensation Table, except that the fair value calculations of (i) the TSR PSUs granted in FY 2025 and FY 2026 used an estimated volatility between 27% and 28%, as
compared to an estimated volatility between 21% to 23% used to calculate the grant date fair value of such awards, and (ii) the non-TSR PSUs granted in FY 2025 and FY 2026 assumed payouts between 98% and 172%, as compared to the grant date fair value calculations which assumed a payout at target.
Non-PEO NEO Equity Award Detail
| Fiscal Year | Year End Fair Value of Equity Awards Granted in the Year ($) | Change in Fair Value of Outstanding and Unvested Equity Awards Granted in Prior Years ($) | Fair Value as of Vesting Date of Equity Awards Granted and Vested in the Year ($) | Change in Fair Value as of the Vesting Date of Equity Awards Granted in Prior Fiscal Years that Vested in the Fiscal Year ($) | Fair Value at the End of the Prior Year of Equity Awards that Failed to Meet Vesting Conditions in the Year ($) | Value of Dividends or other Earnings Paid on Stock or Option Awards not Otherwise Reflected in Fair Value or Total Compensation ($) | Total Equity Award Adjustments ($) | ||||||||||||||||
| (i) | (ii) | (iii) | (iv) | (v) | (vi) | ||||||||||||||||||
| 2026 | 4,677,457 | 2,993,991 | -0 | - | 761,615 | -0 | - | 18,141 | 8,451,204 | ||||||||||||||
| 2025 | 3,848,407 | 2,222,374 | -0 | - | 289,531 | -0 | - | 13,928 | 6,374,240 | ||||||||||||||
| 2024 | 3,848,402 | 2,812,080 | 53,629 | 533,378 | (286,351) | 16,082 | 6,977,220 | ||||||||||||||||
| 2023 | 2,995,518 | 2,170,991 | -0 | - | 638,913 | -0 | - | 31,893 | 5,837,315 | ||||||||||||||
| 2022 | 4,748,056 | 6,817,164 | -0 | - | 340,430 | -0 | - | 68,993 | 11,974,643 | ||||||||||||||
i.Add the fair value as of the end of the covered fiscal year of all awards granted during the covered fiscal year that are outstanding and unvested as of the end of the covered fiscal year;
ii.Add the amount equal to the change as of the end of the covered fiscal year (from the end of the prior fiscal year) in fair value (whether positive or negative) of any awards granted in any prior fiscal year that are outstanding and unvested as of the end of the covered fiscal year;
iii.Add, for awards that are granted and vest in the same year, the fair value as of the vesting date;
iv.Add the amount equal to the change as of the vesting date (from the end of the prior fiscal year) in fair value (whether positive or negative) of any awards granted in any prior fiscal year for which all applicable vesting conditions were satisfied at the end of or during the covered fiscal year;
v.Subtract, for any awards granted in any prior fiscal year that fail to meet the applicable vesting conditions during the covered fiscal year, the amount equal to the fair value at the end of the prior fiscal year; and
vi.Add the dollar value of any dividends or other earnings paid on stock or option awards in the covered fiscal year prior to the vesting date that are not otherwise included in the total compensation for the covered fiscal year.
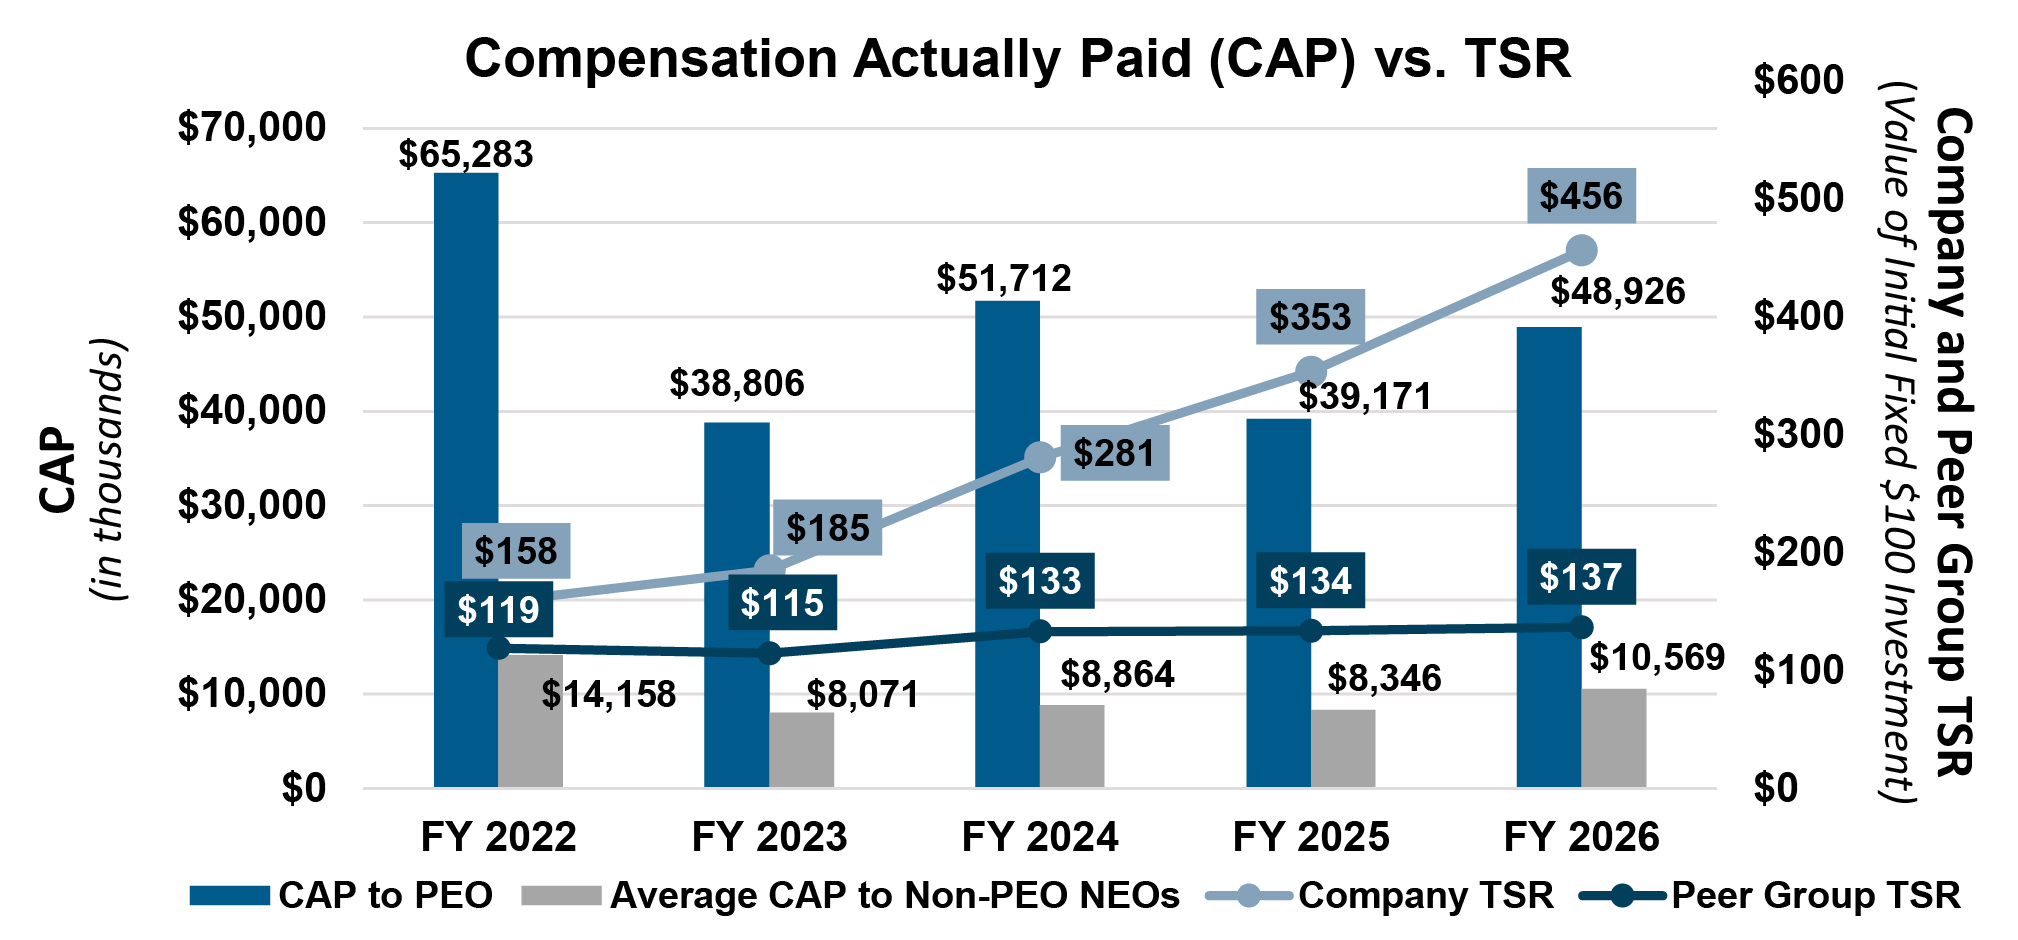
Compensation Actually Paid (CAP) versus TSR: As shown in the first table of this Pay versus Performance section, the PEO’s and Non-PEO NEOs’ CAP values are higher than the corresponding grant date fair values in the SCT, which is consistent with the Company’s positive TSR each year, as shown in the graphs immediately above and below. This is due primarily to the Company’s use of equity incentives, the value of which is tied directly to stock price in addition to the Company’s financial performance. Our executive compensation program emphasizes equity-based pay, with the majority of target direct compensation for both the PEO and Non-PEO NEOs delivered via equity-based awards.
CAP versus Net Income: The Compensation and Talent Committee does not use Net Income to determine compensation opportunity or outcomes.
The committee believes that Adjusted EPS is a superior indicator of core operating performance and profitability. In addition, it is common for our shareholders to use Adjusted EPS and other metrics to inform their views of historical and future expectations for underlying operational performance. Net Income, on the other hand, can show variability year over year due to timing of specific events or because of unusual or non-recurring events.
Therefore, we would not necessarily expect to see alignment between Net Income and CAP. The Compensation and Talent Committee is focused on alignment of our compensation programs to metrics that most appropriately measure our profitability and sustainable long-term growth.
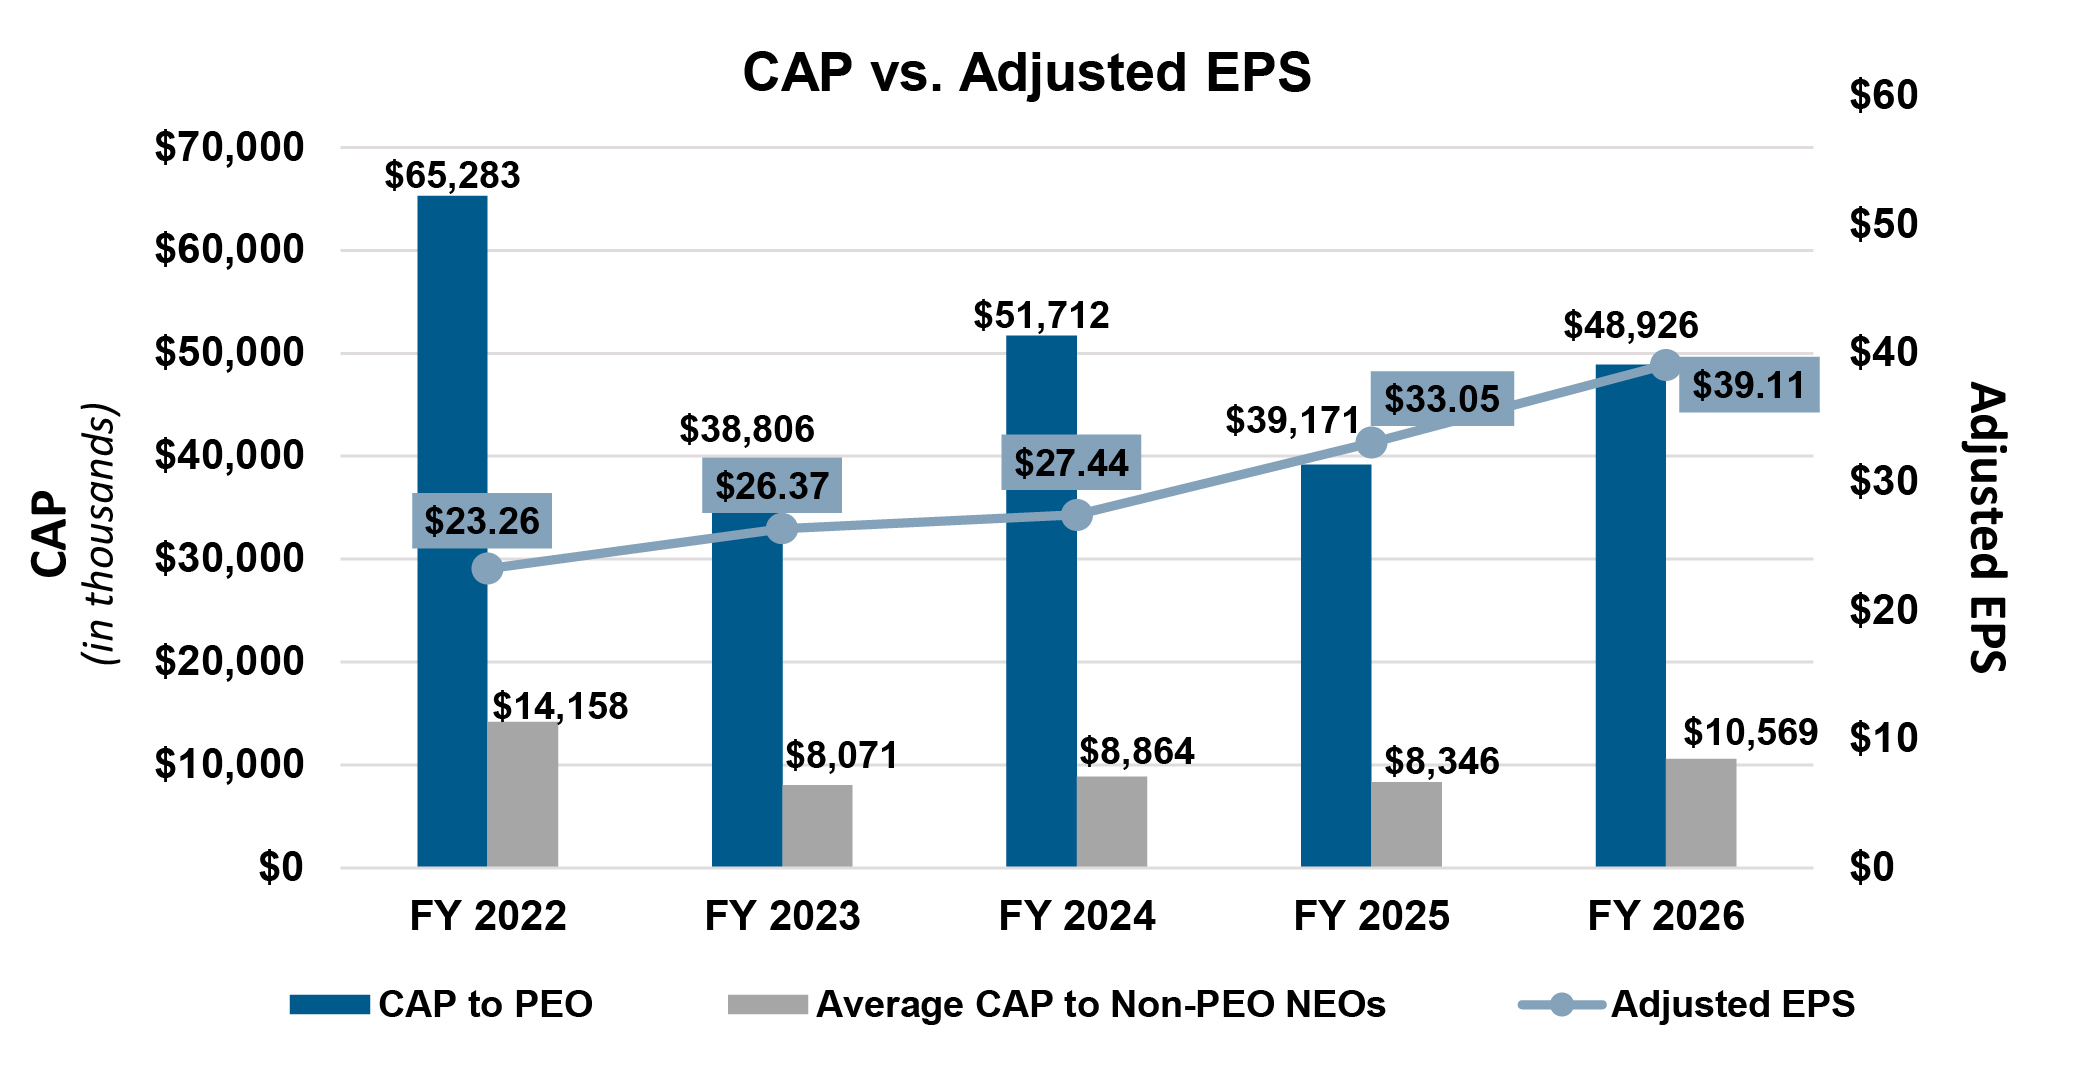
CAP versus Adjusted EPS: The chart below compares the PEO’s and Non-PEO NEOs’ CAP values to our Company-Selected Measure (CSM), Adjusted EPS. As noted above, for each fiscal year presented, CAP values are higher than the corresponding grant date fair value of stock awards shown in the SCT, which is consistent with our growing Adjusted EPS.
The Company focuses on Adjusted EPS in our incentive plans because earnings per share is one of the principal measures used by shareholders to assess financial performance results and establish a price for the Company’s equity, and it is a central component of our guidance to shareholders. The use of Adjusted EPS in our incentive plans aligns our executives’ interests with the broader set of strategic objectives they are tasked to manage, keeping enterprise value and shareholder interests at the forefront of management decisions on both a short- and long-term basis. Accordingly, Adjusted EPS is included as a key metric in both our annual and long-term incentives.
Given this emphasis on Adjusted EPS, its impact on the value of the Company’s shares and therefore CAP values — both positive and negative — is significant. Adjusted EPS drives a significant portion of the Company’s annual cash incentive and determines a significant portion of PSU award payouts to be earned during any three-year PSU performance period.
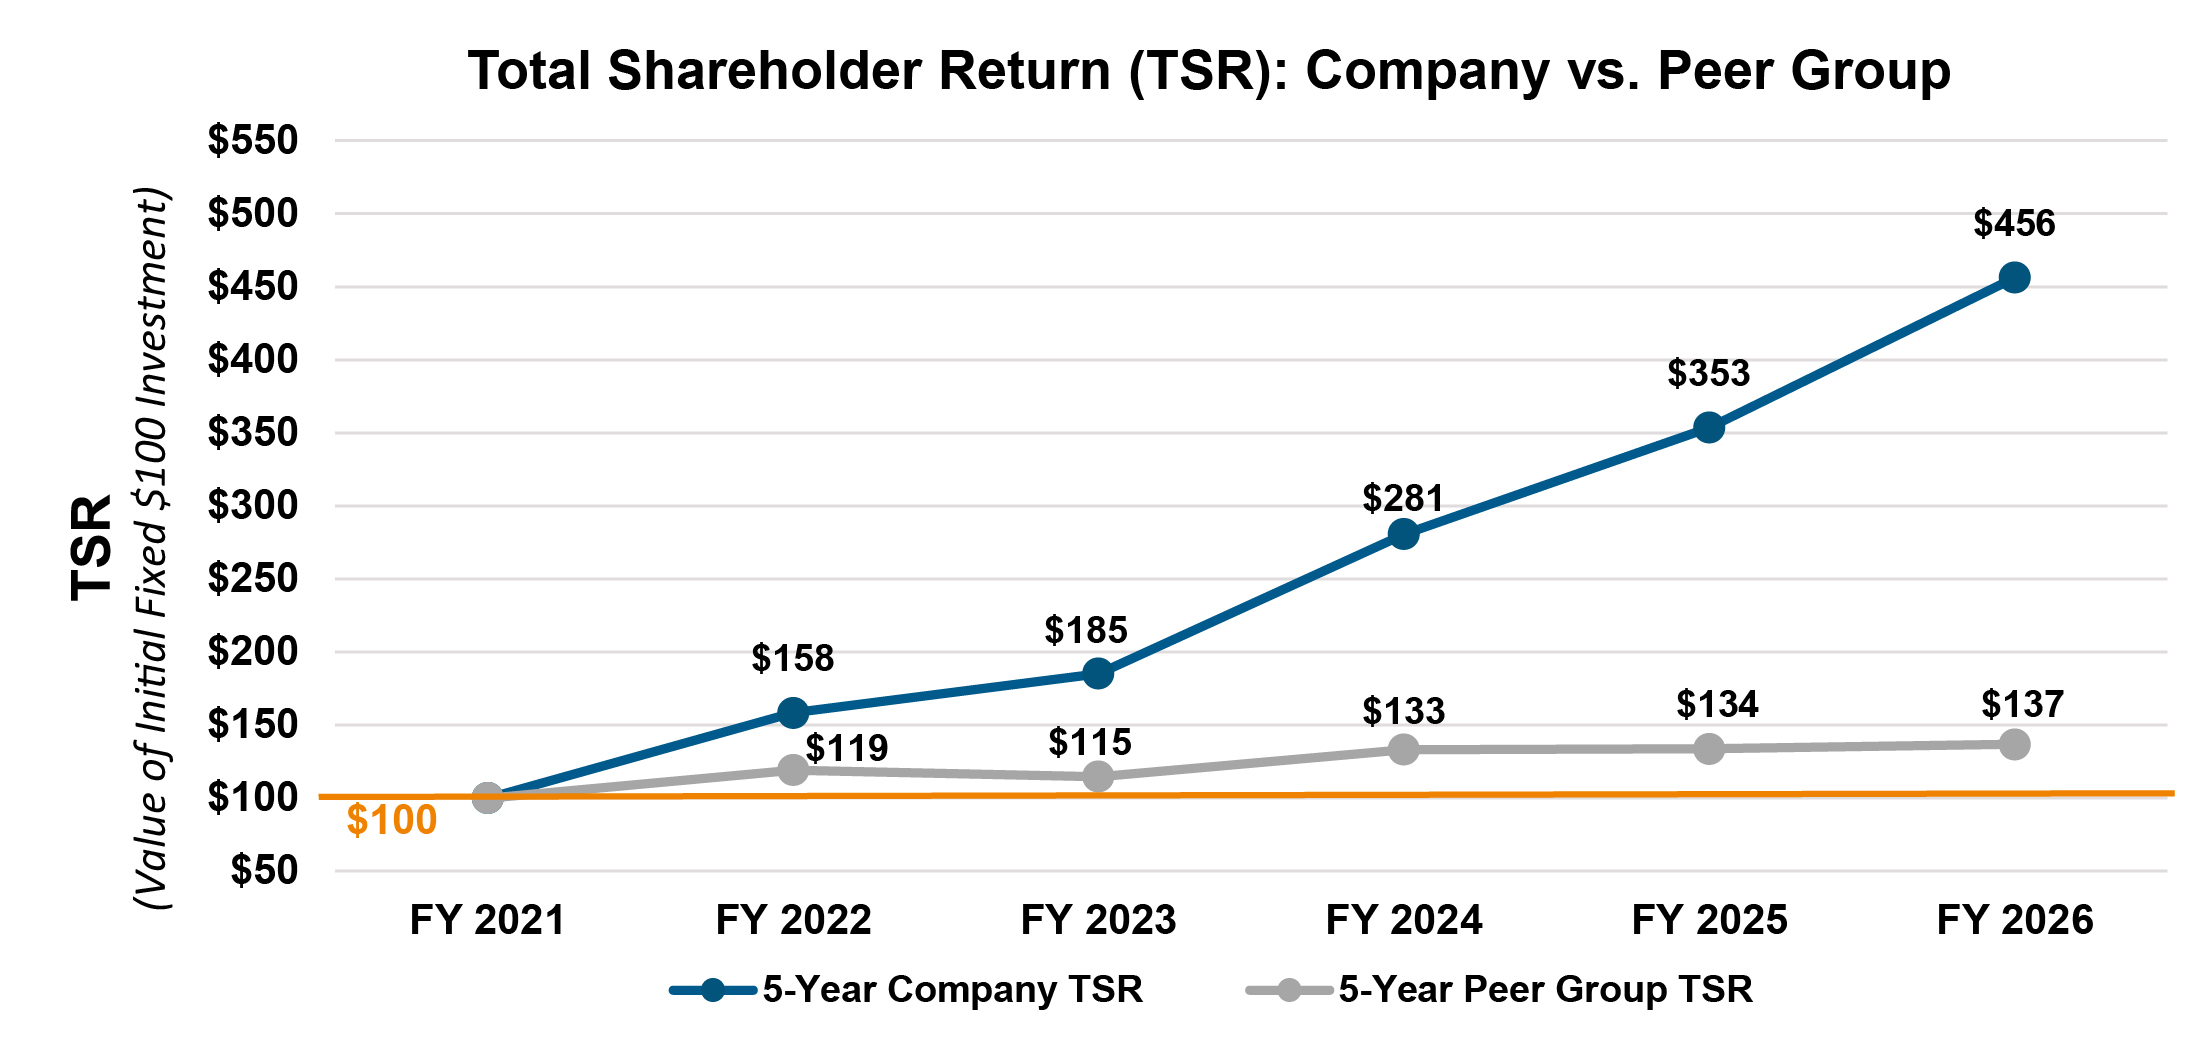
Total Shareholder Return (TSR): Company versus Peer Group: The Company’s five-year cumulative TSR has significantly exceeded that of the S&P 500 Health Care Index. We selected the S&P 500 Health Care Index as the comparator because it is generally available to shareholders and broadly used by other companies in the same industry.
| FY 2026 Most Important Performance Measures | ||
| Adjusted EPS | ||
| Adjusted Operating Profit | ||
| Free Cash Flow | ||
| Average ROIC | ||