The bar chart and performance table below show the variability of the Fund’s returns, which is an indication of the risks of investing in the Fund. The bar chart shows the performance of the Fund’s Investor Class shares for each full calendar year since the Fund’s inception. The performance table compares the performance of the Fund’s Investor Class shares over time to the performance of a broad-based market index. You should be aware that the Fund’s past performance (before and after taxes) may not be an indication of how the Fund will perform in the future. Advisor Class shares have similar annual returns to Investor Class shares because the classes are invested in the same portfolio of securities, however, the returns for Advisor Class shares are lower than Investor Class shares because Advisor Class shares have higher expenses. Shareholder reports containing financial and performance information for the Fund will be mailed to shareholders semi-annually. Updated performance information is available at no cost by calling toll-free 1-855-64-QUANT (1-855-647-8268).
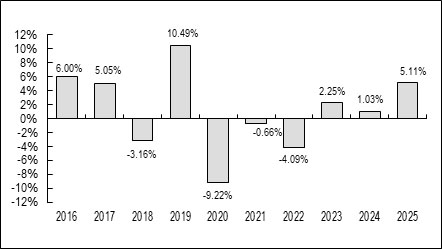
| Best Quarter | 4.74% | March 31, 2019 |
| Worst Quarter | (9.29)% | March 31, 2020 |
| Quantified Managed Income Fund | One Year |
Five Years |
Ten
Years or Since Inception(1) |
| Investor Class Shares Return before taxes | 5.11% | 0.68% | 1.13% |
| Investor Class Shares Return after taxes on distributions(2)(4) | 3.37% | (0.35)% | 0.30% |
| Investor Class Shares Return after taxes on distributions and sale of Fund Shares(2)(4) | 3.12% | 0.13% | 0.57% |
| Bloomberg
US Aggregate Bond Index(3) (reflects no deduction for fees, expenses or taxes) |
7.30% | (0.36)% | 2.01%(5) |
| Advisor Class Shares Return before taxes | 4.55% | 0.06% | 0.32% |
| Bloomberg
US Aggregate Bond Index(3) (reflects no deduction for fees, expenses or taxes) |
7.30% | (0.36)% | 1.80%(5) |
| (1) | The Inception date of the Fund’s Investor Class Shares is August 9, 2013. The Fund’s Advisor Class Shares commenced operations on March 18, 2016. |
| (2) | After-tax returns are calculated using the historical highest individual federal marginal income tax rates and do not reflect the impact of state and local taxes. Actual after-tax returns depend on an investor’s tax situation and may differ from those shown, and after-tax returns shown are not relevant to investors who hold their Fund shares through tax-deferred arrangements, such as 401(k) plans or individual retirement accounts. |
| (3) | The Bloomberg US Aggregate Bond Index is an unmanaged index comprised of U.S. Investment grade bond market securities, including government, government agency, corporate and mortgage-backed securities. Index returns assume reinvestment of dividends. Investors may not invest in the index directly; unlike the Fund’s returns, the index does not reflect any fees or expenses. |
| (4) | After tax returns are only shown for Investor Class Shares, after Tax Return for Advisor Class Shares will vary. |
| (5) | The Bloomberg US Aggregate Bond Index is shown for ten years for Investor Class Shares and since inception March 18, 2016 for Advisor Class Shares. |
The bar chart and performance table below show the variability of the Fund’s returns, which is an indication of the risks of investing in the Fund. The bar chart shows the performance of the Fund’s Investor Class shares for each full calendar year since the Fund’s inception. The performance table compares the performance of the Fund’s Investor Class shares over time to the performance of a broad-based market index. You should be aware that the Fund’s past performance (before and after taxes) may not be an indication of how the Fund will perform in the future. Advisor Class shares have similar annual returns to Investor Class shares because the classes are invested in the same portfolio of securities, however, the returns for Advisor Class shares are lower than Investor Class shares because Advisor Class shares have higher expenses. Shareholder reports containing financial and performance information for the Fund will be mailed to shareholders semi-annually. Updated performance information is available at no cost by calling toll-free 1-855-64-QUANT (1-855-647-8268).
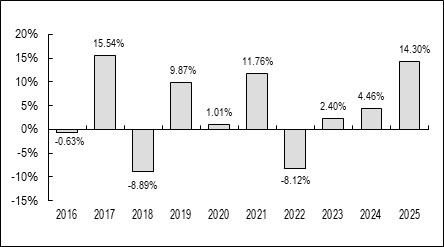
| Best Quarter | 10.73% | December 31, 2020 |
| Worst Quarter | (16.15)% | March 31, 2020 |
| Quantified Alternative Investment Fund | One Year |
Five Years |
Ten
Years or Since Inception(1) |
| Investor Class shares Return before taxes | 14.30% | 4.65% | 3.84% |
| Investor Class shares Return after taxes on distributions(2)(4) | 13.35% | 3.01% | 2.85% |
| Investor Class shares Return after taxes on distributions and sale of Fund shares(2)(4) | 8.61% | 2.92% | 2.60% |
| S&P
500 Total Return Index(3) (reflects no deduction for fees, expenses or taxes) |
17.88% | 14.42% | 14.82%(5) |
| Advisor Class Shares Return before taxes | 13.56% | 4.05% | 3.46% |
| S&P
500 Total Return Index(3) (reflects no deduction for fees, expenses or taxes) |
17.88% | 14.42% | 15.07%(5) |
| (1) | The Inception date of the Fund’s Investor Class Shares is August 9, 2013. The Fund’s Advisor Class Shares commenced operations on March 18, 2016. |
| (2) | After-tax returns are calculated using the historical highest individual federal marginal income tax rates and do not reflect the impact of state and local taxes. Actual after-tax returns depend on an investor’s tax situation and may differ from those shown, and after-tax returns shown are not relevant to investors who hold their Fund shares through tax-deferred arrangements, such as 401(k) plans or individual retirement accounts. |
| (3) | The S&P 500 Total Return Index is an unmanaged composite of 500 large capitalization companies and includes the reinvestment of dividends. This index is widely used by professional investors as a performance benchmark for large-cap stocks. Investors cannot invest directly in an index; unlike the Fund’s returns, the index does not reflect any fees or expenses. |
| (4) | After tax returns are only shown for Investor Class Shares, including the ten years. After tax returns for Advisor Class Shares will vary. |
| (5) | The S&P 500 Total Return Index Return shown is for 10 year period for the Investor Class Shares and from March 18, 2016 for the Advisor Class Shares. |
The bar chart and performance table below show the variability of the Fund’s returns, which is an indication of the risks of investing in the Fund. The bar chart shows the performance of the Fund’s Investor Class shares for each full calendar year since the Fund’s inception. The performance table compares the performance of the Fund’s Investor Class shares over time to the performance of a broad-based market index. You should be aware that the Fund’s past performance (before and after taxes) may not be an indication of how the Fund will perform in the future. Advisor Class shares have similar annual returns to Investor Class shares because the classes are invested in the same portfolio of securities, however, the returns for Advisor Class shares are lower than Investor Class shares because Advisor Class shares have higher expenses. Shareholder reports containing financial and performance information for the Fund will be mailed to shareholders semi-annually. Updated performance information is available at no cost by calling toll-free 1-855-64-QUANT (1-855-647-8268).
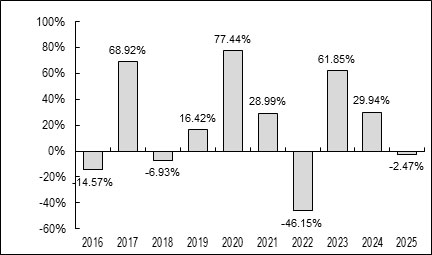
| Best Quarter | 29.45% | June 30, 2023 |
| Worst Quarter | (25.60)% | March 31, 2025 |
| Quantified STF Fund | One Year |
Five Years |
Since Inception(1) |
| Investor Class Shares Return before taxes | (2.47)% | 7.34% | 14.73% |
| Investor Class Shares Return after taxes on distributions(2)(4) | (5.44)% | 4.92% | 11.65% |
| Investor
Class Shares Return after taxes on distributions and sale of Fund shares(2)(4) |
(0.63)% | 4.99% | 10.98% |
| NASDAQ
100 Total Return Index(3)(5) (reflects no deduction for fees, expenses or taxes) |
21.02% | 15.30% | 19.70%(5) |
| Advisor Class Shares Return before taxes | (3.03)% | 6.69% | 14.07% |
| NASDAQ
100 Total Return Index(3)(5) (reflects no deduction for fees, expenses or taxes) |
21.02% | 15.30% | 19.70%(5) |
| (1) | The inception date of the Fund’s Investor Class Shares and Advisor Class Shares is November 13, 2015. |
| (2) | After-tax returns are calculated using the historical highest individual federal marginal income tax rates and do not reflect the impact of state and local taxes. Actual after-tax returns depend on an investor’s tax situation and may differ from those shown, and after-tax returns shown are not relevant to investors who hold their Fund shares through tax-deferred arrangements, such as 401(k) plans or individual retirement accounts. |
| (3) | The NASDAQ 100 Total Return Index is the largest domestic and international non-financial companies listed on the Nasdaq Stock Market based on market capitalization. The Index reflects companies across major industry groups including computer hardware and software, telecommunications, retail/wholesale trade and biotechnology. Index composition is reviewed on an annual basis in December. Investors cannot invest directly in an index; unlike the Fund’s returns, the index does not reflect any fees or expenses. |
| (4) | After tax returns are only shown for Investor Class Shares. After Tax Return for Advisor Class Shares will vary. |
| (5) | The NASDAQ 100 Return Index is shown from inception of November 13, 2015, for both the Investor Class Shares and the Advisor Class Shares. |
The bar chart and performance table below show the variability of the Fund’s returns, which is an indication of the risks of investing in the Fund. The bar chart shows the performance of the Fund’s Investor Class shares for each full calendar year since the Fund’s inception. The Adviser Class shares of the Fund have not commenced operations. The performance table compares the performance of the Fund’s Investor Class shares over time to the performance of a broad-based market index. You should be aware that the Fund’s past performance (before and after taxes) may not be an indication of how the Fund will perform in the future. Once they commence operations, Advisor Class shares will have similar annual returns to Investor Class shares because the classes are invested in the same portfolio of securities, however, the returns for Advisor Class shares are lower than Investor Class shares because Advisor Class shares have higher expenses. Shareholder reports containing financial and performance information for the Fund will be mailed to shareholders semi-annually. Updated performance information is available at no cost by calling toll-free 1-855-64-QUANT (1-855-647-8268).
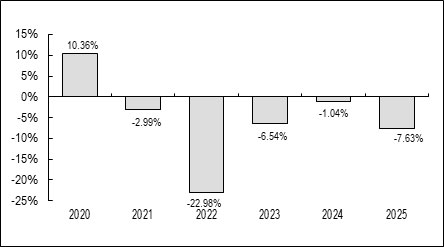
| Best Quarter | 11.39% | March 31, 2020 |
| Worst Quarter | (9.24)% | March 31, 2021 |
| Quantified Tactical Fixed Income Fund | One Year |
Five Years |
Since Inception(1) |
| Investor Class Shares Return before taxes | (7.63)% | (8.59)% | (5.21)% |
| Investor Class Shares Return after taxes on distributions(2) | (11.89)% | (9.71)% | (6.34)% |
| Investor Class Shares Return after taxes on distributions and sale of Fund shares(2) | (4.52)% | (6.66)% | (4.17)% |
| Bloomberg
U.S. Aggregate Bond Index(3) (reflects no deduction for fees, expenses or taxes) |
7.30% | (0.36)% | 1.10% |
| (1) | The inception date for Fund’s Investor Class Shares is September 13, 2019. The Fund’s Advisor Class Shares have not commenced operations. |
| (2) | After-tax returns are calculated using the historical highest individual federal marginal income tax rates and do not reflect the impact of state and local taxes. Actual after-tax returns depend on an investor’s tax situation and may differ from those shown, and after-tax returns shown are not relevant to investors who hold their Fund shares through tax-deferred arrangements, such as 401(k) plans or individual retirement accounts. |
| (3) | The Bloomberg U.S. Aggregate Bond Index is an unmanaged index comprised of U.S. investment grade, fixed rate bond market securities, including government, government agency, corporate and mortgage-backed securities. Investors cannot invest directly in an index; unlike the Fund’s returns, the index does not reflect any fees or expenses. |
The bar chart and performance table below show the variability of the Fund’s returns, which is an indication of the risks of investing in the Fund. The bar chart shows the performance of the Fund’s Investor Class shares for each full calendar year since the Fund’s Investor Class Shares inception. The Adviser Class Shares of the Fund have not commenced operations. The performance table compares the performance of the Fund’s Investor Class shares over time to the performance of a broad-based market index. You should be aware that the Fund’s past performance (before and after taxes) may not be an indication of how the Fund will perform in the future. Advisor Class shares will have similar annual returns to Investor Class shares because the classes are invested in the same portfolio of securities, however, the returns for Advisor Class shares are lower than Investor Class shares because Advisor Class shares have higher expenses. Shareholder reports containing financial and performance information for the Fund will be mailed to shareholders semi-annually. Updated performance information is available at no cost by calling toll-free 1-855-64-QUANT (1-855-647-8268).
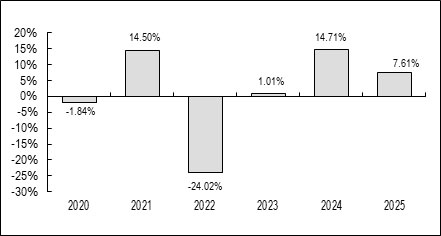
| Best Quarter | 15.13% | March 31, 2025 |
| Worst Quarter | (17.14)% | June 30, 2025 |
| Quantified Evolution Plus Fund | One Year |
Five Years |
Since Inception(1) |
| Investor Class Shares Return before taxes | 7.61% | 1.64% | 0.69% |
| Investor Class Shares Return after taxes on distributions(2) | (9.32)% | (4.83)% | (4.62)% |
| Investor Class Shares Return after taxes on distributions and sale of Fund shares(2) | 5.08% | (1.09)% | (1.38)% |
| S&P
500 Total Return Index(3) (reflects no deduction for fees, expenses or taxes) |
17.88% | 14.42% | 16.03% |
| (1) | The Fund’s Investor Class Shares commenced operations on September 30, 2019. The Fund’s Advisor Class Shares have not commenced operations. |
| (2) | After-tax returns are calculated using the historical highest individual federal marginal income tax rates and do not reflect the impact of state and local taxes. Actual after-tax returns depend on an investor’s tax situation and may differ from those shown, and after-tax returns shown are not relevant to investors who hold their Fund shares through tax-deferred arrangements, such as 401(k) plans or individual retirement accounts. |
| (3) | The S&P 500 Total Return Index is an unmanaged composite of 500 large capitalization companies and includes the reinvestment of dividends. The Index is widely used by professional investors as a performance benchmark for large-cap stocks. Investors cannot invest directly in an index; unlike the Fund’s returns, the index does not reflect any fees or expenses. |
The bar chart and performance table below show the variability of the Fund’s returns, which is an indication of the risks of investing in the Fund. The bar chart shows the performance of the Fund’s Investor Class shares for each full calendar year since the Fund’s Investor Class Shares inception. The Adviser Class Shares of the Fund have not commenced operations. The performance table compares the performance of the Fund’s Investor Class shares over time to the performance of a broad-based market index. You should be aware that the Fund’s past performance (before and after taxes) may not be an indication of how the Fund will perform in the future. Advisor Class shares will have similar annual returns to Investor Class shares because the classes are invested in the same portfolio of securities, however, the returns for Advisor Class shares are lower than Investor Class shares because Advisor Class shares have higher expenses. Shareholder reports containing financial and performance information for the Fund will be mailed to shareholders semi-annually. Updated performance information is available at no cost by calling toll-free 1-855-64-QUANT (1-855-647-8268).
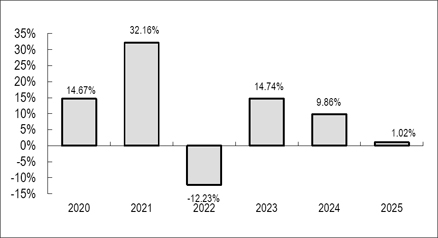
| Best Quarter | 17.03% | December 31, 2021 |
| Worst Quarter | (10.59)% | March 31, 2020 |
| Quantified Common Ground Fund | One Year |
Five Years |
Since Inception(1) |
| Investor Class Shares Return before taxes | 1.02% | 8.12% | 9.18% |
| Investor Class Shares Return after taxes on distributions(2) | 0.86% | 7.27% | 8.35% |
| Investor Class Shares Return after taxes on distributions and sale of Fund shares(2) | 0.72% | 6.05% | 6.96% |
| S&P
Composite 1500® Total Return Index(3) (reflects no deduction for fees, expenses or taxes) |
17.02% | 13.96% | 14.54% |
| Advisor Class Shares Return before taxes | n/a | n/a | (2.75)% |
| S&P
Composite 1500® Total Return Index(3) (reflects no deduction for fees, expenses or taxes) |
n/a | n/a | 13.78% |
| (1) | The Fund’s Investor Class Shares commenced operations on December 27, 2019. The Fund’s Advisor Class Shares commenced operations on January 31, 2025. |
| (2) | After-tax returns are calculated using the historical highest individual federal marginal income tax rates and do not reflect the impact of state and local taxes. Actual after-tax returns depend on an investor’s tax situation and may differ from those shown, and after-tax returns shown are not relevant to investors who hold their Fund shares through tax-deferred arrangements, such as 401(k) plans or individual retirement accounts. After tax returns are only shown for Investor Class Shares. After Tax Return for Advisor Class Shares will vary. |
| (3) | The S&P Composite 1500® Total Return Index combines three leading indices, the S&P 500®, the S&P MidCap 400®, and the S&P SmallCap 600®, to cover approximately 90% of U.S. market capitalization. It is designed for investors seeking to replicate the performance of the U.S. equity market or benchmark against a representative universe of tradable stocks. Investors cannot invest directly in an index. Unlike the Fund’s returns, the index does not reflect any fees or expenses. |
The bar chart and performance table below show the variability of the Fund’s returns, which is an indication of the risks of investing in the Fund. The bar chart shows the performance of the Fund’s Investor Class shares for each full calendar year since the Fund’s Investor Class Shares inception. The Adviser Class Shares of the Fund have not commenced operations. The performance table compares the performance of the Fund’s Investor Class shares over time to the performance of a broad-based market index. You should be aware that the Fund’s past performance (before and after taxes) may not be an indication of how the Fund will perform in the future. Advisor Class shares have similar annual returns to Investor Class shares because the classes are invested in the same portfolio of securities, however, the returns for Advisor Class shares are lower than Investor Class shares because Advisor Class shares have higher expenses.
Shareholder reports containing financial and performance information for the Fund will be mailed to shareholders semi-annually. Updated performance information is available at no cost by calling toll-free 1-855-64-QUANT (1-855-647-8268).
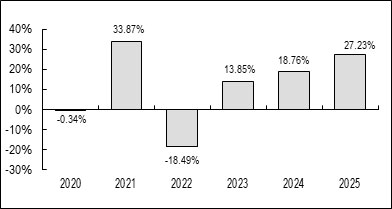
| Best Quarter | 16.20% | March 31, 2024 |
| Worst Quarter | (15.53)% | June 30, 2022 |
| Quantified Pattern Recognition Fund | One Year |
Five Years |
Since Inception(1) |
| Investor Class Shares Return before taxes | 27.23% | 13.42% | 12.30% |
| Investor Class Shares Return after taxes on distributions(2) | 26.48% | 10.93% | 10.14% |
| Investor Class Shares Return after taxes on distributions and sale of Fund shares(2) | 16.12% | 9.52% | 8.87% |
| S&P
500 Total Return Index(3) (reflects no deduction for fees, expenses or taxes) |
17.88% | 14.42% | 16.14% |
| 50/50
S&P 500/Bloomberg Aggregate Bond Index(3)(4) (reflects no deduction for fees, expenses or taxes) |
12.64% | 6.99% | 8.50% |
| (1) | The Fund’s Investor Class Shares commenced operations on August 30, 2019. The Fund’s Advisor Class Shares have not commenced operations. |
| (2) | After-tax returns are calculated using the historical highest individual federal marginal income tax rates and do not reflect the impact of state and local taxes. Actual after-tax returns depend on an investor’s tax situation and may differ from those shown, and after-tax returns shown are not relevant to investors who hold their Fund shares through tax-deferred arrangements, such as 401(k) plans or individual retirement accounts. |
| (3) | The S&P 500 Total Return Index is an unmanaged composite of 500 large capitalization companies and includes the reinvestment of dividends. The Index is widely used by professional investors as a performance benchmark for large-cap stocks. Investors cannot invest directly in an index; unlike the Fund’s returns, the index does not reflect any fees or expenses. |
| (4) | The 50/50 S&P 500/Bloomberg Aggregate Index is an unmanaged index is a type of balanced fund which allocates approximately half of its assets to U.S. Equities (via the S&P 500 Index) and the other half to U.S. investment grade bonds (via the Bloomberg U.S. Aggregate Bond Index) The Bloomberg U.S. Aggregate Bond Index is comprised of U.S. investment grade, fixed rate bond market securities, including government, government agency, corporate and mortgage-backed securities. Investors cannot invest directly in an index. Unlike the Fund’s returns, the index does not reflect any fees or expenses. |
The bar chart and performance table below show the variability of the Fund’s returns, which is some indication of the risks of investing in the Fund. The bar chart shows the performance of the Fund’s Investor Class shares for each full calendar year since the Fund’s Investor Class Shares inception. The Adviser Class Shares of the Fund have not commenced operations. The performance table compares the performance of the Fund’s Investor Class shares over time to the performance of a broad-based market index. You should be aware that the Fund’s past performance (before and after taxes) may not be an indication of how the Fund will perform in the future. Advisor Class shares have similar annual returns to Investor Class shares because the classes are invested in the same portfolio of securities, however, the returns for Advisor Class shares are lower than Investor Class shares because Advisor Class shares have higher expenses. Shareholder reports containing financial and performance information for the Fund will be mailed to shareholders semi-annually. Updated performance information is available at no cost by calling toll-free 1-855-64-QUANT (1-855-647-8268).
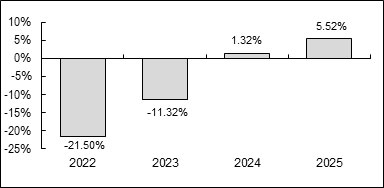
| Best Quarter | 2.87% | September 30, 2025 |
| Worst Quarter | (6.80)% | June 30, 2022 |
| Quantified Government Income Tactical Fund | One Year |
Since Inception(1) |
| Investor Class Shares Return before taxes | 5.52% | (4.73)% |
| Investor Class Shares Return after taxes on distributions(2) | 4.53% | (5.76)% |
| Investor Class Shares Return after taxes on distributions and sale of Fund shares(2) | 3.27% | (3.91)% |
| Bloomberg
U.S. Aggregate Bond Index(3) (reflects no deduction for fees, expenses or taxes) |
7.30% | 0.12% |
| (1) | The Fund’s Investor Class Shares commenced operations on April 15, 2021. The Fund’s Advisor Class Shares have not commenced operations. |
| (2) | After-tax returns are calculated using the historical highest individual federal marginal income tax rates and do not reflect the impact of state and local taxes. Actual after-tax returns depend on an investor’s tax situation and may differ from those shown, and after-tax returns shown are not relevant to investors who hold their Fund shares through tax-deferred arrangements, such as 401(k) plans or individual retirement accounts. |
| (3) | The Bloomberg U.S. Bond Index is an unmanaged index comprised of U.S. investment grade, fixed rate bond market securities, including government, government agency, corporate and mortgage-backed securities. Investors cannot invest directly in an index; unlike the Fund’s returns, the index does not reflect any fees or expenses. |