
Exhibit 99.1 Investor Presentation June 2026 1
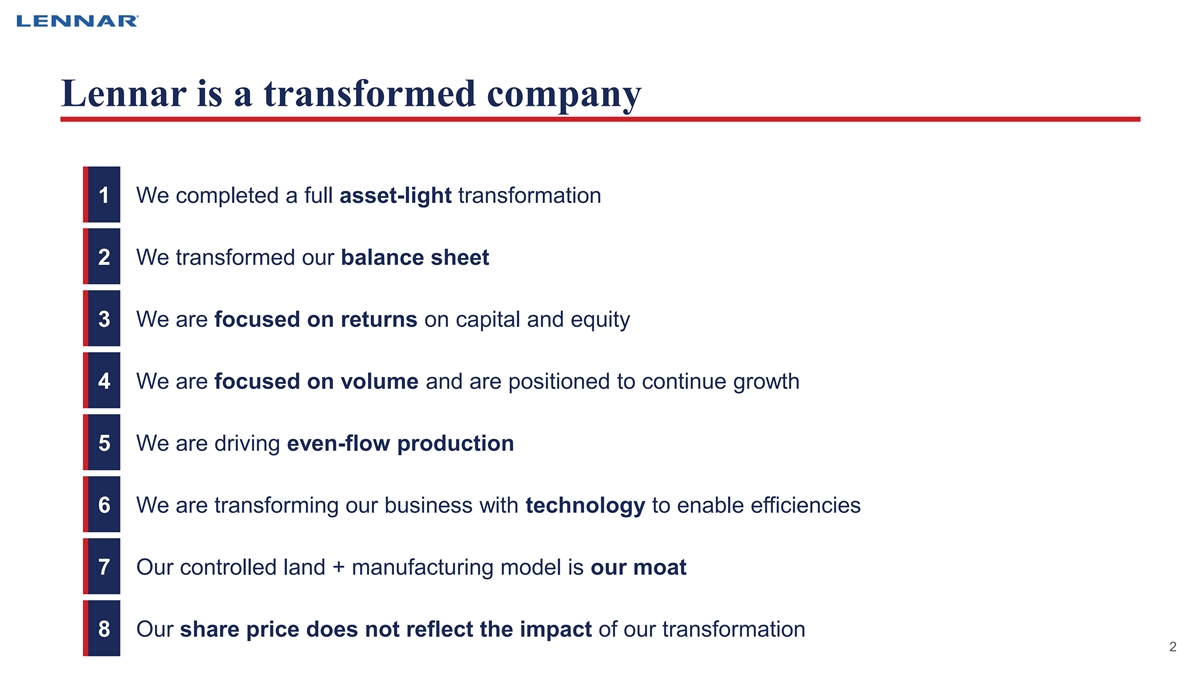
Lennar is a transformed company 1 We completed a full asset-light transformation 2 We transformed our balance sheet 3 We are focused on returns on capital and equity 4 We are focused on volume and are positioned to continue growth 5 We are driving even-flow production 6 We are transforming our business with technology to enable efficiencies 7 Our controlled land + manufacturing model is our moat 8 Our share price does not reflect the impact of our transformation 2
WE COMPLETED A FULL 1 ASSET-LIGHT TRANSFORMATION 3
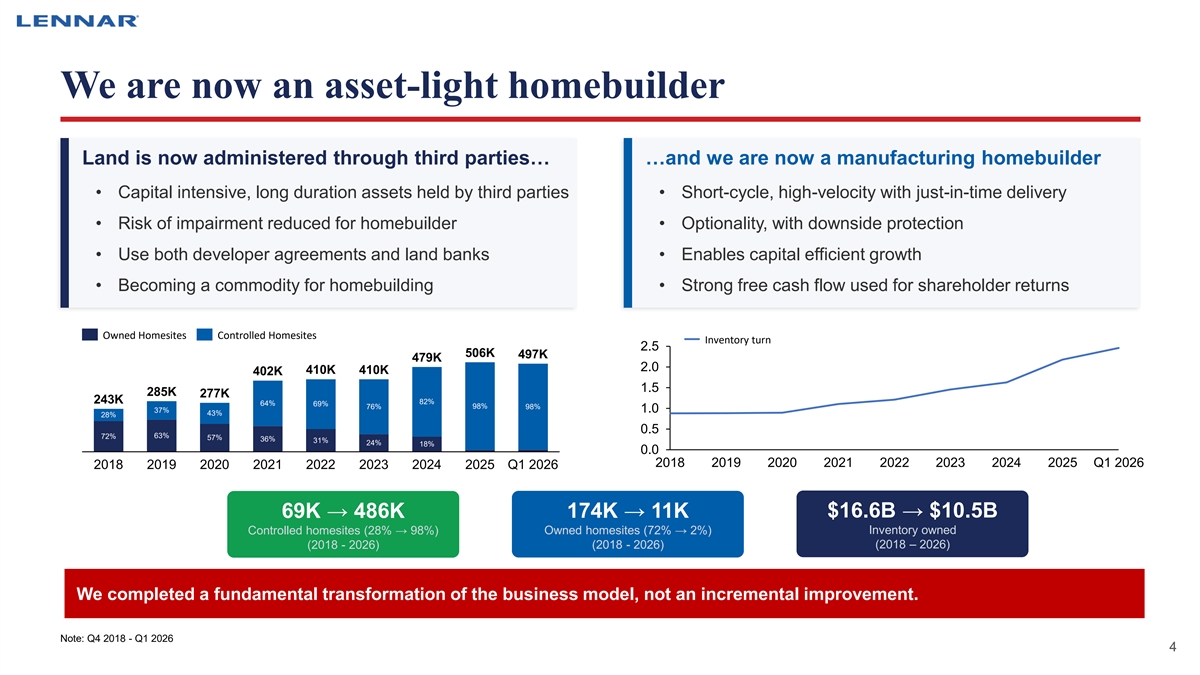
We are now an asset-light homebuilder Land is now administered through third parties… …and we are now a manufacturing homebuilder • Capital intensive, long duration assets held by third parties • Short-cycle, high-velocity with just-in-time delivery • Risk of impairment reduced for homebuilder • Optionality, with downside protection • Use both developer agreements and land banks • Enables capital efficient growth • Becoming a commodity for homebuilding • Strong free cash flow used for shareholder returns Owned Homesites Controlled Homesites Inventory turn 2.5 506K 497K 479K 2.0 410K 410K 402K 1.5 285K 277K 243K 82% 64% 69% 76% 98% 98% 37% 1.0 43% 28% 0.5 72% 63% 57% 36% 31% 24% 18% 0.0 2018 2019 2020 2021 2022 2023 2024 2025 Q1 2026 2018 2019 2020 2021 2022 2023 2024 2025 Q1 2026 174K → 11K $16.6B → $10.5B 69K → 486K Inventory owned Controlled homesites (28% → 98%) Owned homesites (72% → 2%) (2018 - 2026) (2018 - 2026) (2018 – 2026) We completed a fundamental transformation of the business model, not an incremental improvement. Note: Q4 2018 - Q1 2026 4 4

WE TRANSFORMED OUR 2 BALANCE SHEET 5 5
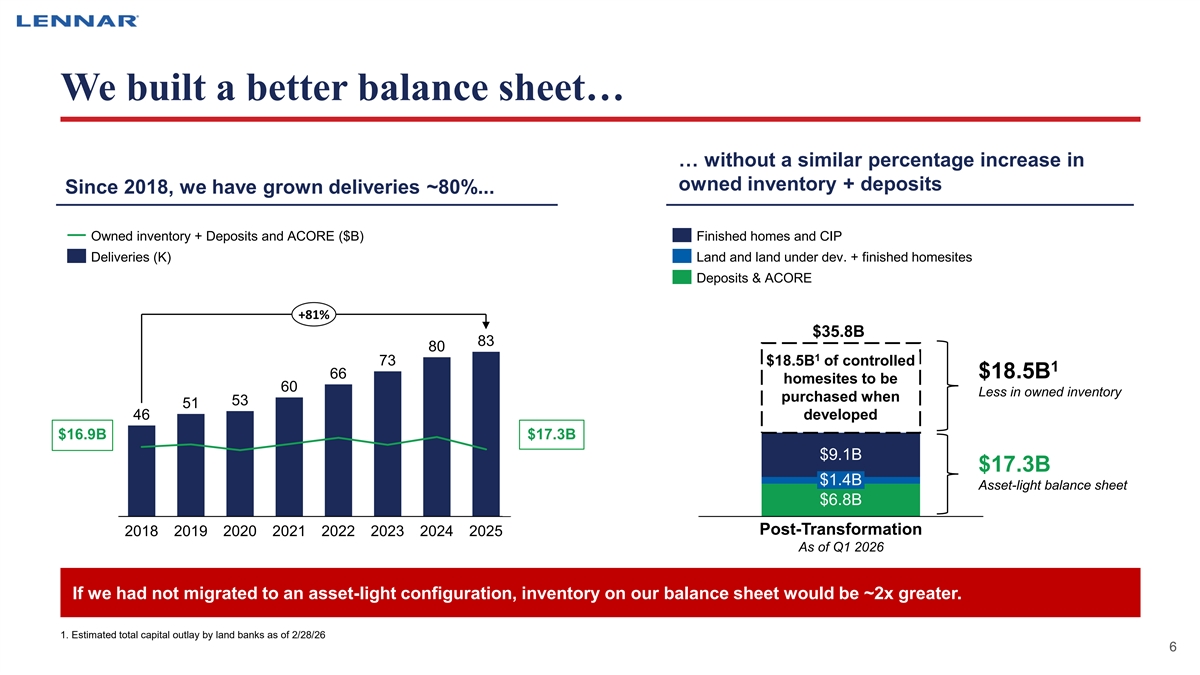
We built a better balance sheet… … without a similar percentage increase in owned inventory + deposits Since 2018, we have grown deliveries ~80%... Owned inventory + Deposits and ACORE ($B) Finished homes and CIP Deliveries (K) Land and land under dev. + finished homesites Deposits & ACORE +81% $35.8B 83 80 1 73 $18.5B of controlled 1 66 $18.5B homesites to be 60 Less in owned inventory purchased when 53 51 46 developed $16.9B $17.3B $9.1B $17.3B $1.4B Asset-light balance sheet $6.8B Post-Transformation 2018 2019 2020 2021 2022 2023 2024 2025 As of Q1 2026 If we had not migrated to an asset-light configuration, inventory on our balance sheet would be ~2x greater. 1. Estimated total capital outlay by land banks as of 2/28/26 6 6
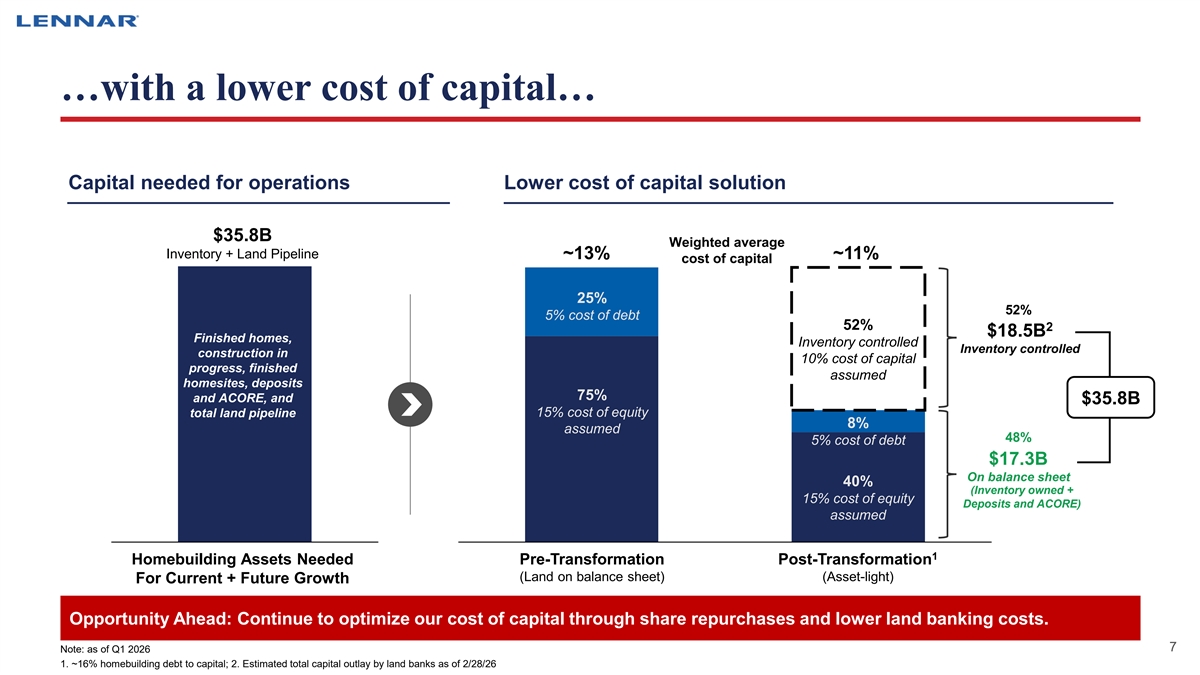
…with a lower cost of capital… Sources of capital Capital needed for operations Lower cost of capital solution $35.8B Weighted average Inventory + Land Pipeline ~13% ~11% cost of capital 25% 52% 5% cost of debt 52% 2 $18.5B Finished homes, Inventory controlled Inventory controlled construction in 10% cost of capital progress, finished assumed homesites, deposits 75% and ACORE, and $35.8B total land pipeline 15% cost of equity 8% assumed 48% 5% cost of debt $17.3B On balance sheet 40% (Inventory owned + 15% cost of equity Deposits and ACORE) assumed 1 Homebuilding Assets Needed Pre-Transformation Post-Transformation (Land on balance sheet) (Asset-light) For Current + Future Growth Opportunity Ahead: Continue to optimize our cost of capital through share repurchases and lower land banking costs. 7 7 Note: as of Q1 2026 1. ~16% homebuilding debt to capital; 2. Estimated total capital outlay by land banks as of 2/28/26
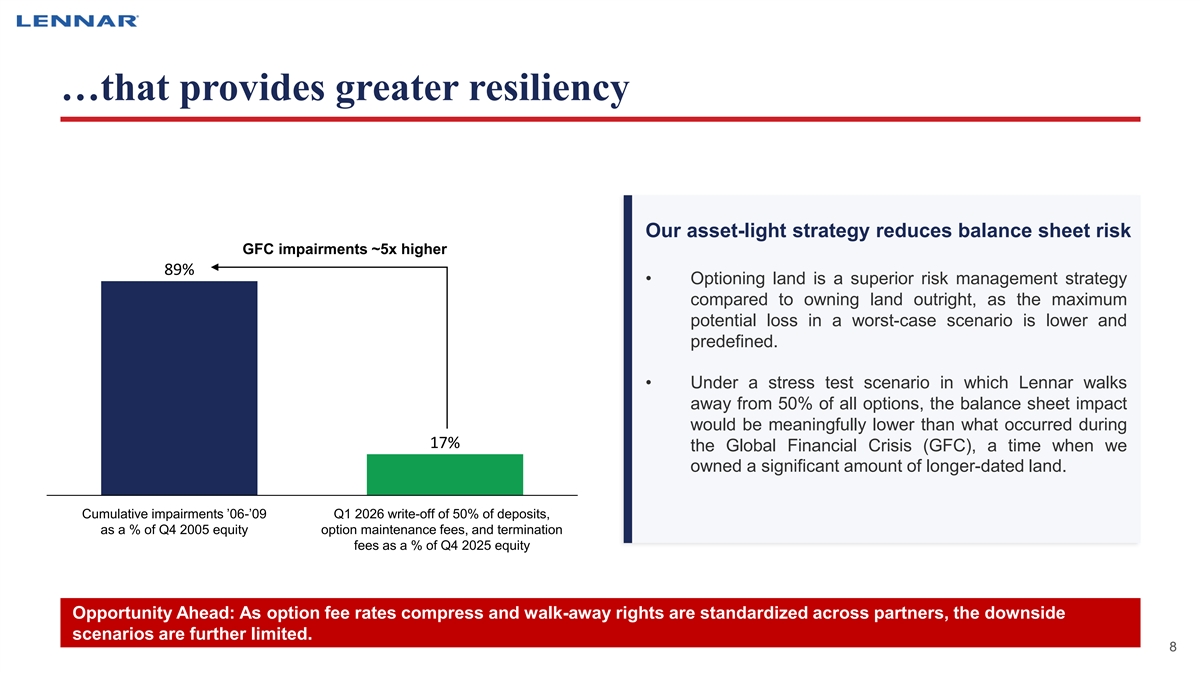
…that provides greater resiliency Our asset-light strategy reduces balance sheet risk GFC impairments ~5x higher 89% • Optioning land is a superior risk management strategy compared to owning land outright, as the maximum potential loss in a worst-case scenario is lower and predefined. • Under a stress test scenario in which Lennar walks away from 50% of all options, the balance sheet impact would be meaningfully lower than what occurred during 17% the Global Financial Crisis (GFC), a time when we owned a significant amount of longer-dated land. Cumulative impairments ’06-’09 Q1 2026 write-off of 50% of deposits, as a % of Q4 2005 equity option maintenance fees, and termination fees as a % of Q4 2025 equity Opportunity Ahead: As option fee rates compress and walk-away rights are standardized across partners, the downside scenarios are further limited. 8 8
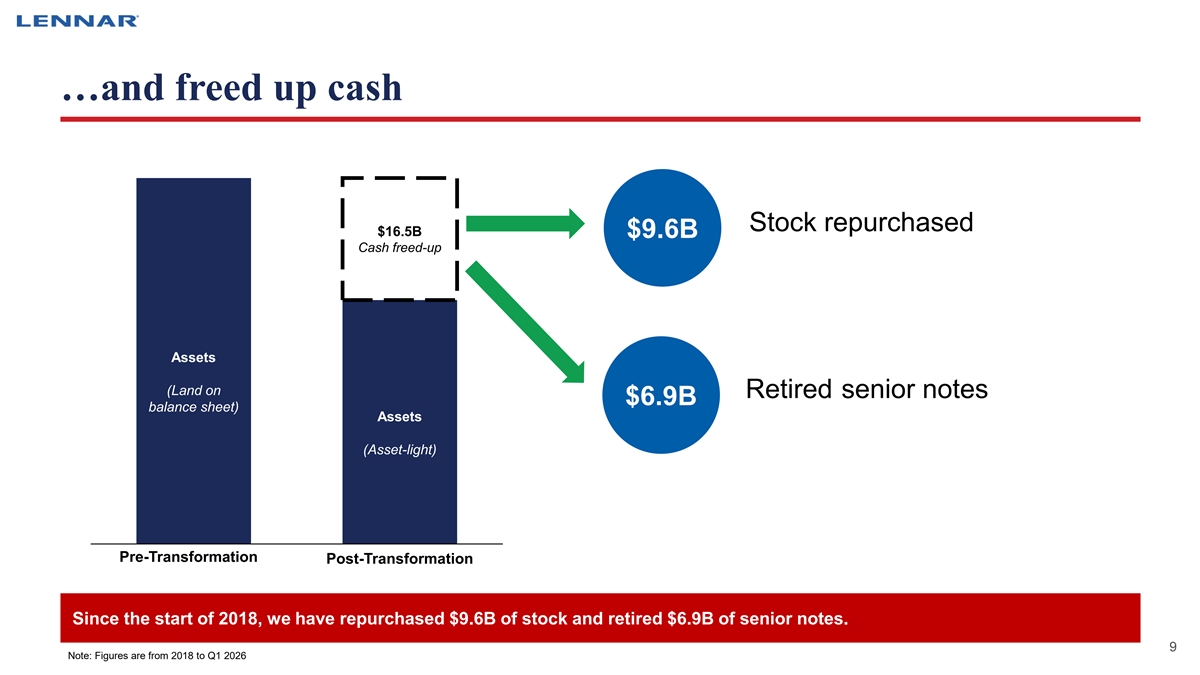
…and freed up cash • Stock repurchased $16.5B $9.6B Cash freed-up Assets (Land on • Retired senior notes $6.9B balance sheet) Assets (Asset-light) Pre-Transformation Post-Transformation Since the start of 2018, we have repurchased $9.6B of stock and retired $6.9B of senior notes. 9 9 Note: Figures are from 2018 to Q1 2026
WE ARE FOCUSED ON RETURNS ON CAPITAL 3 AND EQUITY 10 10
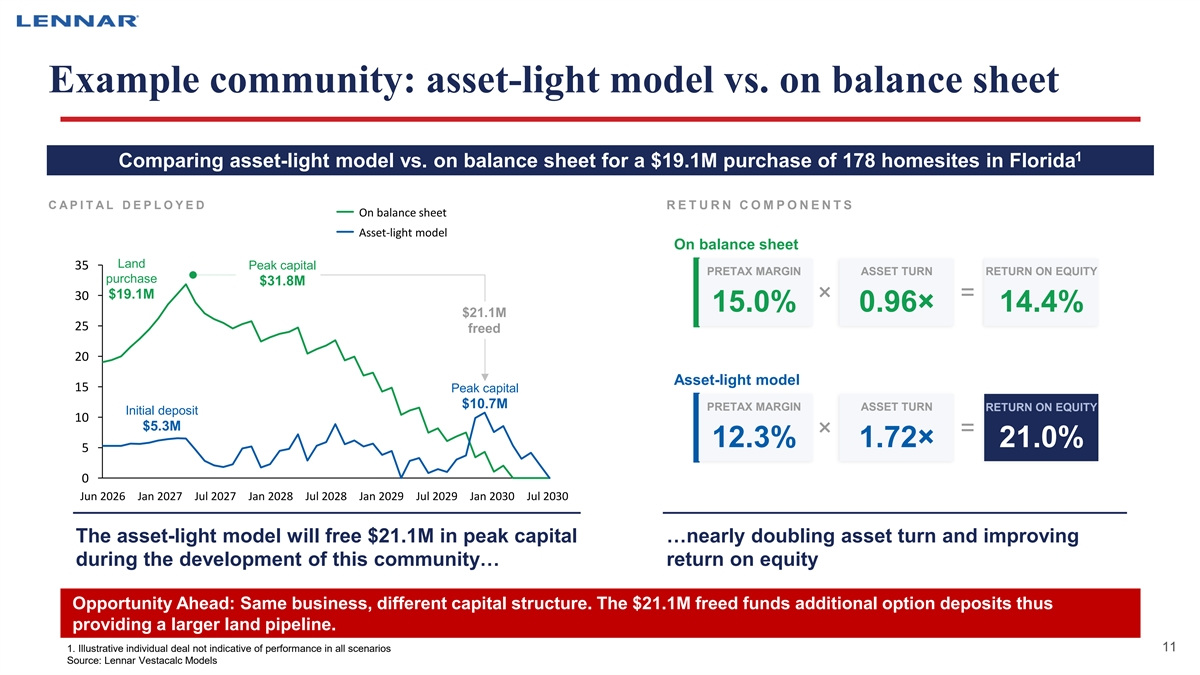
Example community: asset-light model vs. on balance sheet 1 Comparing asset-light model vs. on balance sheet for a $19.1M purchase of 178 homesites in Florida C A P I T A L D E P L O Y E D R E T U R N C O M P O N E N T S On balance sheet Asset-light model On balance sheet Land 35 Peak capital PRETAX MARGIN ASSET TURN RETURN ON EQUITY purchase $31.8M $19.1M 30 × = 15.0% 0.96× 14.4% $21.1M 25 freed 20 Asset-light model 15 Peak capital $10.7M PRETAX MARGIN ASSET TURN RETURN ON EQUITY Initial deposit 10 $5.3M × = 12.3% 1.72× 21.0% 5 0 Jun 2026 Jan 2027 Jul 2027 Jan 2028 Jul 2028 Jan 2029 Jul 2029 Jan 2030 Jul 2030 The asset-light model will free $21.1M in peak capital …nearly doubling asset turn and improving during the development of this community… return on equity Opportunity Ahead: Same business, different capital structure. The $21.1M freed funds additional option deposits thus providing a larger land pipeline. 11 11 1. Illustrative individual deal not indicative of performance in all scenarios Source: Lennar Vestacalc Models
WE ARE FOCUSED ON VOLUME AND ARE POSITIONED 4 TO CONTINUE GROWTH 12 12
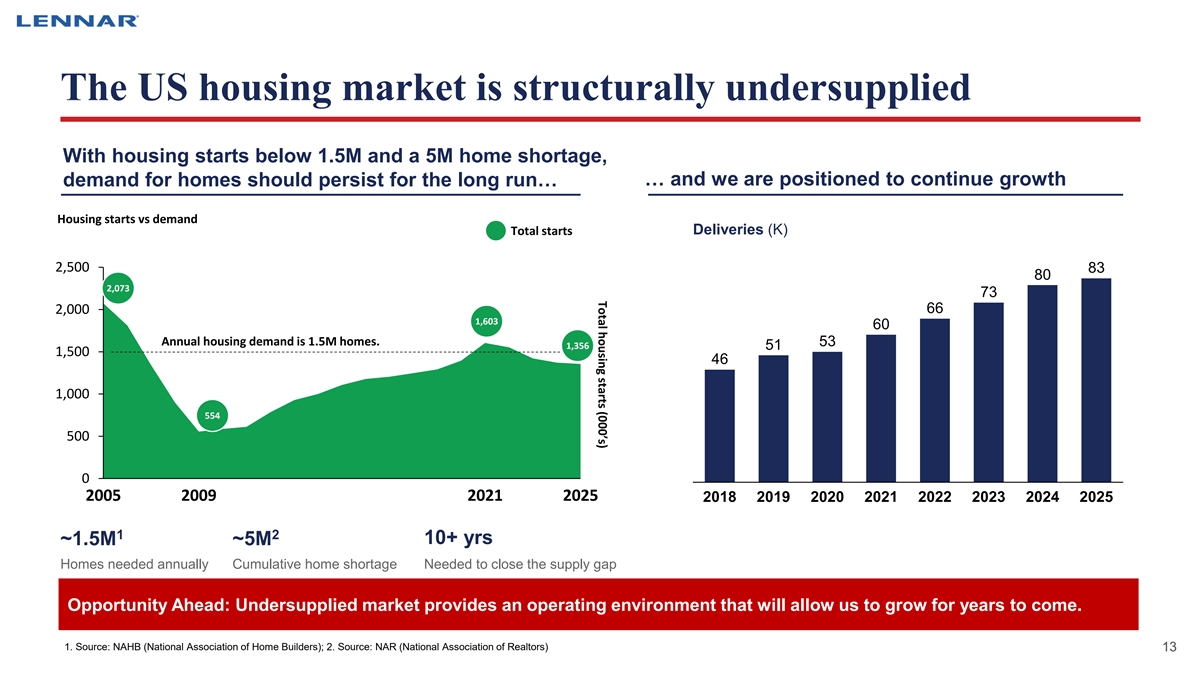
Total housing starts (000’s) The US housing market is structurally undersupplied With housing starts below 1.5M and a 5M home shortage, demand for homes should persist for the long run… … and we are positioned to continue growth Housing starts vs demand Total starts Deliveries (K) 2,500 83 80 2,073 73 2,000 66 1,603 60 Annual housing demand is 1.5M homes. 53 1,356 51 1,500 46 1,000 554 500 0 2005 2009 2021 2025 2018 2019 2020 2021 2022 2023 2024 2025 1 2 10+ yrs ~1.5M ~5M Homes needed annually Cumulative home shortage Needed to close the supply gap Opportunity Ahead: Undersupplied market provides an operating environment that will allow us to grow for years to come. 1. Source: NAHB (National Association of Home Builders); 2. Source: NAR (National Association of Realtors) 13 13
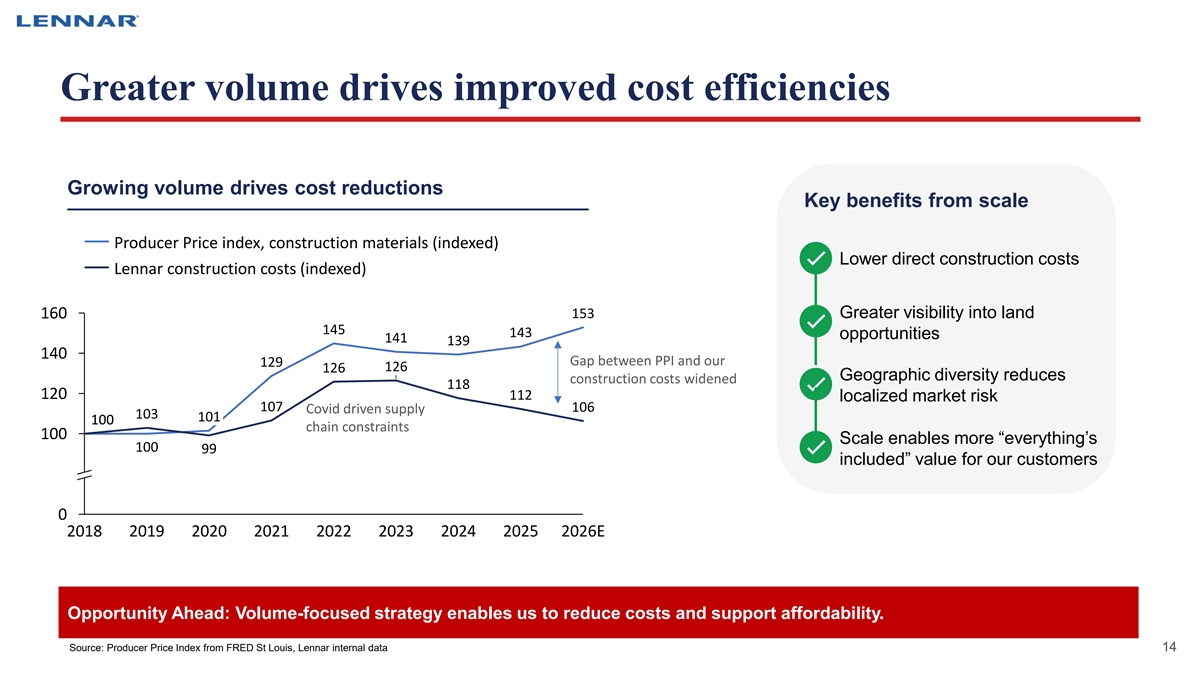
Greater volume drives improved cost efficiencies Growing volume drives cost reductions Key benefits from scale Producer Price index, construction materials (indexed) Lower direct construction costs Lennar construction costs (indexed) 160 153 Greater visibility into land 145 143 opportunities 141 139 140 Gap between PPI and our 129 126 126 Geographic diversity reduces construction costs widened 118 120 112 localized market risk 107 106 Covid driven supply 103 101 100 100 chain constraints 100 Scale enables more “everything’s 100 99 included” value for our customers 0 2018 2019 2020 2021 2022 2023 2024 2025 2026E Opportunity Ahead: Volume-focused strategy enables us to reduce costs and support affordability. Source: Producer Price Index from FRED St Louis, Lennar internal data 14 14
As we scale, our core values remain our north star Our core values since 1954 QUALITY VALUE INTEGRITY Building quality homes with Delivering more value at a Always with the highest more included features lower cost to our customers level of integrity Opportunity Ahead: Continue to drive costs down and deliver more value at a better price for our customers. 15
WE ARE DRIVING 5 EVEN-FLOW PRODUCTION 16 16
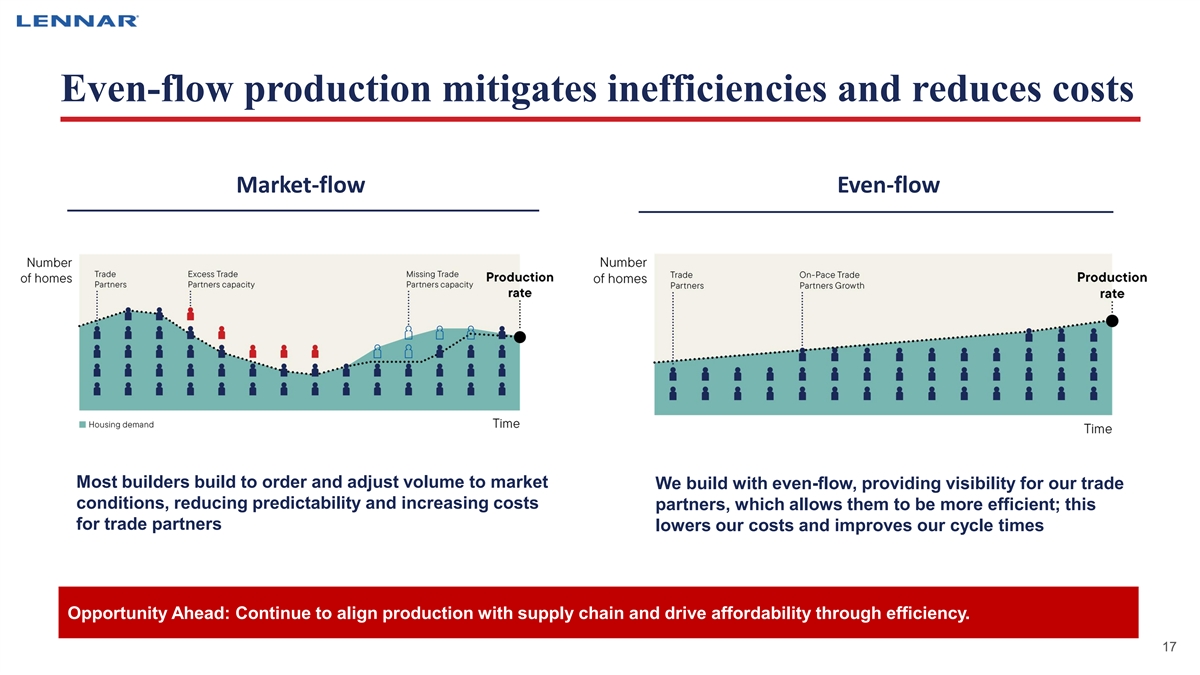
Even-flow production mitigates inefficiencies and reduces costs Market-flow Even-flow Most builders build to order and adjust volume to market We build with even-flow, providing visibility for our trade conditions, reducing predictability and increasing costs partners, which allows them to be more efficient; this for trade partners lowers our costs and improves our cycle times Opportunity Ahead: Continue to align production with supply chain and drive affordability through efficiency. 17 17
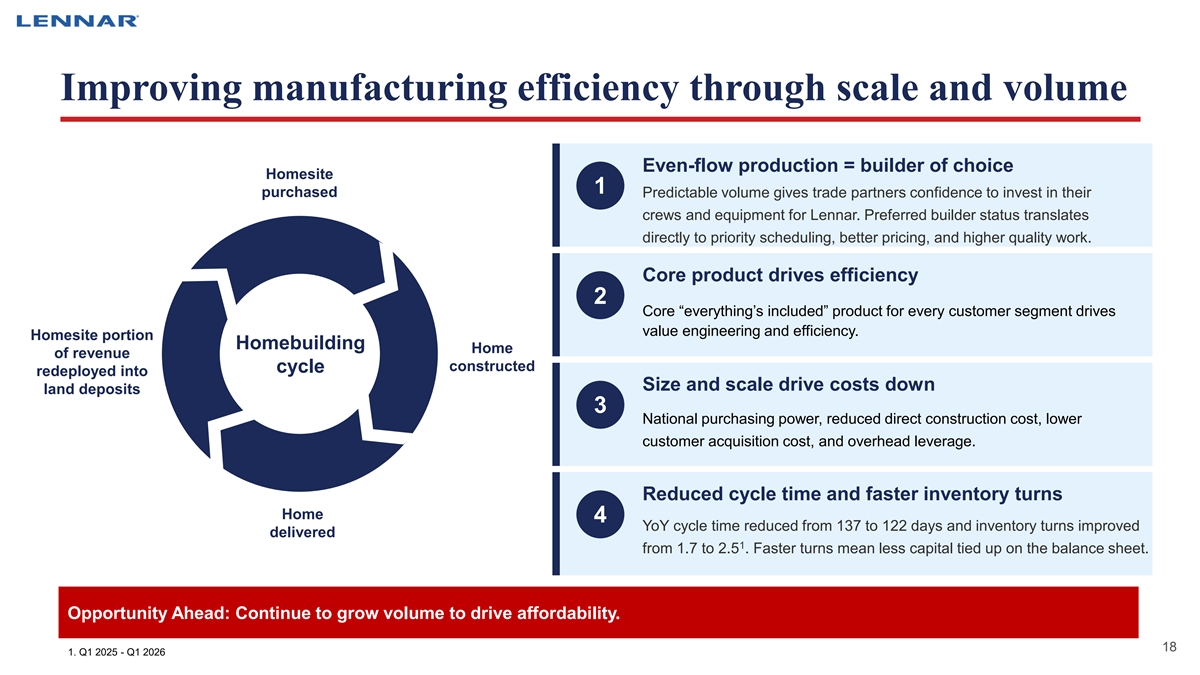
Improving manufacturing efficiency through scale and volume Even-flow production = builder of choice Homesite 1 purchased Predictable volume gives trade partners confidence to invest in their crews and equipment for Lennar. Preferred builder status translates directly to priority scheduling, better pricing, and higher quality work. Core product drives efficiency 2 Core “everything’s included” product for every customer segment drives value engineering and efficiency. Homesite portion Homebuilding Home of revenue constructed cycle redeployed into Size and scale drive costs down land deposits 3 National purchasing power, reduced direct construction cost, lower customer acquisition cost, and overhead leverage. Reduced cycle time and faster inventory turns Home 4 YoY cycle time reduced from 137 to 122 days and inventory turns improved delivered 1 from 1.7 to 2.5 . Faster turns mean less capital tied up on the balance sheet. Opportunity Ahead: Continue to grow volume to drive affordability. 18 18 1. Q1 2025 - Q1 2026
WE ARE TRANSFORMING OUR BUSINESS WITH TECHNOLOGY 6 TO ENABLE EFFICIENCIES 19 19
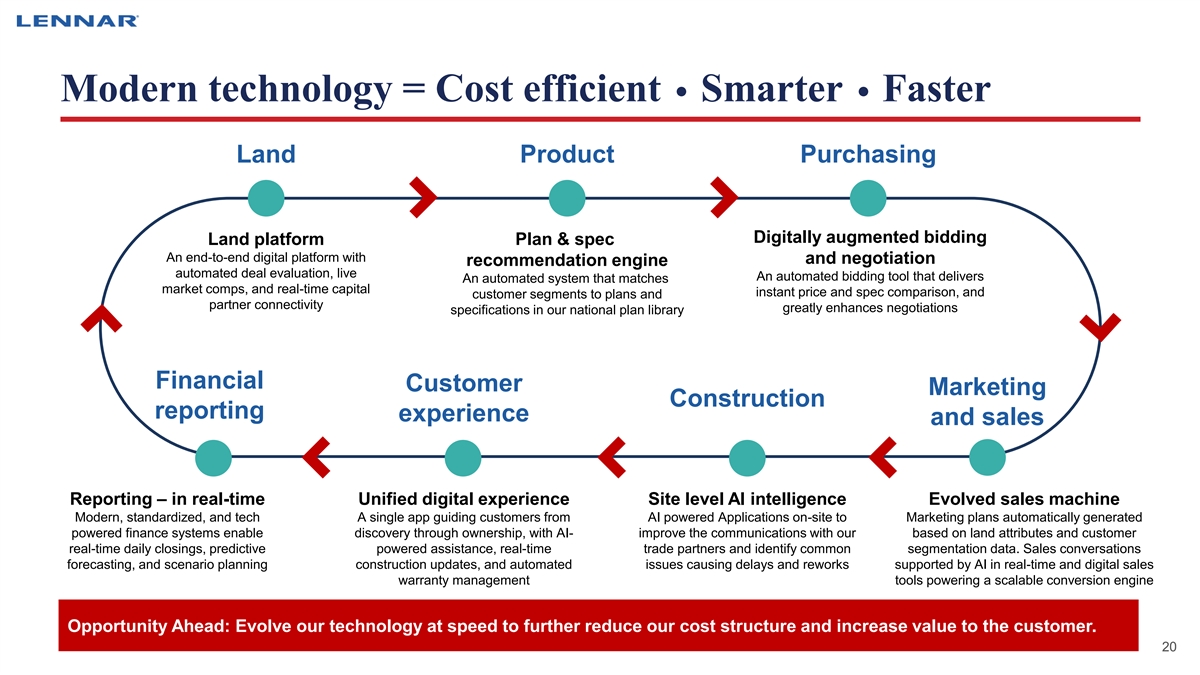
Modern technology = Cost efficient Smarter Faster Land Product Purchasing Digitally augmented bidding Land platform Plan & spec An end-to-end digital platform with and negotiation recommendation engine automated deal evaluation, live An automated bidding tool that delivers An automated system that matches market comps, and real-time capital instant price and spec comparison, and customer segments to plans and partner connectivity greatly enhances negotiations specifications in our national plan library Financial Customer Marketing Construction reporting experience and sales Reporting – in real-time Unified digital experience Site level AI intelligence Evolved sales machine Modern, standardized, and tech A single app guiding customers from AI powered Applications on-site to Marketing plans automatically generated powered finance systems enable discovery through ownership, with AI- improve the communications with our based on land attributes and customer real-time daily closings, predictive powered assistance, real-time trade partners and identify common segmentation data. Sales conversations forecasting, and scenario planning construction updates, and automated issues causing delays and reworks supported by AI in real-time and digital sales warranty management tools powering a scalable conversion engine Opportunity Ahead: Evolve our technology at speed to further reduce our cost structure and increase value to the customer. 20 20
OUR CONTROLLED LAND + MANUFACTURING MODEL 7 IS OUR MOAT 21 21
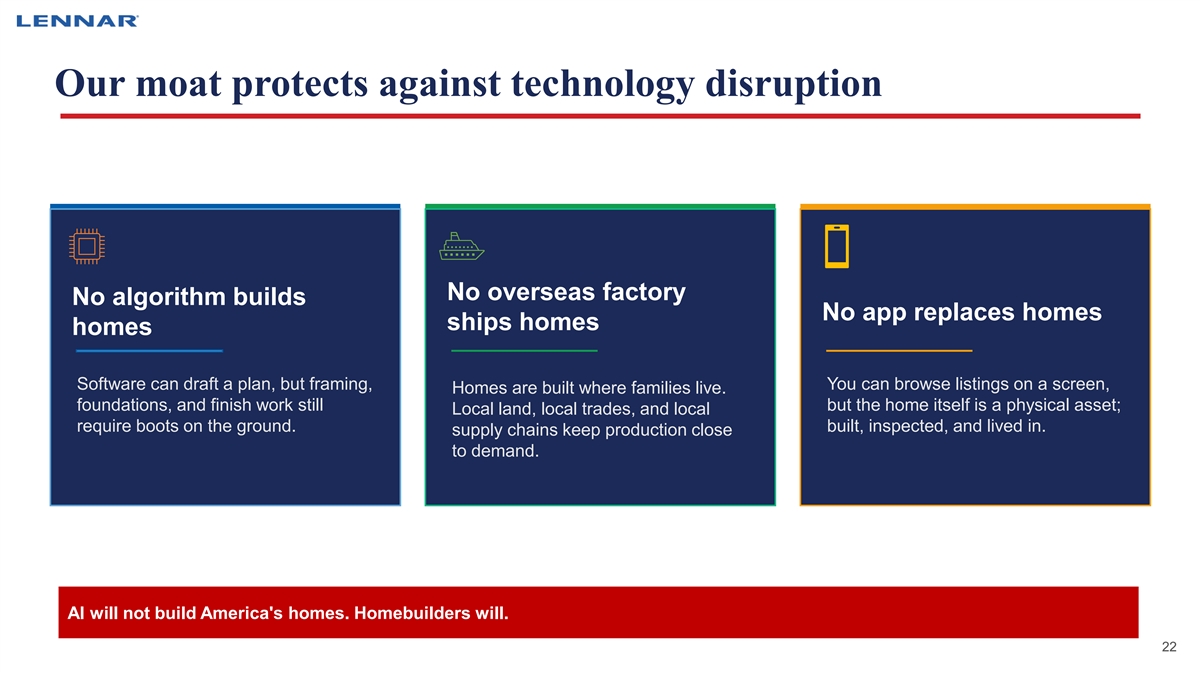
Our moat protects against technology disruption No overseas factory No algorithm builds No app replaces homes ships homes homes Software can draft a plan, but framing, You can browse listings on a screen, Homes are built where families live. foundations, and finish work still but the home itself is a physical asset; Local land, local trades, and local require boots on the ground. built, inspected, and lived in. supply chains keep production close to demand. AI will not build America's homes. Homebuilders will. 22 22
OUR SHARE PRICE DOES NOT REFLECT THE IMPACT 8 OF OUR TRANSFORMATION 23 23
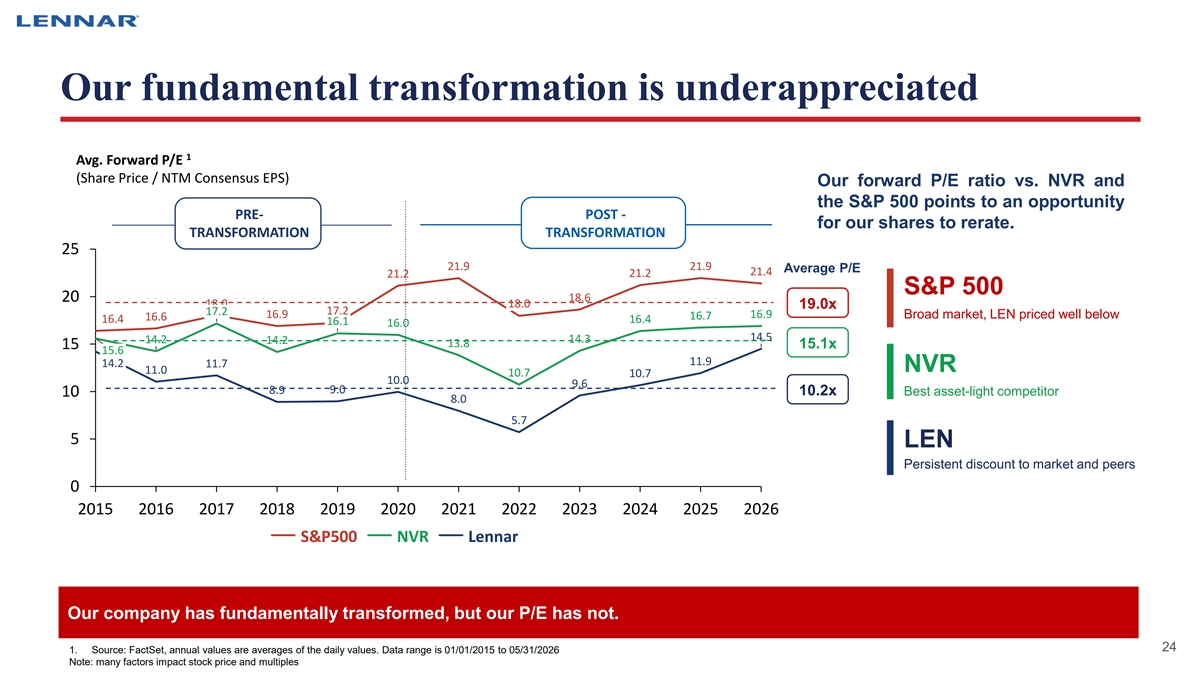
Our fundamental transformation is underappreciated NEW LENNAR 1 Avg. Forward P/E (Share Price / NTM Consensus EPS) Our forward P/E ratio vs. NVR and the S&P 500 points to an opportunity PRE- POST - for our shares to rerate. TRANSFORMATION TRANSFORMATION 21.4x 25 21.9 21.9 Average P/E 21.4 21.2 21.2 S&P 500 18.6 20 18.0 18.0 19.0x 16.8x 17.2 17.2 16.9 16.9 Broad market, LEN priced well below 16.7 16.6 16.4 16.4 16.1 16.0 14.5 14.3 14.2 14.2 13.8 15 15.1x 15.6 11.9 14.2 11.7 NVR 11.0 10.7 10.7 10.0 9.6 8.9 9.0 10.2x 10 Best asset-light competitor 8.0 5.7 5 LEN Persistent discount to market and peers 0 2015 2016 2017 2018 2019 2020 2021 2022 2023 2024 2025 2026 S&P500 NVR Lennar Our company has fundamentally transformed, but our P/E has not. 24 1. Source: FactSet, annual values are averages of the daily values. Data range is 01/01/2015 to 05/31/2026 Note: many factors impact stock price and multiples

CONCLUDING THOUGHTS 9 25 25
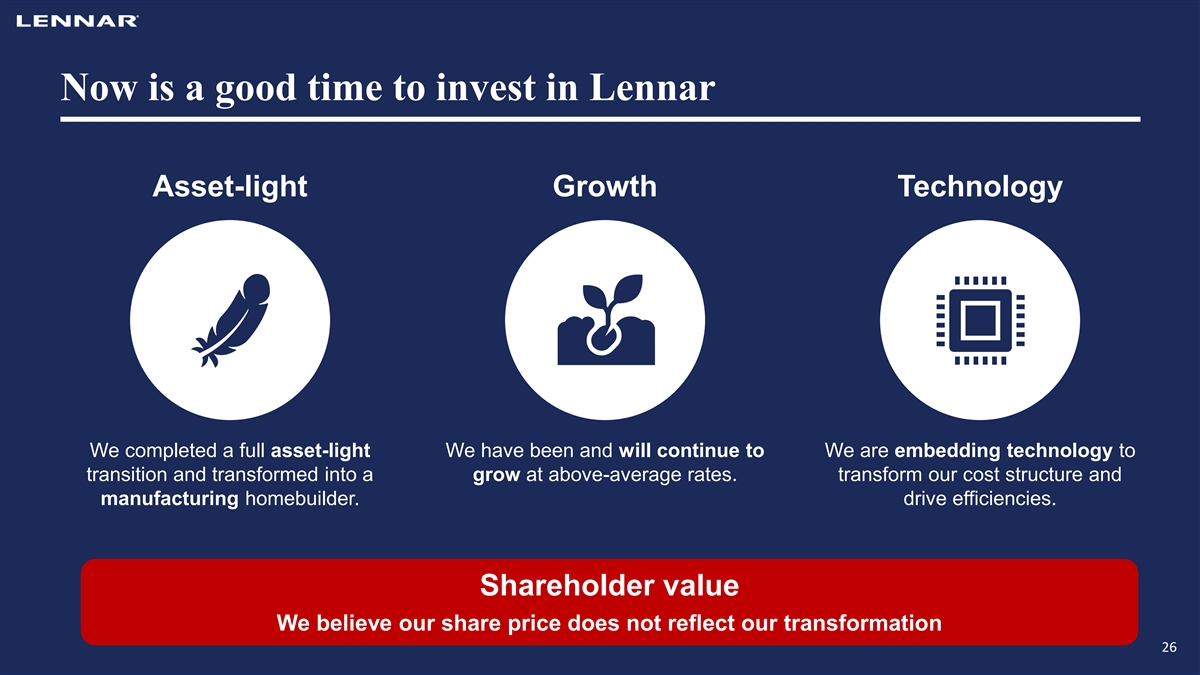
Now is a good time to invest in Lennar Asset-light Growth Technology We completed a full asset-light We have been and will continue to We are embedding technology to transition and transformed into a grow at above-average rates. transform our cost structure and manufacturing homebuilder. drive efficiencies. Shareholder value We believe our share price does not reflect our transformation 26
Forward-Looking Statements This presentation includes “forward-looking statements,” as defined in the Private Securities Litigation Reform Act of 1995. These forward- looking statements include statements regarding our business, financial condition, results of operations, cash flows, strategies and The three pillars of our transformation prospects. You can identify forward-looking statements by the fact that these statements do not relate strictly to historical or current matters. Rather, forward-looking statements relate to anticipated or expected events, activities, trends or results. Because forward-looking statements relate to matters that have not yet occurred, these statements are inherently subject to risks and uncertainties. Many factors could cause our actual activities or results to differ materially from the activities and results anticipated in forward-looking statements. These factors include those described in our Securities and Exchange Commission filings, including those under the caption “Risk Factors” in our most recent Annual Report on Form 10-K and Quarterly Reports on Form 10-Q filed with the Securities and Exchange Commission. We do not undertake any obligation to update forward-looking statements, whether as a result of new information, future events, or otherwise. This presentation includes macro-economic and market share information that was obtained from independent sources. While we believe those sources are reliable and we have no reason to think that the information we have included is not accurate, we were not involved in developing the information that was obtained from independent sources, and do not have the ability to confirm its accuracy. Therefore, we cannot be responsible for the accuracy of information we obtained from independent sources. 27