Pay vs Performance Disclosure - USD ($)
Mar. 31, 2026
Mar. 31, 2025
Mar. 31, 2024
Mar. 31, 2023
Mar. 31, 2022
Pay Versus Performance
We are providing the following information about the relationship between “compensation actually paid” to our named executive officers and certain financial performance as required by Section 953(a) of the Dodd-Frank Wall Street Reform and Consumer Protection Act, and Item 402(v) of Regulation
S-K.
Please see the Compensation Discussion and Analysis for additional information regarding our executive compensation program. PAY VERSUS PERFORMANCE(1) | |||||||||||||||||||||||||||||||||||||||||||||||||||||||
Year (a) |
Summary Compen- sation Table (“SCT”) Total for PEO (Carestio) (b) |
SCT Total for PEO (Rosebrough) (b) |
Compensation Actually Paid to PEO (Carestio) (c)(2) |
Compensation Actually Paid to PEO (Rosebrough) (c)(2) |
Average SCT Total for Non-PEO Named Executive Officers (d) |
Average Compen- sation Actually Paid to Non-PEO Named Executive Officers (e)(2) |
Value of Initial Fixed $100 Investment Based On: |
Net millionsIncome – in (i)(6) |
Adjusted EBIT – in (j)(7) | ||||||||||||||||||||||||||||||||||||||||||||||
Total Share- holder Return (f)(3) |
PVP Peer Group Total Share- holder Return (g)(4) |
Prior Peer Group Total Share- holder Return (h)(5) | |||||||||||||||||||||||||||||||||||||||||||||||||||||
2026 |
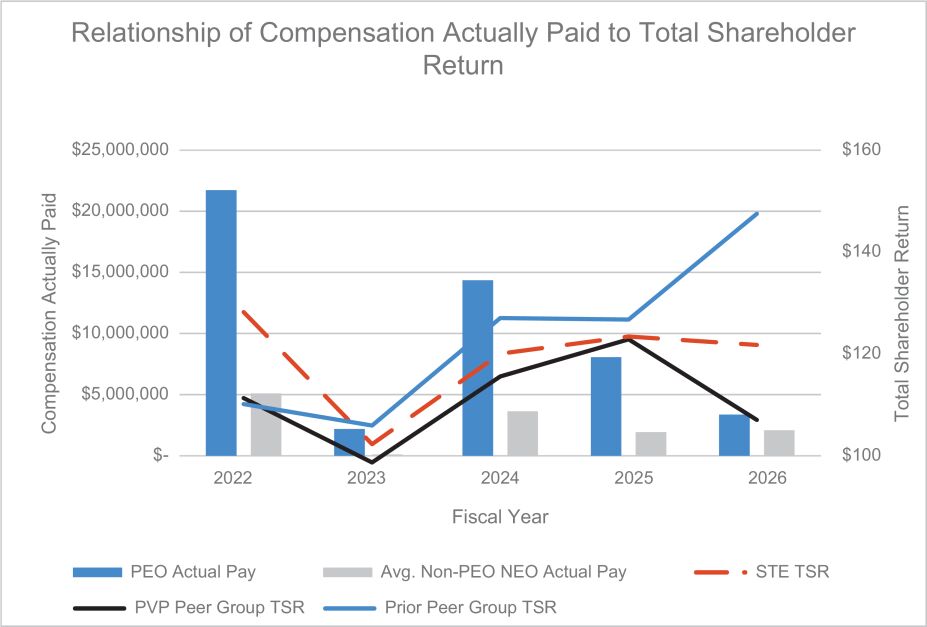
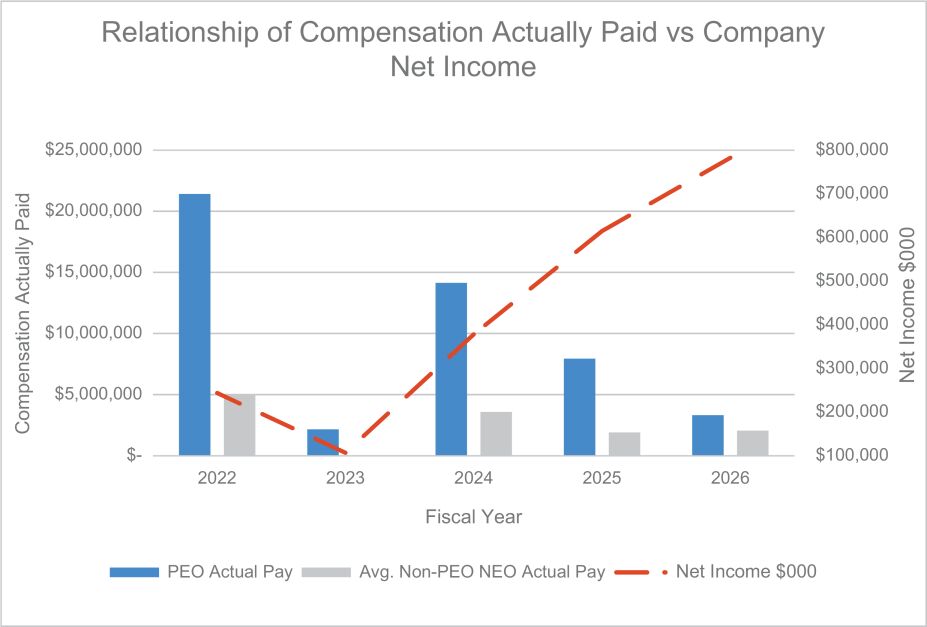
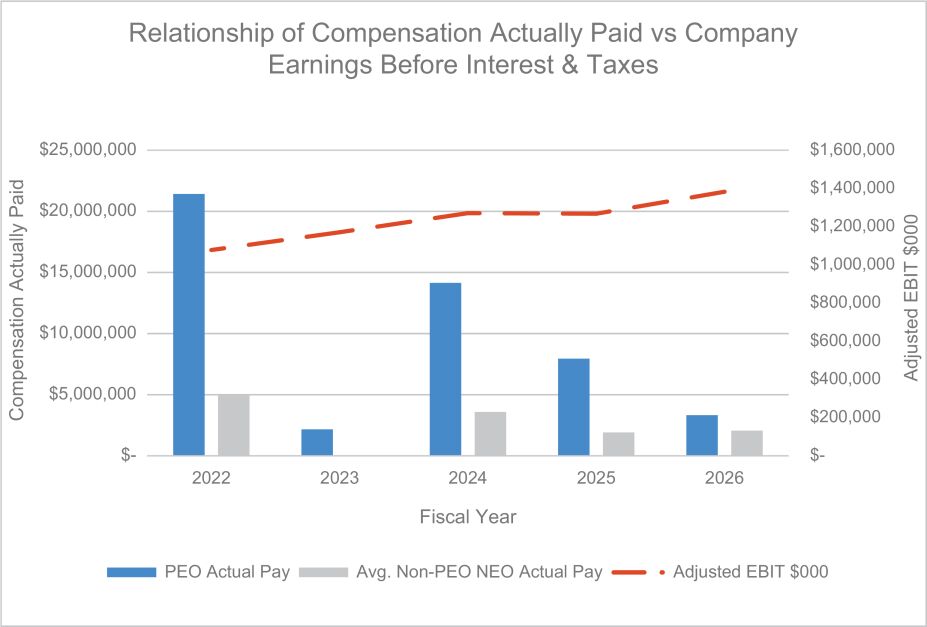
$ | 11,508,522 | — | $ | 3,321,857 | — | $ | 2,580,204 | $ | 2,064,220 | $ | 121.45 | $ | 106.94 | $ | 146.82 | $ | 782.3 | $ | 1,382.0 | |||||||||||||||||||||||||||||||||||
2025 |
$ | 10,673,062 | — | $ | 7,946,737 | — | $ | 2,590,199 | $ | 1,912,845 | $ | 123.06 | $ | 122.54 | $ | 126.34 | $ | 614.6 | $ | 1,286.7 | |||||||||||||||||||||||||||||||||||
2024 |
$ | 9,550,776 | — | $ | 14,143,349 | — | $ | 2,468,192 | $ | 3,588,373 | $ | 119.77 | $ | 115.34 | $ | 126.64 | $ | 378.2 | $ | 1,270.4 | |||||||||||||||||||||||||||||||||||
2023 |
$ | 7,740,184 | — | $ | 2,167,818 | — | $ | 2,053,642 | $ | 15,524 | $ | 102.25 | $ | 98.74 | $ | 105.87 | $ | 107.0 | $ | 1,170.0 | |||||||||||||||||||||||||||||||||||
2022 |
$ | 5,903,168 | $ | 1,156,398 | $ | 11,823,596 | $ | 9,584,917 | $ | 2,354,427 | $ | 5,031,228 | $ | 127.81 | $ | 111.17 | $ | 110.01 | $ | 243.9 | $ | 1,076.8 | |||||||||||||||||||||||||||||||||
| (1) | Daniel A. Carestio was our principal executive officer (“PEO”) for the full year for fiscal 2026, 2025, 2024 and 2023 and from July 29, 2021 through the end of fiscal year 2022. Walter M Rosebrough, Jr. was our PEO from the beginning of fiscal year 2022 until July 29, 2021. For fiscal year 2026, our non-PEO named executive officers were Karen L. Burton, Michael J. Tokich, J. Adam Zangerle, Cary L. Majors, and Mary Clare Fraser. For fiscal year 2025, 2024, and 2023, our non-PEO named executive officers were Michael J. Tokich, J. Adam Zangerle, Cary L. Majors and Mary Clare Fraser. For fiscal 2022, our non-PEO named executive officers were Michael J. Tokich, J. Adam Zangerle, Cary L. Majors and Andrew Xilas. |
| (2) | For each of fiscal 2026, 2025, 2024, 2023 and 2022 (each, a “Covered Year”), in determining both the “compensation actually paid” to our PEOs and the average “compensation actually paid” to our non-PEO named executive officers for purposes of this Pay Versus Performance table (“PVP Table”), we deducted from or added to the total amounts of compensation reported in columns (b) and (d) for such Covered Year the following amounts: |
Item and Value Added (Deducted) |
2026 |
2025 |
2024 |
2023 |
2022 |
|||||||||||||||
For Daniel A. Carestio (as PEO) |
||||||||||||||||||||
- SCT “Stock Awards” column value |
$ |
(4,333,951 |
) |
$ |
(2,935,997 |
) |
$ |
(2,584,412 |
) |
$ |
(2,154,084 |
) |
$ |
(1,397,772 |
) | |||||
- SCT “Option Awards” column value |
$ |
(4,334,251 |
) |
$ |
(5,452,847 |
) |
$ |
(4,800,238 |
) |
$ |
(4,000,598 |
) |
$ |
(2,870,787 |
) | |||||
+ year-end fair value of outstanding equity awards granted in Covered Year |
$ |
1,032,773 |
$ |
8,365,073 |
$ |
9,135,555 |
$ |
4,709,722 |
$ |
7,347,026 |
||||||||||
+/- change in fair value of outstanding equity awards granted in prior years |
$ |
(550,138 |
) |
$ |
(1,828,775 |
) |
$ |
2,094,239 |
$ |
(3,235,090 |
) |
$ |
2,796,409 |
|||||||
+ vesting date fair value of equity awards granted and vested in Covered Year |
— |
— |
— |
— |
— |
|||||||||||||||
+/- change in fair value of prior-year equity awards vested in Covered Year |
$ |
(82,758 |
) |
$ |
(936,547 |
) |
$ |
696,910 |
$ |
(950,771 |
) |
$ |
12,373 |
|||||||
- prior year-end fair value of prior-year equity awards forfeited in Covered Year |
— |
— |
— |
— |
— |
|||||||||||||||
+ includable dividends/earnings on equity awards during Covered Year |
$ |
81,660 |
$ |
62,768 |
$ |
50,518 |
$ |
58,455 |
$ |
33,179 |
||||||||||
TOTAL ADDED (DEDUCTED): |
$ |
(8,186,665 |
) |
$ |
(2,726,325 |
) |
$ |
4,592,573 |
$ |
(5,572,366 |
) |
$ |
5,920,428 |
|||||||
For Walter M Rosebrough, Jr. (as PEO) |
||||||||||||||||||||
- SCT “Stock Awards” column value |
— |
— |
— |
— |
— |
|||||||||||||||
- SCT “Option Awards” column value |
— |
— |
— |
— |
— |
|||||||||||||||
+ year-end fair value of outstanding equity awards granted in Covered Year |
— |
— |
— |
— |
— |
|||||||||||||||
+/- change in fair value of outstanding equity awards granted in prior years |
— |
— |
— |
— |
$ |
8,482,009 |
||||||||||||||
+ vesting date fair value of equity awards granted and vested in Covered Year |
— |
— |
— |
— |
— |
|||||||||||||||
+/- change in fair value of prior-year equity awards vested in Covered Year |
— |
— |
— |
— |
$ |
(87,822 |
) | |||||||||||||
- prior year-end fair value of prior-year equity awards forfeited in Covered Year |
— |
— |
— |
— |
— |
|||||||||||||||
+ includable dividends/earnings on equity awards during Covered Year |
— |
— |
— |
— |
$ |
34,333 |
||||||||||||||
TOTAL ADDED (DEDUCTED): |
— |
— |
— |
— |
$ |
8,428,520 |
||||||||||||||
For Non-PEO Named Executive Officers (Average): |
||||||||||||||||||||
- SCT “Stock Awards” column value |
$ |
(763,492 |
) |
$ |
(683,787 |
) |
$ |
(617,907 |
) |
$ |
(557,389 |
) |
$ |
(527,733 |
) | |||||
- SCT “Option Awards” column value |
$ |
(777,480 |
) |
$ |
(1,004,053 |
) |
$ |
(1,096,527 |
) |
$ |
(814,151 |
) |
$ |
(843,644 |
) | |||||
+ year-end fair value of outstanding equity awards granted in Covered Year |
$ |
1,354,469 |
$ |
1,682,303 |
$ |
1,988,028 |
$ |
1,058,610 |
$ |
2,282,600 |
||||||||||
+/- change in fair value of outstanding equity awards granted in prior years |
$ |
(318,589 |
) |
$ |
(406,244 |
) |
$ |
644,655 |
$ |
(1,380,326 |
) |
$ |
1,754,107 |
|||||||
+ vesting date fair value of equity awards granted and vested in Covered Year |
— |
— |
— |
— |
— |
|||||||||||||||
+/- change in fair value of prior-year equity awards vested in Covered Year |
$ |
(30,137 |
) |
$ |
(285,699 |
) |
$ |
182,705 |
$ |
(365,275 |
) |
$ |
(5,442 |
) | ||||||
- prior year-end fair value of prior-year equity awards forfeited in Covered Year |
— |
— |
— |
— |
— |
|||||||||||||||
+ includable dividends/earnings on equity awards during Covered Year |
$ |
19,245 |
$ |
20,126 |
$ |
19,227 |
$ |
20,412 |
$ |
16,913 |
||||||||||
TOTAL ADDED (DEDUCTED): |
$ |
(515,984 |
) |
$ |
(677,354 |
) |
$ |
1,120,181 |
$ |
(2,038,119 |
) |
$ |
2,676,801 |
|||||||
| (3) | For each Covered Year, our total shareholder return was calculated as the yearly percentage change in our cumulative total shareholder return on our Ordinary Shares measured as the quotient of (a) the sum of (i) the cumulative amount of dividends for the period beginning with our closing price on NYSE on March 31, 2021 through and including the last day of the Covered Year (each period is a “Measurement Period”), assuming dividend reinvestment, plus (ii) the difference between our closing stock price at the end versus the beginning of the Measurement Period divided by (b) our closing share price at the beginning of the Measurement Period. Each of these yearly percentage changes was then applied to a deemed fixed investment of $100 at the beginning of the Measurement Period to produce the Covered Year-end values of such investment as of the end of fiscal 2026, 2025, 2024, 2023, and 2022 as applicable. Because Covered Years are presented in the table in reverse chronical order (from top to bottom), the table should be read from bottom to top for purposes of understanding cumulative returns over time. |
| (4) | For purposes of this Pay Versus Performance disclosure, our peer group is the S&P 500 Healthcare Equipment Index (the “PVP Peer Group”). The Company changed its peer group as we believe the S&P 500 Healthcare Equipment Index provides a more accurate representation of our industry peers compared to the Dow Jones U.S. Medical Supplies Index. For each Covered Year, the PVP Peer Group cumulative total shareholder return was calculated based on a deemed fixed investment of $100 in the index through each Measurement Period, assuming dividend reinvestment for . |
| (5) | The peer group referenced for purposes of the TSR comparison is the Dow Jones U.S. Medical Supplies Index (the “Prior PVP Peer Group”). As required, the table includes our cumulative TSR compared to both the PVP Peer Group and the Prior PVP Peer Group. |
| (6) | Net income is calculated in accordance with U.S. GAAP. |
| (7) | Adjusted EBIT is a non-GAAP measure calculated as earnings before interest and taxes, excluding the effects of amounts related to certain special items, as described in the Compensation Discussion and Analysis. The financial metric is used in the determination of attainment percentages under our annual MICP plan. See the section in the Compensation Discussion and Analysis above titled “2026 Compensation Decisions” for more information. |
non-PEO
named executive officers were Karen L. Burton, Michael J. Tokich, J. Adam Zangerle, Cary L. Majors, and Mary Clare Fraser. For fiscal year 2025, 2024, and 2023, our non-PEO
named executive officers were Michael J. Tokich, J. Adam Zangerle, Cary L. Majors and Mary Clare Fraser. For fiscal 2022, our non-PEO
named executive officers were Michael J. Tokich, J. Adam Zangerle, Cary L. Majors and Andrew Xilas.
.
| (2) | For each of fiscal 2026, 2025, 2024, 2023 and 2022 (each, a “Covered Year”), in determining both the “compensation actually paid” to our PEOs and the average “compensation actually paid” to our non-PEO named executive officers for purposes of this Pay Versus Performance table (“PVP Table”), we deducted from or added to the total amounts of compensation reported in columns (b) and (d) for such Covered Year the following amounts: |
Item and Value Added (Deducted) |
2026 |
2025 |
2024 |
2023 |
2022 |
|||||||||||||||
For Daniel A. Carestio (as PEO) |
||||||||||||||||||||
- SCT “Stock Awards” column value |
$ |
(4,333,951 |
) |
$ |
(2,935,997 |
) |
$ |
(2,584,412 |
) |
$ |
(2,154,084 |
) |
$ |
(1,397,772 |
) | |||||
- SCT “Option Awards” column value |
$ |
(4,334,251 |
) |
$ |
(5,452,847 |
) |
$ |
(4,800,238 |
) |
$ |
(4,000,598 |
) |
$ |
(2,870,787 |
) | |||||
+ year-end fair value of outstanding equity awards granted in Covered Year |
$ |
1,032,773 |
$ |
8,365,073 |
$ |
9,135,555 |
$ |
4,709,722 |
$ |
7,347,026 |
||||||||||
+/- change in fair value of outstanding equity awards granted in prior years |
$ |
(550,138 |
) |
$ |
(1,828,775 |
) |
$ |
2,094,239 |
$ |
(3,235,090 |
) |
$ |
2,796,409 |
|||||||
+ vesting date fair value of equity awards granted and vested in Covered Year |
— |
— |
— |
— |
— |
|||||||||||||||
+/- change in fair value of prior-year equity awards vested in Covered Year |
$ |
(82,758 |
) |
$ |
(936,547 |
) |
$ |
696,910 |
$ |
(950,771 |
) |
$ |
12,373 |
|||||||
- prior year-end fair value of prior-year equity awards forfeited in Covered Year |
— |
— |
— |
— |
— |
|||||||||||||||
+ includable dividends/earnings on equity awards during Covered Year |
$ |
81,660 |
$ |
62,768 |
$ |
50,518 |
$ |
58,455 |
$ |
33,179 |
||||||||||
TOTAL ADDED (DEDUCTED): |
$ |
(8,186,665 |
) |
$ |
(2,726,325 |
) |
$ |
4,592,573 |
$ |
(5,572,366 |
) |
$ |
5,920,428 |
|||||||
For Walter M Rosebrough, Jr. (as PEO) |
||||||||||||||||||||
- SCT “Stock Awards” column value |
— |
— |
— |
— |
— |
|||||||||||||||
- SCT “Option Awards” column value |
— |
— |
— |
— |
— |
|||||||||||||||
+ year-end fair value of outstanding equity awards granted in Covered Year |
— |
— |
— |
— |
— |
|||||||||||||||
+/- change in fair value of outstanding equity awards granted in prior years |
— |
— |
— |
— |
$ |
8,482,009 |
||||||||||||||
+ vesting date fair value of equity awards granted and vested in Covered Year |
— |
— |
— |
— |
— |
|||||||||||||||
+/- change in fair value of prior-year equity awards vested in Covered Year |
— |
— |
— |
— |
$ |
(87,822 |
) | |||||||||||||
- prior year-end fair value of prior-year equity awards forfeited in Covered Year |
— |
— |
— |
— |
— |
|||||||||||||||
+ includable dividends/earnings on equity awards during Covered Year |
— |
— |
— |
— |
$ |
34,333 |
||||||||||||||
TOTAL ADDED (DEDUCTED): |
— |
— |
— |
— |
$ |
8,428,520 |
||||||||||||||
For Non-PEO Named Executive Officers (Average): |
||||||||||||||||||||
- SCT “Stock Awards” column value |
$ |
(763,492 |
) |
$ |
(683,787 |
) |
$ |
(617,907 |
) |
$ |
(557,389 |
) |
$ |
(527,733 |
) | |||||
- SCT “Option Awards” column value |
$ |
(777,480 |
) |
$ |
(1,004,053 |
) |
$ |
(1,096,527 |
) |
$ |
(814,151 |
) |
$ |
(843,644 |
) | |||||
+ year-end fair value of outstanding equity awards granted in Covered Year |
$ |
1,354,469 |
$ |
1,682,303 |
$ |
1,988,028 |
$ |
1,058,610 |
$ |
2,282,600 |
||||||||||
+/- change in fair value of outstanding equity awards granted in prior years |
$ |
(318,589 |
) |
$ |
(406,244 |
) |
$ |
644,655 |
$ |
(1,380,326 |
) |
$ |
1,754,107 |
|||||||
+ vesting date fair value of equity awards granted and vested in Covered Year |
— |
— |
— |
— |
— |
|||||||||||||||
+/- change in fair value of prior-year equity awards vested in Covered Year |
$ |
(30,137 |
) |
$ |
(285,699 |
) |
$ |
182,705 |
$ |
(365,275 |
) |
$ |
(5,442 |
) | ||||||
- prior year-end fair value of prior-year equity awards forfeited in Covered Year |
— |
— |
— |
— |
— |
|||||||||||||||
+ includable dividends/earnings on equity awards during Covered Year |
$ |
19,245 |
$ |
20,126 |
$ |
19,227 |
$ |
20,412 |
$ |
16,913 |
||||||||||
TOTAL ADDED (DEDUCTED): |
$ |
(515,984 |
) |
$ |
(677,354 |
) |
$ |
1,120,181 |
$ |
(2,038,119 |
) |
$ |
2,676,801 |
|||||||
Fiscal 2026 Tabular List
The following table lists all of the financial performance measures that we used to link compensation actually paid to our named executive officers for fiscal 2026 to our performance. See the section in the Compensation Discussion and Analysis above titled “2026 Compensation Decisions” for more information.
Financial Performance Measure: |
Adjusted EBIT |
Adjusted Free Cash Flow |
non-GAAP
measure calculated as earnings before interest and taxes, excluding the effects of amounts related to certain special items, as described in the Compensation Discussion and Analysis. The financial metric is used in the determination of attainment percentages under our annual MICP plan. See the section in the Compensation Discussion and Analysis above titled “2026 Compensation Decisions” for more information.