Pay vs Performance Disclosure
uSD in Thousands |
12 Months Ended |
|
Mar. 31, 2026
USD ($)
uSD
|
Mar. 31, 2025
USD ($)
uSD
|
Mar. 31, 2024
USD ($)
uSD
|
Mar. 31, 2023
USD ($)
uSD
|
Mar. 31, 2022
USD ($)
uSD
|
| Pay vs Performance Disclosure |
|
|
|
|
|
| Pay vs Performance Disclosure, Table |
| | | | | | | | | | | | | | | | | | | | | | | | | | | | | | | | Value of Initial Fixed $100 Investment Based On: | | | Fiscal Year (7) | Summary Compensation Table Total for PEO ($)(000) (1)(2) | Compensation Actually Paid to PEO ($)(000) (1)(3)(4)(5) | Average Summary Compensation Table Total for Non-PEO NEOs ($)(000) (1)(2) | Average Compensation Actually Paid to Non-PEO NEOs ($)(000) (1)(3)(4)(5) | BAH
Total
Shareholder
Return
($) | S&P Software & Services Select Industry Index Total Shareholder Return ($)(6) | Net Income ($)(000)(8) | Adjusted EBITDA ($)(000) | | 2026 | 13,801 | 3,269 | 3,079 | 285 | 106 | 92 | 850,497 | 1,229,000 | | 2025 | 13,999 | (2,718) | 5,890 | 2,563 | 166 | 198 | 935,030 | 1,315,031 | | 2024 | 15,594 | 48,237 | 3,691 | 8,555 | 232 | 192 | 605,706 | 1,175,064 | | 2023 | 12,184 | 16,036 | 3,673 | 2,879 | 142 | 152 | 271,215 | 1,014,065 | | 2022 | 11,866 | 9,938 | 3,125 | 3,019 | 132 | 181 | 466,577 | 935,088 |
|
|
|
|
|
| Company Selected Measure Name |
Adjusted EBITDA
|
|
|
|
|
| Named Executive Officers, Footnote |
Horacio D. Rozanski is our principal executive officer (PEO) for fiscal years 2022, 2023, 2024, 2025, and 2026. The individuals comprising the non-PEO named executive officers (“Non-PEO NEOs”) for each year presented are listed below. | | | | | | | | | | | | | | | | 2022 | 2023 | 2024 | 2025 | 2026 | | Lloyd W. Howell, Jr. | Matthew A. Calderone | Matthew A. Calderone | Matthew A. Calderone | Kristine Martin Anderson | | Karen M. Dahut | Kristine Martin Anderson | Kristine Martin Anderson | Kristine Martin Anderson | Richard C. Crowe | | Nancy J. Laben | Judith H. Dotson | Judith H. Dotson | Richard C. Crowe | Andrea D. Inserra | | Susan L. Penfield | Nancy J. Laben | Nancy J. Laben | Nancy J. Laben | Thomas J. Pfeifer | | Karen M. Dahut | | | Matthew A. Calderone | | Lloyd W. Howell, Jr. | | | |
|
|
|
|
|
| Peer Group Issuers, Footnote |
Total stockholder return ("TSR") shown in the table above utilizes the S&P Software & Services Select Index which we use in the stock performance graph required by Item 201(e) of Regulation S-K included in the Company’s consolidated audited financial statements filed with the SEC on Form 10-K for fiscal years 2022, 2023 2024, 2025 and 2026. The comparison of TSR assumes that $100 was invested for the period starting April 1, 2021 through March 31 of the applicable fiscal year in each of the Company’s Common Stock and the S&P Software & Services Select Index. All dollar values assume reinvestment of the pre-tax value of dividends paid by companies included in the S&P Software & Services Select Index. The historical stock price performance of our Common Stock shown is not necessarily indicative of future stock price performance.
|
|
|
|
|
| PEO Total Compensation Amount |
$ 13,800,777
|
$ 13,999,139
|
$ 15,594,000
|
$ 12,184,000
|
$ 11,866,000
|
| PEO Actually Paid Compensation Amount |
$ 3,269,266
|
(2,717,730)
|
48,237,000
|
16,036,000
|
9,938,000
|
| Adjustment To PEO Compensation, Footnote |
CAP reflects the exclusions and inclusions of certain amounts from Summary Compensation Table total compensation for the PEO and the Non-PEO NEOs as set forth below under the heading "Summary Compensation Table Total and Compensation Actually Paid Reconciliation for the PEO and Non-PEO NEOs." Equity values are calculated in accordance with FASB ASC Topic 718, Compensation — Stock Compensation. The valuation methodologies and assumptions used to calculate the equity values included in CAP are based on our grant date fair value of the equity awards as disclosed in the Company’s consolidated audited financial statements filed with the SEC on Form 10-K for the applicable fiscal year, with the adjustments set forth below in the "Summary Compensation Table Total and Compensation Actually Paid Reconciliation for the PEO and Non-PEO NEOs" table. | | | | | | | | | | | | | | | | Calculation for PEO | Calculation for Average of Non-PEO NEOs | | Calculation of Compensation Actually Paid | Fiscal Year 2025($) | Fiscal Year 2026($) | Fiscal Year 2025($) | Fiscal Year 2026($) | | SCT Total Compensation | 13,999,139 | 13,800,777 | 5,889,962 | 3,078,808 | | Less aggregate change in actuarial present value of accumulated pension benefits | (20,000) | (20,000) | (20,000) | (19,360) | | Less aggregate grant date fair value of stock and option awards in SCT | (10,531,335) | (10,248,071) | (4,333,893) | (1,586,603) | | Less fair value at the end of the prior fiscal year for any awards granted in any prior fiscal year that fail to meet the applicable vesting conditions during the covered fiscal year | — | — | — | (909,782) | | Plus fair value as of fiscal year-end of awards granted during the fiscal year that are outstanding and unvested as of the end of the fiscal year | 6,278,570 | 6,500,823 | 2,487,616 | 769,085 | | Plus fair value as of vesting date of awards that are granted and vest in the same year | 887,780 | 919,037 | 465,616 | 114,608 | | Plus change in fair value (whether positive or negative) as of fiscal year-end for awards granted in prior fiscal years that are unvested and outstanding as of the end of the fiscal year | (8,612,420) | (3,571,353) | (1,481,346) | (760,973) | | Plus change in fair value (whether positive or negative) as of vesting date (from the end of the prior fiscal year) of awards granted in prior fiscal years for which all applicable vesting conditions were satisfied at fiscal year-end or during the fiscal year | (5,217,476) | (4,427,507) | (520,044) | (406,492) | | Plus dollar value of any dividends or other earnings paid on awards during the fiscal year prior to the vesting date that are not otherwise included in total compensation for the covered fiscal year | 498,012 | 315,560 | 74,649 | 5,880 | | Compensation Actually Paid | (2,717,730) | 3,269,266 | 2,562,560 | 285,169 |
|
|
|
|
|
| Non-PEO NEO Average Total Compensation Amount |
$ 3,078,808
|
5,889,962
|
3,691,000
|
3,673,000
|
3,125,000
|
| Non-PEO NEO Average Compensation Actually Paid Amount |
$ 285,169
|
2,562,560
|
8,555,000
|
2,879,000
|
3,019,000
|
| Adjustment to Non-PEO NEO Compensation Footnote |
CAP reflects the exclusions and inclusions of certain amounts from Summary Compensation Table total compensation for the PEO and the Non-PEO NEOs as set forth below under the heading "Summary Compensation Table Total and Compensation Actually Paid Reconciliation for the PEO and Non-PEO NEOs." Equity values are calculated in accordance with FASB ASC Topic 718, Compensation — Stock Compensation. The valuation methodologies and assumptions used to calculate the equity values included in CAP are based on our grant date fair value of the equity awards as disclosed in the Company’s consolidated audited financial statements filed with the SEC on Form 10-K for the applicable fiscal year, with the adjustments set forth below in the "Summary Compensation Table Total and Compensation Actually Paid Reconciliation for the PEO and Non-PEO NEOs" table. | | | | | | | | | | | | | | | | Calculation for PEO | Calculation for Average of Non-PEO NEOs | | Calculation of Compensation Actually Paid | Fiscal Year 2025($) | Fiscal Year 2026($) | Fiscal Year 2025($) | Fiscal Year 2026($) | | SCT Total Compensation | 13,999,139 | 13,800,777 | 5,889,962 | 3,078,808 | | Less aggregate change in actuarial present value of accumulated pension benefits | (20,000) | (20,000) | (20,000) | (19,360) | | Less aggregate grant date fair value of stock and option awards in SCT | (10,531,335) | (10,248,071) | (4,333,893) | (1,586,603) | | Less fair value at the end of the prior fiscal year for any awards granted in any prior fiscal year that fail to meet the applicable vesting conditions during the covered fiscal year | — | — | — | (909,782) | | Plus fair value as of fiscal year-end of awards granted during the fiscal year that are outstanding and unvested as of the end of the fiscal year | 6,278,570 | 6,500,823 | 2,487,616 | 769,085 | | Plus fair value as of vesting date of awards that are granted and vest in the same year | 887,780 | 919,037 | 465,616 | 114,608 | | Plus change in fair value (whether positive or negative) as of fiscal year-end for awards granted in prior fiscal years that are unvested and outstanding as of the end of the fiscal year | (8,612,420) | (3,571,353) | (1,481,346) | (760,973) | | Plus change in fair value (whether positive or negative) as of vesting date (from the end of the prior fiscal year) of awards granted in prior fiscal years for which all applicable vesting conditions were satisfied at fiscal year-end or during the fiscal year | (5,217,476) | (4,427,507) | (520,044) | (406,492) | | Plus dollar value of any dividends or other earnings paid on awards during the fiscal year prior to the vesting date that are not otherwise included in total compensation for the covered fiscal year | 498,012 | 315,560 | 74,649 | 5,880 | | Compensation Actually Paid | (2,717,730) | 3,269,266 | 2,562,560 | 285,169 |
|
|
|
|
|
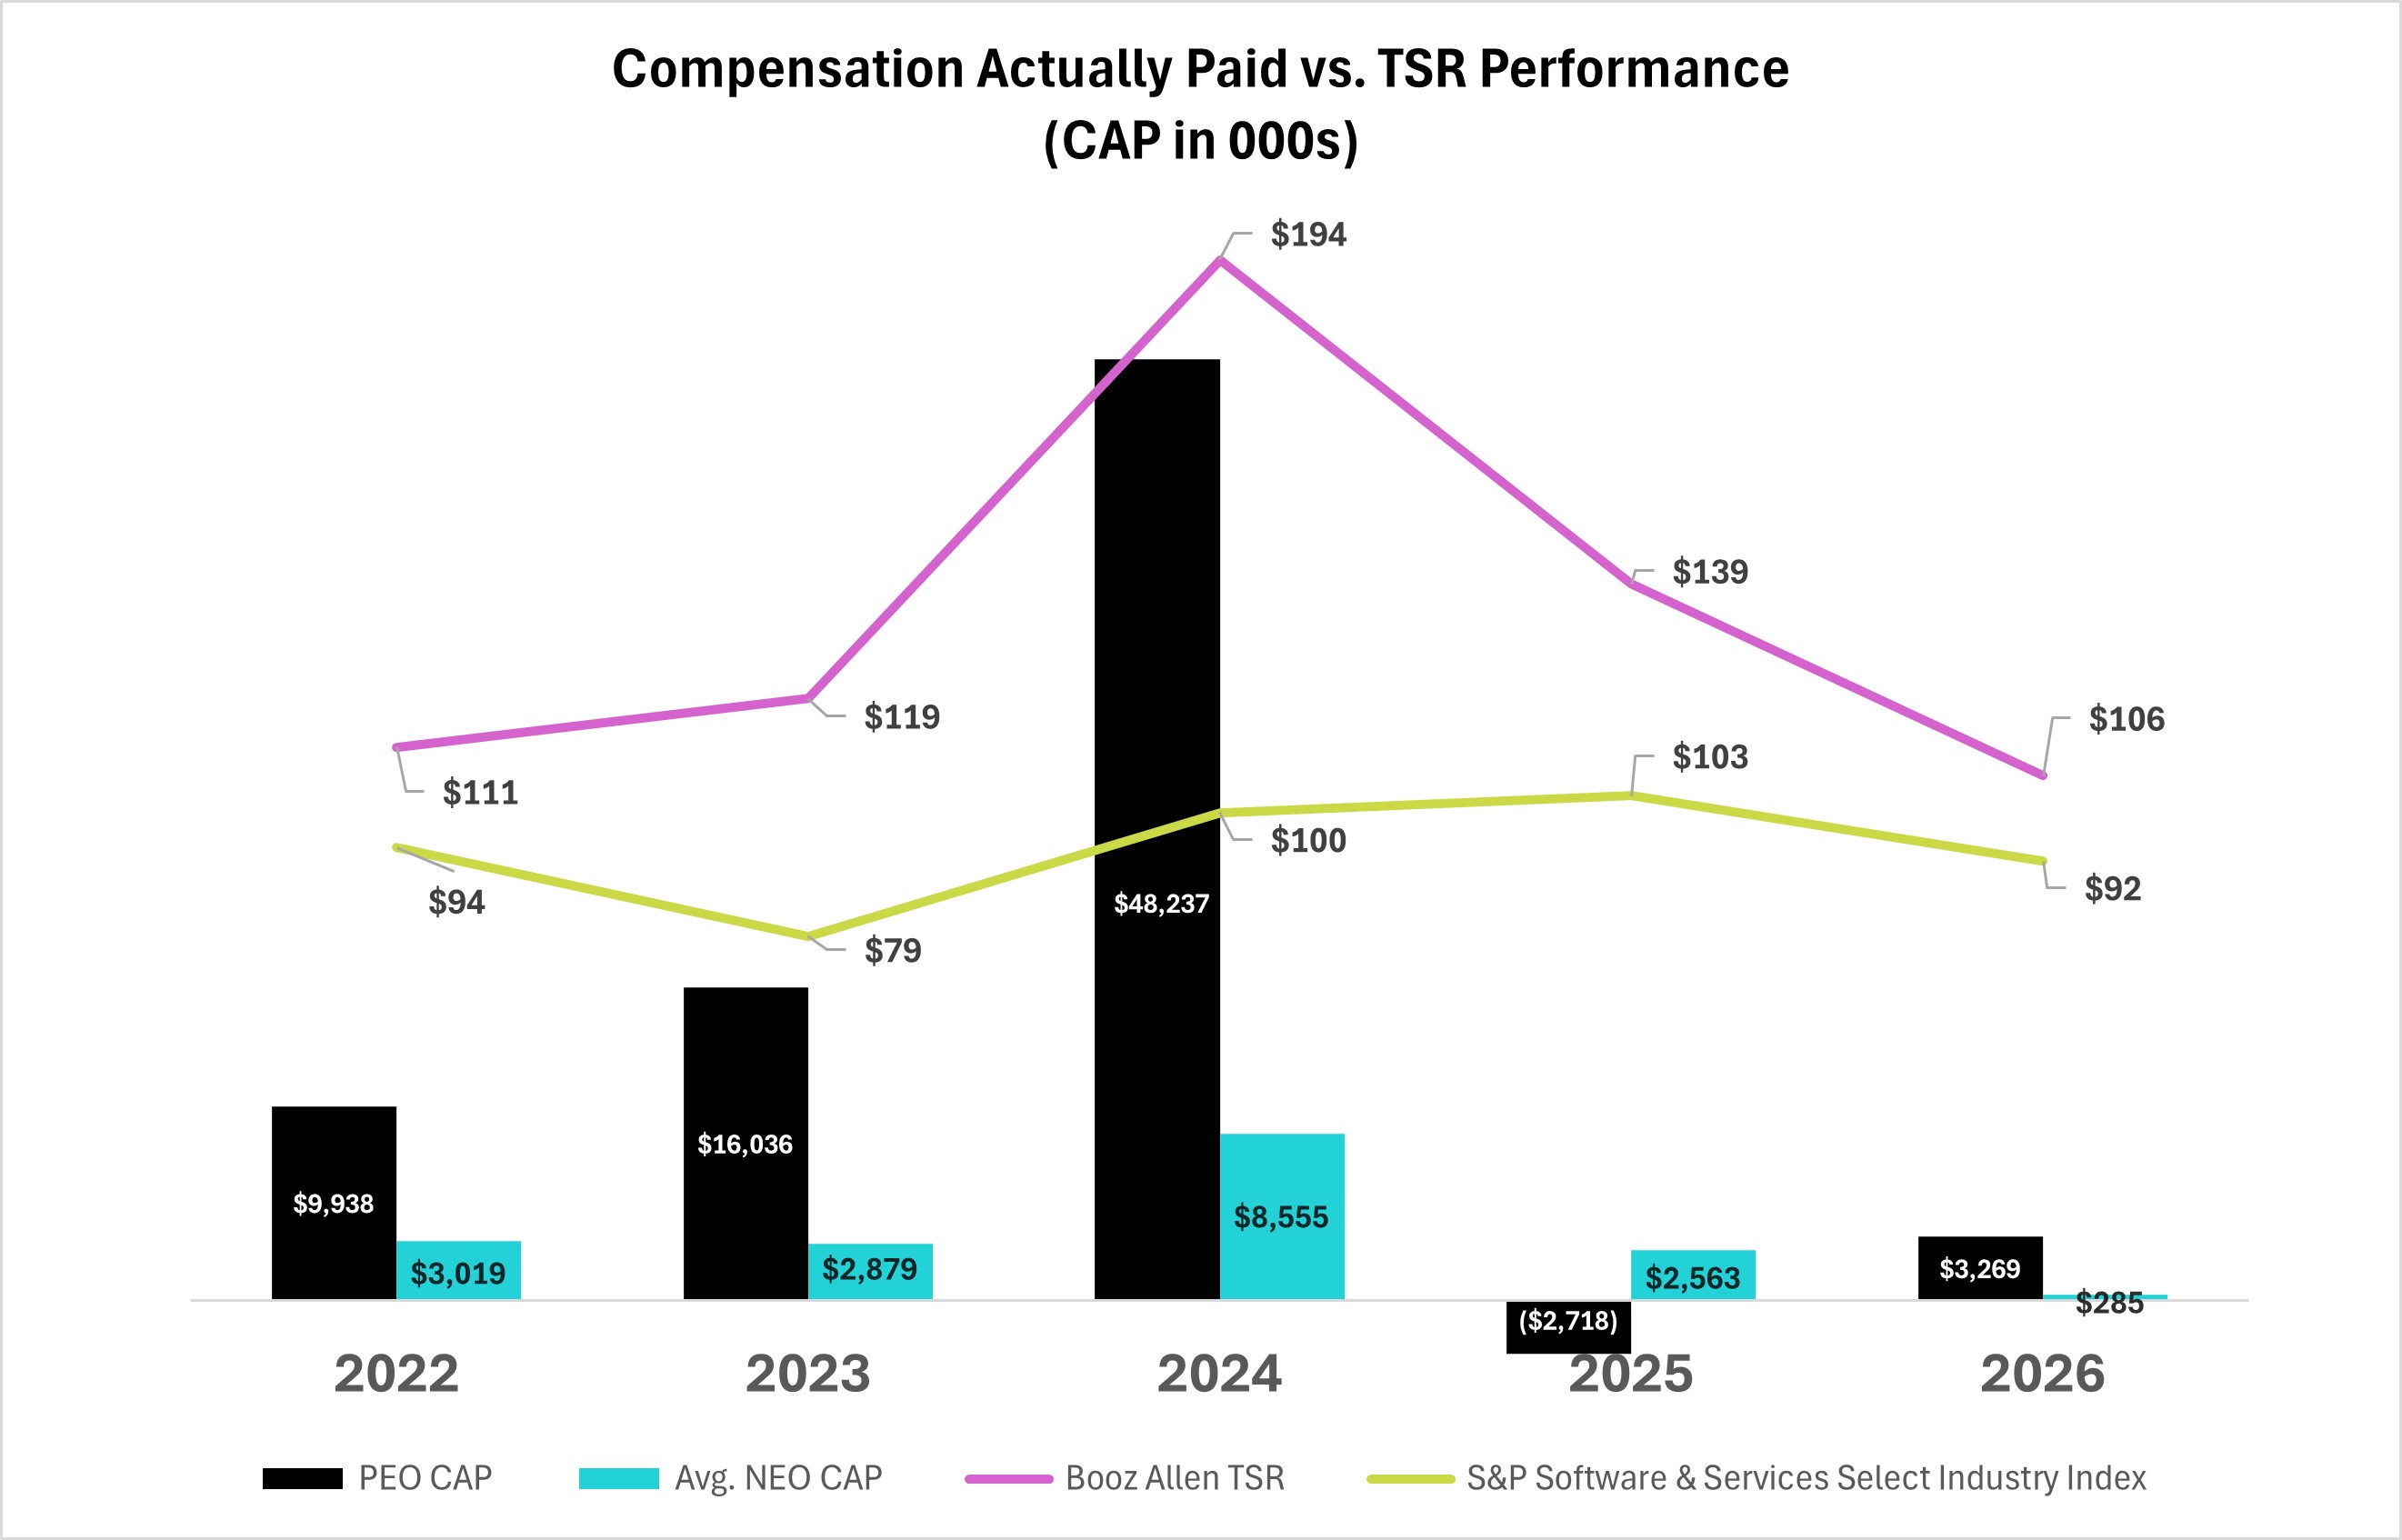
| Compensation Actually Paid vs. Total Shareholder Return |
|
|
|
|
|
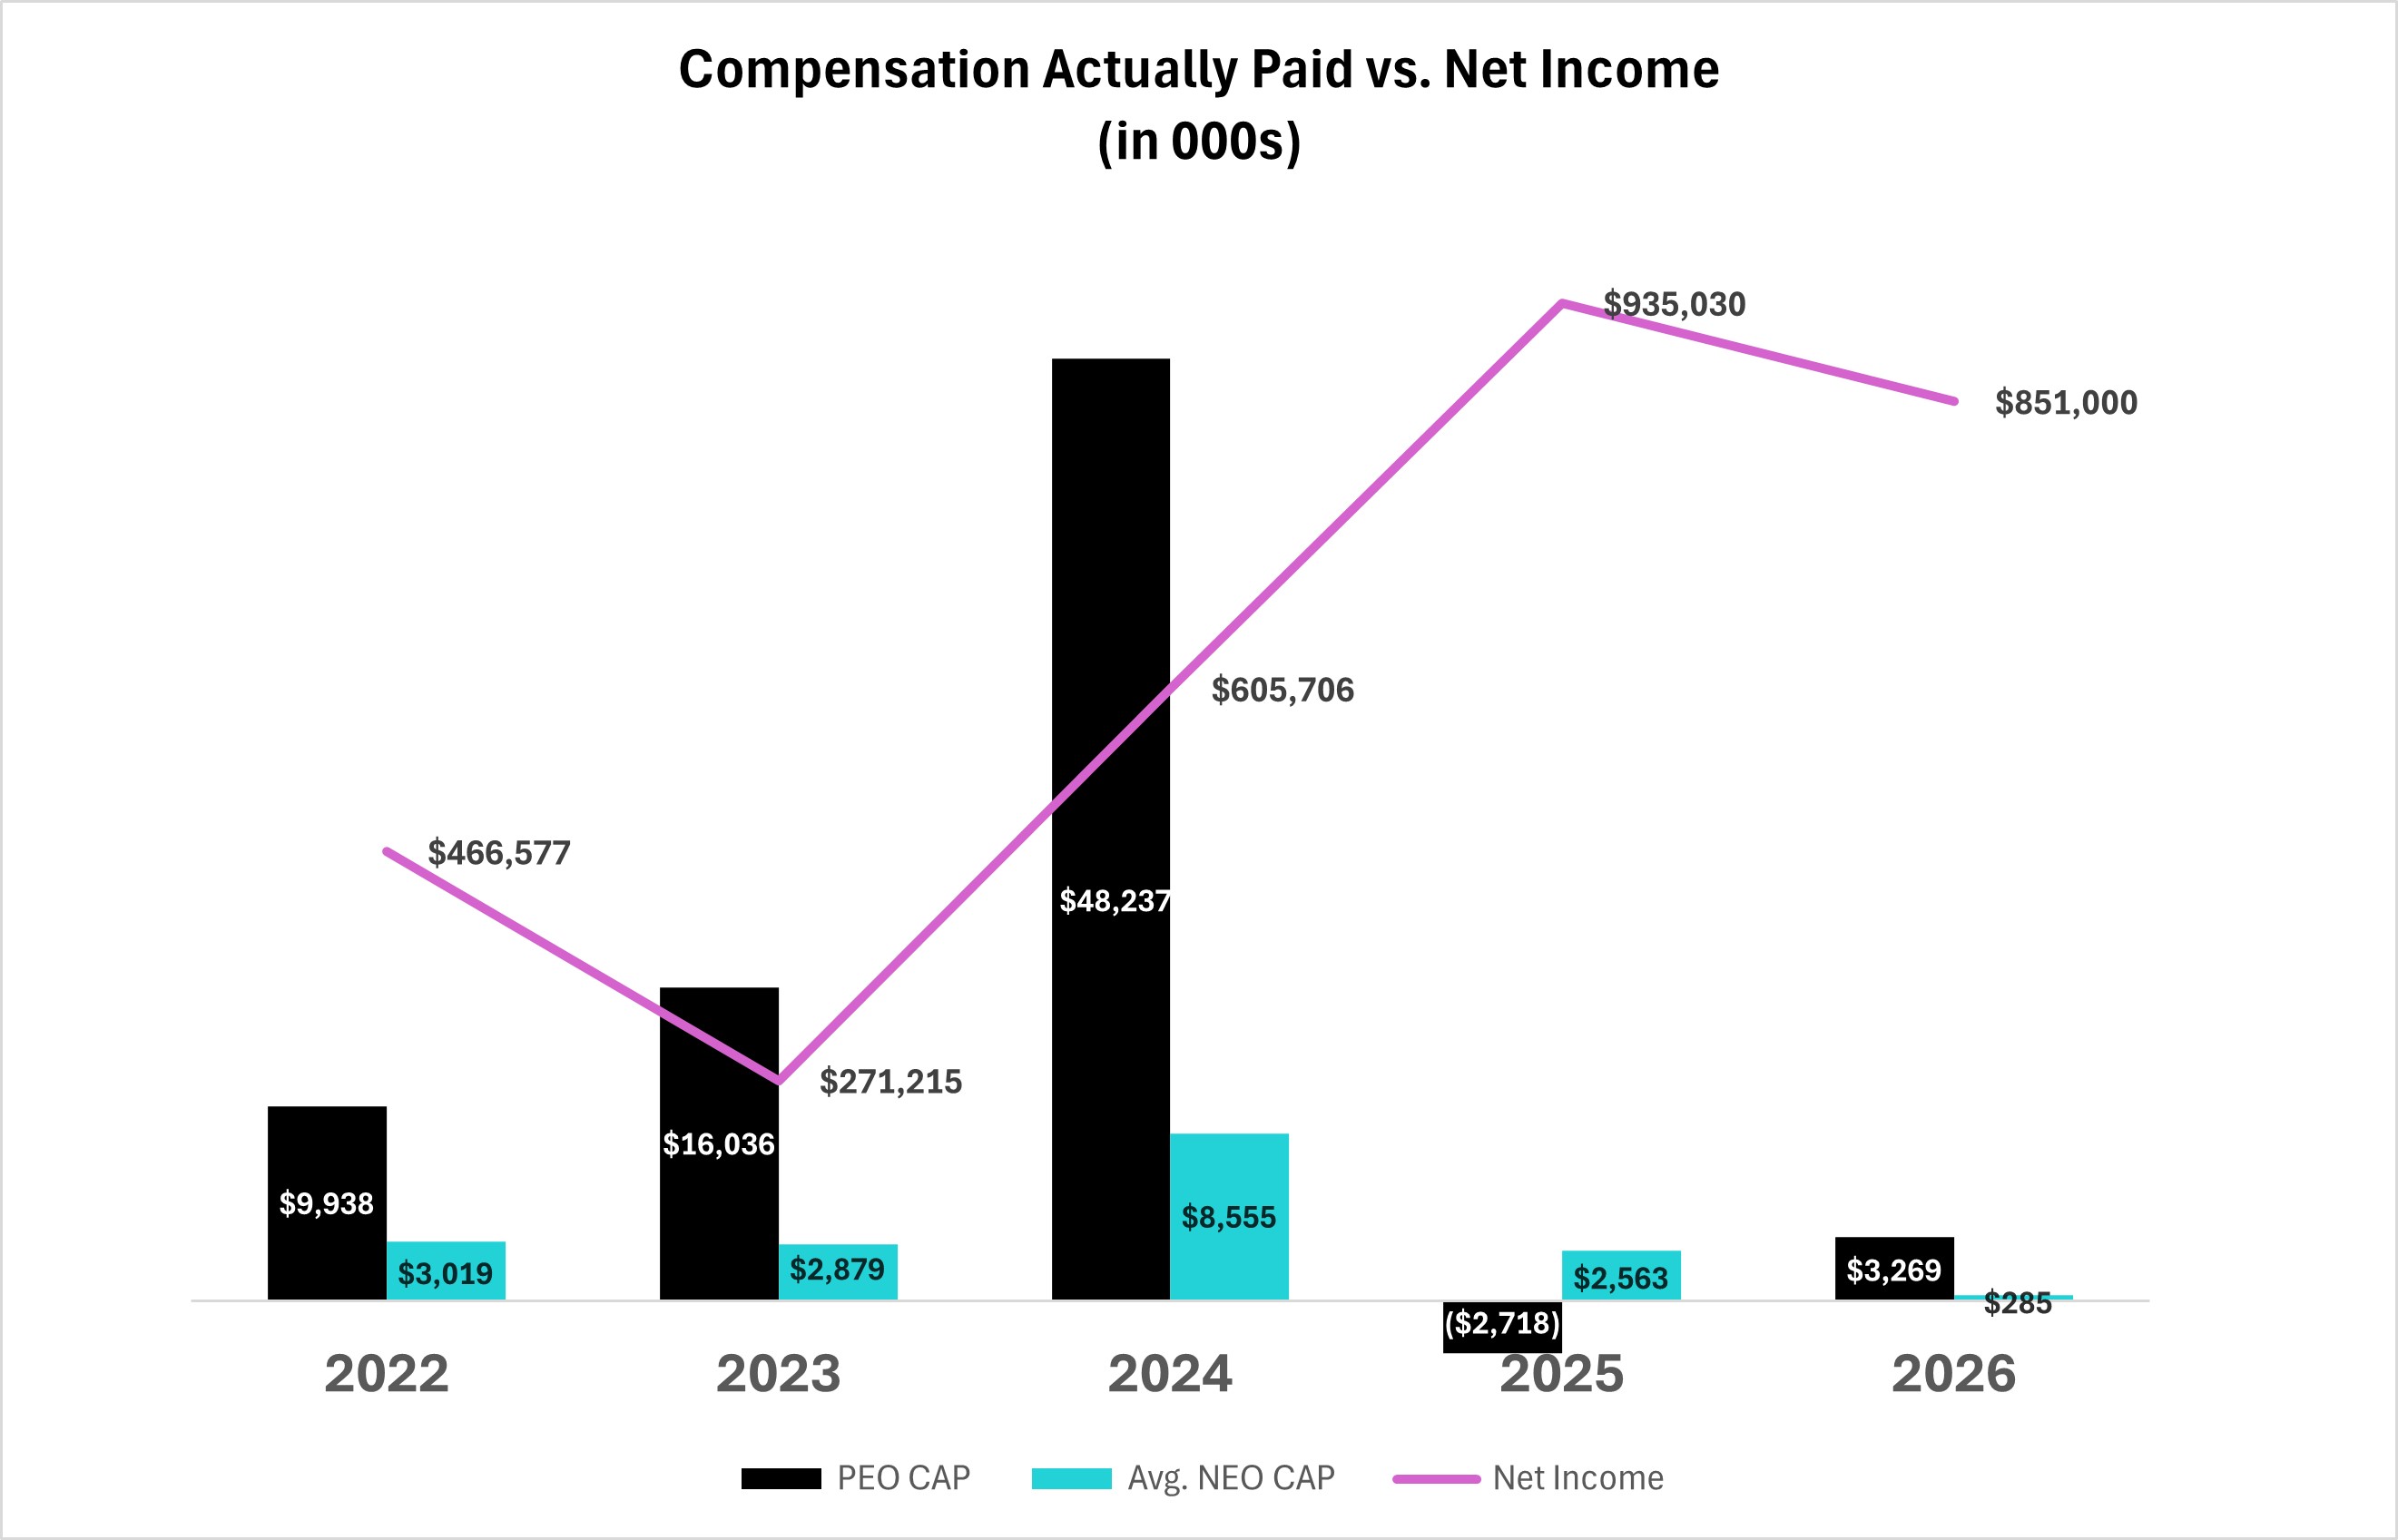
| Compensation Actually Paid vs. Net Income |
|
|
|
|
|
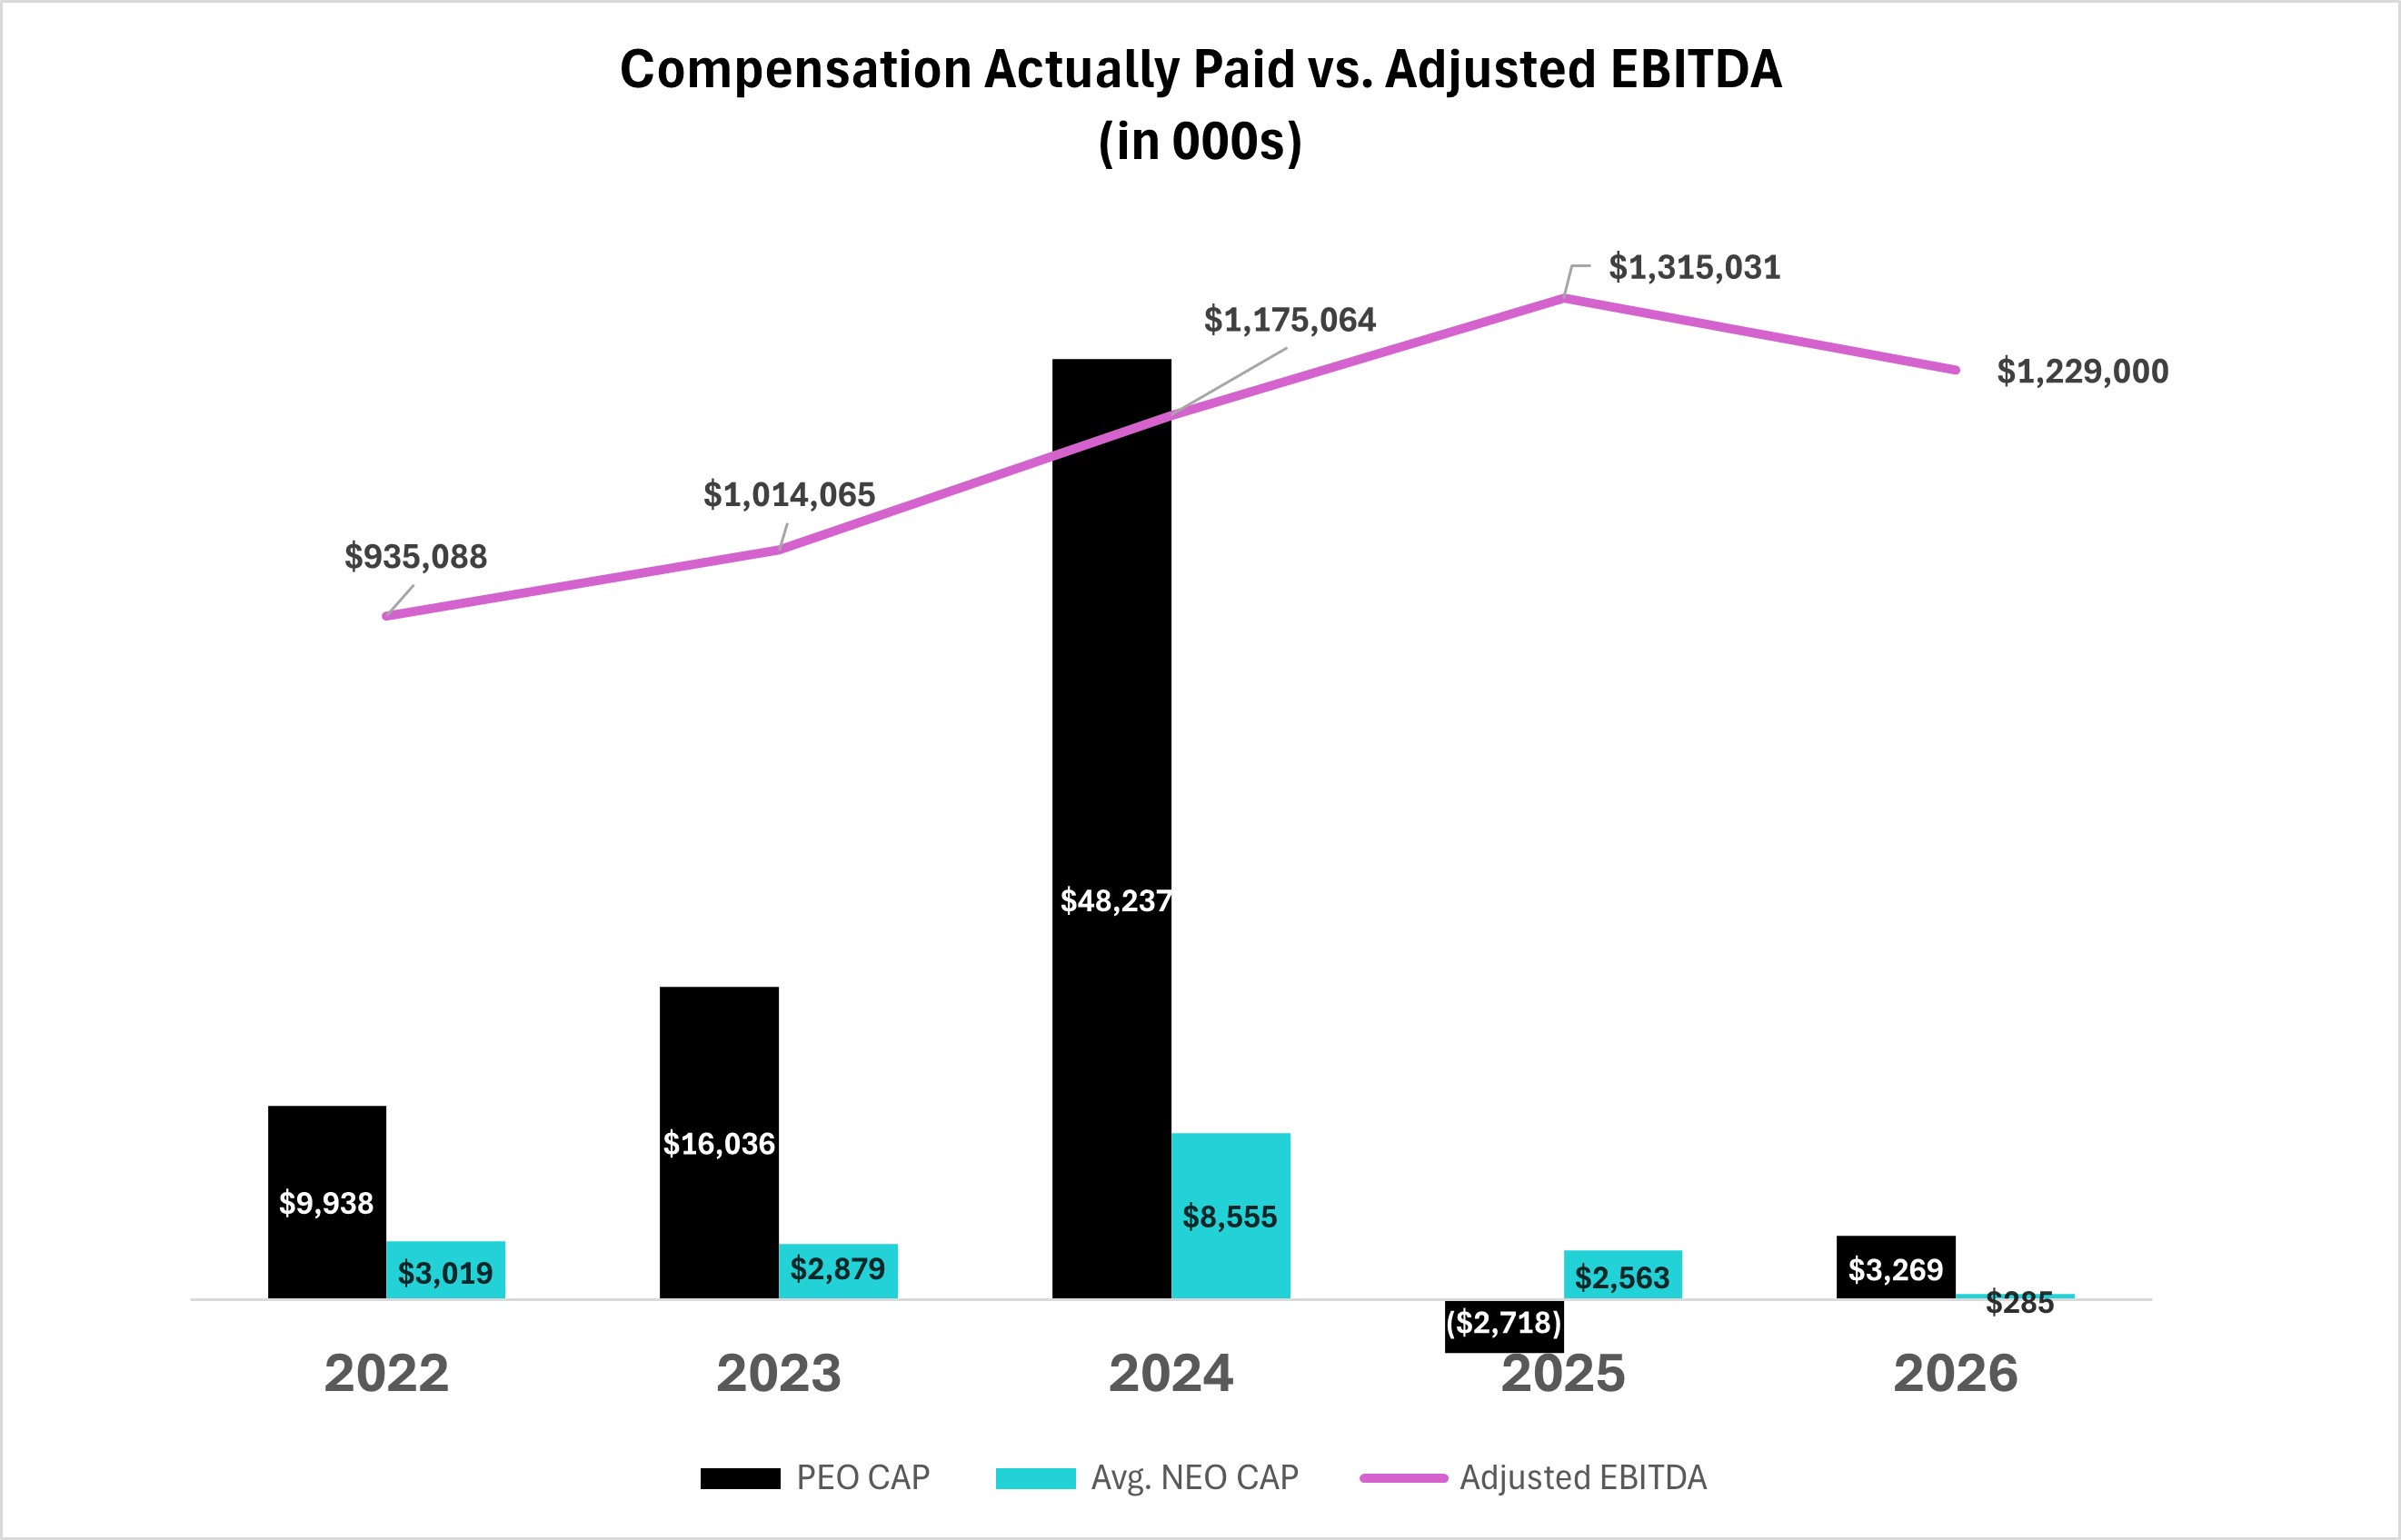
| Compensation Actually Paid vs. Company Selected Measure |
|
|
|
|
|
| Total Shareholder Return Vs Peer Group |
|
|
|
|
|
| Tabular List, Table |
| | | | | | | Metric | Metric Type | | Adjusted EBITDA | Financial Measure | | Revenue | Financial Measure | | Capability Amplification | Strategic Measure | | Technical Upskilling | Strategic Measure | | Advanced Technology Demonstration | Strategic Measure |
|
|
|
|
|
| Total Shareholder Return Amount |
$ 106
|
166
|
232
|
142
|
132
|
| Peer Group Total Shareholder Return Amount |
92
|
198
|
192
|
152
|
181
|
| Net Income (Loss) |
$ 850,497,000
|
$ 935,030,000
|
$ 605,706,000
|
$ 271,215,000
|
$ 466,577,000
|
| Company Selected Measure Amount | uSD |
1,229,000
|
1,315,031
|
1,175,064
|
1,014,065
|
935,088
|
| PEO Name |
Horacio D. Rozanski
|
|
|
|
|
| Additional 402(v) Disclosure |
Amounts shown for "Summary Compensation Table" total for each applicable fiscal year (i) for the PEO, are the amounts of total compensation as reported in the Summary Compensation Table for the PEO, and (ii) for the Non-PEO NEOs, are the average of the amounts of total compensation as reported in the Summary Compensation Table for such Non-PEO NEOs. (3)Amounts shown for CAP are computed in accordance with Item 402(v) of Regulation S-K under the Exchange Act and do not reflect the actual amount of compensation earned by or paid to the NEOs during the applicable year. These amounts reflect total compensation for the PEO and average total compensation for Non-PEO NEOs as reported in the Summary Compensation Table, with certain adjustments as required by Item 402(v) of Regulation S-K and described in footnote 5 below. (4)For the portion of CAP that is based on year-end stock prices, $78.03 was used for fiscal year 2026, $104.58 was used for fiscal year 2025, $148.44 was used for fiscal year 2024, $92.69 was used for fiscal year 2023, and $87.84 was used for fiscal year 2022. Amounts shown represent the amount of net income reflected in the Company's audited financial statements filed with the SEC on Form 10-K for the applicable fiscal year.
|
|
|
|
|
| Measure:: 1 |
|
|
|
|
|
| Pay vs Performance Disclosure |
|
|
|
|
|
| Name |
Adjusted EBITDA
|
|
|
|
|
| Non-GAAP Measure Description |
Pursuant to Item 402(v) of Regulation S-K, we determined annual Adjusted EBITDA to be our most important financial performance measure used to link Company performance to CAP to our PEO and other Non-PEO NEOs in fiscal year 2026. See Appendix A to this proxy statement for a reconciliation of Adjusted EBITDA to the most directly comparable financial measure calculated and presented in accordance with GAAP. Annually, we review our established performance financial metrics to ensure they maximize stockholder value. As such, we may determine a different financial performance measure in future years.
|
|
|
|
|
| Measure:: 2 |
|
|
|
|
|
| Pay vs Performance Disclosure |
|
|
|
|
|
| Name |
Revenue
|
|
|
|
|
| Measure:: 3 |
|
|
|
|
|
| Pay vs Performance Disclosure |
|
|
|
|
|
| Name |
Capability Amplification
|
|
|
|
|
| Measure:: 4 |
|
|
|
|
|
| Pay vs Performance Disclosure |
|
|
|
|
|
| Name |
Technical Upskilling
|
|
|
|
|
| Measure:: 5 |
|
|
|
|
|
| Pay vs Performance Disclosure |
|
|
|
|
|
| Name |
Advanced Technology Demonstration
|
|
|
|
|
| PEO | Aggregate Pension Adjustments Service Cost |
|
|
|
|
|
| Pay vs Performance Disclosure |
|
|
|
|
|
| Adjustment to Compensation, Amount |
$ (20,000)
|
$ (20,000)
|
|
|
|
| PEO | Aggregate Grant Date Fair Value of Equity Award Amounts Reported in Summary Compensation Table |
|
|
|
|
|
| Pay vs Performance Disclosure |
|
|
|
|
|
| Adjustment to Compensation, Amount |
(10,248,071)
|
(10,531,335)
|
|
|
|
| PEO | Year-end Fair Value of Equity Awards Granted in Covered Year that are Outstanding and Unvested |
|
|
|
|
|
| Pay vs Performance Disclosure |
|
|
|
|
|
| Adjustment to Compensation, Amount |
0
|
0
|
|
|
|
| PEO | Year-over-Year Change in Fair Value of Equity Awards Granted in Prior Years That are Outstanding and Unvested |
|
|
|
|
|
| Pay vs Performance Disclosure |
|
|
|
|
|
| Adjustment to Compensation, Amount |
6,500,823
|
6,278,570
|
|
|
|
| PEO | Vesting Date Fair Value of Equity Awards Granted and Vested in Covered Year |
|
|
|
|
|
| Pay vs Performance Disclosure |
|
|
|
|
|
| Adjustment to Compensation, Amount |
919,037
|
887,780
|
|
|
|
| PEO | Change in Fair Value as of Vesting Date of Prior Year Equity Awards Vested in Covered Year |
|
|
|
|
|
| Pay vs Performance Disclosure |
|
|
|
|
|
| Adjustment to Compensation, Amount |
(3,571,353)
|
(8,612,420)
|
|
|
|
| PEO | Prior Year End Fair Value of Equity Awards Granted in Any Prior Year that Fail to Meet Applicable Vesting Conditions During Covered Year |
|
|
|
|
|
| Pay vs Performance Disclosure |
|
|
|
|
|
| Adjustment to Compensation, Amount |
(4,427,507)
|
(5,217,476)
|
|
|
|
| PEO | Dividends or Other Earnings Paid on Equity Awards not Otherwise Reflected in Total Compensation for Covered Year |
|
|
|
|
|
| Pay vs Performance Disclosure |
|
|
|
|
|
| Adjustment to Compensation, Amount |
315,560
|
498,012
|
|
|
|
| Non-PEO NEO | Aggregate Pension Adjustments Service Cost |
|
|
|
|
|
| Pay vs Performance Disclosure |
|
|
|
|
|
| Adjustment to Compensation, Amount |
(19,360)
|
(20,000)
|
|
|
|
| Non-PEO NEO | Aggregate Grant Date Fair Value of Equity Award Amounts Reported in Summary Compensation Table |
|
|
|
|
|
| Pay vs Performance Disclosure |
|
|
|
|
|
| Adjustment to Compensation, Amount |
(1,586,603)
|
(4,333,893)
|
|
|
|
| Non-PEO NEO | Year-end Fair Value of Equity Awards Granted in Covered Year that are Outstanding and Unvested |
|
|
|
|
|
| Pay vs Performance Disclosure |
|
|
|
|
|
| Adjustment to Compensation, Amount |
(909,782)
|
0
|
|
|
|
| Non-PEO NEO | Year-over-Year Change in Fair Value of Equity Awards Granted in Prior Years That are Outstanding and Unvested |
|
|
|
|
|
| Pay vs Performance Disclosure |
|
|
|
|
|
| Adjustment to Compensation, Amount |
769,085
|
2,487,616
|
|
|
|
| Non-PEO NEO | Vesting Date Fair Value of Equity Awards Granted and Vested in Covered Year |
|
|
|
|
|
| Pay vs Performance Disclosure |
|
|
|
|
|
| Adjustment to Compensation, Amount |
114,608
|
465,616
|
|
|
|
| Non-PEO NEO | Change in Fair Value as of Vesting Date of Prior Year Equity Awards Vested in Covered Year |
|
|
|
|
|
| Pay vs Performance Disclosure |
|
|
|
|
|
| Adjustment to Compensation, Amount |
(760,973)
|
(1,481,346)
|
|
|
|
| Non-PEO NEO | Prior Year End Fair Value of Equity Awards Granted in Any Prior Year that Fail to Meet Applicable Vesting Conditions During Covered Year |
|
|
|
|
|
| Pay vs Performance Disclosure |
|
|
|
|
|
| Adjustment to Compensation, Amount |
(406,492)
|
(520,044)
|
|
|
|
| Non-PEO NEO | Dividends or Other Earnings Paid on Equity Awards not Otherwise Reflected in Total Compensation for Covered Year |
|
|
|
|
|
| Pay vs Performance Disclosure |
|
|
|
|
|
| Adjustment to Compensation, Amount |
$ 5,880
|
$ 74,649
|
|
|
|