v3.26.1
Pay vs Performance Disclosure - USD ($)
12 Months Ended
Jan. 31, 2026
Jan. 31, 2025
Jan. 31, 2024
Jan. 31, 2023
Jan. 31, 2022
Pay vs Performance Disclosure          
Pay vs Performance Disclosure, Table

Pay Versus Performance Table

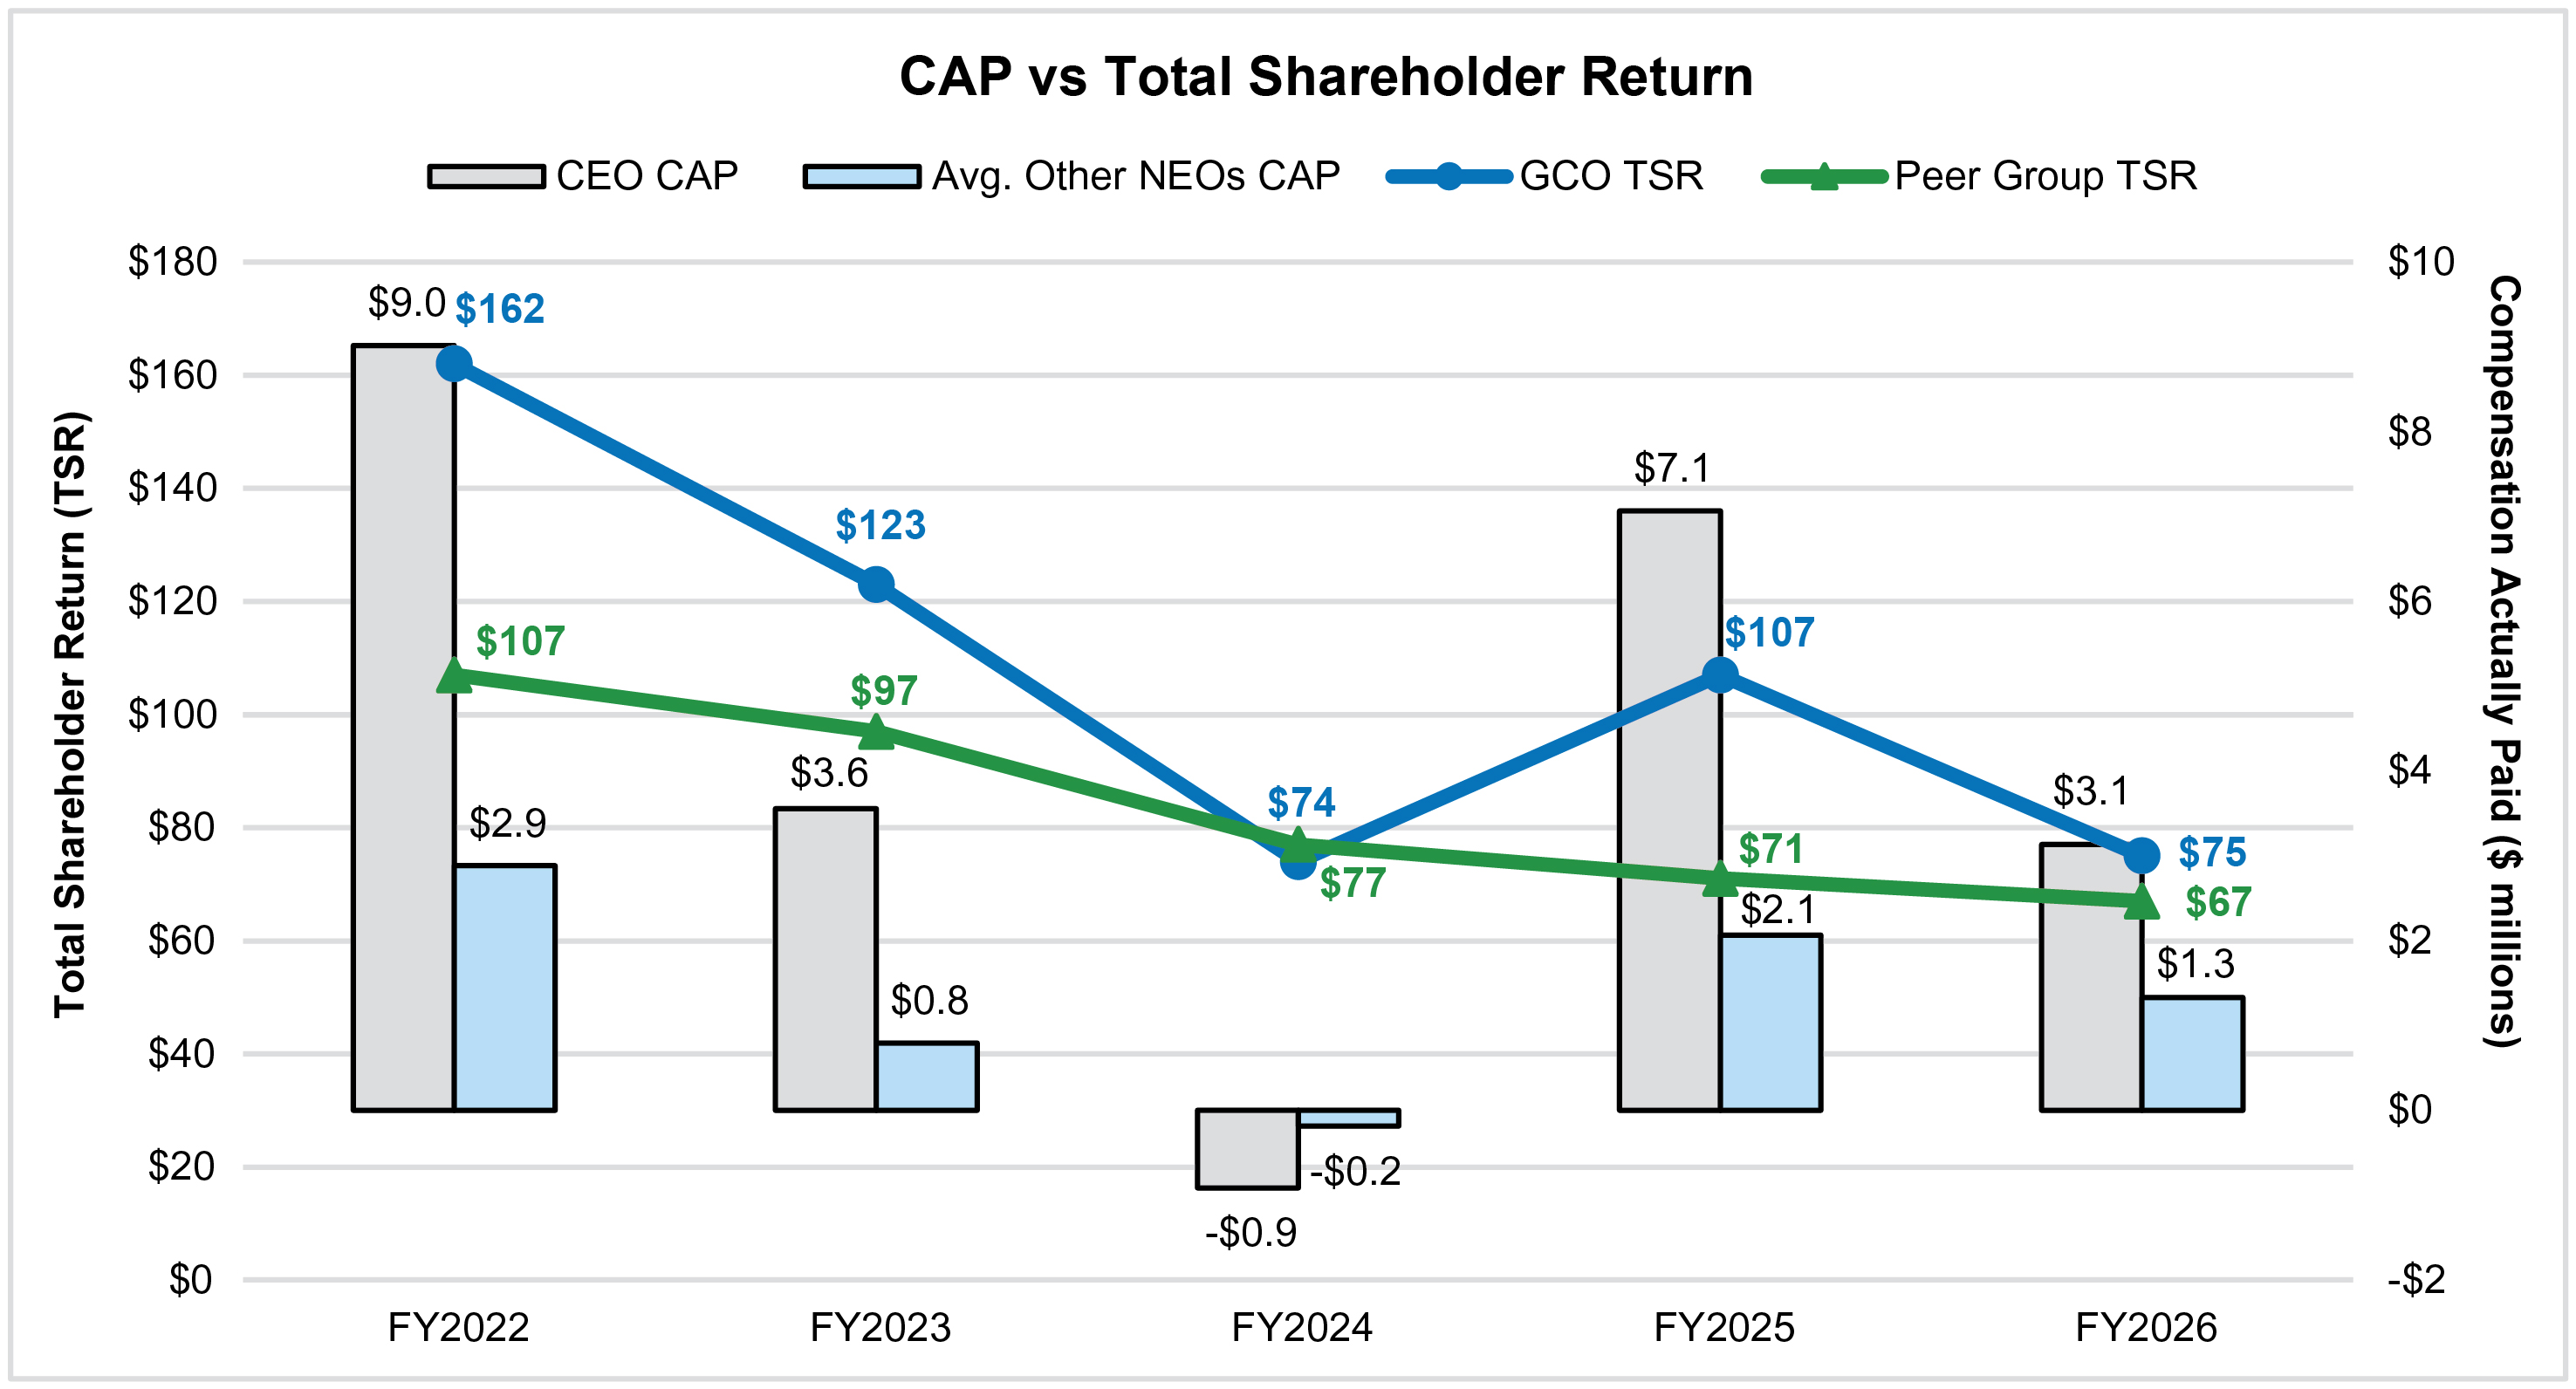
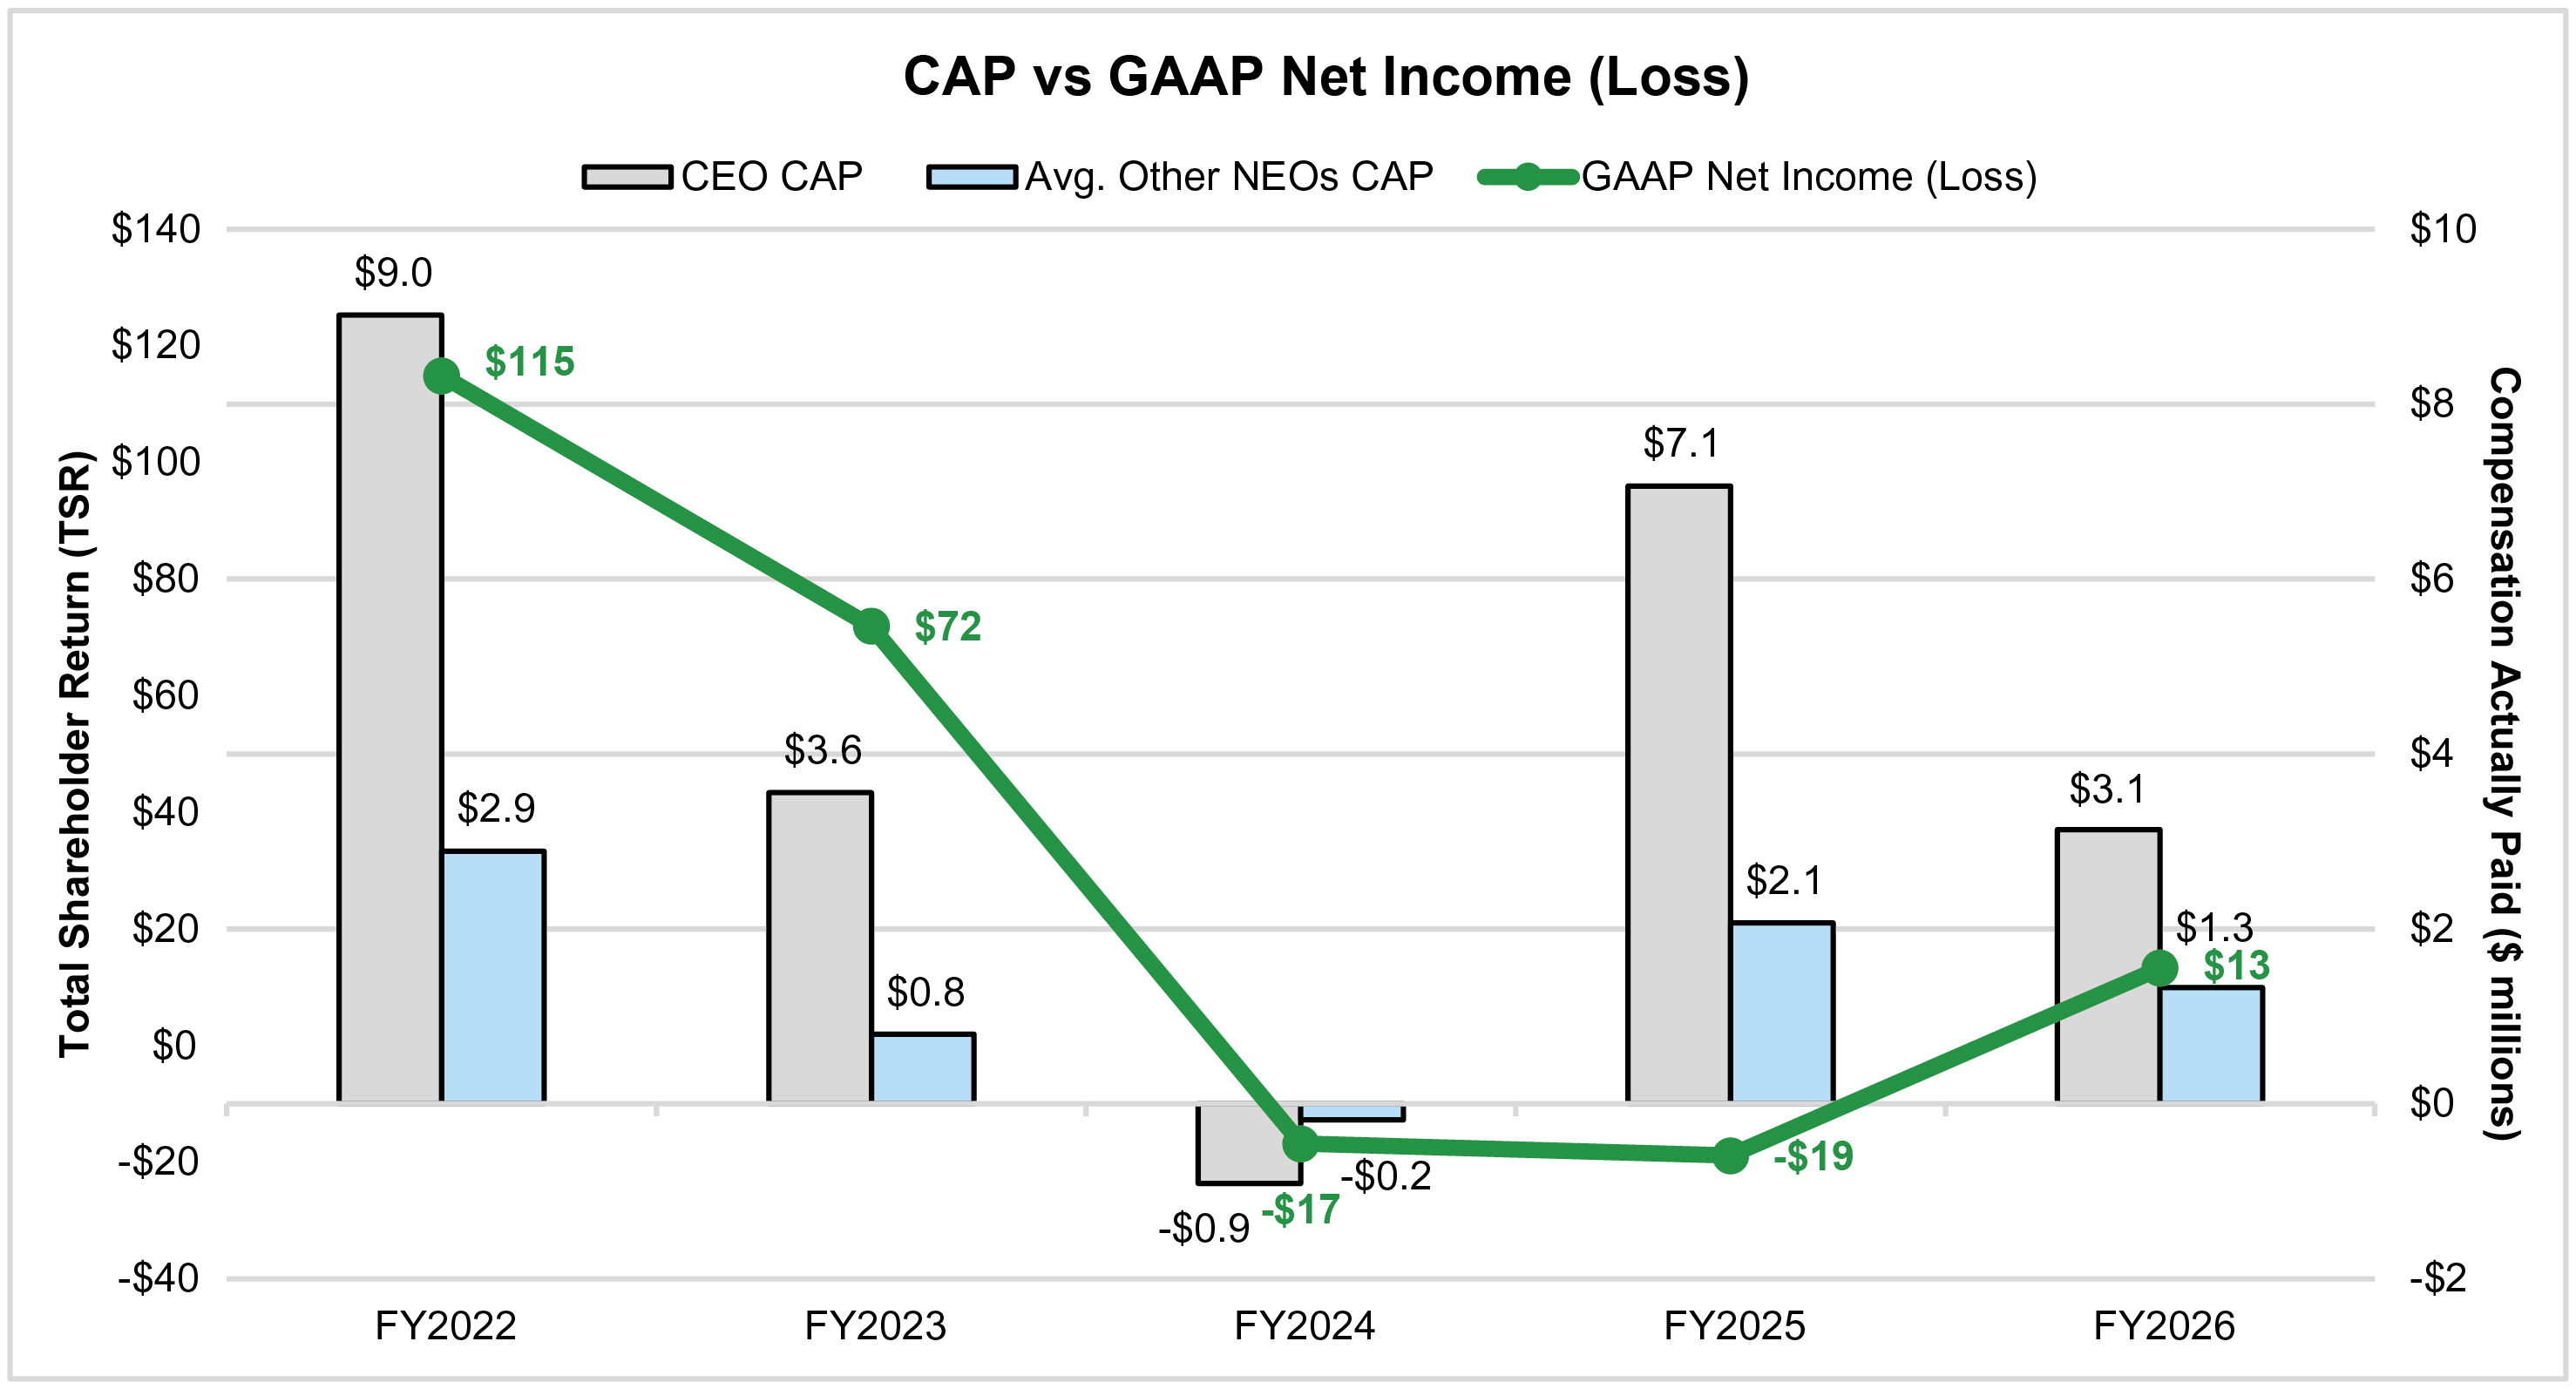
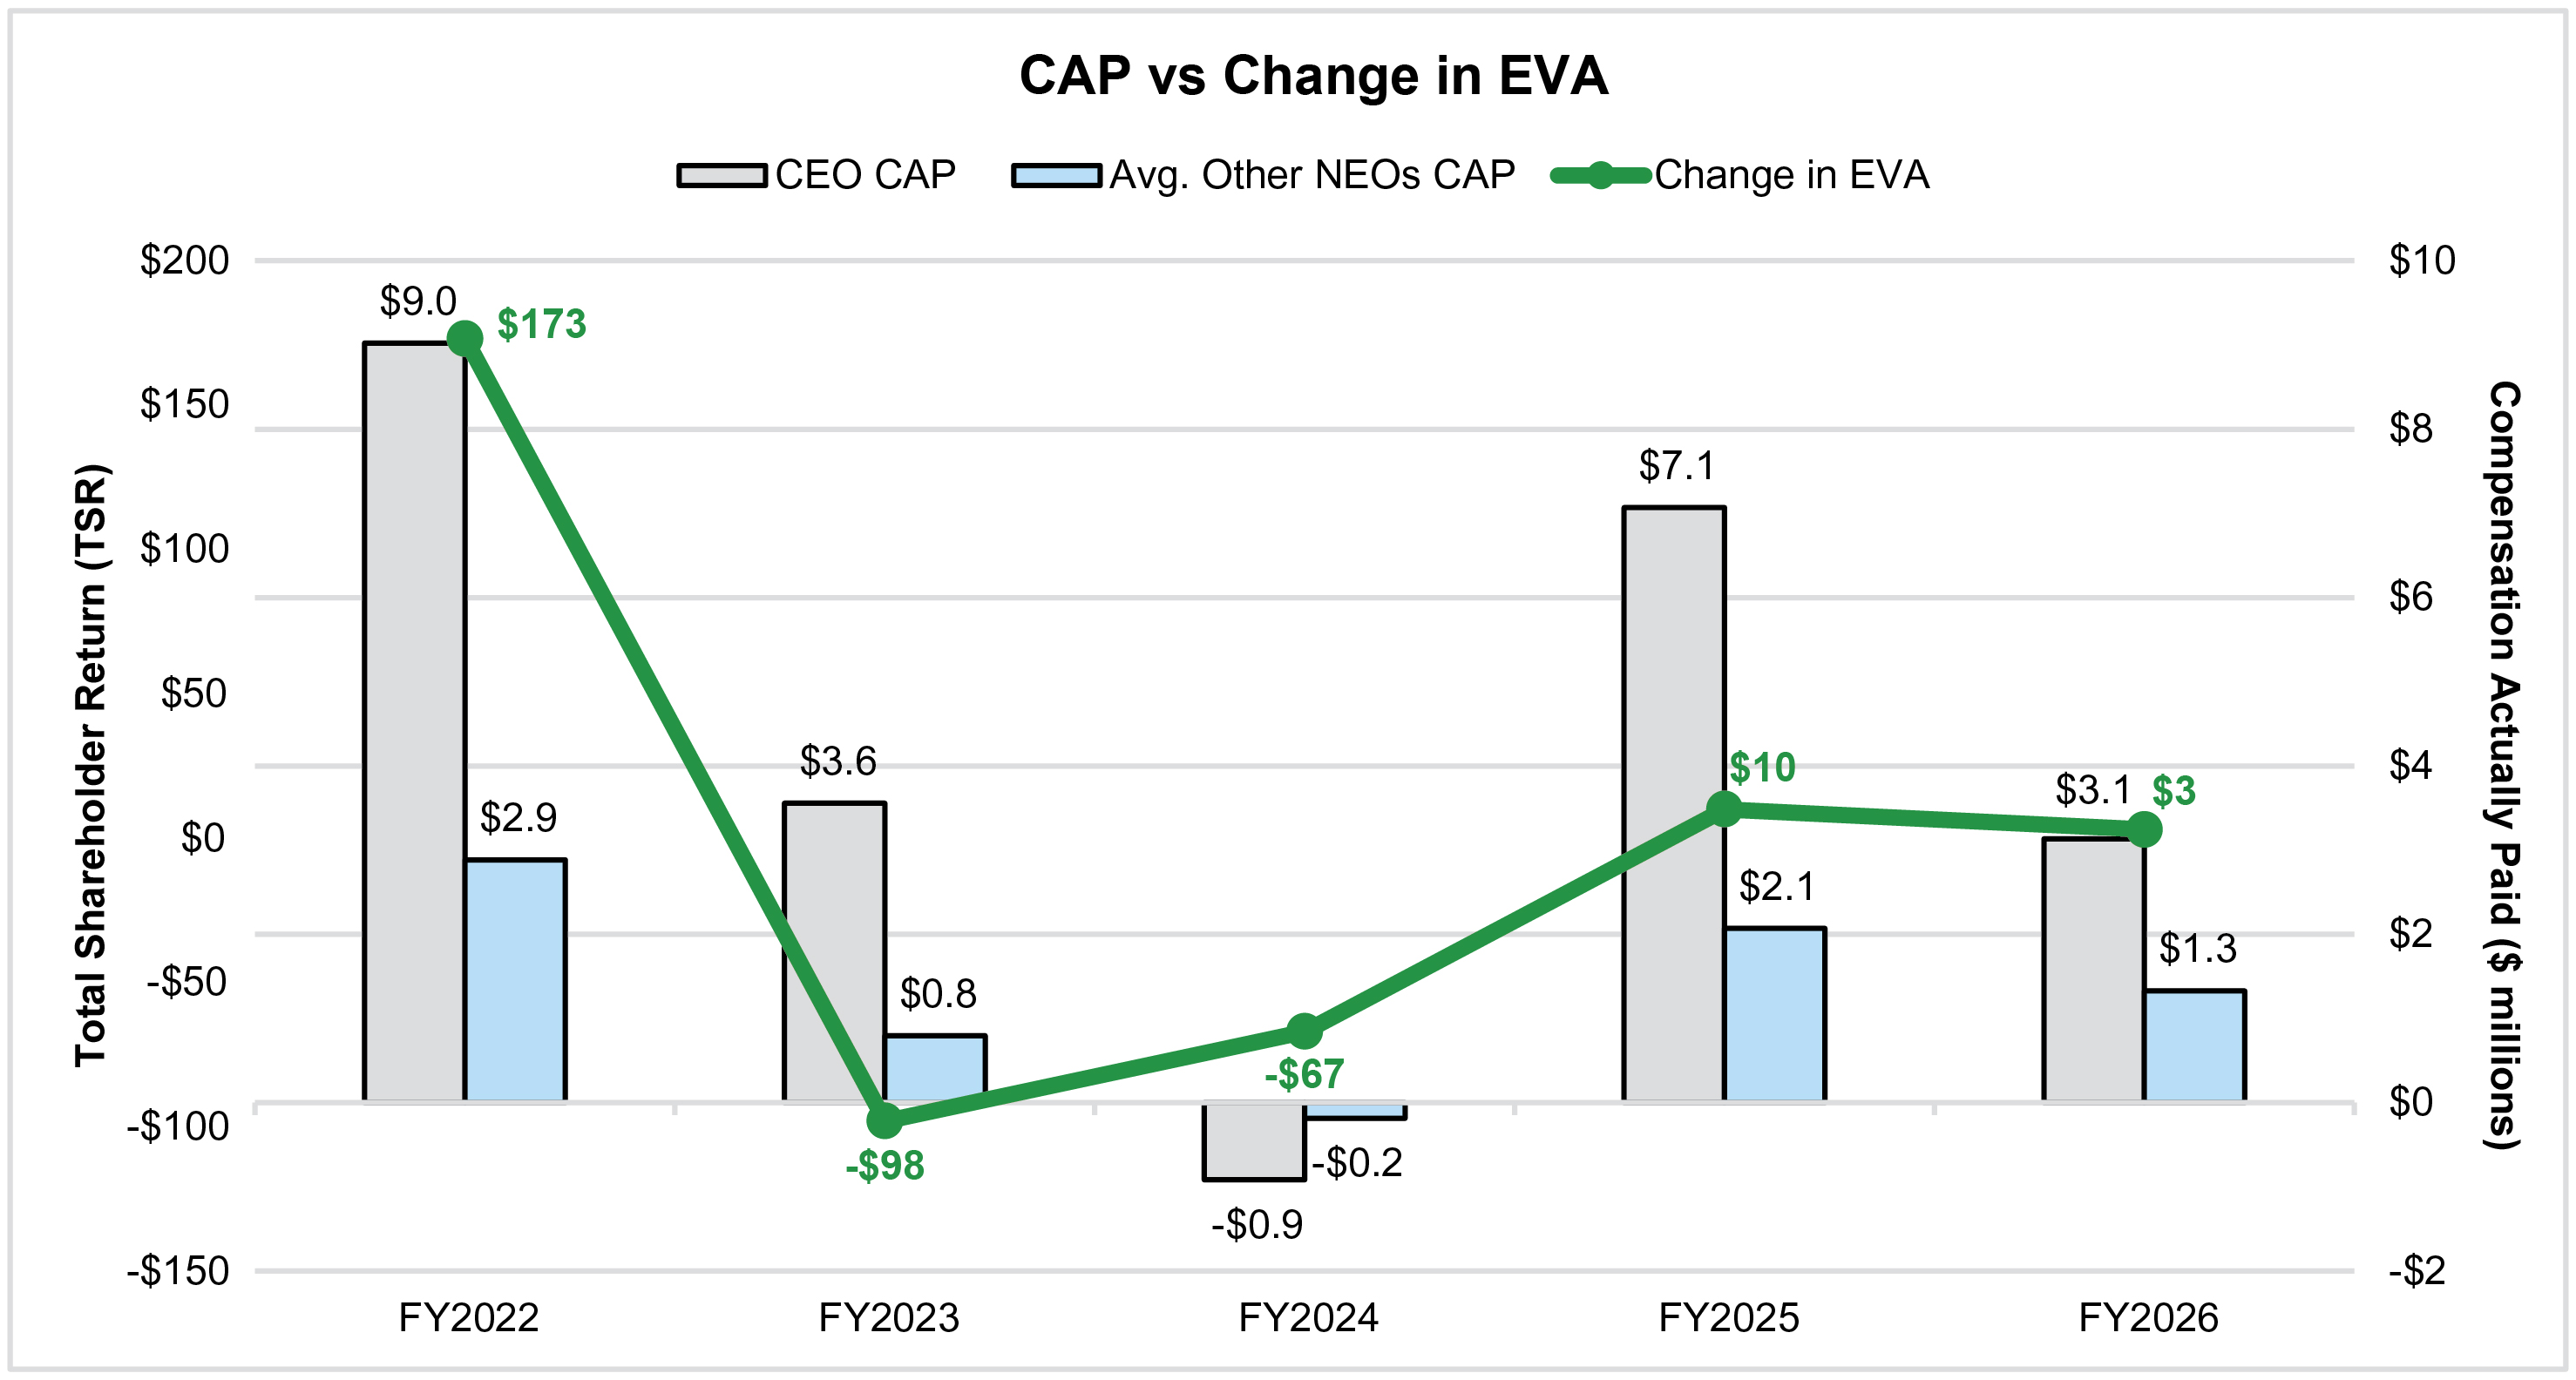
The following table sets forth additional compensation information of our Principal Executive Officer (“PEO”) and our non-PEO named executive officers (“non-PEO NEOs”) along with total shareholder return, net income (loss) and change in EVA results for Fiscal 2026, Fiscal 2025, Fiscal 2024, Fiscal 2023 and Fiscal 2022. “Compensation actually paid” (“CAP”), as required under SEC rules, reflects adjusted values to unvested and vested equity awards during the fiscal years shown in the table based on year-end stock prices, various accounting valuation assumptions, and projected performance modifiers but does not reflect actual amounts paid out for those awards. For a discussion of how the compensation committee assessed Genesco’s performance and the named executive officers’ pay each year, see the “Compensation Discussion and Analysis” in this proxy statement and in the proxy statements for Fiscal 2022, Fiscal 2023, Fiscal 2024 and Fiscal 2025.


Value of Initial Fixed $100
Investment Based on:


Year (a)


Summary
Compensation
Table Total
for PEO
($)(1)
(b)


Compensation
Actually Paid
to PEO
($)(2)
(c)


Average
Summary
Compensation
Table Total for
Non-PEO
NEOs
($)(3)
(d)


Average
Compensation
Actually Paid
to Non-PEO
NEOs
($)(4)
(e)


Genesco
TSR
($)(5)
(f)


Peer
Group
TSR
($)(6)
(g)


Net Income
(Loss)
($ Millions)
(7)
(h)


Change in
EVA
($ Millions)
(8)
(i)


Fiscal 2026


$

4,444,023


$

3,135,937


$

1,543,110


$

1,331,211


$

75


$

67


$

13


$

3


Fiscal 2025


$

5,185,437


$

7,065,754


$

1,640,128


$

2,069,106


$

107


$

71


$

(19

)


$

10


Fiscal 2024


$

4,250,035


$

(911,957

)


$

860,620


$

(183,778

)


$

74


$

77


$

(17

)


$

(67

)

Fiscal 2023


$

3,711,215


$

3,555,298


$

942,522


$

794,370


$

123


$

97


$

72


$

(98

)

Fiscal 2022


$

8,766,458


$

9,109,572


$

2,876,839


$

2,887,343


$

162


$

107


$

115


$

173


(1)
Reflects compensation amounts reported in the “Summary Compensation Table” for the PEO for the respective years shown.
(2)
“Compensation actually paid” to the PEO in each of Fiscal 2026, Fiscal 2025, Fiscal 2024, Fiscal 2023 and Fiscal 2022 reflects the respective amounts set forth in column (c) above, adjusted as set forth in the table below, as determined in accordance with SEC rules. The dollar amounts reflected in column (c) above do not reflect the actual amount of compensation earned by or paid to our PEO during the applicable year. For information regarding the decisions made by the compensation committee with respect to the PEO compensation for each fiscal year, please see the “Compensation Discussion and Analysis” sections of the proxy statements reporting pay for the fiscal years covered in the table above.


Fiscal Year


2022


2023


2024


2025


2026


CEO


Vaughn


Vaughn


Vaughn


Vaughn


Vaughn


SCT Total Compensation ($)


$

8,766,458


$

3,711,215


$

4,250,035


$

5,185,437


$

4,444,023


Less: Stock and Option Award Values Reported
   in SCT for the Covered Year ($)


$

5,113,804


$

2,674,267


$

3,183,204


$

3,475,696


$

2,717,422


Plus: Fair Value for Stock and Option Awards
   Granted in the Covered Year ($)


$

2,413,120


$

4,202,402


$

1,231,973


$

4,742,042


$

4,219,556


Change in Fair Value of Outstanding Unvested
   Stock and Option Awards from Prior Years ($)


$

2,217,017


$

(1,290,521

)


$

(1,767,052

)


$

805,415


$

(1,512,383

)

Change in Fair Value of Stock and Option
  Awards from Prior Years that Vested in the
  Covered Year ($)


$

826,781


$

(393,532

)


$

(1,443,709

)


$

(191,443

)


$

(1,297,838

)

Less: Fair Value of Stock and Option Awards
   Forfeited during the Covered Year ($)


$


$


$


$


$


Less: Aggregate Change in Actuarial Present Value
   of Accumulated Benefit Under Pension Plans ($)


$


$


$


$


$


Plus: Aggregate Service Cost and Prior Service
   Cost for Pension Plans ($)


$


$


$


$


$


Compensation Actually Paid ($)


$

9,109,572


$

3,555,298


$

(911,957

)


$

7,065,754


$

3,135,937


Note: Equity Valuations: Stock option grant date fair value is calculated based on the Black-Scholes option pricing model as of date of grant. Adjustments have been made using stock option fair values as of each measurement date using the stock price as of the measurement date and updated assumptions (i.e., term, volatility, dividend yield, risk free rates) as of the measurement date. Time-vested restricted share grant date fair values are calculated using the stock price as of date of grant.

Adjustments have been made using the stock price as of year-end and as of each date of vest.

Note that a portion of Fiscal 2022 bonus was paid in stock in Fiscal 2023, with a grant date of March 24, 2022. Both the cash and equity portions of this bonus were disclosed in the Summary Compensation Table for Fiscal 2022 (the cash was reported as Non-Equity Incentive Plan Compensation and the equity was reported as a Stock Award). Given the early Fiscal 2023 grant date for the equity portion of the bonus, for the “compensation actually paid” calculations, such portion was treated as a subtraction in Fiscal 2022 and an addition in Fiscal 2023.

(3)
The following non-PEO named executive officers are included in the average figures shown: Harris, Becker, Desai and Gray for Fiscal 2026; Becker, Desai, Harris and Gray for Fiscal 2025; George, Becker, Desai, Daniel E. Ewoldsen and Mario Gallione for Fiscal 2024; George, Gallione, Desai and Ewoldsen for Fiscal 2023; and George, Becker, Gallione and Desai for Fiscal 2022.
(4)
Average “compensation actually paid” for our non-PEO NEOs in each of Fiscal 2026, Fiscal 2025, Fiscal 2024, Fiscal 2023 and Fiscal 2022 reflects the respective amounts set forth in column (e) of the table above, adjusted as set forth in the table below, as determined in accordance with SEC rules. The dollar amounts reflected in column (e) of the table above do not reflect the actual amount of compensation earned by or paid to our non-PEO NEOs during the applicable year. For information regarding the decisions made by our compensation committee in regards to the non-PEO NEOs’ compensation for each fiscal year, please see the “Compensation Discussion and Analysis” sections of the proxy statements reporting pay for the fiscal years covered in the table above.


Fiscal Year


2022


2023


2024


2025


2026


Non-PEO NEOs


See Column
(d) Note


See Column
(d) Note


See Column
(d) Note


See Column
(d) Note


See Column
(d) Note


SCT Total Compensation ($)


$

2,876,839


$

942,522


$

860,620


$

1,640,128


$

1,543,110


Less: Stock and Option Award Values Reported
   in SCT for the Covered Year ($)


$

1,538,400


$

353,906


$

393,522


$

911,866


$

447,872


Plus: Fair Value for Stock and Option Awards
   Granted in the Covered Year ($)


$

887,769


$

641,691


$

168,250


$

1,058,716


$

750,625


Change in Fair Value of Outstanding Unvested
   Stock and Option Awards from Prior Years ($)


$

452,546


$

(314,332

)


$

(253,562

)


$

56,961


$

(386,011

)

Plus Fair Value at Vesting Date of Awards
   Granted and Vested During the Fiscal
   Year ($)


$


$


$


$

242,632


$


Change in Fair Value of Stock and Option Awards
   from Prior Years that Vested in the Covered
   Year ($)


$

208,590


$

(121,605

)


$

(316,954

)


$

(17,464

)


$

(128,640

)

Less: Fair Value of Stock and Option Awards
   Forfeited during the Covered Year ($)


$


$


$

248,610


$


$


Less: Aggregate Change in Actuarial Present
   Value of Accumulated Benefit Under Pension
   Plans ($)


$


$


$


$


$


Plus: Aggregate Service Cost and Prior Service
   Cost for Pension Plans ($)


$


$


$


$


$


Compensation Actually Paid ($)


$

2,887,343


$

794,370


$

(183,778

)


$

2,069,106


$

1,331,211


Note: Equity Valuations: Stock option grant date fair value is calculated based on the Black-Scholes option pricing model as of date of grant. Adjustments have been made using stock option fair values as of each measurement date using the stock price as of the measurement date and updated assumptions (i.e., term, volatility, dividend yield, risk free rates) as of the measurement date. Time-vested restricted share grant date fair values are calculated using the stock price as of date of grant.

Adjustments have been made using the stock price as of year-end and as of each date of vest.

Note that a portion of Fiscal 2022 bonus was paid in stock in Fiscal 2023, with a grant date of March 24, 2022. Both the cash and equity portions of this bonus were disclosed in the Summary Compensation Table for Fiscal 2022 (the cash was reported as Non-Equity Incentive Plan Compensation and the equity was reported as a Stock Award). Given the early Fiscal 2023 grant date for the equity portion of the bonus, for the “compensation actually paid” calculations, such portion was treated as a subtraction in Fiscal 2022 and an addition in Fiscal 2023.

(5)
For the relevant fiscal year, represents the cumulative value of $100 invested in Genesco for the measurement periods beginning on January 30, 2021 and ending on January 31, 2026, February 1, 2025, February 3, 2024, January 28, 2023, and January 29, 2022, respectively.
(6)
For the relevant fiscal year, represents the cumulative TSR (“Peer Group TSR”) of the annual report Peer Group consisting of Caleres, Inc., Designer Brands, Foot Locker, Inc. - included through September 8, 2025 when it was acquired by DICK's Sporting Goods, Inc., Shoe Carnival, Inc. and Wolverine World Wide, Inc. (the “Peer Group”) for the measurement periods beginning on January 30, 2021 and ending on January 31, 2026, February 1, 2025, February 3, 2024, January 28, 2023 and January 29, 2022, respectively.
(7)
Reflects “Net Income (Loss)” in the Company’s Consolidated Statements of Operations included in the Company’s Annual Reports on Form 10-K for each of the years ended January 31, 2026, February 1, 2025, February 3, 2024, January 28, 2023 and January 29, 2022.
(8)
Company-Selected Measure is change in economic value added, or EVA. The Company determined EVA in Fiscal 2026 by subtracting from a business unit’s “net operating profit after taxes,” or NOPAT, a charge of 10% of the “average net assets” employed to generate the profit. EVA, NOPAT and average net assets are non-GAAP financial measures the Company computes utilizing, and for purposes of supplementing, certain financial metrics included in the Company’s audited consolidated financial statements, which are prepared in accordance with GAAP. For more information on EVA, NOPAT and average net assets, please see “EVA Calculations” above in “Executive Compensation — Compensation Discussion and Analysis — Fiscal 2026 Compensation Discussion.”
       
Company Selected Measure Name change in economic value added        
Named Executive Officers, Footnote
(3)
The following non-PEO named executive officers are included in the average figures shown: Harris, Becker, Desai and Gray for Fiscal 2026; Becker, Desai, Harris and Gray for Fiscal 2025; George, Becker, Desai, Daniel E. Ewoldsen and Mario Gallione for Fiscal 2024; George, Gallione, Desai and Ewoldsen for Fiscal 2023; and George, Becker, Gallione and Desai for Fiscal 2022.
       
PEO Total Compensation Amount $ 4,444,023 $ 5,185,437 $ 4,250,035 $ 3,711,215 $ 8,766,458
PEO Actually Paid Compensation Amount $ 3,135,937 7,065,754 (911,957) 3,555,298 9,109,572
Adjustment To PEO Compensation, Footnote

Fiscal Year


2022


2023


2024


2025


2026


CEO


Vaughn


Vaughn


Vaughn


Vaughn


Vaughn


SCT Total Compensation ($)


$

8,766,458


$

3,711,215


$

4,250,035


$

5,185,437


$

4,444,023


Less: Stock and Option Award Values Reported
   in SCT for the Covered Year ($)


$

5,113,804


$

2,674,267


$

3,183,204


$

3,475,696


$

2,717,422


Plus: Fair Value for Stock and Option Awards
   Granted in the Covered Year ($)


$

2,413,120


$

4,202,402


$

1,231,973


$

4,742,042


$

4,219,556


Change in Fair Value of Outstanding Unvested
   Stock and Option Awards from Prior Years ($)


$

2,217,017


$

(1,290,521

)


$

(1,767,052

)


$

805,415


$

(1,512,383

)

Change in Fair Value of Stock and Option
  Awards from Prior Years that Vested in the
  Covered Year ($)


$

826,781


$

(393,532

)


$

(1,443,709

)


$

(191,443

)


$

(1,297,838

)

Less: Fair Value of Stock and Option Awards
   Forfeited during the Covered Year ($)


$


$


$


$


$


Less: Aggregate Change in Actuarial Present Value
   of Accumulated Benefit Under Pension Plans ($)


$


$


$


$


$


Plus: Aggregate Service Cost and Prior Service
   Cost for Pension Plans ($)


$


$


$


$


$


Compensation Actually Paid ($)


$

9,109,572


$

3,555,298


$

(911,957

)


$

7,065,754


$

3,135,937


Non-PEO NEO Average Total Compensation Amount $ 1,543,110 1,640,128 860,620 942,522 2,876,839
Non-PEO NEO Average Compensation Actually Paid Amount $ 1,331,211 2,069,106 (183,778) 794,370 2,887,343
Adjustment to Non-PEO NEO Compensation Footnote

Fiscal Year


2022


2023


2024


2025


2026


Non-PEO NEOs


See Column
(d) Note


See Column
(d) Note


See Column
(d) Note


See Column
(d) Note


See Column
(d) Note


SCT Total Compensation ($)


$

2,876,839


$

942,522


$

860,620


$

1,640,128


$

1,543,110


Less: Stock and Option Award Values Reported
   in SCT for the Covered Year ($)


$

1,538,400


$

353,906


$

393,522


$

911,866


$

447,872


Plus: Fair Value for Stock and Option Awards
   Granted in the Covered Year ($)


$

887,769


$

641,691


$

168,250


$

1,058,716


$

750,625


Change in Fair Value of Outstanding Unvested
   Stock and Option Awards from Prior Years ($)


$

452,546


$

(314,332

)


$

(253,562

)


$

56,961


$

(386,011

)

Plus Fair Value at Vesting Date of Awards
   Granted and Vested During the Fiscal
   Year ($)


$


$


$


$

242,632


$


Change in Fair Value of Stock and Option Awards
   from Prior Years that Vested in the Covered
   Year ($)


$

208,590


$

(121,605

)


$

(316,954

)


$

(17,464

)


$

(128,640

)

Less: Fair Value of Stock and Option Awards
   Forfeited during the Covered Year ($)


$


$


$

248,610


$


$


Less: Aggregate Change in Actuarial Present
   Value of Accumulated Benefit Under Pension
   Plans ($)


$


$


$


$


$


Plus: Aggregate Service Cost and Prior Service
   Cost for Pension Plans ($)


$


$


$


$


$


Compensation Actually Paid ($)


$

2,887,343


$

794,370


$

(183,778

)


$

2,069,106


$

1,331,211


Compensation Actually Paid vs. Total Shareholder Return

img256351509_8.jpg

       
Compensation Actually Paid vs. Net Income

img256351509_9.jpg

       
Compensation Actually Paid vs. Company Selected Measure

img256351509_10.jpg

       
Total Shareholder Return Vs Peer Group

img256351509_8.jpg

       
Tabular List, Table

List of Performance Measures

Listed below are the performance measures which in our assessment represent the most important financial performance measures we use to link compensation actually paid to our named executive officers, for Fiscal 2026, to Company performance.


Measure


Nature

Change in EVA


Financial

Adjusted Operating Income


Financial

       
Total Shareholder Return Amount $ 75 107 74 123 162
Peer Group Total Shareholder Return Amount 67 71 77 97 107
Net Income (Loss) $ 13,000,000 $ (19,000,000) $ (17,000,000) $ 72,000,000 $ 115,000,000
Company Selected Measure Amount 3,000,000 10,000,000 (67,000,000) (98,000,000) 173,000,000
PEO Name Vaughn Vaughn Vaughn Vaughn Vaughn
Measure:: 1          
Pay vs Performance Disclosure          
Name Change in EVA        
Measure:: 2          
Pay vs Performance Disclosure          
Name Adjusted Operating Income        
PEO | Aggregate Change in Present Value of Accumulated Benefit for All Pension Plans Reported in Summary Compensation Table          
Pay vs Performance Disclosure          
Adjustment to Compensation, Amount $ 0 $ 0 $ 0 $ 0 $ 0
PEO | Aggregate Pension Adjustments Service Cost          
Pay vs Performance Disclosure          
Adjustment to Compensation, Amount 0 0 0 0 0
PEO | Aggregate Grant Date Fair Value of Equity Award Amounts Reported in Summary Compensation Table          
Pay vs Performance Disclosure          
Adjustment to Compensation, Amount (2,717,422) (3,475,696) (3,183,204) (2,674,267) (5,113,804)
PEO | Year-end Fair Value of Equity Awards Granted in Covered Year that are Outstanding and Unvested          
Pay vs Performance Disclosure          
Adjustment to Compensation, Amount 4,219,556 4,742,042 1,231,973 4,202,402 2,413,120
PEO | Year-over-Year Change in Fair Value of Equity Awards Granted in Prior Years That are Outstanding and Unvested          
Pay vs Performance Disclosure          
Adjustment to Compensation, Amount (1,512,383) 805,415 (1,767,052) (1,290,521) 2,217,017
PEO | Change in Fair Value as of Vesting Date of Prior Year Equity Awards Vested in Covered Year          
Pay vs Performance Disclosure          
Adjustment to Compensation, Amount (1,297,838) (191,443) (1,443,709) (393,532) 826,781
PEO | Prior Year End Fair Value of Equity Awards Granted in Any Prior Year that Fail to Meet Applicable Vesting Conditions During Covered Year          
Pay vs Performance Disclosure          
Adjustment to Compensation, Amount 0 0 0 0 0
Non-PEO NEO | Aggregate Change in Present Value of Accumulated Benefit for All Pension Plans Reported in Summary Compensation Table          
Pay vs Performance Disclosure          
Adjustment to Compensation, Amount 0 0 0 0 0
Non-PEO NEO | Aggregate Pension Adjustments Service Cost          
Pay vs Performance Disclosure          
Adjustment to Compensation, Amount 0 0 0 0 0
Non-PEO NEO | Aggregate Grant Date Fair Value of Equity Award Amounts Reported in Summary Compensation Table          
Pay vs Performance Disclosure          
Adjustment to Compensation, Amount (447,872) (911,866) (393,522) (353,906) (1,538,400)
Non-PEO NEO | Year-end Fair Value of Equity Awards Granted in Covered Year that are Outstanding and Unvested          
Pay vs Performance Disclosure          
Adjustment to Compensation, Amount 750,625 1,058,716 168,250 641,691 887,769
Non-PEO NEO | Year-over-Year Change in Fair Value of Equity Awards Granted in Prior Years That are Outstanding and Unvested          
Pay vs Performance Disclosure          
Adjustment to Compensation, Amount (386,011) 56,961 (253,562) (314,332) 452,546
Non-PEO NEO | Vesting Date Fair Value of Equity Awards Granted and Vested in Covered Year          
Pay vs Performance Disclosure          
Adjustment to Compensation, Amount 0 242,632 0 0 0
Non-PEO NEO | Change in Fair Value as of Vesting Date of Prior Year Equity Awards Vested in Covered Year          
Pay vs Performance Disclosure          
Adjustment to Compensation, Amount (128,640) (17,464) (316,954) (121,605) 208,590
Non-PEO NEO | Prior Year End Fair Value of Equity Awards Granted in Any Prior Year that Fail to Meet Applicable Vesting Conditions During Covered Year          
Pay vs Performance Disclosure          
Adjustment to Compensation, Amount $ 0 $ 0 $ (248,610) $ 0 $ 0