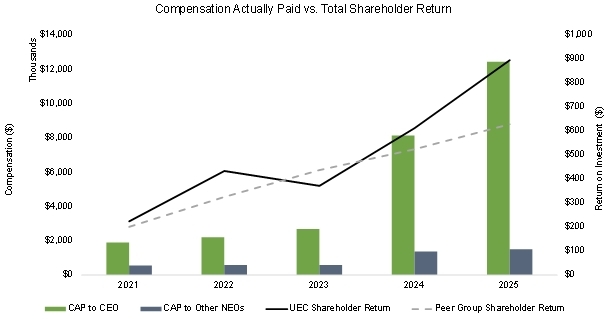
The following summarizes the relationship between the executive "Compensation Actually Paid" by the Company, our TSR and Peer Group TSR for the five years ending July 31, 2025 for our CEO and other NEOs.
| | | | | | | | | | | | | | | | | | Value of Initial Fixed $100 Investment Based On: | | | | | |
|||||
Year (a) | | Summary Compensation ($) (b) | | | Compensation Actually Paid to Other NEOs (2) ($) (c) | | | Average Summary Compensation Table Total for Other NEOs (1) ($) (d) | | | Average Compensation Actually Paid to Other NEOs (2) ($) (e) | | | Total Shareholder Return (3) ($) (f) | | | Peer Group Total Shareholder Return (3)(4) ($) (g) | | | Net Income ($ in thousands) (h) | |
|||||||
2025 | | | 6,356,248 | | | | 12,436,349 | | | | 969,360 | | | | 1,503,071 | | | | 895.38 | | | | 628.66 | | | | (87,656 | ) |
2024 | | | 5,365,453 | | | | 8,144,553 | | | | 807,301 | | | | 1,378,756 | | | | 612.41 | | | | 384.43 | | | | (29,221 | ) |
2023 | | | 3,700,780 | | | | 2,690,924 | | | | 742,727 | | | | 581,394 | | | | 371.79 | | | | 319.39 | | | | (3,307 | ) |
2022 | | | 2,315,872 | | | | 2,212,036 | | | | 603,525 | | | | 590,809 | | | | 433.75 | | | | 283.00 | | | | 5,252 | |
2021 | | | 1,635,553 | | | | 1,907,583 | | | | 500,947 | | | | 557,369 | | | | 224.10 | | | | 188.88 | | | | (14,813 | ) |
Notes:
(1) | For columns (b) and (d), the dollar amounts represent total compensation paid to our CEO and other NEOs, respectively, and are taken directly from the Summary Compensation Table included in our Annual Reports on Form 10-K for the applicable years. For Fiscal 2025, these other NEOs included Josephine Man, Scott Melbye, Brent Berg and Pat Obara. For Fiscal 2024, they included Scott Melbye, Pat Obara and Brent Berg. For Fiscals 2023, 2022 and 2021 they included Scott Melbye and Pat Obara. |
(2) | The following table sets forth the adjustments made to arrive at "Compensation Actually Paid" for our CEO and other NEOs during each of the fiscal years reflected in this table. |
(3) | Total shareholder return represents the value of a deemed fixed investment of $100 at market close on July 31, 2020, assuming the reinvestment of dividends, if any. Total shareholder return is calculated by dividing the sum of the cumulative amount of dividends for the measurement period, assuming dividend reinvestment, and the difference between our share price at the end and the beginning of the measurement period, by the share price at the beginning of the measurement period. For the purposes of this table our Peer Group consisted of the following companies: Cameco Corporation, Centrus Energy Corp., Comstock Resources, Inc., Denison Mines Corp., Energy Fuels Inc., Gulfport Energy Corporation, Magnolia Oil & Gas Corporation, NexGen Energy Ltd., NGEx Minerals Ltd., Northern Oil and Gas, Inc., NuScale Power Corporation, Oklo Inc. and Vital Energy, Inc. For the purposes of understanding the cumulative returns over time, this table should be read from bottom to top. |
(4) | Beginning in Fiscal 2025, we updated our Peer Group used for total return comparison in this table. For more details related to the current Peer Group in comparison to the previous peer group, refer to "- Benchmarking Compensation and Peer Groups" above. For consistency and comparability, the total return for the current Peer Group has been calculated and presented retroactively for all years included in this table, starting from the base year date of August 1, 2020. The total return of the peer group used prior to Fiscal 2025 for the same period is provided below for reference. |
| | Total Return | |
|||||
Year | | 2024 Peer Group | | | 2025 Peer Group | |
||
2025 | | | 348.24% |
| | | 528.66% |
|
2024 | | | 247.70% |
| | | 284.43% |
|
2023 | | | 195.88% |
| | | 219.39% |
|
2022 | | | 153.07% |
| | | 183.00% |
|
2021 | | | 73.25% |
| | | 88.88% |
|
(5) | Net income (loss) represents the amounts reported in our audited financial statements included in our Annual Report. |
Compensation Actually Paid to CEO and Average Compensation Actually Paid to Other NEOs
Adjustments to Determine | | 2025 | | | 2024 | | | 2023 | | | 2022 | | | 2021 | |
||||||||||||||||||||||||
Compensation Actually Paid | | CEO ($) | | Other ($) | | | CEO ($) | | | Other NEOs ($) | | | CEO ($) | | | Other ($) | | | CEO ($) | | | Other NEOs ($) | | | CEO ($) | | | Other NEOs ($) | |
||||||||||
Total reported in Summary Compensation Table | | | 6,356,248 | | | 969,360 | | | | 5,365,453 | | | | 807,301 | | | | 3,700,780 | | | | 742,727 | | | | 2,315,872 | | | | 603,525 | | | | 1,635,553 | | | | 500,947 | |
| | | | | | | | | | | | | | | | | | | | | | | | | | | | | | | | | | | | | | | |
Less, amounts reported under "Stock Awards" in the Summary Compensation Table | | | (3,998,055 | ) | | (449,040 | ) | | | (3,640,453 | ) | | | (397,756 | ) | | | (2,026,264 | ) | | | (312,562 | ) | | | (964,705 | ) | | | (233,357 | ) | | | (895,553 | ) | | | (255,292 | ) |
| | | | | | | | | | | | | | | | | | | | | | | | | | | | | | | | | | | | | | | |
Less, amounts reported under "Option Awards" in the Summary Compensation Table | | | - | | | (24,989 | ) | | | - | | | | - | | | | (240,516 | ) | | | (37,101 | ) | | | - | | | | - | | | | - | | | | - | |
| | | | | | | | | | | | | | | | | | | | | | | | | | | | | | | | | | | | | | | |
Add, fair value of equity awards granted during the year that were outstanding and unvested as of year end (*) | | | 3,998,055 | | | 474,276 | | | | 3,640,453 | | | | 397,756 | | | | 1,320,337 | | | | 203,669 | | | | 573,602 | | | | 138,751 | | | | 506,250 | | | | 144,314 | |
| | | | | | | | | | | | | | | | | | | | | | | | | | | | | | | | | | | | | | | |
Add, change as of the end of the fiscal year (from the end of the prior fiscal year) in fair value of awards granted in prior fiscal years that are outstanding and unvested as of year end (*) | | | 4,132,195 | | | 327,714 | | | | 1,309,012 | | | | 211,109 | | | | (63,413 | ) | | | (15,339 | ) | | | 287,267 | | | | 81,890 | | | | 661,333 | | | | 167,400 | |
| | | | | | | | | | | | | | | | | | | | | | | | | | | | | | | | | | | | | | | |
Add, the fair value of equity awards granted and vested during the fiscal year | | | - | | | 5,218 | | | | - | | | | - | | | | - | | | | - | | | | - | | | | - | | | | - | | | | - | |
| | | | | | | | | | | | | | | | | | | | | | | | | | | | | | | | | | | | | | | |
Add, change as of the vesting | | | 1,947,906 | | | 200,532 | | | | 1,470,088 | | | | 360,346 | | | | - | | | | - | | | | - | | | | - | | | | - | | | | - | |
Total Adjustments | | | 6,080,101 | | | 533,711 | | | | 2,779,100 | | | | 571,455 | | | | (1,009,856 | ) | | | (161,333 | ) | | | (103,836 | ) | | | (12,716 | ) | | | 272,030 | | | | 56,422 | |
Compensation Actually Paid | | | 12,436,349 | | | 1,503,071 | | | | 8,144,553 | | | | 1,378,756 | | | | 2,690,924 | | | | 581,394 | | | | 2,212,036 | | | | 590,809 | | | | 1,907,583 | | | | 557,369 | |
(*) The fair value or incremental fair value of all incentive equity awards is determined in accordance with ASC 718, Compensation – Stock Compensation, generally using the same methodology and assumptions we use for financial reporting purposes when determining the grant date fair value of our equity awards reflected in the Summary Compensation Table herein.
Compensation Actually Paid Versus Performance
Our Executive compensation is linked strongly to our performance, with a majority of annual target compensation being variable and at-risk. In Fiscal 2025, 90% and 70% of the total target compensation for our CEO and other NEOs on average, respectively, was at-risk and tied to performance measures that relate to, or impact, stockholder return.
The following charts provide depict Compensation Actually Paid to our NEO against our TSR and Peer Group TSR.