PAY VERSUS PERFORMANCE DISCLOSURE
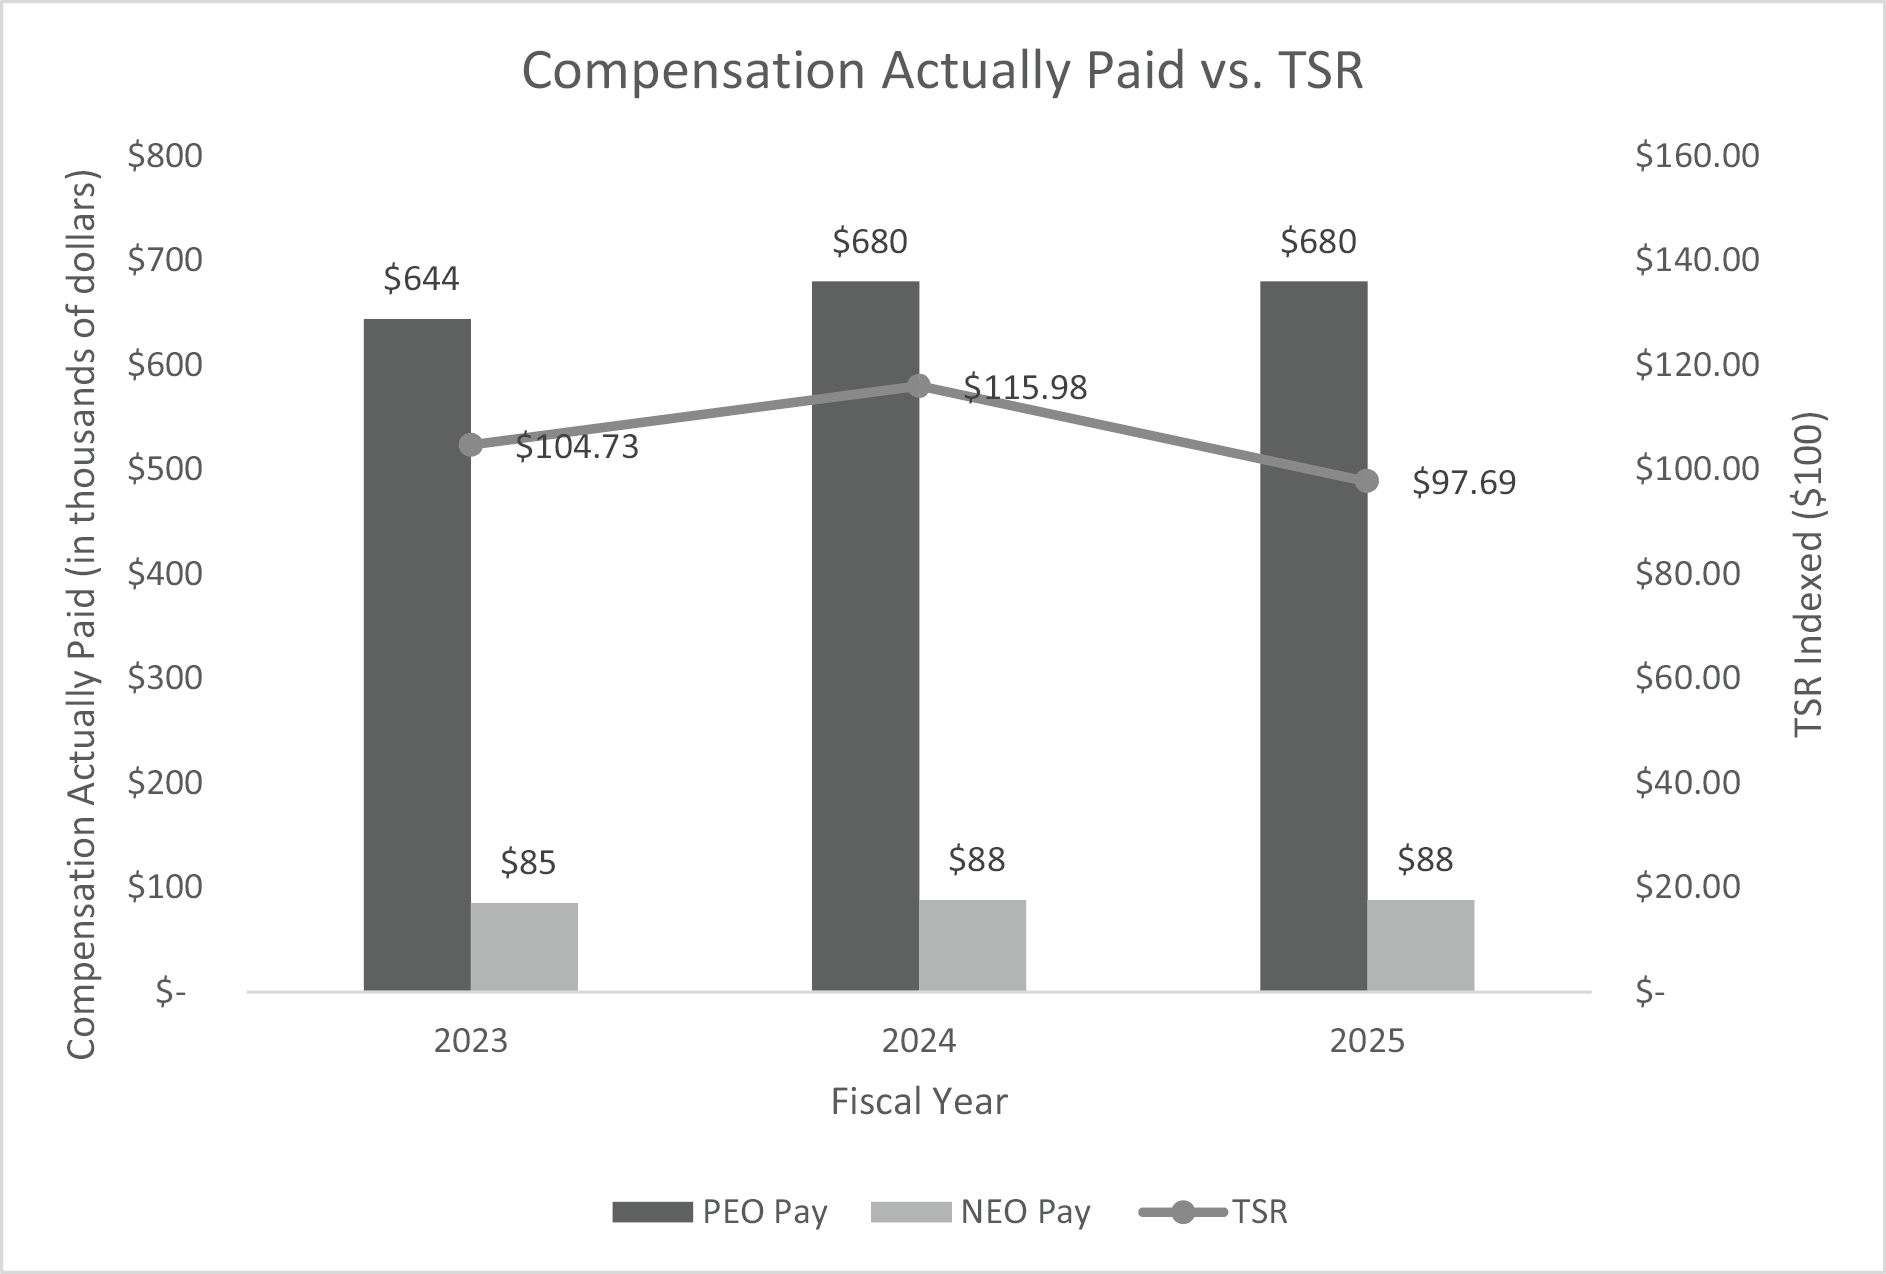
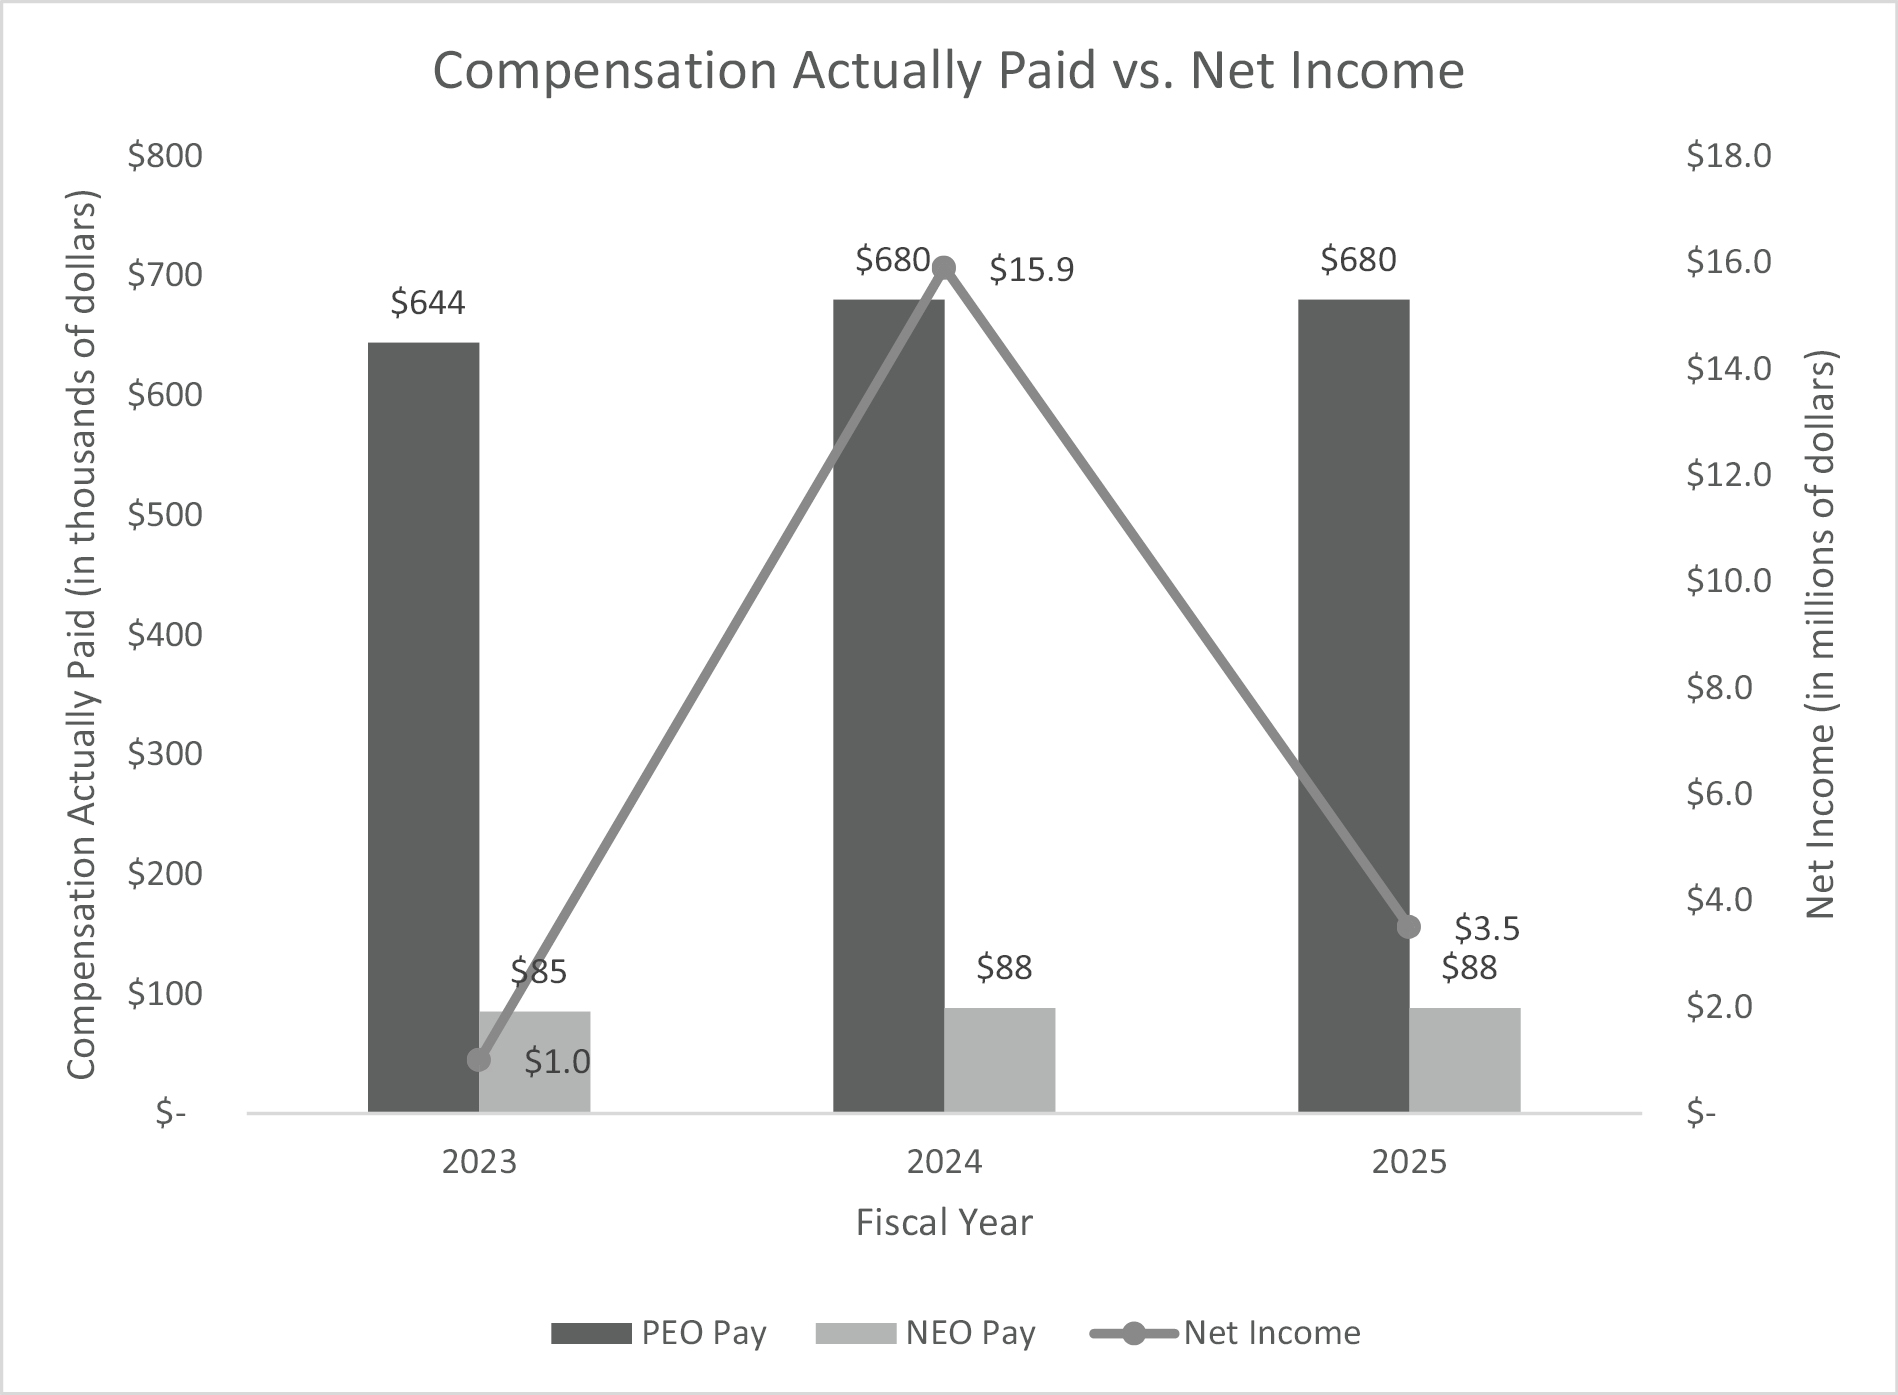
As required by Section 953(a) of the Dodd-Frank Wall Street Reform and Consumer Protection Act and Item 402(v) of Regulation S-K, the following table is intended to illustrate compensation “actually paid” to our principal executive officer (“PEO”) and the other named executive officers (“NEOs”) for each of the fiscal years ended October 31, 2025, 2024 and 2023, in each case, as compared to (i) our cumulative total shareholder return (“TSR”) performance and (ii) net income. Since the stock awards granted on March 22, 2024 and March 9, 2023 to Robert Hekemian, Jr. and John A. Aiello were fully vested on the date of the grant, there are no differences in our Summary Compensation Table amounts and compensation actually paid for the PEO and NEOs.
For additional information on our compensation programs and philosophy and how we design our compensation programs to align pay with performance, see the section titled “Compensation Discussion and Analysis” on pages 14-19.
| Fiscal Year | Summary | Compensation | Average | Average | Value of Initial | Net Income | ||||||||||||
| 2025 | $ | 680,000 | $ | 680,000 | $ | 87,500 | $ | 87,500 | $ | 97.69 | $ | 3,509 | ||||||
| 2024 | $ | 680,000 | $ | 680,000 | $ | 87,500 | $ | 87,500 | $ | 115.98 | $ | 15,852 | ||||||
| 2023 | $ | 643,644 | $ | 643,644 | $ | 84,978 | $ | 84,978 | $ | 104.73 | $ | 760 | ||||||
____________
(1) Robert Hekemian, Jr. was our principal executive officer for all years shown.
(2) Allan Tubin and John A. Aiello were our NEOs for all years shown.
(3) For the relevant fiscal year, represents the cumulative TSR of FREIT based on the value of an initial fixed investment of $100 on October 31, 2022 and the reinvestment of all dividends.
(4) The dollar amounts reported represent the amount of net income reflected in the Trust’s audited financial statements for the applicable fiscal year.
| [1] | Robert Hekemian, Jr. was our principal executive officer for all years shown. |
| [2] | Allan Tubin and John A. Aiello were our NEOs for all years shown. |
| [3] | For the relevant fiscal year, represents the cumulative TSR of FREIT based on the value of an initial fixed investment of $100 on October 31, 2022 and the reinvestment of all dividends. |
| [4] | The dollar amounts reported represent the amount of net income reflected in the Trust’s audited financial statements for the applicable fiscal year. |