Shareholder Report
|
12 Months Ended |
|
Mar. 31, 2026
USD ($)
Holding
|
|---|
| Shareholder Report [Line Items] |
|
| Document Type |
N-CSR
|
| Amendment Flag |
false
|
| Registrant Name |
Nomura ETF Trust
|
| Entity Central Index Key |
0001969995
|
| Entity Investment Company Type |
N-1A
|
| Document Period End Date |
Mar. 31, 2026
|
| C000245546 |
|
| Shareholder Report [Line Items] |
|
| Fund Name |
Nomura Global Listed Infrastructure ETF
|
| Trading Symbol |
BILD
|
| Security Exchange Name |
NYSEArca
|
| Annual or Semi-Annual Statement [Text Block] |
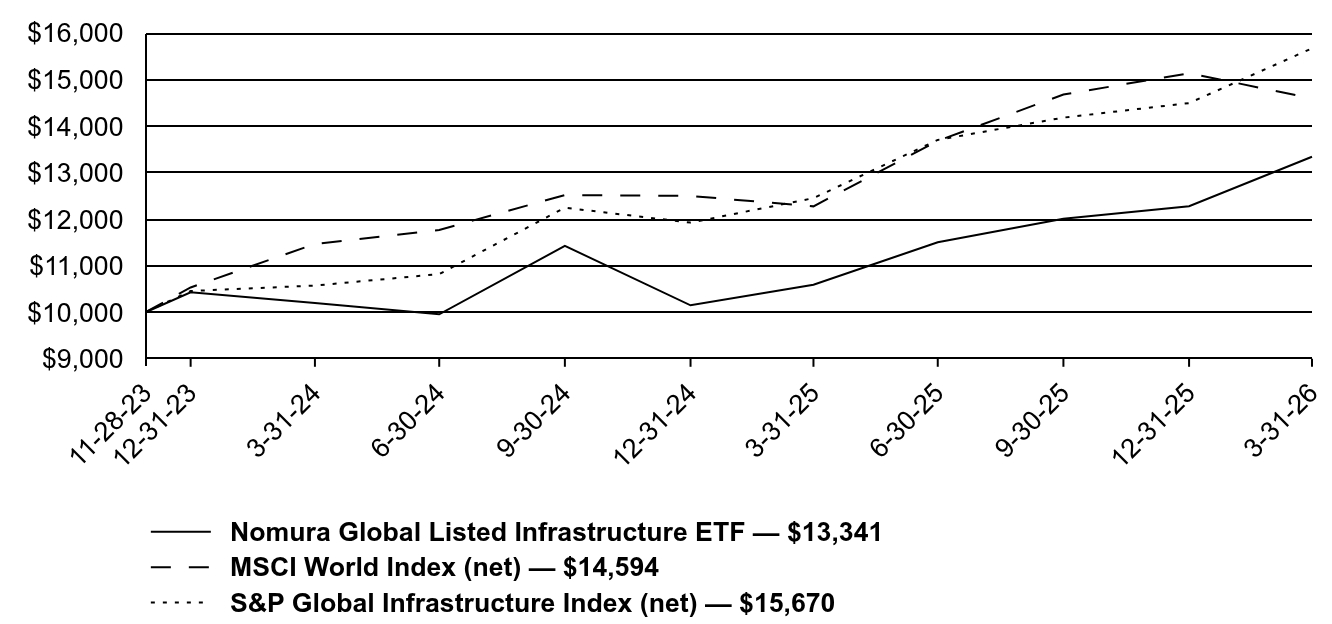
This annual shareholder report contains important information about Nomura Global Listed Infrastructure ETF (Fund) for the period of April 1, 2025, to March 31, 2026
|
| Shareholder Report Annual or Semi-Annual |
Annual shareholder report
|
| Additional Information [Text Block] |
This annual shareholder report contains important information about Nomura Global Listed Infrastructure ETF (Fund) for the period of April 1, 2025, to March 31, 2026. You can find additional information about the Fund at nomuraassetmanagement.com/etf-literature. You can also request this information by contacting us at 844 469-9911, weekdays from 9:00am to 5:00pm ET.
|
| Material Fund Change Notice [Text Block] |
This report describes changes to the Fund that occurred during the reporting period.
|
| Additional Information Phone Number |
844 469-9911
|
| Additional Information Email |
nomuraassetmanagement.com/etf-literature
|
| Expenses [Text Block] |
What were the Fund's costs for the last 12 months?(Based on a hypothetical $10,000 investment) Table SummaryFund | Costs of a $10,000 investment | Costs paid as a percentage of a $10,000 investment |
|---|
BILD | $55 | 0.49% |
|---|
|
| Expenses Paid, Amount |
$ 55
|
| Expense Ratio, Percent |
0.49%
|
| Line Graph [Table Text Block] |
Table Summary | Nomura Global Listed Infrastructure ETF — $13,341 | MSCI World Index (net) — $14,594 | S&P Global Infrastructure Index (net) — $15,670 |
|---|
11-28-23 | 10000 | 10,000 | 10,000 |
|---|
12-31-23 | 10430 | 10,532 | 10,456 |
|---|
3-31-24 | 10197 | 11,468 | 10,574 |
|---|
6-30-24 | 9955 | 11,769 | 10,820 |
|---|
9-30-24 | 11428 | 12,518 | 12,247 |
|---|
12-31-24 | 10149 | 12,499 | 11,926 |
|---|
3-31-25 | 10592 | 12,275 | 12,452 |
|---|
6-30-25 | 11504 | 13,683 | 13,703 |
|---|
9-30-25 | 12011 | 14,678 | 14,182 |
|---|
12-31-25 | 12278 | 15,135 | 14,494 |
|---|
3-31-26 | 13341 | 14,594 | 15,670 |
|---|
|
| Average Annual Return [Table Text Block] |
Table SummaryAverage annual total returns (as of March 31, 2026) | 1 Year | Since
Inception
(11/28/23) |
|---|
Nomura Global Listed Infrastructure ETF | | |
|---|
Net asset value | 25.95% | 13.11% |
|---|
MSCI World Index (net) | 18.90% | 17.54% |
|---|
S&P Global Infrastructure Index (net) | 25.85% | 21.16% |
|---|
|
| Performance Inception Date |
Nov. 28, 2023
|
| AssetsNet |
$ 8,347,669
|
| Holdings Count | Holding |
43
|
| Advisory Fees Paid, Amount |
$ 30,417
|
| InvestmentCompanyPortfolioTurnover |
34.00%
|
| Additional Fund Statistics [Text Block] |
Table SummaryFund net assets | $8,347,669 |
|---|
Total number of portfolio holdingsFootnote Reference* | 43 |
|---|
Total advisory fees paid (during reporting period) | $30,417 |
|---|
Portfolio turnover rate | 34% |
|---|
| Footnote | Description | Footnote* | Excludes cash and cash equivalents. |
|
| Holdings [Text Block] |
Table SummaryUnited States of America | 41.23% |
|---|
United Kingdom | 12.21% |
|---|
Spain | 11.08% |
|---|
Canada | 8.68% |
|---|
Italy | 5.67% |
|---|
New Zealand | 3.17% |
|---|
France | 2.99% |
|---|
Australia | 2.71% |
|---|
Hong Kong | 2.26% |
|---|
China | 2.24% |
|---|
Table SummaryElectric Utility | 25.12% |
|---|
Energy Infrastructure | 16.25% |
|---|
Airports | 15.08% |
|---|
Electricity and Gas Distribution | 13.24% |
|---|
Water | 8.94% |
|---|
Communications Infrastructure | 6.51% |
|---|
Toll Roads | 5.30% |
|---|
Electricity Generation | 4.07% |
|---|
Seaports | 1.75% |
|---|
Electricity Transmission | 1.40% |
|---|
|
| Largest Holdings [Text Block] |
Table SummaryEnbridge, Inc. | 5.94% |
|---|
National Grid plc | 4.13% |
|---|
NextEra Energy, Inc. | 4.06% |
|---|
United Utilities Group plc | 3.96% |
|---|
Sempra | 3.85% |
|---|
Cheniere Energy, Inc. | 3.47% |
|---|
Exelon Corp. | 3.18% |
|---|
Auckland International Airport Ltd. | 3.17% |
|---|
CMS Energy Corp. | 3.12% |
|---|
American Electric Power Co., Inc. | 3.06% |
|---|
|
| Material Fund Change [Text Block] |
Effective December 1, 2025, the Fund was renamed Nomura Global Listed Infrastructure ETF. Effective December 1, 2025, Macquarie Investment Management Global Limited no longer serves as a sub-advisor to the Fund. This is a summary of certain changes to the Fund that occurred during the reporting period. For more complete information, you may review the Fund’s next prospectus, which we expect to be available by August 1, 2026, at nomuraassetmanagement.com/etf-literature or upon request at 844 469-9911, weekdays from 9:00am to 5:00pm ET. |
| C000245548 |
|
| Shareholder Report [Line Items] |
|
| Fund Name |
Nomura Tax-Free USA Short Term ETF
|
| Trading Symbol |
STAX
|
| Security Exchange Name |
NYSEArca
|
| Annual or Semi-Annual Statement [Text Block] |
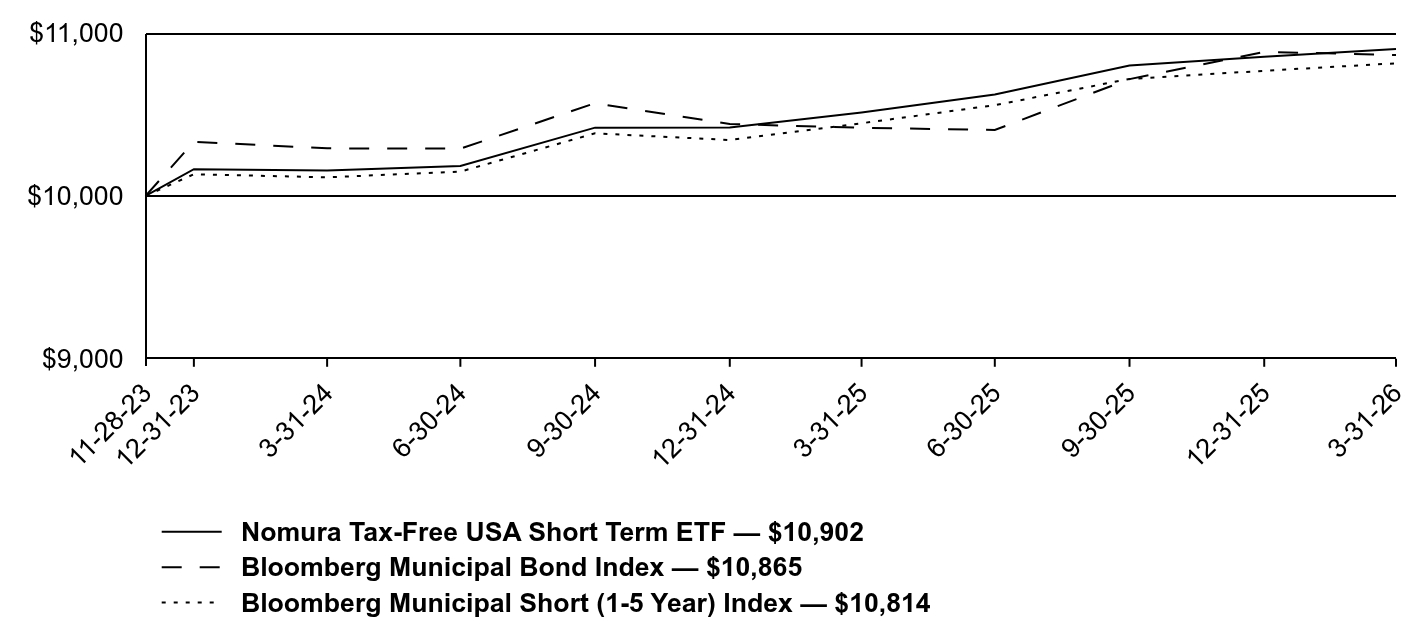
This annual shareholder report contains important information about Nomura Tax-Free USA Short Term ETF (Fund) for the period of April 1, 2025, to March 31, 2026
|
| Shareholder Report Annual or Semi-Annual |
Annual shareholder report
|
| Additional Information [Text Block] |
This annual shareholder report contains important information about Nomura Tax-Free USA Short Term ETF (Fund) for the period of April 1, 2025, to March 31, 2026. You can find additional information about the Fund at nomuraassetmanagement.com/etf-literature. You can also request this information by contacting us at 844 469-9911, weekdays from 9:00am to 5:00pm ET.
|
| Material Fund Change Notice [Text Block] |
This report describes changes to the Fund that occurred during the reporting period.
|
| Additional Information Phone Number |
844 469-9911
|
| Additional Information Email |
nomuraassetmanagement.com/etf-literature
|
| Expenses [Text Block] |
What were the Fund's costs for the last 12 months?(Based on a hypothetical $10,000 investment) Table SummaryFund | Costs of a $10,000 investment | Costs paid as a percentage of a $10,000 investment |
|---|
STAX | $30 | 0.29% |
|---|
|
| Expenses Paid, Amount |
$ 30
|
| Expense Ratio, Percent |
0.29%
|
| Line Graph [Table Text Block] |
Table Summary | Nomura Tax-Free USA Short Term ETF — $10,902 | Bloomberg Municipal Bond Index — $10,865 | Bloomberg Municipal Short (1-5 Year) Index — $10,814 |
|---|
11-28-23 | 10000 | 10,000 | 10,000 |
|---|
12-31-23 | 10164 | 10,332 | 10,133 |
|---|
3-31-24 | 10156 | 10,292 | 10,114 |
|---|
6-30-24 | 10184 | 10,290 | 10,149 |
|---|
9-30-24 | 10419 | 10,569 | 10,384 |
|---|
12-31-24 | 10420 | 10,441 | 10,343 |
|---|
3-31-25 | 10512 | 10,418 | 10,446 |
|---|
6-30-25 | 10623 | 10,405 | 10,557 |
|---|
9-30-25 | 10801 | 10,717 | 10,718 |
|---|
12-31-25 | 10854 | 10,884 | 10,768 |
|---|
3-31-26 | 10902 | 10,865 | 10,814 |
|---|
|
| Average Annual Return [Table Text Block] |
Table SummaryAverage annual total returns (as of March 31, 2026) | 1 Year | Since
Inception
(11/28/23) |
|---|
Nomura Tax-Free USA Short Term ETF | | |
|---|
Net asset value | 3.72% | 3.76% |
|---|
Bloomberg Municipal Bond Index | 4.29% | 3.61% |
|---|
Bloomberg Municipal Short (1-5 Year) Index | 3.52% | 3.40% |
|---|
|
| Performance Inception Date |
Nov. 28, 2023
|
| AssetsNet |
$ 6,327,503
|
| Holdings Count | Holding |
49
|
| Advisory Fees Paid, Amount |
$ 16,254
|
| InvestmentCompanyPortfolioTurnover |
38.00%
|
| Additional Fund Statistics [Text Block] |
Table SummaryFund net assets | $6,327,503 |
|---|
Total number of portfolio holdingsFootnote Reference* | 49 |
|---|
Total advisory fees paid (during reporting period) | $16,254 |
|---|
Portfolio turnover rate | 38% |
|---|
| Footnote | Description | Footnote* | Excludes cash and cash equivalents. |
|
| Holdings [Text Block] |
Table SummaryHealthcare Revenue Bonds | 20.91% |
|---|
Transportation Revenue Bonds | 13.85% |
|---|
Industrial Development Revenue Bonds | 12.72% |
|---|
State General Obligation Revenue Bonds | 11.40% |
|---|
Water & Sewer Revenue Bonds | 8.56% |
|---|
Electric Revenue Bonds | 7.88% |
|---|
Education Revenue Bonds | 6.83% |
|---|
Local General Obligation Revenue Bonds | 4.59% |
|---|
Leasing Revenue Bonds | 3.98% |
|---|
Special Tax Revenue Bonds | 3.29% |
|---|
Housing Revenue Bonds | 2.35% |
|---|
|
| Largest Holdings [Text Block] |
State/territory allocation Table SummaryNew York | 15.67% |
|---|
Colorado | 12.38% |
|---|
Pennsylvania | 11.04% |
|---|
Illinois | 9.01% |
|---|
Texas | 6.44% |
|---|
Minnesota | 6.29% |
|---|
California | 5.67% |
|---|
Georgia | 4.69% |
|---|
Arizona | 4.24% |
|---|
New Jersey | 3.78% |
|---|
|
| Material Fund Change [Text Block] |
Effective December 1, 2025, the Fund was renamed Nomura Tax-Free USA Short Term ETF. This is a summary of certain changes to the Fund that occurred during the reporting period. For more complete information, you may review the Fund’s next prospectus, which we expect to be available by August 1, 2026, at nomuraassetmanagement.com/etf-literature or upon request at 844 469-9911, weekdays from 9:00am to 5:00pm ET. |
| C000245547 |
|
| Shareholder Report [Line Items] |
|
| Fund Name |
Nomura Energy Transition ETF
|
| Trading Symbol |
PWER
|
| Security Exchange Name |
NYSEArca
|
| Annual or Semi-Annual Statement [Text Block] |
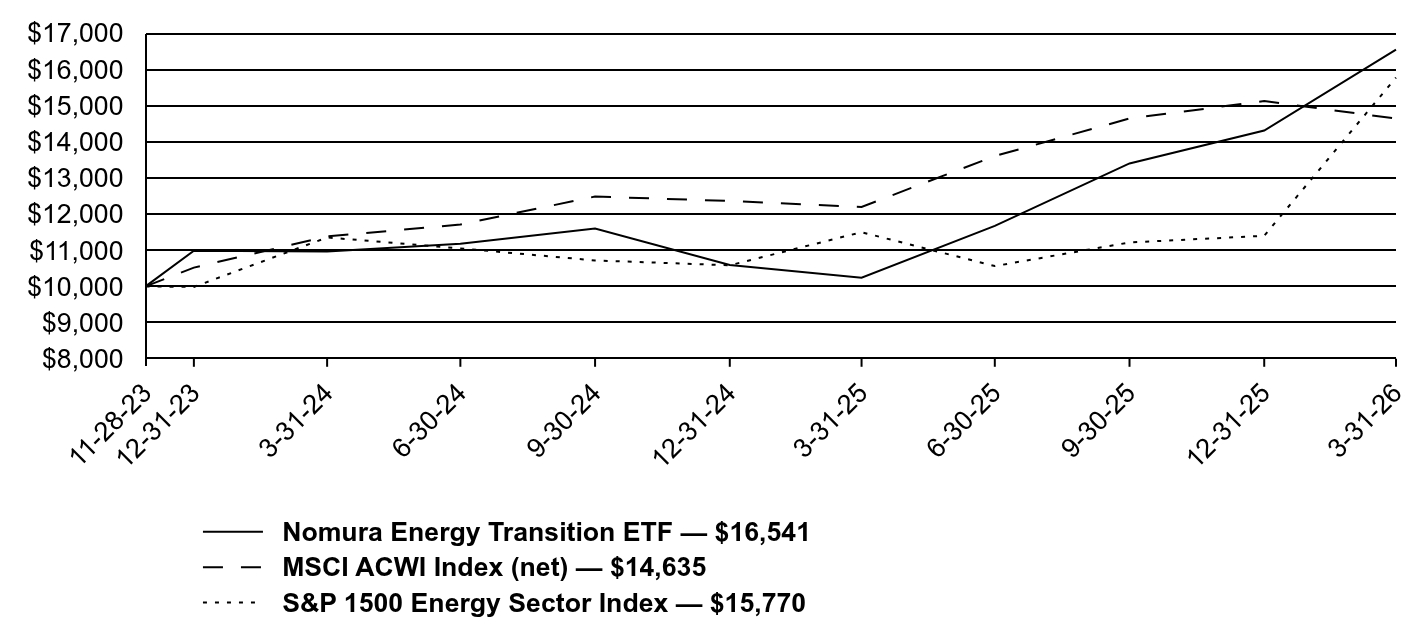
This annual shareholder report contains important information about Nomura Energy Transition ETF (Fund) for the period of April 1, 2025, to March 31, 2026
|
| Shareholder Report Annual or Semi-Annual |
Annual shareholder report
|
| Additional Information [Text Block] |
This annual shareholder report contains important information about Nomura Energy Transition ETF (Fund) for the period of April 1, 2025, to March 31, 2026. You can find additional information about the Fund at nomuraassetmanagement.com/etf-literature. You can also request this information by contacting us at 844 469-9911, weekdays from 9:00am to 5:00pm ET.
|
| Material Fund Change Notice [Text Block] |
This report describes changes to the Fund that occurred during the reporting period.
|
| Additional Information Phone Number |
844 469-9911
|
| Additional Information Email |
nomuraassetmanagement.com/etf-literature
|
| Expenses [Text Block] |
What were the Fund's costs for the last 12 months?(Based on a hypothetical $10,000 investment) Table SummaryFund | Costs of a $10,000 investment | Costs paid as a percentage of a $10,000 investment |
|---|
PWER | $103 | 0.79% |
|---|
|
| Expenses Paid, Amount |
$ 103
|
| Expense Ratio, Percent |
0.79%
|
| Line Graph [Table Text Block] |
Table Summary | Nomura Energy Transition ETF — $16,541 | MSCI ACWI Index (net) — $14,635 | S&P 1500 Energy Sector Index — $15,770 |
|---|
11-28-23 | 10000 | 10,000 | 10,000 |
|---|
12-31-23 | 10986 | 10,519 | 9,986 |
|---|
3-31-24 | 10961 | 11,381 | 11,352 |
|---|
6-30-24 | 11176 | 11,708 | 11,050 |
|---|
9-30-24 | 11598 | 12,482 | 10,717 |
|---|
12-31-24 | 10593 | 12,359 | 10,583 |
|---|
3-31-25 | 10241 | 12,195 | 11,497 |
|---|
6-30-25 | 11673 | 13,601 | 10,561 |
|---|
9-30-25 | 13396 | 14,638 | 11,214 |
|---|
12-31-25 | 14307 | 15,119 | 11,397 |
|---|
3-31-26 | 16541 | 14,635 | 15,770 |
|---|
|
| Average Annual Return [Table Text Block] |
Table SummaryAverage annual total returns (as of March 31, 2026) | 1 Year | Since
Inception
(11/28/23) |
|---|
Nomura Energy Transition ETF | | |
|---|
Net asset value | 61.51% | 24.00% |
|---|
MSCI ACWI Index (net) | 20.01% | 17.68% |
|---|
S&P 1500 Energy Sector Index | 37.16% | 21.49% |
|---|
|
| Performance Inception Date |
Nov. 28, 2023
|
| AssetsNet |
$ 11,242,137
|
| Holdings Count | Holding |
32
|
| Advisory Fees Paid, Amount |
$ 61,713
|
| InvestmentCompanyPortfolioTurnover |
31.00%
|
| Additional Fund Statistics [Text Block] |
Table SummaryFund net assets | $11,242,137 |
|---|
Total number of portfolio holdingsFootnote Reference* | 32 |
|---|
Total advisory fees paid (during reporting period) | $61,713 |
|---|
Portfolio turnover rate | 31% |
|---|
| Footnote | Description | Footnote* | Excludes cash and cash equivalents. |
|
| Holdings [Text Block] |
Table SummaryOil & Gas Exploration & Production | 25.14% |
|---|
Diversified Metals & Mining | 11.05% |
|---|
Oil & Gas Refining & Marketing | 7.88% |
|---|
Steel | 6.94% |
|---|
Gold | 5.41% |
|---|
Aluminum | 5.16% |
|---|
Copper | 5.06% |
|---|
Electrical Components & Equipment | 4.37% |
|---|
Integrated Oil & Gas | 3.85% |
|---|
Semiconductors | 3.84% |
|---|
|
| Largest Holdings [Text Block] |
Table SummaryAlcoa Corp. | 5.16% |
|---|
Steel Dynamics, Inc. | 5.09% |
|---|
Hudbay Minerals, Inc. | 5.09% |
|---|
ERO Copper Corp. | 5.06% |
|---|
ConocoPhillips | 4.60% |
|---|
Valero Energy Corp. | 4.44% |
|---|
EOG Resources, Inc. | 3.95% |
|---|
Shell plc ADR | 3.85% |
|---|
ARC Resources Ltd. | 3.84% |
|---|
First Solar, Inc. | 3.84% |
|---|
|
| Material Fund Change [Text Block] |
Effective December 1, 2025, the Fund was renamed Nomura Energy Transition ETF. Effective December 1, 2025, Macquarie Investment Management Global Limited no longer serves as a sub-advisor to the Fund. This is a summary of certain changes to the Fund that occurred during the reporting period. For more complete information, you may review the Fund’s next prospectus, which we expect to be available by August 1, 2026, at nomuraassetmanagement.com/etf-literature or upon request at 844 469-9911, weekdays from 9:00am to 5:00pm ET. |
| C000251129 |
|
| Shareholder Report [Line Items] |
|
| Fund Name |
Nomura Focused Emerging Markets Equity ETF
|
| Trading Symbol |
EMEQ
|
| Security Exchange Name |
NASDAQ
|
| Annual or Semi-Annual Statement [Text Block] |
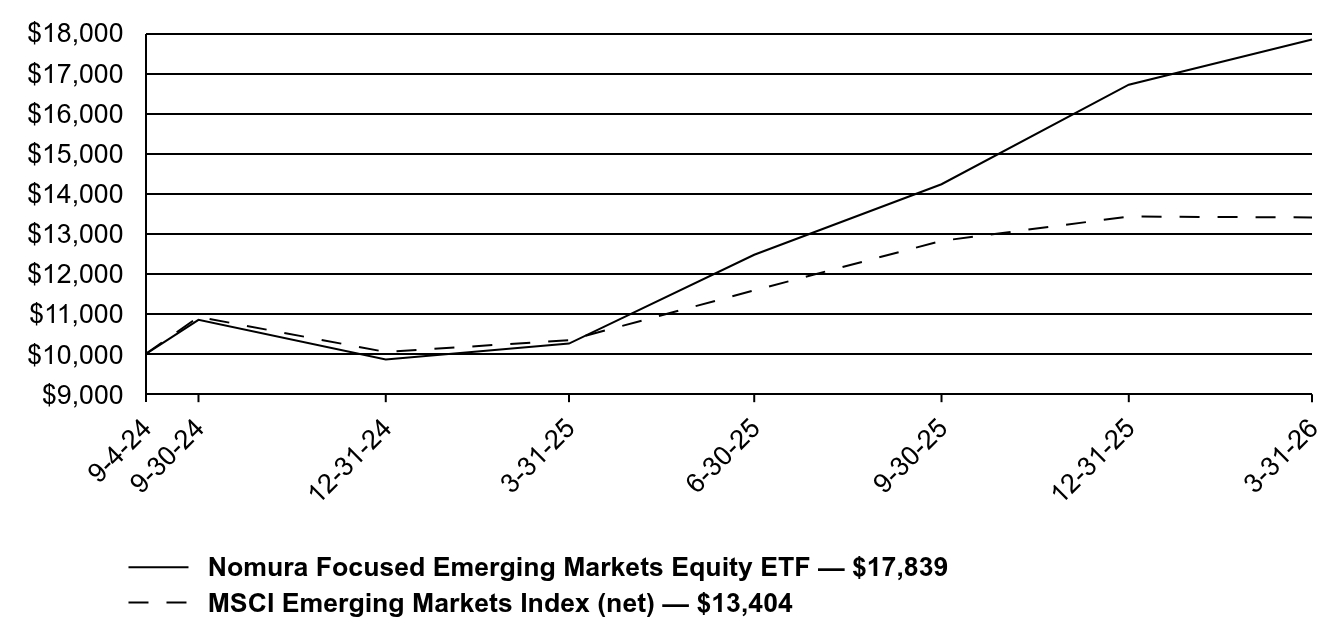
This annual shareholder report contains important information about Nomura Focused Emerging Markets Equity ETF (Fund) for the period of April 1, 2025, to March 31, 2026
|
| Shareholder Report Annual or Semi-Annual |
Annual shareholder report
|
| Additional Information [Text Block] |
This annual shareholder report contains important information about Nomura Focused Emerging Markets Equity ETF (Fund) for the period of April 1, 2025, to March 31, 2026. You can find additional information about the Fund at nomuraassetmanagement.com/etf-literature. You can also request this information by contacting us at 844 469-9911, weekdays from 9:00am to 5:00pm ET.
|
| Material Fund Change Notice [Text Block] |
This report describes changes to the Fund that occurred during the reporting period.
|
| Additional Information Phone Number |
844 469-9911
|
| Additional Information Email |
nomuraassetmanagement.com/etf-literature
|
| Expenses [Text Block] |
What were the Fund's costs for the last 12 months?(Based on a hypothetical $10,000 investment) Table SummaryFund | Costs of a $10,000 investment | Costs paid as a percentage of a $10,000 investment |
|---|
EMEQ | $116 | 0.85% |
|---|
|
| Expenses Paid, Amount |
$ 116
|
| Expense Ratio, Percent |
0.85%
|
| Line Graph [Table Text Block] |
Table Summary | Nomura Focused Emerging Markets Equity ETF — $17,839 | MSCI Emerging Markets Index (net) — $13,404 |
|---|
9-4-24 | 10000 | 10,000 |
|---|
9-30-24 | 10852 | 10,927 |
|---|
12-31-24 | 9865 | 10,052 |
|---|
3-31-25 | 10260 | 10,346 |
|---|
6-30-25 | 12474 | 11,586 |
|---|
9-30-25 | 14232 | 12,820 |
|---|
12-31-25 | 16711 | 13,426 |
|---|
3-31-26 | 17839 | 13,404 |
|---|
|
| Average Annual Return [Table Text Block] |
Table SummaryAverage annual total returns (as of March 31, 2026) | 1 Year | Since
Inception
(9/4/24) |
|---|
Nomura Focused Emerging Markets Equity ETF | | |
|---|
Net asset value | 73.87% | 44.58% |
|---|
MSCI Emerging Markets Index (net) | 29.55% | 20.52% |
|---|
|
| Performance Inception Date |
Sep. 04, 2024
|
| AssetsNet |
$ 281,728,926
|
| Holdings Count | Holding |
49
|
| Advisory Fees Paid, Amount |
$ 844,727
|
| InvestmentCompanyPortfolioTurnover |
36.00%
|
| Additional Fund Statistics [Text Block] |
Table SummaryFund net assets | $281,728,926 |
|---|
Total number of portfolio holdingsFootnote Reference* | 49 |
|---|
Total advisory fees paid (during reporting period) | $844,727 |
|---|
Portfolio turnover rate | 36% |
|---|
| Footnote | Description | Footnote* | Excludes cash and cash equivalents. |
|
| Holdings [Text Block] |
Table SummarySouth Korea | 40.73% |
|---|
Taiwan | 19.41% |
|---|
China | 10.26% |
|---|
India | 6.82% |
|---|
Mexico | 5.92% |
|---|
Brazil | 5.16% |
|---|
Indonesia | 1.91% |
|---|
South Africa | 1.58% |
|---|
Hong Kong | 1.58% |
|---|
Malaysia | 1.30% |
|---|
Table SummaryInformation Technology | 40.79% |
|---|
Financials | 13.12% |
|---|
Industrials | 15.96% |
|---|
Consumer Discretionary | 8.72% |
|---|
Energy | 7.83% |
|---|
Communication Services | 6.76% |
|---|
Consumer Staples | 3.56% |
|---|
Materials | 1.36% |
|---|
Healthcare | 1.30% |
|---|
|
| Largest Holdings [Text Block] |
Table SummaryTaiwan Semiconductor Manufacturing Co. Ltd. | 13.91% |
|---|
Samsung Electronics Co. Ltd. | 10.28% |
|---|
SK Square Co. Ltd. | 10.37% |
|---|
SK hynix, Inc. | 8.84% |
|---|
Reliance Industries Ltd. GDR 144A | 4.79% |
|---|
Samsung C&T Corp. | 4.52% |
|---|
Tencent Holdings Ltd. | 3.55% |
|---|
Alibaba Group Holding Ltd. ADR | 3.07% |
|---|
Petroleo Brasileiro SA - Petrobras ADR | 2.16% |
|---|
MediaTek, Inc. | 2.15% |
|---|
|
| Material Fund Change [Text Block] |
Effective December 1, 2025, the Fund was renamed Nomura Focused Emerging Markets Equity ETF. Effective December 1, 2025, Macquarie Investment Management Global Limited no longer serves as a sub-advisor to the Fund. This is a summary of certain changes to the Fund that occurred during the reporting period. For more complete information, you may review the Fund’s next prospectus, which we expect to be available by August 1, 2026, at nomuraassetmanagement.com/etf-literature or upon request at 844 469-9911, weekdays from 9:00am to 5:00pm ET. |
| C000256889 |
|
| Shareholder Report [Line Items] |
|
| Fund Name |
Nomura Focused International Core ETF
|
| Trading Symbol |
EXUS
|
| Security Exchange Name |
NASDAQ
|
| Annual or Semi-Annual Statement [Text Block] |
This annual shareholder report contains important information about Nomura Focused International Core ETF (Fund) for the period of June 17, 2025 (inception of Fund), to March 31, 2026
|
| Shareholder Report Annual or Semi-Annual |
Annual shareholder report
|
| Additional Information [Text Block] |
This annual shareholder report contains important information about Nomura Focused International Core ETF (Fund) for the period of June 17, 2025 (inception of Fund), to March 31, 2026. You can find additional information about the Fund at nomuraassetmanagement.com/etf-literature. You can also request this information by contacting us at 844 469-9911, weekdays from 9:00am to 5:00pm ET.
|
| Material Fund Change Notice [Text Block] |
This report describes changes to the Fund that occurred during the reporting period.
|
| Additional Information Phone Number |
844 469-9911
|
| Additional Information Email |
nomuraassetmanagement.com/etf-literature
|
| Expenses [Text Block] |
What were the Fund's costs for June 17, 2025 (inception of Fund) through March 31, 2026?(Based on a hypothetical $10,000 investment) Table SummaryFund | Costs of a $10,000 investmentFootnote Reference* | Costs paid as a percentage of a $10,000 investmentFootnote Reference^ |
|---|
EXUS | $45 | 0.59% |
|---|
| Footnote | Description | Footnote* | Amount shown reflects the expenses of the Fund from inception date through March 31, 2026. Expenses would be higher if the Fund had been in operation for the last 12 months. | Footnote^ | Annualized. |
|
| Expenses Paid, Amount |
$ 45
|
| Expense Ratio, Percent |
0.59%
|
| Line Graph [Table Text Block] |
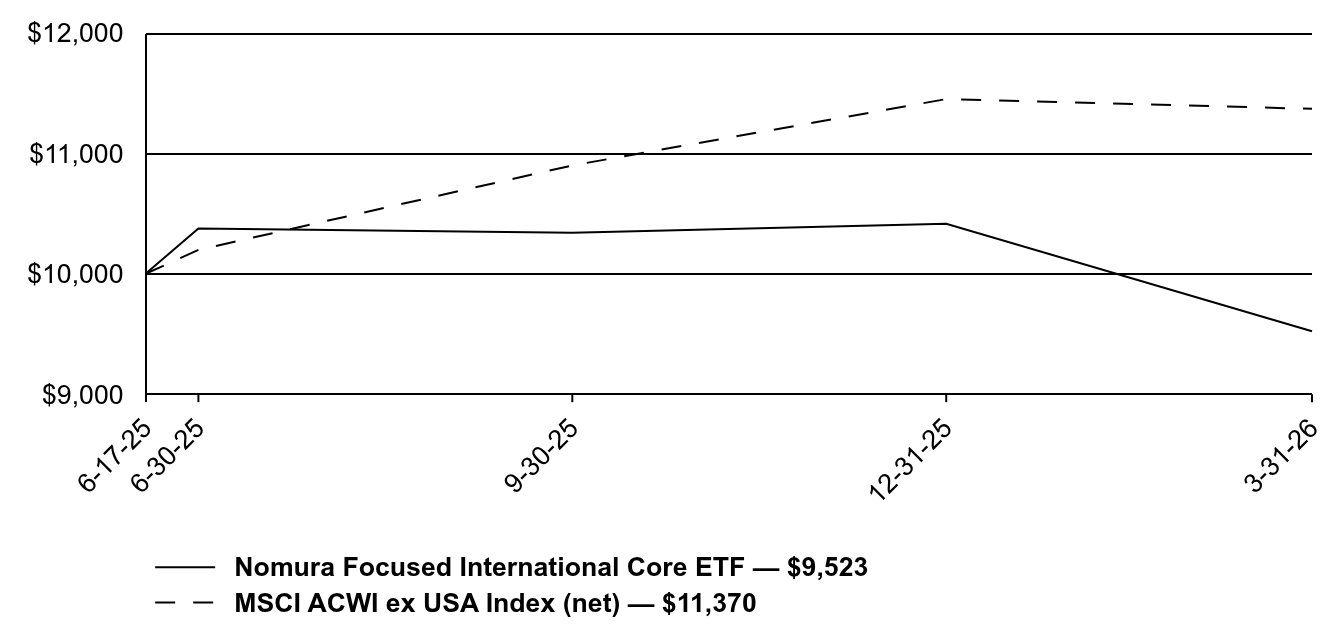
Table Summary | Nomura Focused International Core ETF — $9,523 | MSCI ACWI ex USA Index (net) — $11,370 |
|---|
6-17-25 | 10000 | 10,000 |
|---|
6-30-25 | 10376 | 10,198 |
|---|
9-30-25 | 10340 | 10,900 |
|---|
12-31-25 | 10416 | 11,451 |
|---|
3-31-26 | 9523 | 11,370 |
|---|
|
| Average Annual Return [Table Text Block] |
Table SummaryAverage annual total returns (as of March 31, 2026) | Since
Inception
(6/17/25) |
|---|
Nomura Focused International Core ETF | |
|---|
Net asset value | -4.77% |
|---|
MSCI ACWI ex USA Index (net) | 13.70% |
|---|
|
| Performance Inception Date |
Jun. 17, 2025
|
| AssetsNet |
$ 60,695,553
|
| Holdings Count | Holding |
42
|
| Advisory Fees Paid, Amount |
$ 161,063
|
| InvestmentCompanyPortfolioTurnover |
133.00%
|
| Additional Fund Statistics [Text Block] |
Table SummaryFund net assets | $60,695,553 |
|---|
Total number of portfolio holdingsFootnote Reference* | 42 |
|---|
Total advisory fees paid (during reporting period) | $161,063 |
|---|
Portfolio turnover rate | 133% |
|---|
| Footnote | Description | Footnote* | Excludes cash and cash equivalents. |
|
| Holdings [Text Block] |
Table SummaryUnited States of America | 12.52% |
|---|
Netherlands | 12.01% |
|---|
Japan | 9.90% |
|---|
Brazil | 9.48% |
|---|
Taiwan | 6.58% |
|---|
United Kingdom | 6.09% |
|---|
Hong Kong | 5.45% |
|---|
Singapore | 5.41% |
|---|
Germany | 4.78% |
|---|
South Korea | 4.25% |
|---|
Table SummaryFinancials | 20.68% |
|---|
Industrials | 20.33% |
|---|
Information Technology | 16.14% |
|---|
Consumer Discretionary | 10.44% |
|---|
Communication Services | 6.55% |
|---|
Healthcare | 6.54% |
|---|
Materials | 3.47% |
|---|
Energy | 3.35% |
|---|
Utilities | 3.24% |
|---|
Real Estate | 2.80% |
|---|
|
| Largest Holdings [Text Block] |
Table SummaryTaiwan Semiconductor Manufacturing Co. Ltd. | 6.58% |
|---|
SK hynix, Inc. | 4.25% |
|---|
ING Groep NV | 3.64% |
|---|
ASML Holding NV | 3.57% |
|---|
SLB Ltd. | 3.35% |
|---|
Cia de Saneamento Basico do Estado de Sao Paulo SABESP | 3.24% |
|---|
SMC Corp. | 3.23% |
|---|
Mitsubishi UFJ Financial Group, Inc. | 2.97% |
|---|
Henderson Land Development Co. Ltd. | 2.80% |
|---|
Banco Bilbao Vizcaya Argentaria SA | 2.79% |
|---|
|
| Material Fund Change [Text Block] |
Effective December 1, 2025, the Fund was renamed Nomura Focused International Core ETF. Effective December 1, 2025, Macquarie Investment Management Global Limited no longer serves as a sub-advisor to the Fund. This is a summary of certain changes to the Fund that occurred during the reporting period. For more complete information, you may review the Fund’s next prospectus, which we expect to be available by August 1, 2026, at nomuraassetmanagement.com/etf-literature or upon request at 844 469-9911, weekdays from 9:00am to 5:00pm ET. |
| C000249711 |
|
| Shareholder Report [Line Items] |
|
| Fund Name |
Nomura Focused Large Growth ETF
|
| Trading Symbol |
LRGG
|
| Security Exchange Name |
NYSEArca
|
| Annual or Semi-Annual Statement [Text Block] |
This annual shareholder report contains important information about Nomura Focused Large Growth ETF (Fund) for the period of April 1, 2025, to March 31, 2026
|
| Shareholder Report Annual or Semi-Annual |
Annual shareholder report
|
| Additional Information [Text Block] |
This annual shareholder report contains important information about Nomura Focused Large Growth ETF (Fund) for the period of April 1, 2025, to March 31, 2026. You can find additional information about the Fund at nomuraassetmanagement.com/etf-literature. You can also request this information by contacting us at 844 469-9911, weekdays from 9:00am to 5:00pm ET.
|
| Material Fund Change Notice [Text Block] |
This report describes changes to the Fund that occurred during the reporting period.
|
| Additional Information Phone Number |
844 469-9911
|
| Additional Information Email |
nomuraassetmanagement.com/etf-literature
|
| Expenses [Text Block] |
What were the Fund's costs for the last 12 months?(Based on a hypothetical $10,000 investment) Table SummaryFund | Costs of a $10,000 investment | Costs paid as a percentage of a $10,000 investment |
|---|
LRGG | $44 | 0.44% |
|---|
|
| Expenses Paid, Amount |
$ 44
|
| Expense Ratio, Percent |
0.44%
|
| Line Graph [Table Text Block] |
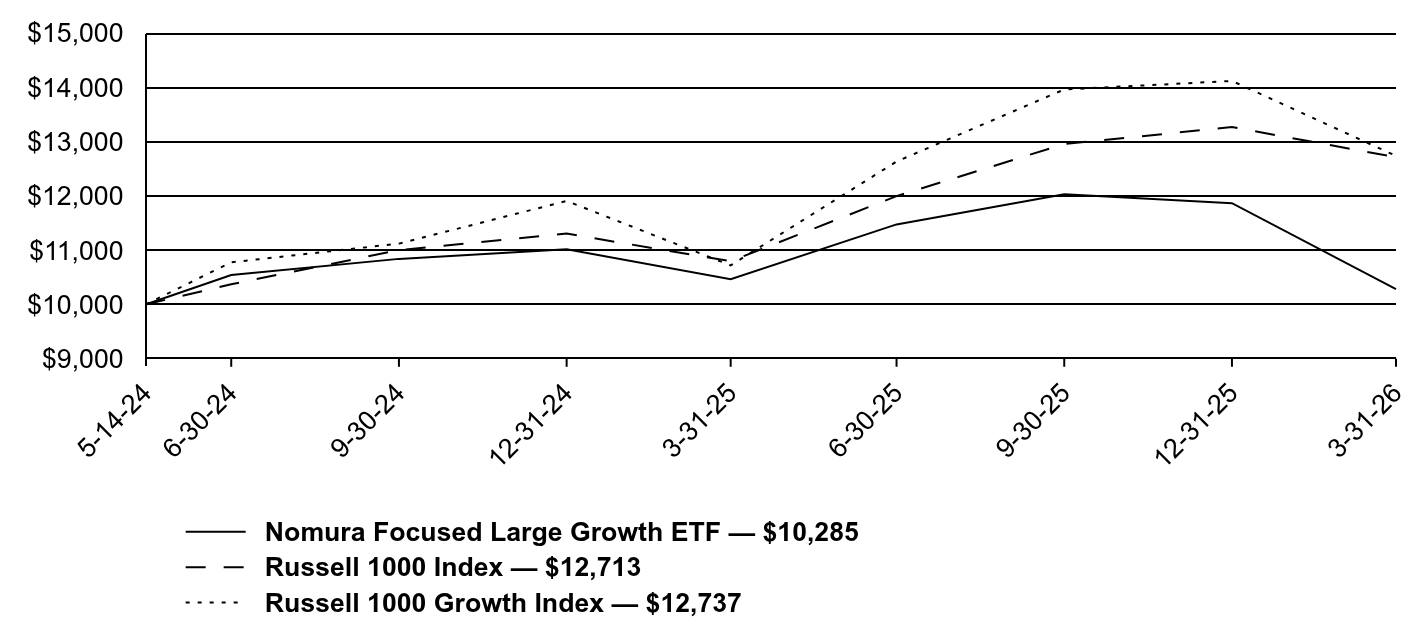
Table Summary | Nomura Focused Large Growth ETF — $10,285 | Russell 1000 Index — $12,713 | Russell 1000 Growth Index — $12,737 |
|---|
5-14-24 | 10000 | 10,000 | 10,000 |
|---|
6-30-24 | 10544 | 10,372 | 10,777 |
|---|
9-30-24 | 10840 | 11,002 | 11,121 |
|---|
12-31-24 | 11018 | 11,305 | 11,907 |
|---|
3-31-25 | 10465 | 10,797 | 10,720 |
|---|
6-30-25 | 11475 | 11,996 | 12,633 |
|---|
9-30-25 | 12031 | 12,955 | 13,960 |
|---|
12-31-25 | 11865 | 13,268 | 14,117 |
|---|
3-31-26 | 10285 | 12,713 | 12,737 |
|---|
|
| Average Annual Return [Table Text Block] |
Table SummaryAverage annual total returns (as of March 31, 2026) | 1 Year | Since
Inception
(5/14/24) |
|---|
Nomura Focused Large Growth ETF | | |
|---|
Net asset value | -1.72% | 1.51% |
|---|
Russell 1000 Growth Index | 18.81% | 13.74% |
|---|
Russell 1000 Index | 17.74% | 13.62% |
|---|
|
| Performance Inception Date |
May 14, 2024
|
| AssetsNet |
$ 241,024,636
|
| Holdings Count | Holding |
21
|
| Advisory Fees Paid, Amount |
$ 1,364,173
|
| InvestmentCompanyPortfolioTurnover |
20.00%
|
| Additional Fund Statistics [Text Block] |
Table SummaryFund net assets | $241,024,636 |
|---|
Total number of portfolio holdingsFootnote Reference* | 21 |
|---|
Total advisory fees paid (during reporting period) | $1,364,173 |
|---|
Portfolio turnover rate | 20% |
|---|
| Footnote | Description | Footnote* | Excludes cash and cash equivalents. |
|
| Holdings [Text Block] |
Table SummaryInformation Technology | 47.76% |
|---|
Financials | 18.92% |
|---|
Consumer Discretionary | 8.83% |
|---|
Industrials | 8.23% |
|---|
Healthcare | 7.10% |
|---|
Communication Services | 5.26% |
|---|
Consumer Staples | 1.75% |
|---|
Real Estate | 1.74% |
|---|
|
| Largest Holdings [Text Block] |
Table SummaryNVIDIA Corp. | 15.09% |
|---|
Microsoft Corp. | 11.72% |
|---|
Apple, Inc. | 8.75% |
|---|
Amazon.com, Inc. | 5.64% |
|---|
Alphabet, Inc., Class C | 5.26% |
|---|
Visa, Inc., Class A | 4.71% |
|---|
Danaher Corp. | 4.67% |
|---|
Verisk Analytics, Inc., Class A | 4.55% |
|---|
Intercontinental Exchange, Inc. | 4.49% |
|---|
Taiwan Semiconductor Manufacturing Co. Ltd. ADR | 4.15% |
|---|
|
| Material Fund Change [Text Block] |
Effective December 1, 2025, the Fund was renamed Nomura Focused Large Growth ETF. Effective December 1, 2025, Macquarie Investment Management Global Limited no longer serves as a sub-advisor to the Fund. This is a summary of certain changes to the Fund that occurred during the reporting period. For more complete information, you may review the Fund’s next prospectus, which we expect to be available by August 1, 2026, at nomuraassetmanagement.com/etf-literature or upon request at 844 469-9911, weekdays from 9:00am to 5:00pm ET. |
| C000256891 |
|
| Shareholder Report [Line Items] |
|
| Fund Name |
Nomura National High-Yield Municipal Bond ETF
|
| Trading Symbol |
HTAX
|
| Security Exchange Name |
NYSEArca
|
| Annual or Semi-Annual Statement [Text Block] |
This annual shareholder report contains important information about Nomura National High-Yield Municipal Bond ETF (Fund) for the period of April 1, 2025, to March 31, 2026
|
| Shareholder Report Annual or Semi-Annual |
Annual shareholder report
|
| Additional Information [Text Block] |
This annual shareholder report contains important information about Nomura National High-Yield Municipal Bond ETF (Fund) for the period of April 1, 2025, to March 31, 2026. You can find additional information about the Fund at nomuraassetmanagement.com/etf-literature. You can also request this information by contacting us at 844 469-9911, weekdays from 9:00am to 5:00pm ET.
|
| Material Fund Change Notice [Text Block] |
This report describes changes to the Fund that occurred during the reporting period.
|
| Additional Information Phone Number |
844 469-9911
|
| Additional Information Email |
nomuraassetmanagement.com/etf-literature
|
| Expenses [Text Block] |
What were the Fund's costs for the last 12 months?(Based on a hypothetical $10,000 investment) Table SummaryFund | Costs of a $10,000 investment | Costs paid as a percentage of a $10,000 investment |
|---|
HTAX | $50 | 0.49% |
|---|
|
| Expenses Paid, Amount |
$ 50
|
| Expense Ratio, Percent |
0.49%
|
| Line Graph [Table Text Block] |
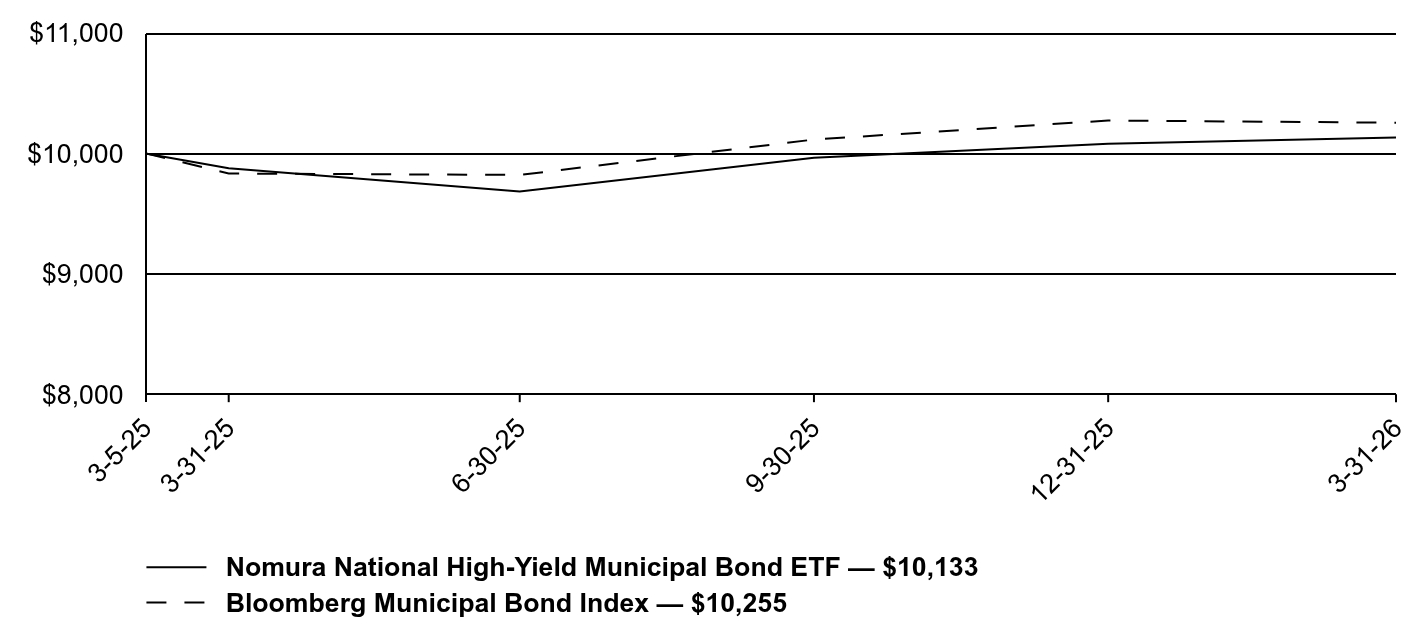
Table Summary | Nomura National High-Yield Municipal Bond ETF — $10,133 | Bloomberg Municipal Bond Index — $10,255 |
|---|
3-5-25 | 10000 | 10,000 |
|---|
3-31-25 | 9876 | 9,833 |
|---|
6-30-25 | 9684 | 9,821 |
|---|
9-30-25 | 9964 | 10,115 |
|---|
12-31-25 | 10080 | 10,273 |
|---|
3-31-26 | 10133 | 10,255 |
|---|
|
| Average Annual Return [Table Text Block] |
Table SummaryAverage annual total returns (as of March 31, 2026) | 1 Year | Since
Inception
(3/5/25) |
|---|
Nomura National High-Yield Municipal Bond ETF | | |
|---|
Net asset value | 2.60% | 1.24% |
|---|
Bloomberg Municipal Bond Index | 4.29% | 2.38% |
|---|
|
| Performance Inception Date |
Mar. 05, 2025
|
| AssetsNet |
$ 54,940,074
|
| Holdings Count | Holding |
194
|
| Advisory Fees Paid, Amount |
$ 134,267
|
| InvestmentCompanyPortfolioTurnover |
50.00%
|
| Additional Fund Statistics [Text Block] |
Table SummaryFund net assets | $54,940,074 |
|---|
Total number of portfolio holdingsFootnote Reference* | 194 |
|---|
Total advisory fees paid (during reporting period) | $134,267 |
|---|
Portfolio turnover rate | 50% |
|---|
| Footnote | Description | Footnote* | Excludes cash and cash equivalents. |
|
| Holdings [Text Block] |
Table SummaryEducation Revenue Bonds | 20.83% |
|---|
Healthcare Revenue Bonds | 19.92% |
|---|
Industrial Development Revenue Bonds | 15.30% |
|---|
Special Tax Revenue Bonds | 14.83% |
|---|
Transportation Revenue Bonds | 11.86% |
|---|
Local General Obligation Revenue Bonds | 3.95% |
|---|
State General Obligation Revenue Bonds | 2.21% |
|---|
Leasing Revenue Bonds | 2.14% |
|---|
Electric Revenue Bonds | 1.86% |
|---|
Water & Sewer Revenue Bonds | 1.40% |
|---|
|
| Largest Holdings [Text Block] |
State/territory allocation Table SummaryPuerto Rico | 10.40% |
|---|
Florida | 9.10% |
|---|
California | 8.94% |
|---|
Illinois | 8.09% |
|---|
New York | 6.72% |
|---|
Wisconsin | 6.33% |
|---|
Arizona | 6.10% |
|---|
Texas | 4.60% |
|---|
Colorado | 3.70% |
|---|
Minnesota | 3.34% |
|---|
|
| Material Fund Change [Text Block] |
Effective December 1, 2025, the Fund was renamed Nomura National High-Yield Municipal Bond ETF. This is a summary of certain changes to the Fund that occurred during the reporting period. For more complete information, you may review the Fund’s next prospectus, which we expect to be available by August 1, 2026, at nomuraassetmanagement.com/etf-literature or upon request at 844 469-9911, weekdays from 9:00am to 5:00pm ET. |
| C000256892 |
|
| Shareholder Report [Line Items] |
|
| Fund Name |
Nomura Tax-Free USA ETF
|
| Trading Symbol |
LTAX
|
| Security Exchange Name |
NYSEArca
|
| Annual or Semi-Annual Statement [Text Block] |
This annual shareholder report contains important information about Nomura Tax-Free USA ETF (Fund) for the period of January 12, 2026 (inception of Fund), to March 31, 2026
|
| Shareholder Report Annual or Semi-Annual |
Annual shareholder report
|
| Additional Information [Text Block] |
This annual shareholder report contains important information about Nomura Tax-Free USA ETF (Fund) for the period of January 12, 2026 (inception of Fund), to March 31, 2026. You can find additional information about the Fund at nomuraassetmanagement.com/etf-literature. You can also request this information by contacting us at 844 469-9911, weekdays from 9:00am to 5:00pm ET.
|
| Material Fund Change Notice [Text Block] |
|
| Additional Information Phone Number |
844 469-9911
|
| Additional Information Email |
nomuraassetmanagement.com/etf-literature
|
| Expenses [Text Block] |
What were the Fund's costs for January 12, 2026 (inception of Fund) through March 31, 2026?(Based on a hypothetical $10,000 investment) Table SummaryFund | Costs of a $10,000 investmentFootnote Reference* | Costs paid as a percentage of a $10,000 investmentFootnote Reference^ |
|---|
LTAX | $8 | 0.39% |
|---|
| Footnote | Description | Footnote* | Amount shown reflects the expenses of the Fund from inception date through March 31, 2026. Expenses would be higher if the Fund had been in operation for the last 12 months. | Footnote^ | Annualized. |
|
| Expenses Paid, Amount |
$ 8
|
| Expense Ratio, Percent |
0.39%
|
| AssetsNet |
$ 5,552,933
|
| Holdings Count | Holding |
69
|
| Advisory Fees Paid, Amount |
$ 4,537
|
| InvestmentCompanyPortfolioTurnover |
17.00%
|
| Additional Fund Statistics [Text Block] |
Table SummaryFund net assets | $5,552,933 |
|---|
Total number of portfolio holdingsFootnote Reference* | 69 |
|---|
Total advisory fees paid (during reporting period) | $4,537 |
|---|
Portfolio turnover rate | 17% |
|---|
| Footnote | Description | Footnote* | Excludes cash and cash equivalents. |
|
| Holdings [Text Block] |
Table SummaryTransportation Revenue Bonds | 25.17% |
|---|
Healthcare Revenue Bonds | 19.00% |
|---|
Special Tax Revenue Bonds | 10.75% |
|---|
Education Revenue Bonds | 9.76% |
|---|
Industrial Development Revenue Bonds | 7.77% |
|---|
State General Obligation Revenue Bonds | 7.56% |
|---|
Local General Obligation Revenue Bonds | 4.80% |
|---|
Electric Revenue Bonds | 3.75% |
|---|
Leasing Revenue Bonds | 3.01% |
|---|
Water & Sewer Revenue Bonds | 1.89% |
|---|
Housing Revenue Bonds | 1.80% |
|---|
|
| Largest Holdings [Text Block] |
State/territory allocation Table SummaryNew York | 9.47% |
|---|
Florida | 8.79% |
|---|
Colorado | 8.70% |
|---|
Illinois | 8.55% |
|---|
Texas | 8.46% |
|---|
California | 7.49% |
|---|
Puerto Rico | 7.33% |
|---|
Arizona | 5.74% |
|---|
Pennsylvania | 5.33% |
|---|
Wisconsin | 3.55% |
|---|
|
| C000268417 |
|
| Shareholder Report [Line Items] |
|
| Fund Name |
Nomura Transformational Technologies ETF
|
| Trading Symbol |
FRWD
|
| Security Exchange Name |
NASDAQ
|
| Annual or Semi-Annual Statement [Text Block] |
This annual shareholder report contains important information about Nomura Transformational Technologies ETF (Fund) for the period of January 12, 2026 (inception of Fund), to March 31, 2026
|
| Shareholder Report Annual or Semi-Annual |
Annual shareholder report
|
| Additional Information [Text Block] |
This annual shareholder report contains important information about Nomura Transformational Technologies ETF (Fund) for the period of January 12, 2026 (inception of Fund), to March 31, 2026. You can find additional information about the Fund at nomuraassetmanagement.com/etf-literature. You can also request this information by contacting us at 844 469-9911, weekdays from 9:00am to 5:00pm ET.
|
| Material Fund Change Notice [Text Block] |
|
| Additional Information Phone Number |
844 469-9911
|
| Additional Information Email |
nomuraassetmanagement.com/etf-literature
|
| Expenses [Text Block] |
What were the Fund's costs for January 12, 2026 (inception of Fund) through March 31, 2026?(Based on a hypothetical $10,000 investment) Table SummaryFund | Costs of a $10,000 investmentFootnote Reference* | Costs paid as a percentage of a $10,000 investmentFootnote Reference^ |
|---|
FRWD | $13 | 0.65% |
|---|
| Footnote | Description | Footnote* | Amount shown reflects the expenses of the Fund from inception date through March 31, 2026. Expenses would be higher if the Fund had been in operation for the last 12 months. | Footnote^ | Annualized. |
|
| Expenses Paid, Amount |
$ 13
|
| Expense Ratio, Percent |
0.65%
|
| AssetsNet |
$ 87,170,381
|
| Holdings Count | Holding |
24
|
| Advisory Fees Paid, Amount |
$ 47,286
|
| InvestmentCompanyPortfolioTurnover |
11.00%
|
| Additional Fund Statistics [Text Block] |
Table SummaryFund net assets | $87,170,381 |
|---|
Total number of portfolio holdingsFootnote Reference* | 24 |
|---|
Total advisory fees paid (during reporting period) | $47,286 |
|---|
Portfolio turnover rate | 11% |
|---|
| Footnote | Description | Footnote* | Excludes cash and cash equivalents. |
|
| Holdings [Text Block] |
Table SummaryInformation Technology | 66.38% |
|---|
Communication Services | 17.01% |
|---|
Consumer Discretionary | 10.90% |
|---|
Industrials | 2.96% |
|---|
|
| Largest Holdings [Text Block] |
Table SummaryNVIDIA Corp. | 9.22% |
|---|
Seagate Technology Holdings plc | 7.61% |
|---|
Meta Platforms, Inc., Class A | 6.55% |
|---|
Advanced Micro Devices, Inc. | 6.39% |
|---|
Taiwan Semiconductor Manufacturing Co. Ltd. ADR | 6.04% |
|---|
Lam Research Corp. | 5.47% |
|---|
Broadcom, Inc. | 4.74% |
|---|
ASML Holding NV ADR | 4.67% |
|---|
Microsoft Corp. | 4.48% |
|---|
Amazon.com, Inc. | 4.02% |
|---|
|