Pay vs Performance Disclosure - USD ($)
Dec. 31, 2025
Dec. 31, 2024
Dec. 31, 2023
Pay Versus Performance
In August 2022, the SEC released the final version of its pay versus performance disclosure rules as mandated under the Dodd-Frank Wall Street Reform and Consumer Protection Act, and other official guidance issued thereunder, and which became effective starting with fiscal year ended December 31, 2022. The final rules were codified under Item 402(v) of Regulation
S-K
(along with other official guidance issued, “PvP disclosure rules”) and require the Company to provide the following tabular and narrative disclosures. In accordance with the PvP disclosure rules, the below sets forth the following for the previous three years (i) the total compensation set forth in the Summary Compensation Table (“SCT”) for the individuals serving as the Company’s principal executive officer (“PEO”) and the
non-PEO
named executive officers (“NEOs”); (ii) the total and average “compensation actually paid” (“CAP”) by the Company to the PEO and the non-PEO
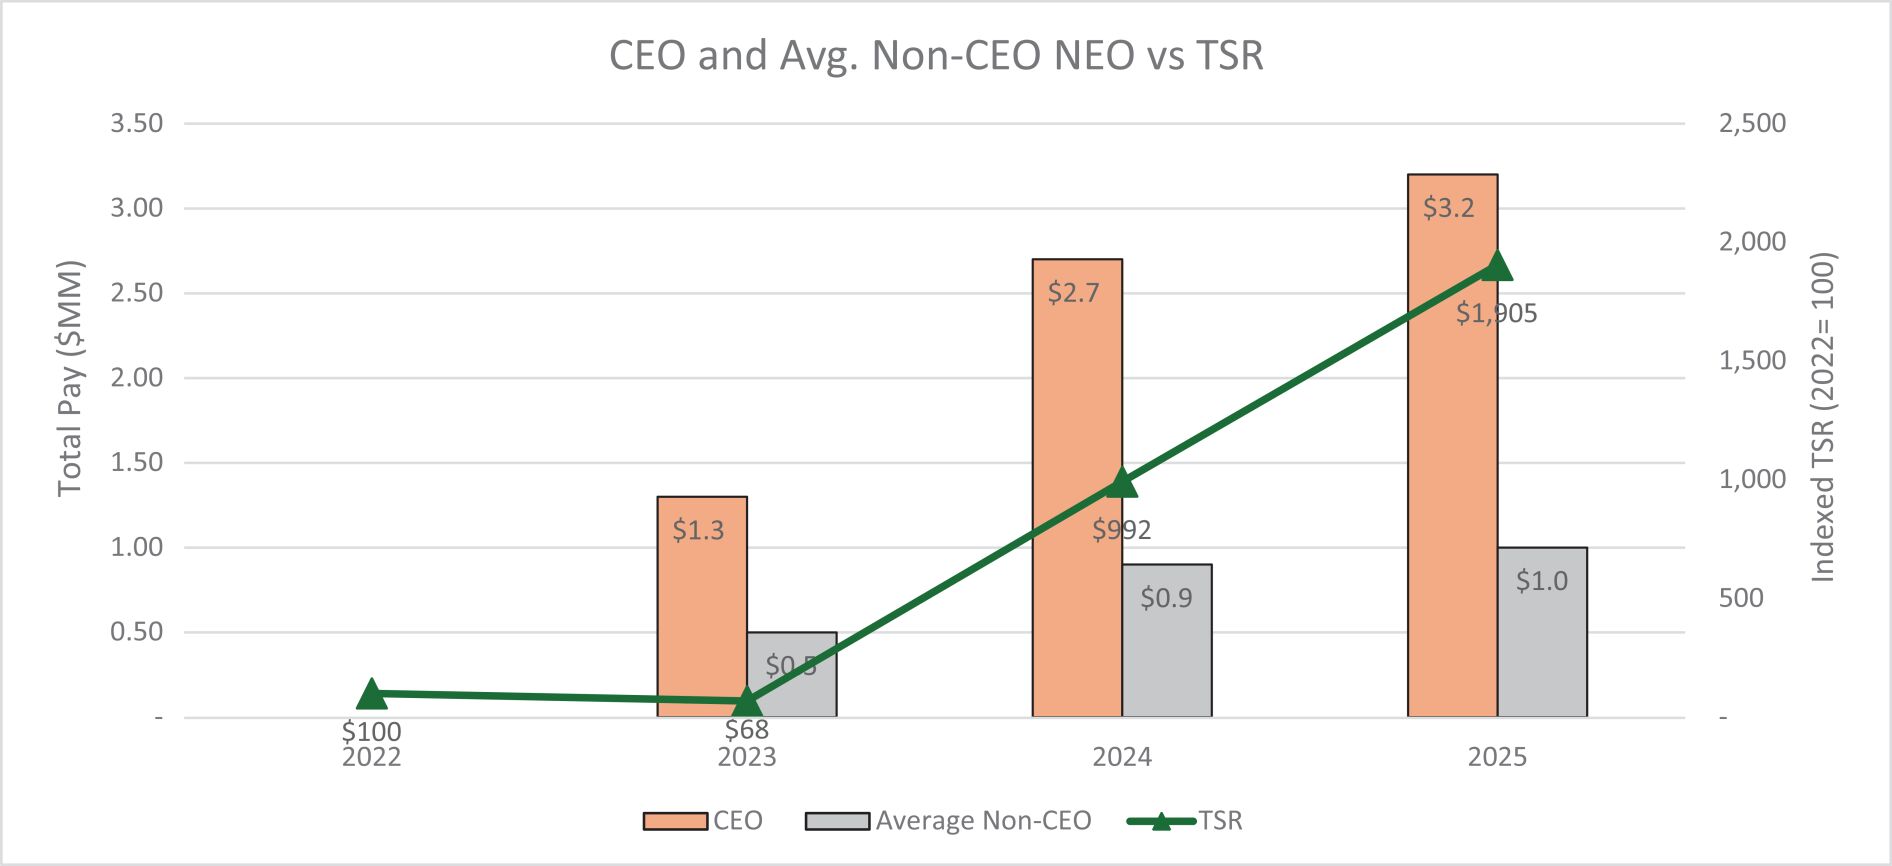
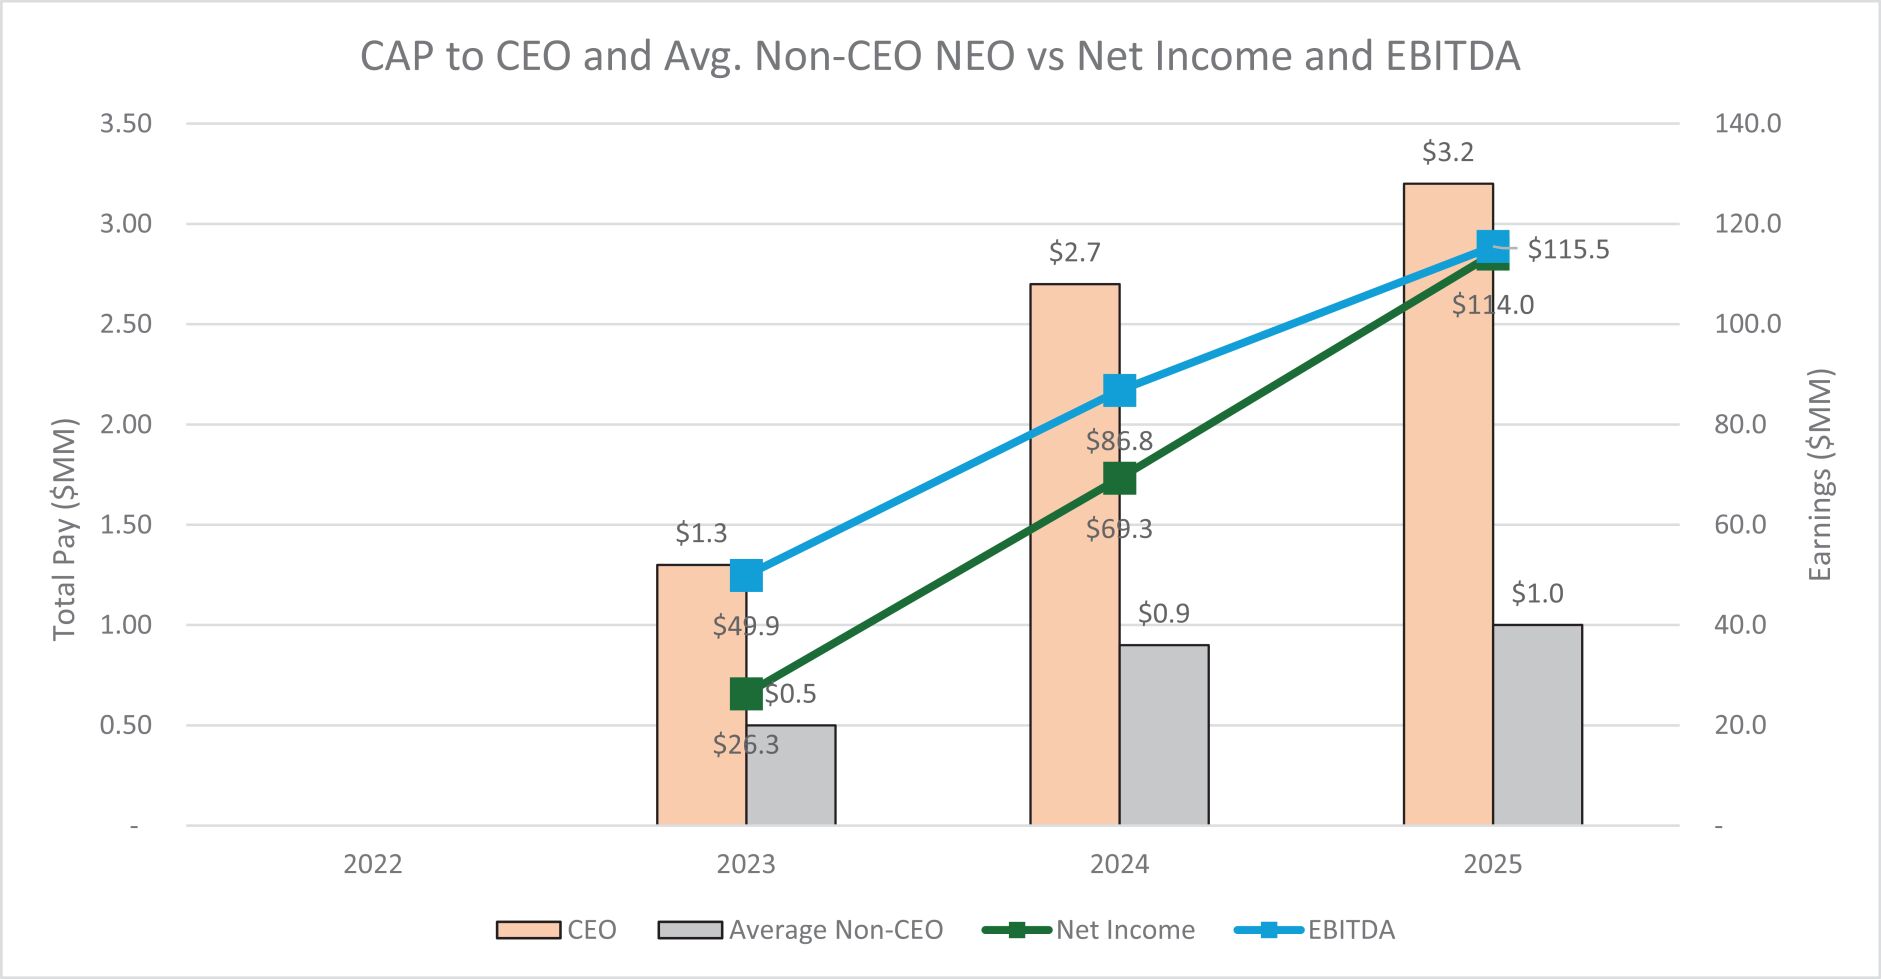
NEOs as a group, respectively; (iii) the Company’s cumulative total shareholder return (“Cumulative TSR”); and (iv) the Company’s Net Income. 2025 Pay versus Performance Table
Year(a) (1) |
SCT Total for PEO (Xykis)(b) |
Compensation Actually Paid to PEO (Xykis)(c) (2) |
Average SCT Total for Non- PEO NEOs(d) (3) |
Average Compensation Actually Paid to Non- PEO NEOs(e) (2) |
Value of Initial Fixed $100 Investment Based on: Total Shareholder Return(f) (4) |
Net Income (g) (thousands) |
||||||||||||||||||
2025 |
$ | 2,425,216 | $ | 3,166,711 | $ | 677,154 | $ | 967,337 | $ | 1,905 | $ | 113,987 | ||||||||||||
2024 |
$ | 1,209,233 | $ | 2,728,721 | $ | 622,750 | $ | 888,033 | $ | 992 | $ | 69,279 | ||||||||||||
2023 |
$ | 1,449,282 | $ | 1,343,079 | $ | 496,768 | $ | 487,073 | $ | 68 | $ | 26,306 | ||||||||||||
| (1) | For 2025, Mr. Xun (Kenneth) Li, Mr. Randall Lehner and Ms. Zhaoying (Dorothy) Du served as non-PEO NEO’s. For 2024 and 2023, Mr. Xun (Kenneth) Li and Randall Lehner, served as non-PEO NEOs. |
| (2) | Represents CAP for the PEOs and the average CAP for the non-PEO NEOs as a group, computed in accordance with the PvP disclosure rules. The dollar amounts do not reflect the amounts of compensation ultimately earned or realized by the PEOs or non-PEO NEOs during the covered years. |
| (3) | Amounts reflected in this column represent the average “Total” compensation from the SCT for the non-PEO NEOs as a group. |
| (4) | Amounts reflected in these columns represent the Company’s Cumulative TSR for each measurement period from December 31, 2022 through December 31, 2025. Dividends are assumed to be reinvested. The resulting amounts assume that $100 was invested on December 31, 2022 in the Company’s Common Stock. |
CAP is determined by taking the “Total” column amount from the SCT for each covered fiscal year and adjusting as follows for the PEOs (Xykis for 2025, 2024 and 2023) and
non-PEO
NEOs (Li, Lehner and Du for 2025; Li and Lehner for 2024; Li and Gu for 2023): Adjustments to Determine CAP for PEO (Xykis) |
||||||||||||
Covered Fiscal Year |
2025 |
2024 |
2023 |
|||||||||
SCT Total for PEO (Xykis) |
$ |
2,425,216 |
$ |
1,209,233 |
$ |
1,449,282 |
||||||
Pension Adjustments (i) |
||||||||||||
Subtract |
— | — | — | |||||||||
Add |
— | — | — | |||||||||
Add |
— | — | — | |||||||||
Adjustments to Determine CAP for PEO (Xykis) |
||||||||||||
Covered Fiscal Year |
2025 |
2024 |
2023 |
|||||||||
Equity Adjustments (ii) |
||||||||||||
Subtract |
— | — | ($ | 216,542 | ) | |||||||
Add |
— | — | $ | 136,228 | ||||||||
Add |
— | — | — | |||||||||
Add/Subtract year-end to the covered fiscal year-end for equity awards granted in prior fiscal years that remain outstanding and unvested at the end of the covered fiscal year |
$ | 768,833 | $ | 1,518,022 | ($ | 6,032 | ) | |||||
Add/Subtract year-end to vesting date for equity awards granted in prior fiscal years that vested during the covered fiscal year |
($ | 27,338 | ) | $ | 1,466 | ($ | 19,857 | ) | ||||
Subtract |
— | — | ||||||||||
Add |
— | — | ||||||||||
Add |
— | — | ||||||||||
TOTAL ADJUSTMENTS |
$ |
741,495 |
$ |
1,519,488 |
($ |
106,203 |
) | |||||
CAP |
$ |
3,166,711 |
$ |
2,728,721 |
$ |
1,343,079 |
||||||
Covered Fiscal Year |
2025 |
2024 |
2023 |
|||||||||
Average SCT Total for Non-PEO NEOs |
$ |
677,154 |
$ |
622,750 |
$ |
496,768 |
||||||
Pension Adjustments (i) |
||||||||||||
Subtract |
— | — | — | |||||||||
Add |
— | — | — | |||||||||
Add |
— | — | — | |||||||||
Equity Adjustments (ii) |
||||||||||||
Subtract |
($ | 17,788 | ) | — | — | |||||||
Add |
$ | 14,081 | — | — | ||||||||
Add |
— | — | — | |||||||||
Add/Subtract year-end to the covered fiscal year-end for equity awards granted in prior fiscal years that remain outstanding and unvested at the end of the covered fiscal year |
$ | 102,133 | $ | 202,685 | ($ | 9662 | ) | |||||
Covered Fiscal Year |
2025 |
2024 |
2023 |
|||||||||
Add/Subtract year-end to vesting date for equity awards granted in prior fiscal years that vested during the covered fiscal year |
$ | 191,757 | $ | 62,598 | ($ | 33 | ) | |||||
Subtract |
— | — | — | |||||||||
Add |
— | — | — | |||||||||
Add |
— | — | — | |||||||||
TOTAL ADJUSTMENTS |
$ |
290,183 |
$ |
265,283 |
($ |
9,695 |
) | |||||
CAP |
$ |
967,337 |
$ |
888,033 |
$ |
487,073 |
||||||
| (i) | We do not sponsor or maintain any defined benefit pension plans and therefore no adjustments were made related to pension value. |
| (ii) | The fair value or incremental fair value of all incentive equity awards is determined in accordance with FASB ASC Topic 718, “Compensation – Stock Compensation,” generally using the same assumptions used in determining the grant date fair value of the Company’s equity awards reflected in the “Summary Compensation Table” |
| (1) | For 2025, Mr. Xun (Kenneth) Li, Mr. Randall Lehner and Ms. Zhaoying (Dorothy) Du served as non-PEO NEO’s. For 2024 and 2023, Mr. Xun (Kenneth) Li and Randall Lehner, served as non-PEO NEOs. |
CAP is determined by taking the “Total” column amount from the SCT for each covered fiscal year and adjusting as follows for the PEOs (Xykis for 2025, 2024 and 2023) and
non-PEO
NEOs (Li, Lehner and Du for 2025; Li and Lehner for 2024; Li and Gu for 2023): Adjustments to Determine CAP for PEO (Xykis) |
||||||||||||
Covered Fiscal Year |
2025 |
2024 |
2023 |
|||||||||
SCT Total for PEO (Xykis) |
$ |
2,425,216 |
$ |
1,209,233 |
$ |
1,449,282 |
||||||
Pension Adjustments (i) |
||||||||||||
Subtract |
— | — | — | |||||||||
Add |
— | — | — | |||||||||
Add |
— | — | — | |||||||||
Adjustments to Determine CAP for PEO (Xykis) |
||||||||||||
Covered Fiscal Year |
2025 |
2024 |
2023 |
|||||||||
Equity Adjustments (ii) |
||||||||||||
Subtract |
— | — | ($ | 216,542 | ) | |||||||
Add |
— | — | $ | 136,228 | ||||||||
Add |
— | — | — | |||||||||
Add/Subtract year-end to the covered fiscal year-end for equity awards granted in prior fiscal years that remain outstanding and unvested at the end of the covered fiscal year |
$ | 768,833 | $ | 1,518,022 | ($ | 6,032 | ) | |||||
Add/Subtract year-end to vesting date for equity awards granted in prior fiscal years that vested during the covered fiscal year |
($ | 27,338 | ) | $ | 1,466 | ($ | 19,857 | ) | ||||
Subtract |
— | — | ||||||||||
Add |
— | — | ||||||||||
Add |
— | — | ||||||||||
TOTAL ADJUSTMENTS |
$ |
741,495 |
$ |
1,519,488 |
($ |
106,203 |
) | |||||
CAP |
$ |
3,166,711 |
$ |
2,728,721 |
$ |
1,343,079 |
||||||
| (i) | We do not sponsor or maintain any defined benefit pension plans and therefore no adjustments were made related to pension value. |
| (ii) | The fair value or incremental fair value of all incentive equity awards is determined in accordance with FASB ASC Topic 718, “Compensation – Stock Compensation,” generally using the same assumptions used in determining the grant date fair value of the Company’s equity awards reflected in the “Summary Compensation Table” |
CAP is determined by taking the “Total” column amount from the SCT for each covered fiscal year and adjusting as follows for the PEOs (Xykis for 2025, 2024 and 2023) and
non-PEO
NEOs (Li, Lehner and Du for 2025; Li and Lehner for 2024; Li and Gu for 2023): Covered Fiscal Year |
2025 |
2024 |
2023 |
|||||||||
Average SCT Total for Non-PEO NEOs |
$ |
677,154 |
$ |
622,750 |
$ |
496,768 |
||||||
Pension Adjustments (i) |
||||||||||||
Subtract |
— | — | — | |||||||||
Add |
— | — | — | |||||||||
Add |
— | — | — | |||||||||
Equity Adjustments (ii) |
||||||||||||
Subtract |
($ | 17,788 | ) | — | — | |||||||
Add |
$ | 14,081 | — | — | ||||||||
Add |
— | — | — | |||||||||
Add/Subtract year-end to the covered fiscal year-end for equity awards granted in prior fiscal years that remain outstanding and unvested at the end of the covered fiscal year |
$ | 102,133 | $ | 202,685 | ($ | 9662 | ) | |||||
Covered Fiscal Year |
2025 |
2024 |
2023 |
|||||||||
Add/Subtract year-end to vesting date for equity awards granted in prior fiscal years that vested during the covered fiscal year |
$ | 191,757 | $ | 62,598 | ($ | 33 | ) | |||||
Subtract |
— | — | — | |||||||||
Add |
— | — | — | |||||||||
Add |
— | — | — | |||||||||
TOTAL ADJUSTMENTS |
$ |
290,183 |
$ |
265,283 |
($ |
9,695 |
) | |||||
CAP |
$ |
967,337 |
$ |
888,033 |
$ |
487,073 |
||||||
| (i) | We do not sponsor or maintain any defined benefit pension plans and therefore no adjustments were made related to pension value. |
| (ii) | The fair value or incremental fair value of all incentive equity awards is determined in accordance with FASB ASC Topic 718, “Compensation – Stock Compensation,” generally using the same assumptions used in determining the grant date fair value of the Company’s equity awards reflected in the “Summary Compensation Table” |