Pay vs Performance Disclosure - USD ($)
Feb. 28, 2026
Feb. 28, 2025
Feb. 29, 2024
PAY VERSUS PERFORMANCE
The following disclosure is required by SEC rules but is not reflective of how the Company or the Compensation Committee determine executive compensation. For a discussion of how the Company manages its executive compensation structure and philosophy, including alignment with Company performance, see the section entitled “Executive Compensation” above. The use of the term “compensation actually paid” is required by the SEC’s rules but does not reflect the amount of compensation actually paid, earned or received during the applicable year. Per SEC rules, “compensation actually paid” was calculated by adjusting the total amounts for the applicable year from the Summary Compensation Table above, as further described in the footnotes to the following table.
The following table presents certain information regarding compensation paid to Loop’s CEO and other named executive officers (“NEOs”), and certain measures of financial performance, for the three years ended February 28, 2026. The amounts shown below are calculated in accordance with Item 402(v) of Regulation S-K.
Year | Summary Compensation Table Total for CEO ($) | Compensation Actually Paid to CEO(1)(2) ($) | Average Summary Compensation Table Total for non-CEO Named Executive Officers ($) | Average Compensation Actually Paid to non-CEO Named Executive Officers(3)(4) ($) | Value of Initial Fixed $100 Investment Based on Loop Total Shareholder Return ($) | Net Loss ($) | ||||||||||||
2026 | 1,507,112 | 1,660,191 | 664,640 | 588,089 | 97.74 | (12,299,000) | ||||||||||||
2025 | 444,769 | (3,175,231) | 263,759 | (60,137) | 42.36 | (15,057,000) | ||||||||||||
2024 | 566,586 | 1,646,586 | 1,255,193 | 1,315,281 | 120.77 | (21,087,000) | ||||||||||||
(1) | For all periods disclosed Mr. Solomita was the CEO. |
(2) | The adjustments noted in the table below were made to Summary Compensation Table totals for Mr. Solomita for each year to determine compensation actually paid. |
Year | Reported Summary Compensation Table Total for CEO ($) | Reported Value of Equity Awards ($) | Equity Award Adjustments(a) ($) | Compensation Actually Paid to CEO ($) | ||||||||
2026 | 1,507,112 | 1,063,421 | 1,216,500 | 1,660,191 | ||||||||
2025 | 444,769 | — | (3,620,000) | (3,175,231) | ||||||||
2024 | 566,586 | — | 1,080,000 | 1,646,586 | ||||||||
(a) | The amounts deducted or added in calculating the average equity award adjustments, are as follows: |
Year | Add Year- End Fair Value of Equity Awards ($) | Add Year- over-Year Change in Fair Value of Outstanding and Unvested Equity Awards ($) | Add Fair Value as of Vesting Date of Equity Awards Granted and Vested in the Year ($) | Add Year- over-Year Change in Fair Value of Equity Awards Granted in Prior Years that Vested in the Year ($) | Subtract Fair Value at the End of the Prior Year of Equity Awards that Failed to Meet Vesting Conditions in the Year ($) | Add Value of Dividends or other Earnings Paid on Stock or Option Awards not Otherwise Reflected in Fair Value or Total Compensation ($) | Total Equity Award Adjustment ($) | ||||||||||||||
2026 | 1,276,500 | (60,000) | — | — | — | — | 1,216,500 | ||||||||||||||
2025 | — | (3,620,000) | — | — | — | — | (3,620,000) | ||||||||||||||
2024 | — | 1,080,000 | — | — | — | — | 1,080,000 | ||||||||||||||
(3) | In 2026, the other NEOs were Mr. Adel Essaddam and Mr. Spencer Hart. In 2025 and 2024, the other NEOs were Fady Mansour and Stephen Champagne. |
(4) | The adjustments noted in the table below were made to Summary Compensation Table totals for our NEOs other than our CEO for each year to determine the compensation actually paid. |
Year | Average Reported Summary Compensation Table Total for Non-CEO NEOs ($) | Average Reported Value of Equity Awards ($) | Average Equity Award Adjustments(a) ($) | Average Compensation Actually Paid to Non-CEO NEOs ($) | ||||||||
2026 | 664,640 | 550,711 | 474,160 | 588,089 | ||||||||
2025 | 263,759 | — | (323,896) | (60,137) | ||||||||
2024 | 1,255,193 | 932,090 | 992,178 | 1,315,281 | ||||||||
(a) | The amounts deducted or added in calculating the average equity award adjustments, are as follows: |
Year | Add Average Year-End Fair Value of Equity Awards ($) | Add Average Year-over- Year Change in Fair Value of Outstanding and Unvested Equity Awards ($) | Add Average Fair Value as of Vesting Date of Equity Awards Granted and Vested in the Year ($) | Add Average Year-over- Year Change in Fair Value of Equity Awards Granted in Prior Years that Vested in the Year ($) | Subtract Average Fair Value at the End of the Prior Year of Equity Awards that Failed to Meet Vesting Conditions in the Year ($) | Add Average Value of Dividends or other Earnings Paid on Stock or Option Awards not Otherwise Reflected in Fair Value or Total Compensation ($) | Total Average Equity Award Adjustment ($) | ||||||||||||||
2026 | 351,800 | (184) | 123,200 | (656) | — | — | 474,160 | ||||||||||||||
2025 | — | (292,236) | — | (31,660) | — | — | (323,896) | ||||||||||||||
2024 | 989,060 | — | — | 3,118 | — | — | 992,178 | ||||||||||||||
(1) | For all periods disclosed Mr. Solomita was the CEO. |
(3) | In 2026, the other NEOs were Mr. Adel Essaddam and Mr. Spencer Hart. In 2025 and 2024, the other NEOs were Fady Mansour and Stephen Champagne. |
(2) | The adjustments noted in the table below were made to Summary Compensation Table totals for Mr. Solomita for each year to determine compensation actually paid. |
Year | Reported Summary Compensation Table Total for CEO ($) | Reported Value of Equity Awards ($) | Equity Award Adjustments(a) ($) | Compensation Actually Paid to CEO ($) | ||||||||
2026 | 1,507,112 | 1,063,421 | 1,216,500 | 1,660,191 | ||||||||
2025 | 444,769 | — | (3,620,000) | (3,175,231) | ||||||||
2024 | 566,586 | — | 1,080,000 | 1,646,586 | ||||||||
(a) | The amounts deducted or added in calculating the average equity award adjustments, are as follows: |
Year | Add Year- End Fair Value of Equity Awards ($) | Add Year- over-Year Change in Fair Value of Outstanding and Unvested Equity Awards ($) | Add Fair Value as of Vesting Date of Equity Awards Granted and Vested in the Year ($) | Add Year- over-Year Change in Fair Value of Equity Awards Granted in Prior Years that Vested in the Year ($) | Subtract Fair Value at the End of the Prior Year of Equity Awards that Failed to Meet Vesting Conditions in the Year ($) | Add Value of Dividends or other Earnings Paid on Stock or Option Awards not Otherwise Reflected in Fair Value or Total Compensation ($) | Total Equity Award Adjustment ($) | ||||||||||||||
2026 | 1,276,500 | (60,000) | — | — | — | — | 1,216,500 | ||||||||||||||
2025 | — | (3,620,000) | — | — | — | — | (3,620,000) | ||||||||||||||
2024 | — | 1,080,000 | — | — | — | — | 1,080,000 | ||||||||||||||
(4) | The adjustments noted in the table below were made to Summary Compensation Table totals for our NEOs other than our CEO for each year to determine the compensation actually paid. |
Year | Average Reported Summary Compensation Table Total for Non-CEO NEOs ($) | Average Reported Value of Equity Awards ($) | Average Equity Award Adjustments(a) ($) | Average Compensation Actually Paid to Non-CEO NEOs ($) | ||||||||
2026 | 664,640 | 550,711 | 474,160 | 588,089 | ||||||||
2025 | 263,759 | — | (323,896) | (60,137) | ||||||||
2024 | 1,255,193 | 932,090 | 992,178 | 1,315,281 | ||||||||
(a) | The amounts deducted or added in calculating the average equity award adjustments, are as follows: |
Year | Add Average Year-End Fair Value of Equity Awards ($) | Add Average Year-over- Year Change in Fair Value of Outstanding and Unvested Equity Awards ($) | Add Average Fair Value as of Vesting Date of Equity Awards Granted and Vested in the Year ($) | Add Average Year-over- Year Change in Fair Value of Equity Awards Granted in Prior Years that Vested in the Year ($) | Subtract Average Fair Value at the End of the Prior Year of Equity Awards that Failed to Meet Vesting Conditions in the Year ($) | Add Average Value of Dividends or other Earnings Paid on Stock or Option Awards not Otherwise Reflected in Fair Value or Total Compensation ($) | Total Average Equity Award Adjustment ($) | ||||||||||||||
2026 | 351,800 | (184) | 123,200 | (656) | — | — | 474,160 | ||||||||||||||
2025 | — | (292,236) | — | (31,660) | — | — | (323,896) | ||||||||||||||
2024 | 989,060 | — | — | 3,118 | — | — | 992,178 | ||||||||||||||
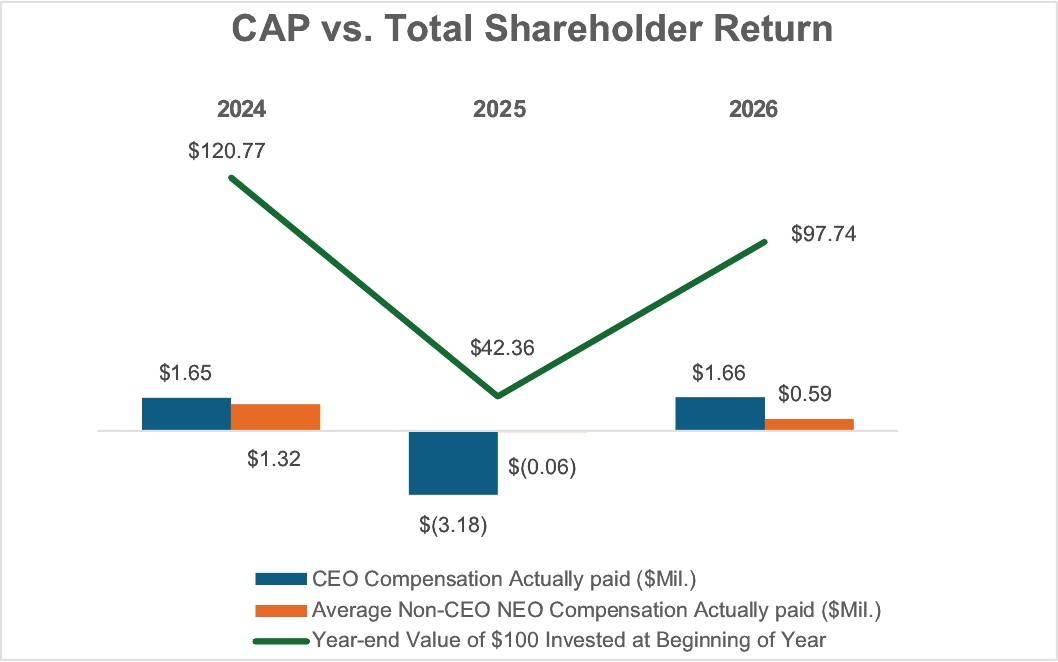
The chart below reflects the relationship between Compensation Actually Paid to the CEO, the average compensation actually paid to the non-CEO NEOs, and the Company’s Total Shareholder Return for the three years ended February 28, 2026.
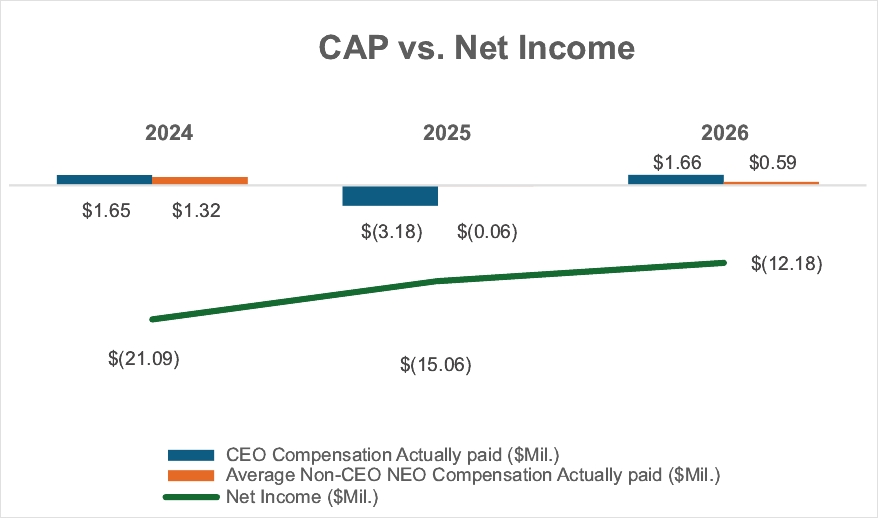
The chart below reflects the relationship between Compensation Actually Paid to the CEO, the average compensation actually paid to the non-CEO NEOs, and the Company’s Net Income for the three years ended February 28, 2026. The Company’s Net Income for the three years ended February 28, 2026 reflects that it is in the pre-commercialization stage with limited revenues.
(a) | The amounts deducted or added in calculating the average equity award adjustments, are as follows: |
Year | Add Year- End Fair Value of Equity Awards ($) | Add Year- over-Year Change in Fair Value of Outstanding and Unvested Equity Awards ($) | Add Fair Value as of Vesting Date of Equity Awards Granted and Vested in the Year ($) | Add Year- over-Year Change in Fair Value of Equity Awards Granted in Prior Years that Vested in the Year ($) | Subtract Fair Value at the End of the Prior Year of Equity Awards that Failed to Meet Vesting Conditions in the Year ($) | Add Value of Dividends or other Earnings Paid on Stock or Option Awards not Otherwise Reflected in Fair Value or Total Compensation ($) | Total Equity Award Adjustment ($) | ||||||||||||||
2026 | 1,276,500 | (60,000) | — | — | — | — | 1,216,500 | ||||||||||||||
2025 | — | (3,620,000) | — | — | — | — | (3,620,000) | ||||||||||||||
2024 | — | 1,080,000 | — | — | — | — | 1,080,000 | ||||||||||||||
(a) | The amounts deducted or added in calculating the average equity award adjustments, are as follows: |
Year | Add Average Year-End Fair Value of Equity Awards ($) | Add Average Year-over- Year Change in Fair Value of Outstanding and Unvested Equity Awards ($) | Add Average Fair Value as of Vesting Date of Equity Awards Granted and Vested in the Year ($) | Add Average Year-over- Year Change in Fair Value of Equity Awards Granted in Prior Years that Vested in the Year ($) | Subtract Average Fair Value at the End of the Prior Year of Equity Awards that Failed to Meet Vesting Conditions in the Year ($) | Add Average Value of Dividends or other Earnings Paid on Stock or Option Awards not Otherwise Reflected in Fair Value or Total Compensation ($) | Total Average Equity Award Adjustment ($) | ||||||||||||||
2026 | 351,800 | (184) | 123,200 | (656) | — | — | 474,160 | ||||||||||||||
2025 | — | (292,236) | — | (31,660) | — | — | (323,896) | ||||||||||||||
2024 | 989,060 | — | — | 3,118 | — | — | 992,178 | ||||||||||||||