Shareholder Report
Mar. 31, 2026
USD ($)
Holding
WHAT WERE THE FUND COSTS FOR THE LAST YEAR?
(Based on a hypothetical $10,000 investment)
| Fund | Costs of a $10,000 investment | Costs paid as a percentage of a $10,000 investment |
| First Trust Nasdaq Bank ETF | $68 | 0.61%(1) |
|
(1) |
Includes extraordinary expenses. If these extraordinary expenses were not included, the expense ratio would have been 0.60%. |
HOW DID THE FUND PERFORM LAST YEAR? WHAT AFFECTED THE FUND’S PERFORMANCE?
The Fund returned 21.39% during the 12 months ended March 31, 2026. The Fund underperformed its benchmark, the Nasdaq US Benchmark Banks™ Index, which returned 22.70% for the same Period.
During the Period, the Fund allocated investments between two sub-industries. Diversified Banks received an average weight of 50.6% and contributed 13.4% to the Fund’s overall return, while Regional Banks received an average weight of 49.0% and contributed 8.6% to the Fund’s overall return.
FUND PERFORMANCE (September 20, 2016 to March 31, 2026)
The performance line graph below shows the performance of a hypothetical $10,000 initial investment in the Fund over a ten-year period (or for the life of the Fund, if shorter). The subsequent account value as of the end of the Period is listed next to the name of the Fund or index, as applicable. The performance table below shows the average annual total returns of the Fund for the past one-, five-, and ten-year periods, as applicable (or for the life of the Fund, if shorter), as of the end of the Period. Both the line graph and performance table compare the Fund’s performance to an appropriate broad-based index and may compare to additional indices reflecting the market segment(s) in which the Fund invests over the same periods.
Investment Performance of $10,000
| Average Annual Total Returns (as of March 31, 2026) | 1 Year | 5 Year | Since Inception (9/20/16) |
| First Trust Nasdaq Bank ETF | 21.39% | 5.68% | 9.08% |
| Nasdaq US Smart BanksTM Index | 22.10% | 6.33% | 9.79% |
| Nasdaq US Benchmark BanksTM Index | 22.70% | 10.17% | 12.71% |
| Nasdaq US BenchmarkTM Index | 18.44% | 10.97% | 13.91% |
Visit www.ftportfolios.com/etf/FTXO for more recent performance information.
KEY FUND STATISTICS (As of March 31, 2026)
| Fund net assets | $323,635,179 |
| Total number of portfolio holdings | 50 |
| Total advisory fee paid | $1,869,379 |
| Portfolio turnover rate | 49% |
WHAT DID THE FUND INVEST IN? (As of March 31, 2026)
The tables below show the investment makeup of the Fund, representing the percentage of total investments of the Fund.
Top Ten Holdings
| Citigroup, Inc. | 8.3% |
| JPMorgan Chase & Co. | 7.9% |
| Bank of America Corp. | 7.9% |
| Wells Fargo & Co. | 7.9% |
| Truist Financial Corp. | 7.6% |
| PNC Financial Services Group (The), Inc. | 4.0% |
| Citizens Financial Group, Inc. | 3.9% |
| M&T Bank Corp. | 3.9% |
| U.S. Bancorp | 3.9% |
| First Citizens BancShares, Inc., Class A | 3.3% |
Sector Allocation
Top Ten Holdings
| Citigroup, Inc. | 8.3% |
| JPMorgan Chase & Co. | 7.9% |
| Bank of America Corp. | 7.9% |
| Wells Fargo & Co. | 7.9% |
| Truist Financial Corp. | 7.6% |
| PNC Financial Services Group (The), Inc. | 4.0% |
| Citizens Financial Group, Inc. | 3.9% |
| M&T Bank Corp. | 3.9% |
| U.S. Bancorp | 3.9% |
| First Citizens BancShares, Inc., Class A | 3.3% |
WHAT WERE THE FUND COSTS FOR THE LAST YEAR?
(Based on a hypothetical $10,000 investment)
| Fund | Costs of a $10,000 investment | Costs paid as a percentage of a $10,000 investment |
| First Trust Nasdaq Food & Beverage ETF | $60 | 0.61%(1) |
|
(1) |
Includes extraordinary expenses. If these extraordinary expenses were not included, the expense ratio would have been 0.60%. |
HOW DID THE FUND PERFORM LAST YEAR? WHAT AFFECTED THE FUND’S PERFORMANCE?
The Fund returned -3.64% during the 12 months ended March 31, 2026. The Fund underperformed its benchmark, the Nasdaq US Benchmark Food, Beverage and Tobacco™ Index, which returned 4.24% for the same Period.
During the Period, investments in the Food Products industry received the greatest allocation of any industry, with an average weight of 59.3%, and contributed -4.2% to the Fund’s overall return, the largest negative contribution of any industry. With an average weight of 5.5%, investments in the Chemicals industry contributed 1.5% to the Fund’s overall return, the largest positive contribution of any industry.
FUND PERFORMANCE (September 20, 2016 to March 31, 2026)
The performance line graph below shows the performance of a hypothetical $10,000 initial investment in the Fund over a ten-year period (or for the life of the Fund, if shorter). The subsequent account value as of the end of the Period is listed next to the name of the Fund or index, as applicable. The performance table below shows the average annual total returns of the Fund for the past one-, five-, and ten-year periods, as applicable (or for the life of the Fund, if shorter), as of the end of the Period. Both the line graph and performance table compare the Fund’s performance to an appropriate broad-based index and may compare to additional indices reflecting the market segment(s) in which the Fund invests over the same periods.
Investment Performance of $10,000
| Average Annual Total Returns (as of March 31, 2026) | 1 Year | 5 Year | Since Inception (9/20/16) |
| First Trust Nasdaq Food & Beverage ETF | -3.64% | -0.36% | 3.15% |
| Nasdaq US Smart Food & BeverageTM Index | -3.12% | 0.22% | 3.78% |
| Nasdaq US Benchmark Food, Beverage and TobaccoTM Index | 4.24% | 6.19% | 7.28% |
| Nasdaq US BenchmarkTM Index | 18.44% | 10.97% | 13.91% |
Visit www.ftportfolios.com/etf/FTXG for more recent performance information.
KEY FUND STATISTICS (As of March 31, 2026)
| Fund net assets | $18,810,565 |
| Total number of portfolio holdings | 32 |
| Total advisory fee paid | $135,047 |
| Portfolio turnover rate | 30% |
WHAT DID THE FUND INVEST IN? (As of March 31, 2026)
The tables below show the investment makeup of the Fund, representing the percentage of total investments of the Fund.
Top Ten Holdings
| Archer-Daniels-Midland Co. | 9.0% |
| Mondelez International, Inc., Class A | 8.0% |
| Coca-Cola (The) Co. | 8.0% |
| PepsiCo, Inc. | 7.8% |
| Kraft Heinz (The) Co. | 7.8% |
| Corteva, Inc. | 4.5% |
| Tyson Foods, Inc., Class A | 4.2% |
| Constellation Brands, Inc., Class A | 4.1% |
| Hershey (The) Co. | 3.8% |
| Keurig Dr Pepper, Inc. | 3.7% |
Sector Allocation
Top Ten Holdings
| Archer-Daniels-Midland Co. | 9.0% |
| Mondelez International, Inc., Class A | 8.0% |
| Coca-Cola (The) Co. | 8.0% |
| PepsiCo, Inc. | 7.8% |
| Kraft Heinz (The) Co. | 7.8% |
| Corteva, Inc. | 4.5% |
| Tyson Foods, Inc., Class A | 4.2% |
| Constellation Brands, Inc., Class A | 4.1% |
| Hershey (The) Co. | 3.8% |
| Keurig Dr Pepper, Inc. | 3.7% |
WHAT WERE THE FUND COSTS FOR THE LAST YEAR?
(Based on a hypothetical $10,000 investment)
| Fund | Costs of a $10,000 investment | Costs paid as a percentage of a $10,000 investment |
| First Trust Nasdaq Oil & Gas ETF | $70 | 0.61%(1) |
|
(1) |
Includes extraordinary expenses. If these extraordinary expenses were not included, the expense ratio would have been 0.60%. |
HOW DID THE FUND PERFORM LAST YEAR? WHAT AFFECTED THE FUND’S PERFORMANCE?
The Fund returned 31.05% during the 12 months ended March 31, 2026. The Fund underperformed its benchmark, the Nasdaq US Benchmark Energy™ Index, which returned 36.72% for the same Period.
During the Period, investments in the Oil & Gas Exploration & Production sub-industry received the greatest allocation of any sub-industry, with an average weight of 41.6%, and contributed 11.8% to the Fund’s overall return, the largest positive contribution of any sub-industry. No industry made a negative contribution to the Fund’s overall return.
FUND PERFORMANCE (September 20, 2016 to March 31, 2026)
The performance line graph below shows the performance of a hypothetical $10,000 initial investment in the Fund over a ten-year period (or for the life of the Fund, if shorter). The subsequent account value as of the end of the Period is listed next to the name of the Fund or index, as applicable. The performance table below shows the average annual total returns of the Fund for the past one-, five-, and ten-year periods, as applicable (or for the life of the Fund, if shorter), as of the end of the Period. Both the line graph and performance table compare the Fund’s performance to an appropriate broad-based index and may compare to additional indices reflecting the market segment(s) in which the Fund invests over the same periods.
Investment Performance of $10,000
| Average Annual Total Returns (as of March 31, 2026) | 1 Year | 5 Year | Since Inception (9/20/16) |
| First Trust Nasdaq Oil & Gas ETF | 31.05% | 23.07% | 9.65% |
| Nasdaq US Smart Oil & GasTM Index | 31.91% | 23.87% | 10.35% |
| Nasdaq US Benchmark EnergyTM Index | 36.72% | 23.33% | 10.54% |
| Nasdaq US BenchmarkTM Index | 18.44% | 10.97% | 13.91% |
Visit www.ftportfolios.com/etf/FTXN for more recent performance information.
KEY FUND STATISTICS (As of March 31, 2026)
| Fund net assets | $179,657,478 |
| Total number of portfolio holdings | 45 |
| Total advisory fee paid | $718,178 |
| Portfolio turnover rate | 30% |
WHAT DID THE FUND INVEST IN? (As of March 31, 2026)
The tables below show the investment makeup of the Fund, representing the percentage of total investments (excluding repurchase agreements held as collateral for securities lending arrangements) of the Fund.
Top Ten Holdings
| ConocoPhillips | 8.0% |
| Exxon Mobil Corp. | 7.6% |
| Chevron Corp. | 7.6% |
| Occidental Petroleum Corp. | 6.0% |
| EOG Resources, Inc. | 5.4% |
| Venture Global, Inc., Class A | 5.1% |
| Marathon Petroleum Corp. | 4.2% |
| Diamondback Energy, Inc. | 3.9% |
| Devon Energy Corp. | 3.7% |
| Valero Energy Corp. | 3.3% |
Sector Allocation
Top Ten Holdings
| ConocoPhillips | 8.0% |
| Exxon Mobil Corp. | 7.6% |
| Chevron Corp. | 7.6% |
| Occidental Petroleum Corp. | 6.0% |
| EOG Resources, Inc. | 5.4% |
| Venture Global, Inc., Class A | 5.1% |
| Marathon Petroleum Corp. | 4.2% |
| Diamondback Energy, Inc. | 3.9% |
| Devon Energy Corp. | 3.7% |
| Valero Energy Corp. | 3.3% |
WHAT WERE THE FUND COSTS FOR THE LAST YEAR?
(Based on a hypothetical $10,000 investment)
| Fund | Costs of a $10,000 investment | Costs paid as a percentage of a $10,000 investment |
| First Trust Nasdaq Pharmaceuticals ETF | $69 | 0.61%(1) |
|
(1) |
Includes extraordinary expenses. If these extraordinary expenses were not included, the expense ratio would have been 0.60%. |
HOW DID THE FUND PERFORM LAST YEAR? WHAT AFFECTED THE FUND’S PERFORMANCE?
The Fund returned 26.44% during the 12 months ended March 31, 2026. The Fund outperformed its benchmark, the Nasdaq US Benchmark Pharmaceuticals™ Index, which returned 20.04% for the same Period.
During the Period, the Fund allocated over 90% of its assets across 2 industries: Pharmaceuticals and Biotechnology. Investments in the Pharmaceuticals industry received the greatest allocation of any industry, with an average weight of 47.5%, and contributed 10.4% to the Fund’s overall return. With an average weight of 43.8%, investments in the Biotechnology industry contributed 12.3% to the Fund’s overall return, the largest positive contribution of any industry. No industry made a negative contribution to the Fund’s overall return.
FUND PERFORMANCE (September 20, 2016 to March 31, 2026)
The performance line graph below shows the performance of a hypothetical $10,000 initial investment in the Fund over a ten-year period (or for the life of the Fund, if shorter). The subsequent account value as of the end of the Period is listed next to the name of the Fund or index, as applicable. The performance table below shows the average annual total returns of the Fund for the past one-, five-, and ten-year periods, as applicable (or for the life of the Fund, if shorter), as of the end of the Period. Both the line graph and performance table compare the Fund’s performance to an appropriate broad-based index and may compare to additional indices reflecting the market segment(s) in which the Fund invests over the same periods.
Investment Performance of $10,000
| Average Annual Total Returns (as of March 31, 2026) | 1 Year | 5 Year | Since Inception (9/20/16) |
| First Trust Nasdaq Pharmaceuticals ETF | 26.44% | 7.59% | 7.13% |
| Nasdaq US Smart PharmaceuticalsTM Index | 27.32% | 8.31% | 7.83% |
| Nasdaq US Benchmark PharmaceuticalsTM Index | 20.04% | 14.72% | 13.06% |
| Nasdaq US BenchmarkTM Index | 18.44% | 10.97% | 13.91% |
Visit www.ftportfolios.com/etf/FTXH for more recent performance information.
KEY FUND STATISTICS (As of March 31, 2026)
| Fund net assets | $29,175,335 |
| Total number of portfolio holdings | 51 |
| Total advisory fee paid | $114,842 |
| Portfolio turnover rate | 35% |
WHAT DID THE FUND INVEST IN? (As of March 31, 2026)
The tables below show the investment makeup of the Fund, representing the percentage of total investments of the Fund.
Top Ten Holdings
| Johnson & Johnson | 7.5% |
| Bristol-Myers Squibb Co. | 7.4% |
| Merck & Co., Inc. | 7.4% |
| AbbVie, Inc. | 7.1% |
| Eli Lilly & Co. | 6.6% |
| Pfizer, Inc. | 3.8% |
| Regeneron Pharmaceuticals, Inc. | 3.7% |
| Biogen, Inc. | 3.6% |
| Gilead Sciences, Inc. | 3.5% |
| Cardinal Health, Inc. | 3.5% |
Sector Allocation

Top Ten Holdings
| Johnson & Johnson | 7.5% |
| Bristol-Myers Squibb Co. | 7.4% |
| Merck & Co., Inc. | 7.4% |
| AbbVie, Inc. | 7.1% |
| Eli Lilly & Co. | 6.6% |
| Pfizer, Inc. | 3.8% |
| Regeneron Pharmaceuticals, Inc. | 3.7% |
| Biogen, Inc. | 3.6% |
| Gilead Sciences, Inc. | 3.5% |
| Cardinal Health, Inc. | 3.5% |
WHAT WERE THE FUND COSTS FOR THE LAST YEAR?
(Based on a hypothetical $10,000 investment)
| Fund | Costs of a $10,000 investment | Costs paid as a percentage of a $10,000 investment |
| First Trust S-Network E-Commerce ETF | $59 | 0.61%(1) |
|
(1)
|
Includes extraordinary expenses. If these extraordinary expenses were not included, the expense ratio would have been 0.60%.
|
HOW DID THE FUND PERFORM LAST YEAR? WHAT AFFECTED THE FUND’S PERFORMANCE?
The Fund returned -7.01% during the 12 months ended March 31, 2026. The Fund underperformed its benchmark, the MSCI ACWI Index, which returned 20.01% for the same Period.
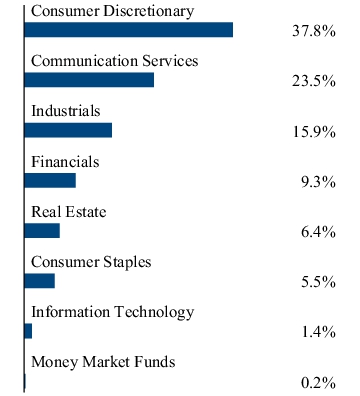
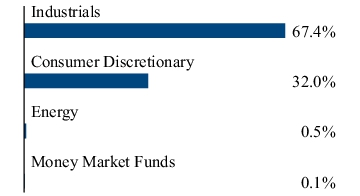
During the Period, investments in the Consumer Discretionary sector received the greatest allocation of any sector, with an average weight of 38.0%, and contributed -1.9% to the Fund’s overall return. With average weights of 13.3% and 5.4%, respectively, investments in the Industrials and Consumer Staples sectors each contributed 1.4% to the Fund’s overall return, the largest positive contributions of any sectors. Investments in the Financials sector contributed -4.1% to the Fund’s overall return, the largest negative contribution of any sector, and held an average weight of 9.2%. The Fund’s currency exposure contributed 1.1% to the Fund’s overall return.
FUND PERFORMANCE (September 20, 2016 to March 31, 2026)
The performance line graph below shows the performance of a hypothetical $10,000 initial investment in the Fund over a ten-year period (or for the life of the Fund, if shorter). The subsequent account value as of the end of the Period is listed next to the name of the Fund or index, as applicable. The performance table below shows the average annual total returns of the Fund for the past one-, five-, and ten-year periods, as applicable (or for the life of the Fund, if shorter), as of the end of the Period. Both the line graph and performance table compare the Fund’s performance to an appropriate broad-based index and may compare to additional indices reflecting the market segment(s) in which the Fund invests over the same periods.
Investment Performance of $10,000
| Average Annual Total Returns (as of March 31, 2026) | 1 Year | 5 Year | Since Inception (9/20/16) |
| First Trust S-Network E-Commerce ETF | -7.01% | 2.20% | 6.70% |
| S-Network Global E-Commerce IndexTM(1) (2) | -6.95% | ||
| MSCI ACWI Index | 20.01% | 9.49% | 11.36% |
|
(1)
|
On January 26, 2022, the Fund’s underlying index changed from the Nasdaq US Smart RetailTM Index to the S-Network Global E-Commerce IndexTM. Therefore, performance and historical returns shown for the periods prior to January 26, 2022, are not necessarily indicative of the performance that the Fund, based on its current index, would have generated.
|
|
(2)
|
Performance data is not available for all the periods shown in the table for the index because performance data does not exist for some of the entire periods.
|
Visit www.ftportfolios.com/etf/ISHP for more recent performance information.
KEY FUND STATISTICS (As of March 31, 2026)
| Fund net assets | $4,989,041 |
| Total number of portfolio holdings | 61 |
| Total advisory fee paid | $35,521 |
| Portfolio turnover rate | 41% |
WHAT DID THE FUND INVEST IN? (As of March 31, 2026)
The tables below show the investment makeup of the Fund, representing the percentage of total investments of the Fund.
Top Ten Holdings
| FedEx Corp. | 2.3% |
| Walmart, Inc. | 2.2% |
| COSCO SHIPPING Holdings Co., Ltd., Class H | 2.2% |
| A.P. Moller - Maersk A/S, Class B | 2.2% |
| Prologis, Inc. | 2.1% |
| Taiwan Mobile Co., Ltd. | 2.0% |
| eBay, Inc. | 2.0% |
| SF Holding Co., Ltd., Class H | 2.0% |
| JD.com, Inc., ADR | 2.0% |
| DHL Group | 1.9% |
Sector Allocation
Top Ten Holdings
| FedEx Corp. | 2.3% |
| Walmart, Inc. | 2.2% |
| COSCO SHIPPING Holdings Co., Ltd., Class H | 2.2% |
| A.P. Moller - Maersk A/S, Class B | 2.2% |
| Prologis, Inc. | 2.1% |
| Taiwan Mobile Co., Ltd. | 2.0% |
| eBay, Inc. | 2.0% |
| SF Holding Co., Ltd., Class H | 2.0% |
| JD.com, Inc., ADR | 2.0% |
| DHL Group | 1.9% |
WHAT WERE THE FUND COSTS FOR THE LAST YEAR?
(Based on a hypothetical $10,000 investment)
| Fund | Costs of a $10,000 investment | Costs paid as a percentage of a $10,000 investment |
| First Trust Nasdaq Semiconductor ETF | $89 | 0.60% |
HOW DID THE FUND PERFORM LAST YEAR? WHAT AFFECTED THE FUND’S PERFORMANCE?
The Fund returned 95.77% during the 12 months ended March 31, 2026. The Fund outperformed its benchmark, the Nasdaq US Benchmark Semiconductors™ Index, which returned 67.20% for the same Period.
During the Period, investments in the Semiconductors sub-industry received the greatest allocation of any sub-industry, with an average weight of 72.2%, and contributed 61.9% to the Fund’s overall return, the largest positive contribution of any sub-industry. No sub-industry made a negative contribution to the Fund’s overall return.
FUND PERFORMANCE (September 20, 2016 to March 31, 2026)
The performance line graph below shows the performance of a hypothetical $10,000 initial investment in the Fund over a ten-year period (or for the life of the Fund, if shorter). The subsequent account value as of the end of the Period is listed next to the name of the Fund or index, as applicable. The performance table below shows the average annual total returns of the Fund for the past one-, five-, and ten-year periods, as applicable (or for the life of the Fund, if shorter), as of the end of the Period. Both the line graph and performance table compare the Fund’s performance to an appropriate broad-based index and may compare to additional indices reflecting the market segment(s) in which the Fund invests over the same periods.
Investment Performance of $10,000
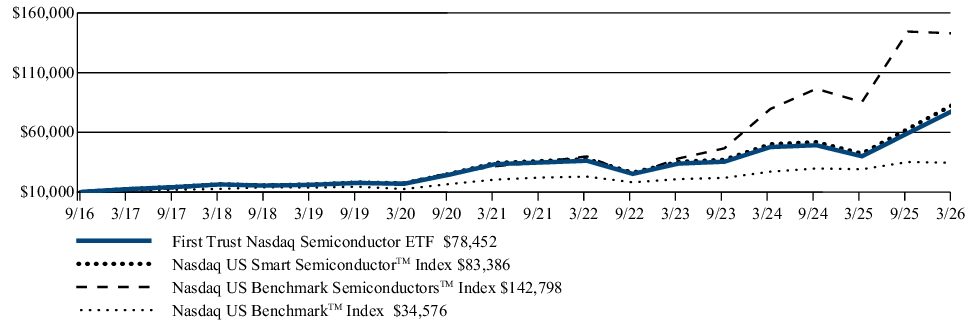
| Average Annual Total Returns (as of March 31, 2026) | 1 Year | 5 Year | Since Inception (9/20/16) |
| First Trust Nasdaq Semiconductor ETF | 95.77% | 18.57% | 24.14% |
| Nasdaq US Smart SemiconductorTM Index | 97.10% | 19.32% | 24.94% |
| Nasdaq US Benchmark SemiconductorsTM Index | 67.20% | 35.12% | 32.20% |
| Nasdaq US BenchmarkTM Index | 18.44% | 10.97% | 13.91% |
Visit www.ftportfolios.com/etf/FTXL for more recent performance information.
KEY FUND STATISTICS (As of March 31, 2026)
| Fund net assets | $1,484,597,387 |
| Total number of portfolio holdings | 35 |
| Total advisory fee paid | $4,323,980 |
| Portfolio turnover rate | 43% |
WHAT DID THE FUND INVEST IN? (As of March 31, 2026)
The tables below show the investment makeup of the Fund, representing the percentage of total investments of the Fund.
Top Ten Holdings
| NVIDIA Corp. | 8.2% |
| Broadcom, Inc. | 8.1% |
| Intel Corp. | 8.1% |
| QUALCOMM, Inc. | 7.6% |
| Micron Technology, Inc. | 6.9% |
| Marvell Technology, Inc. | 5.1% |
| Advanced Micro Devices, Inc. | 4.3% |
| KLA Corp. | 4.0% |
| ON Semiconductor Corp. | 3.9% |
| Applied Materials, Inc. | 3.8% |
Sector Allocation
Top Ten Holdings
| NVIDIA Corp. | 8.2% |
| Broadcom, Inc. | 8.1% |
| Intel Corp. | 8.1% |
| QUALCOMM, Inc. | 7.6% |
| Micron Technology, Inc. | 6.9% |
| Marvell Technology, Inc. | 5.1% |
| Advanced Micro Devices, Inc. | 4.3% |
| KLA Corp. | 4.0% |
| ON Semiconductor Corp. | 3.9% |
| Applied Materials, Inc. | 3.8% |
WHAT WERE THE FUND COSTS FOR THE LAST YEAR?
(Based on a hypothetical $10,000 investment)
| Fund | Costs of a $10,000 investment | Costs paid as a percentage of a $10,000 investment |
| First Trust Nasdaq Transportation ETF | $69 | 0.60% |
HOW DID THE FUND PERFORM LAST YEAR? WHAT AFFECTED THE FUND’S PERFORMANCE?
The Fund returned 30.11% during the 12 months ended March 31, 2026. The Fund outperformed its benchmark, the Nasdaq US Benchmark Industrial Transportation™ Index, which returned 22.98% for the same Period.
During the Period, investments in the Automobiles industry received the greatest allocation of any industry, with an average weight of 26.3%, and contributed 10.7% to the Fund’s overall return, the largest positive contribution of any industry. Investments in the Distributors industry contributed
-0.4% to the Fund’s overall return, the largest negative contribution of any industry, and held an average weight of 2.4%.
-0.4% to the Fund’s overall return, the largest negative contribution of any industry, and held an average weight of 2.4%.
FUND PERFORMANCE (September 20, 2016 to March 31, 2026)
The performance line graph below shows the performance of a hypothetical $10,000 initial investment in the Fund over a ten-year period (or for the life of the Fund, if shorter). The subsequent account value as of the end of the Period is listed next to the name of the Fund or index, as applicable. The performance table below shows the average annual total returns of the Fund for the past one-, five-, and ten-year periods, as applicable (or for the life of the Fund, if shorter), as of the end of the Period. Both the line graph and performance table compare the Fund’s performance to an appropriate broad-based index and may compare to additional indices reflecting the market segment(s) in which the Fund invests over the same periods.
Investment Performance of $10,000
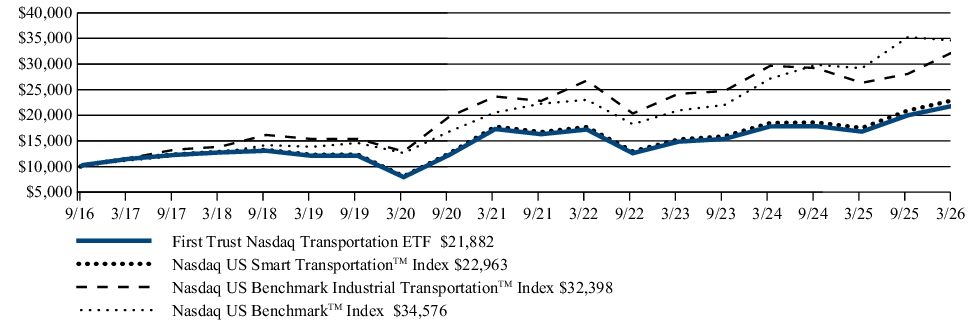
| Average Annual Total Returns (as of March 31, 2026) | 1 Year | 5 Year | Since Inception (9/20/16) |
| First Trust Nasdaq Transportation ETF | 30.11% | 4.78% | 8.57% |
| Nasdaq US Smart TransportationTM Index | 30.96% | 5.23% | 9.12% |
| Nasdaq US Benchmark Industrial TransportationTM Index | 22.98% | 6.48% | 13.13% |
| Nasdaq US BenchmarkTM Index | 18.44% | 10.97% | 13.91% |
Visit www.ftportfolios.com/etf/FTXR for more recent performance information.
KEY FUND STATISTICS (As of March 31, 2026)
| Fund net assets | $838,998,003 |
| Total number of portfolio holdings | 45 |
| Total advisory fee paid | $593,943 |
| Portfolio turnover rate | 70% |
WHAT DID THE FUND INVEST IN? (As of March 31, 2026)
The tables below show the investment makeup of the Fund, representing the percentage of total investments (excluding repurchase agreements held as collateral for securities lending arrangements) of the Fund.
Top Ten Holdings
| General Motors Co. | 8.2% |
| Tesla, Inc. | 8.0% |
| Union Pacific Corp. | 8.0% |
| Ford Motor Co. | 7.1% |
| United Parcel Service, Inc., Class B | 6.9% |
| Delta Air Lines, Inc. | 4.4% |
| CSX Corp. | 4.2% |
| FedEx Corp. | 4.0% |
| PACCAR, Inc. | 4.0% |
| United Rentals, Inc. | 3.8% |
Sector Allocation
Top Ten Holdings
| General Motors Co. | 8.2% |
| Tesla, Inc. | 8.0% |
| Union Pacific Corp. | 8.0% |
| Ford Motor Co. | 7.1% |
| United Parcel Service, Inc., Class B | 6.9% |
| Delta Air Lines, Inc. | 4.4% |
| CSX Corp. | 4.2% |
| FedEx Corp. | 4.0% |
| PACCAR, Inc. | 4.0% |
| United Rentals, Inc. | 3.8% |
WHAT WERE THE FUND COSTS FOR THE LAST YEAR?
(Based on a hypothetical $10,000 investment)
| Fund | Costs of a $10,000 investment | Costs paid as a percentage of a $10,000 investment |
| Emerging Markets Equity Select ETF | $79 | 0.76%(1) |
|
(1) |
Includes extraordinary expenses. If these extraordinary expenses were not included, the expense ratio would have been 0.75%. |
HOW DID THE FUND PERFORM LAST YEAR? WHAT AFFECTED THE FUND’S PERFORMANCE?
The Fund returned 7.96% during the 12 months ended March 31, 2026. The Fund underperformed its benchmark, the Nasdaq Emerging Large Mid Cap™ Index, which returned 20.88% for the same Period.
During the Period, investments in India received the greatest allocation of any country, with an average weight of 36.3%, and contributed -3.2% to the Fund’s overall return, the largest negative contribution of any country. With an average weight of 8.6%, investments in Brazil contributed 3.8% to the Fund’s overall return, the largest positive contribution of any country. The Fund’s currency exposure contributed -1.0% to the Fund’s overall return.
FUND PERFORMANCE (June 20, 2017 to March 31, 2026)
The performance line graph below shows the performance of a hypothetical $10,000 initial investment in the Fund over a ten-year period (or for the life of the Fund, if shorter). The subsequent account value as of the end of the Period is listed next to the name of the Fund or index, as applicable. The performance table below shows the average annual total returns of the Fund for the past one-, five-, and ten-year periods, as applicable (or for the life of the Fund, if shorter), as of the end of the Period. Both the line graph and performance table compare the Fund’s performance to an appropriate broad-based index and may compare to additional indices reflecting the market segment(s) in which the Fund invests over the same periods.
Investment Performance of $10,000
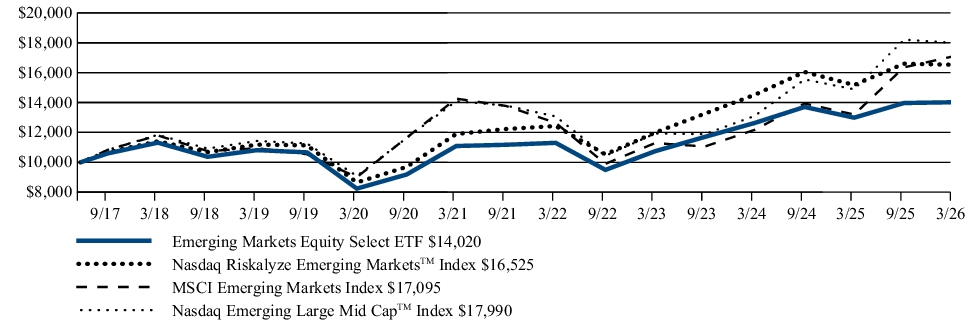
| Average Annual Total Returns (as of March 31, 2026) | 1 Year | 5 Year | Since Inception (6/20/17) |
| Emerging Markets Equity Select ETF | 7.96% | 4.80% | 3.92% |
| Nasdaq Riskalyze Emerging MarketsTM Index | 8.94% | 6.80% | 5.89% |
| MSCI Emerging Markets Index | 29.55% | 3.69% | 6.30% |
| Nasdaq Emerging Large Mid CapTM Index | 20.88% | 5.01% | 6.92% |
Visit www.ftportfolios.com/etf/RNEM for more recent performance information.
KEY FUND STATISTICS (As of March 31, 2026)
| Fund net assets | $16,227,259 |
| Total number of portfolio holdings | 278 |
| Total advisory fee paid | $124,636 |
| Portfolio turnover rate | 64% |
WHAT DID THE FUND INVEST IN? (As of March 31, 2026)
The tables below show the investment makeup of the Fund, representing the percentage of total investments of the Fund.
Top Ten Holdings
| United Microelectronics Corp. | 3.6% |
| China Resources Pharmaceutical Group Ltd. | 2.6% |
| Novatek Microelectronics Corp. | 2.6% |
| China Tower Corp., Ltd., Class H | 2.4% |
| Tata Consultancy Services Ltd. | 2.3% |
| Titan Co., Ltd. | 2.3% |
| Tencent Holdings Ltd. | 2.2% |
| State Bank of India | 2.1% |
| Axis Bank Ltd. | 1.9% |
| SBI Life Insurance Co., Ltd. | 1.8% |
Sector Allocation
Top Ten Holdings
| United Microelectronics Corp. | 3.6% |
| China Resources Pharmaceutical Group Ltd. | 2.6% |
| Novatek Microelectronics Corp. | 2.6% |
| China Tower Corp., Ltd., Class H | 2.4% |
| Tata Consultancy Services Ltd. | 2.3% |
| Titan Co., Ltd. | 2.3% |
| Tencent Holdings Ltd. | 2.2% |
| State Bank of India | 2.1% |
| Axis Bank Ltd. | 1.9% |
| SBI Life Insurance Co., Ltd. | 1.8% |
WHAT WERE THE FUND COSTS FOR THE LAST YEAR?
(Based on a hypothetical $10,000 investment)
| Fund | Costs of a $10,000 investment | Costs paid as a percentage of a $10,000 investment |
| First Trust Bloomberg Shareholder Yield ETF | $64 | 0.61%(1) |
|
(1)
|
Includes extraordinary expenses. If these extraordinary expenses were not included, the expense ratio would have been 0.60%.
|
HOW DID THE FUND PERFORM LAST YEAR? WHAT AFFECTED THE FUND’S PERFORMANCE?
The Fund returned 9.15% during the 12 months ended March 31, 2026. The Fund underperformed its benchmark, the S&P 500® Index, which returned 17.80% for the same Period.
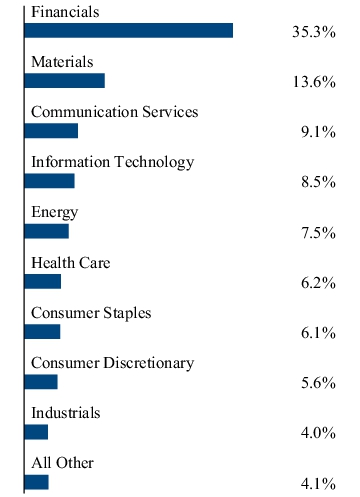
During the Period, investments in the Financials sector received the greatest allocation of any sector, with an average weight of 21.6%, and contributed -3.6% to the Fund’s overall return, the largest negative contribution of any sector. With an average weight of 9.4%, investments in the Energy sector contributed 5.6% to the Fund’s overall return, the largest positive contribution of any sector.
FUND PERFORMANCE (June 20, 2017 to March 31, 2026)
The performance line graph below shows the performance of a hypothetical $10,000 initial investment in the Fund over a ten-year period (or for the life of the Fund, if shorter). The subsequent account value as of the end of the Period is listed next to the name of the Fund or index, as applicable. The performance table below shows the average annual total returns of the Fund for the past one-, five-, and ten-year periods, as applicable (or for the life of the Fund, if shorter), as of the end of the Period. Both the line graph and performance table compare the Fund’s performance to an appropriate broad-based index and may compare to additional indices reflecting the market segment(s) in which the Fund invests over the same periods.
Investment Performance of $10,000
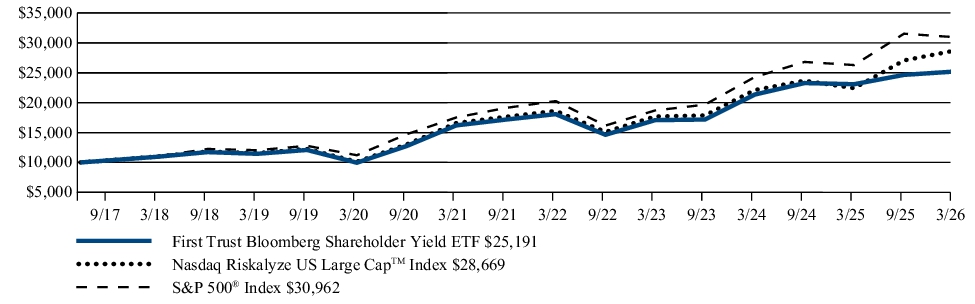
| Average Annual Total Returns (as of March 31, 2026) | 1 Year | 5 Year | Since Inception (6/20/17) |
| First Trust Bloomberg Shareholder Yield ETF | 9.15% | 9.24% | 11.10% |
| Bloomberg Shareholder Yield Index(1) (2) | 9.84% | ||
| Nasdaq Riskalyze US Large CapTM Index | 27.90% | 11.57% | 12.75% |
| S&P 500® Index | 17.80% | 12.06% | 13.74% |
|
(1)
|
On March 4, 2024, the Fund’s underlying index changed from the Nasdaq Riskalyze US Large CapTM Index to the Bloomberg Shareholder Yield Index. Therefore, any Fund performance and historical returns shown above that incorporate Fund performance prior to March 4, 2024, reflect performance of the Fund based on the Nasdaq Riskalyze US Large CapTM Index and are not necessarily indicative of the performance that the Fund, based on the Bloomberg Shareholder Yield Index, would have generated.
|
|
(2)
|
Performance data is not available for all the periods shown in the table for the index because performance data does not exist for some of the entire periods.
|
Visit www.ftportfolios.com/etf/SHRY for more recent performance information.
KEY FUND STATISTICS (As of March 31, 2026)
| Fund net assets | $17,395,897 |
| Total number of portfolio holdings | 52 |
| Total advisory fee paid | $104,672 |
| Portfolio turnover rate | 149% |
WHAT DID THE FUND INVEST IN? (As of March 31, 2026)
The tables below show the investment makeup of the Fund, representing the percentage of total investments of the Fund.
Top Ten Holdings
| Charter Communications, Inc., Class A | 5.1% |
| ConocoPhillips | 5.0% |
| Comcast Corp., Class A | 4.7% |
| Cheniere Energy, Inc. | 4.4% |
| Synchrony Financial | 4.0% |
| Chevron Corp. | 3.8% |
| Altria Group, Inc. | 3.8% |
| MetLife, Inc. | 3.3% |
| PayPal Holdings, Inc. | 3.2% |
| Cigna Group (The) | 2.8% |
Sector Allocation
Top Ten Holdings
| Charter Communications, Inc., Class A | 5.1% |
| ConocoPhillips | 5.0% |
| Comcast Corp., Class A | 4.7% |
| Cheniere Energy, Inc. | 4.4% |
| Synchrony Financial | 4.0% |
| Chevron Corp. | 3.8% |
| Altria Group, Inc. | 3.8% |
| MetLife, Inc. | 3.3% |
| PayPal Holdings, Inc. | 3.2% |
| Cigna Group (The) | 2.8% |
WHAT WERE THE FUND COSTS FOR THE LAST YEAR?
(Based on a hypothetical $10,000 investment)
| Fund | Costs of a $10,000 investment | Costs paid as a percentage of a $10,000 investment |
| First Trust SMID Capital Strength ETF | $62 | 0.61%(1) |
|
(1)
|
Includes extraordinary expenses. If these extraordinary expenses were not included, the expense ratio would have been 0.60%.
|
HOW DID THE FUND PERFORM LAST YEAR? WHAT AFFECTED THE FUND’S PERFORMANCE?
The Fund returned 2.92% during the 12 months ended March 31, 2026. The Fund underperformed its benchmark, the Russell 3000® Index, which returned 18.09% for the same Period.
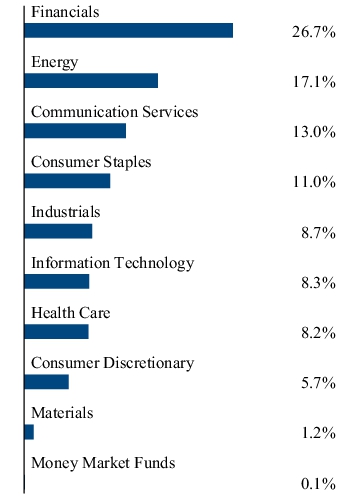
During the Period, investments in the Financials sector received the greatest allocation of any sector, with an average weight of 30.0%, and contributed 1.1% to the Fund’s overall return. With an average weight of 28.7%, investments in the Industrials sector contributed 1.9% to the Fund’s overall return, the largest positive contribution of any sector. Investments in the Health Care sector contributed -0.4% to the Fund’s overall return, the largest negative contribution of any sector, and held an average weight of 6.0%.
FUND PERFORMANCE (June 20, 2017 to March 31, 2026)
The performance line graph below shows the performance of a hypothetical $10,000 initial investment in the Fund over a ten-year period (or for the life of the Fund, if shorter). The subsequent account value as of the end of the Period is listed next to the name of the Fund or index, as applicable. The performance table below shows the average annual total returns of the Fund for the past one-, five-, and ten-year periods, as applicable (or for the life of the Fund, if shorter), as of the end of the Period. Both the line graph and performance table compare the Fund’s performance to an appropriate broad-based index and may compare to additional indices reflecting the market segment(s) in which the Fund invests over the same periods.
Investment Performance of $10,000
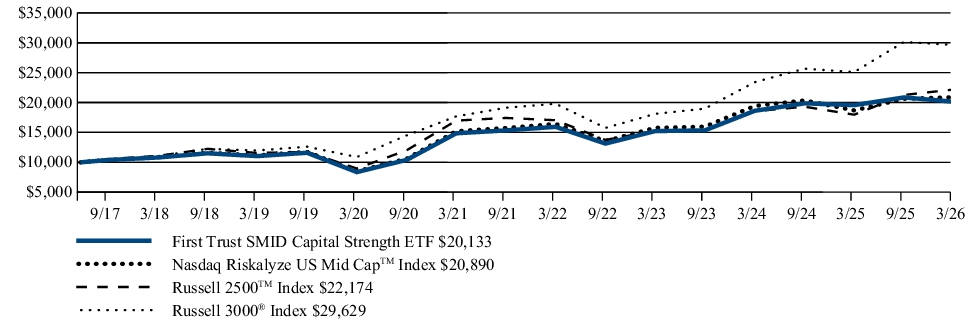
| Average Annual Total Returns (as of March 31, 2026) | 1 Year | 5 Year | Since Inception (6/20/17) |
| First Trust SMID Capital Strength ETF | 2.92% | 6.26% | 8.30% |
| The SMID Capital Strength Index(1) (2) | 3.56% | ||
| Nasdaq Riskalyze US Mid CapTM Index | 11.81% | 6.57% | 8.75% |
| Russell 2500TM Index | 23.45% | 5.48% | 9.50% |
| Russell 3000® Index | 18.09% | 10.87% | 13.17% |
|
(1)
|
On June 7, 2024, the Fund’s underlying index changed from the Nasdaq Riskalyze US Mid CapTM Index to The SMID Capital Strength Index. Therefore, the Fund’s performance and historical returns shown for the periods prior to this date are not necessarily indicative of the performance that the Fund, based on its current index, would have generated.
|
|
(2)
|
Performance data is not available for all the periods shown in the table for the index because performance data does not exist for some of the entire periods.
|
Visit www.ftportfolios.com/etf/FSCS for more recent performance information.
KEY FUND STATISTICS (As of March 31, 2026)
| Fund net assets | $56,332,976 |
| Total number of portfolio holdings | 101 |
| Total advisory fee paid | $288,267 |
| Portfolio turnover rate | 123% |
WHAT DID THE FUND INVEST IN? (As of March 31, 2026)
The tables below show the investment makeup of the Fund, representing the percentage of total investments of the Fund.
Top Ten Holdings
| CF Industries Holdings, Inc. | 1.6% |
| Magnolia Oil & Gas Corp., Class A | 1.5% |
| A10 Networks, Inc. | 1.4% |
| Coca-Cola Consolidated, Inc. | 1.3% |
| Hamilton Insurance Group Ltd., Class B | 1.3% |
| Innoviva, Inc. | 1.3% |
| Pathward Financial, Inc. | 1.2% |
| New York Times (The) Co., Class A | 1.2% |
| Casey’s General Stores, Inc. | 1.2% |
| Ensign Group (The), Inc. | 1.2% |
Sector Allocation
Top Ten Holdings
| CF Industries Holdings, Inc. | 1.6% |
| Magnolia Oil & Gas Corp., Class A | 1.5% |
| A10 Networks, Inc. | 1.4% |
| Coca-Cola Consolidated, Inc. | 1.3% |
| Hamilton Insurance Group Ltd., Class B | 1.3% |
| Innoviva, Inc. | 1.3% |
| Pathward Financial, Inc. | 1.2% |
| New York Times (The) Co., Class A | 1.2% |
| Casey’s General Stores, Inc. | 1.2% |
| Ensign Group (The), Inc. | 1.2% |
WHAT WERE THE FUND COSTS FOR THE LAST YEAR?
(Based on a hypothetical $10,000 investment)
| Fund | Costs of a $10,000 investment | Costs paid as a percentage of a $10,000 investment |
| First Trust SMID Growth Strength ETF | $63(1) | 0.61%(1) (2) |
|
(1)
|
Excludes any Acquired Fund Fees and Expenses of the underlying investment companies in which the Fund invests.
|
|
(2)
|
Includes extraordinary expenses. If these extraordinary expenses were not included, the expense ratio would have been 0.60%.
|
HOW DID THE FUND PERFORM LAST YEAR? WHAT AFFECTED THE FUND’S PERFORMANCE?
The Fund returned 6.68% during the 12 months ended March 31, 2026. The Fund underperformed its benchmark, the Russell 3000® Index, which returned 18.09% for the same Period.
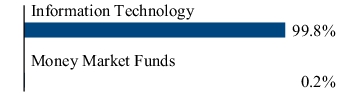
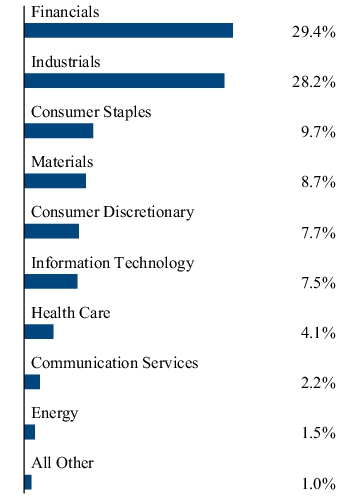
During the Period, investments in the Industrials sector received the greatest allocation of any sector, with an average weight of 26.0%, and contributed 5.9% to the Fund’s overall return, the largest positive contribution of any sector. Investments in the Information Technology sector contributed -2.1% to the Fund’s overall return, the largest negative contribution of any sector, and held an average weight of 12.0%.
FUND PERFORMANCE (June 20, 2017 to March 31, 2026)
The performance line graph below shows the performance of a hypothetical $10,000 initial investment in the Fund over a ten-year period (or for the life of the Fund, if shorter). The subsequent account value as of the end of the Period is listed next to the name of the Fund or index, as applicable. The performance table below shows the average annual total returns of the Fund for the past one-, five-, and ten-year periods, as applicable (or for the life of the Fund, if shorter), as of the end of the Period. Both the line graph and performance table compare the Fund’s performance to an appropriate broad-based index and may compare to additional indices reflecting the market segment(s) in which the Fund invests over the same periods.
Investment Performance of $10,000
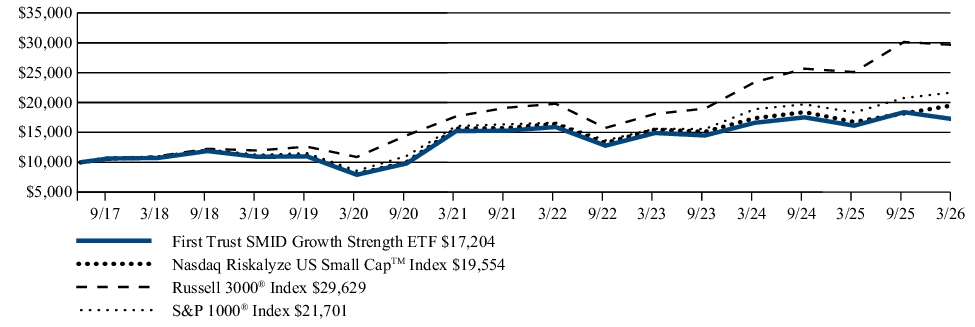
| Average Annual Total Returns (as of March 31, 2026) | 1 Year | 5 Year | Since Inception (6/20/17) |
| First Trust SMID Growth Strength ETF | 6.68% | 2.46% | 6.38% |
| The SMID Growth Strength Index(1) (2) | 7.37% | ||
| Nasdaq Riskalyze US Small CapTM Index | 16.75% | 4.57% | 7.94% |
| Russell 3000® Index | 18.09% | 10.87% | 13.17% |
| S&P 1000® Index | 18.35% | 6.19% | 9.23% |
|
(1)
|
On December 3, 2024, the Fund’s underlying index changed from the Nasdaq Riskalyze US Small CapTM Index to The SMID Growth Strength Index. Therefore, the Fund’s performance and historical returns shown for the periods prior to this date are not necessarily indicative of the performance that the Fund, based on its current index, would have generated.
|
|
(2)
|
Performance data is not available for all the periods shown in the table for the index because performance data does not exist for some of the entire periods.
|
Visit www.ftportfolios.com/etf/FSGS for more recent performance information.
KEY FUND STATISTICS (As of March 31, 2026)
| Fund net assets | $27,758,169 |
| Total number of portfolio holdings | 102 |
| Total advisory fee paid | $176,199 |
| Portfolio turnover rate | 135% |
WHAT DID THE FUND INVEST IN? (As of March 31, 2026)
The tables below show the investment makeup of the Fund, representing the percentage of total investments (excluding repurchase agreements held as collateral for securities lending arrangements) of the Fund.
Top Ten Holdings
| Clear Secure, Inc., Class A | 1.5% |
| MasTec, Inc. | 1.4% |
| Coca-Cola Consolidated, Inc. | 1.4% |
| Stride, Inc. | 1.4% |
| LeMaitre Vascular, Inc. | 1.4% |
| Comfort Systems USA, Inc. | 1.3% |
| New York Times (The) Co., Class A | 1.3% |
| ATI, Inc. | 1.3% |
| Lantheus Holdings, Inc. | 1.3% |
| Sterling Infrastructure, Inc. | 1.3% |
Sector Allocation
Top Ten Holdings
| Clear Secure, Inc., Class A | 1.5% |
| MasTec, Inc. | 1.4% |
| Coca-Cola Consolidated, Inc. | 1.4% |
| Stride, Inc. | 1.4% |
| LeMaitre Vascular, Inc. | 1.4% |
| Comfort Systems USA, Inc. | 1.3% |
| New York Times (The) Co., Class A | 1.3% |
| ATI, Inc. | 1.3% |
| Lantheus Holdings, Inc. | 1.3% |
| Sterling Infrastructure, Inc. | 1.3% |
WHAT WERE THE FUND COSTS FOR THE LAST YEAR?
(Based on a hypothetical $10,000 investment)
| Fund | Costs of a $10,000 investment | Costs paid as a percentage of a $10,000 investment |
| First Trust S&P 500 Diversified Dividend Aristocrats ETF | $55 | 0.51%(1) |
|
(1)
|
Includes extraordinary expenses. If these extraordinary expenses were not included, the expense ratio would have been 0.50%.
|
HOW DID THE FUND PERFORM LAST YEAR? WHAT AFFECTED THE FUND’S PERFORMANCE?
The Fund returned 15.20% during the 12 months ended March 31, 2026. The Fund underperformed its benchmark, the S&P 500® Index, which returned 17.80% for the same Period.
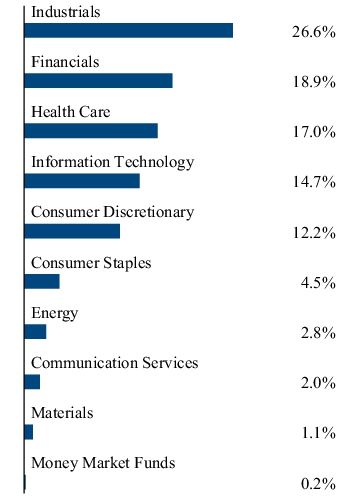
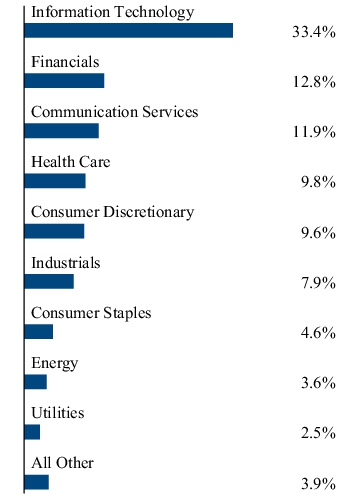
During the Period, investments in the Information Technology sector received the greatest allocation of any sector, with an average weight of 33.6%, and contributed 10.4% to the Fund’s overall return, the largest positive contribution of any sector. Investments in the Consumer Staples sector contributed -0.8% to the Fund’s overall return, the largest negative contribution of any sector, and held an average weight of 5.2%.
FUND PERFORMANCE (June 20, 2017 to March 31, 2026)
The performance line graph below shows the performance of a hypothetical $10,000 initial investment in the Fund over a ten-year period (or for the life of the Fund, if shorter). The subsequent account value as of the end of the Period is listed next to the name of the Fund or index, as applicable. The performance table below shows the average annual total returns of the Fund for the past one-, five-, and ten-year periods, as applicable (or for the life of the Fund, if shorter), as of the end of the Period. Both the line graph and performance table compare the Fund’s performance to an appropriate broad-based index and may compare to additional indices reflecting the market segment(s) in which the Fund invests over the same periods.
Investment Performance of $10,000
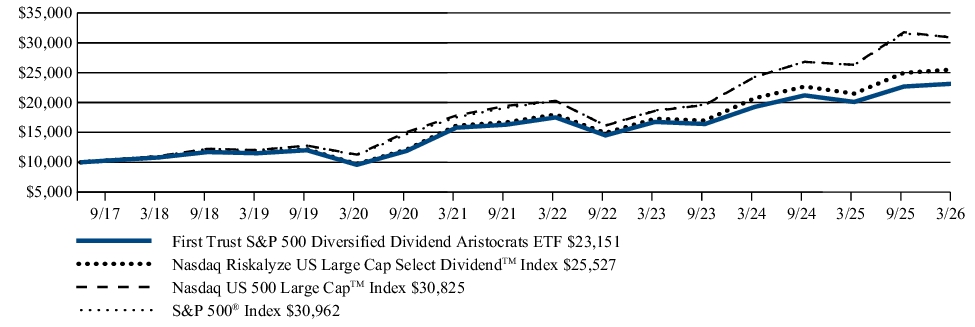
| Average Annual Total Returns (as of March 31, 2026) | 1 Year | 5 Year | Since Inception (6/20/17) |
| First Trust S&P 500 Diversified Dividend Aristocrats ETF | 15.20% | 7.95% | 10.04% |
| S&P 500® Sector-Neutral Dividend Aristocrats Index(1) (2) | 15.84% | ||
| Nasdaq Riskalyze US Large Cap Select DividendTM Index | 18.80% | 9.61% | 11.27% |
| Nasdaq US 500 Large CapTM Index | 17.17% | 11.58% | 13.68% |
| S&P 500® Index | 17.80% | 12.06% | 13.74% |
|
(1)
|
On October 3, 2023, the Fund’s underlying index changed from the Nasdaq Riskalyze US Large Cap Select DividendTM Index to the S&P 500® Sector-Neutral Dividend Aristocrats Index. Therefore, the Fund’s performance and historical returns shown for the periods prior to this date are not necessarily indicative of the performance that the Fund, based on its current index, would have generated.
|
|
(2)
|
Performance data is not available for all the periods shown in the table for the index because performance data does not exist for some of the entire periods.
|
Visit www.ftportfolios.com/etf/KNGZ for more recent performance information.
KEY FUND STATISTICS (As of March 31, 2026)
| Fund net assets | $55,888,100 |
| Total number of portfolio holdings | 101 |
| Total advisory fee paid | $262,923 |
| Portfolio turnover rate | 46% |
WHAT DID THE FUND INVEST IN? (As of March 31, 2026)
The tables below show the investment makeup of the Fund, representing the percentage of total investments of the Fund.
Top Ten Holdings
| Verizon Communications, Inc. | 5.3% |
| Texas Instruments, Inc. | 4.1% |
| HP, Inc. | 4.1% |
| Hewlett Packard Enterprise Co. | 3.9% |
| Microchip Technology, Inc. | 3.5% |
| Comcast Corp., Class A | 3.0% |
| International Business Machines Corp. | 2.7% |
| Omnicom Group, Inc. | 2.6% |
| Corning, Inc. | 2.6% |
| Accenture PLC, Class A | 2.5% |
Sector Allocation
Top Ten Holdings
| Verizon Communications, Inc. | 5.3% |
| Texas Instruments, Inc. | 4.1% |
| HP, Inc. | 4.1% |
| Hewlett Packard Enterprise Co. | 3.9% |
| Microchip Technology, Inc. | 3.5% |
| Comcast Corp., Class A | 3.0% |
| International Business Machines Corp. | 2.7% |
| Omnicom Group, Inc. | 2.6% |
| Corning, Inc. | 2.6% |
| Accenture PLC, Class A | 2.5% |
WHAT WERE THE FUND COSTS FOR THE LAST YEAR?
(Based on a hypothetical $10,000 investment)
| Fund | Costs of a $10,000 investment | Costs paid as a percentage of a $10,000 investment |
| First Trust S-Network Streaming & Gaming ETF | $73 | 0.71%(1) |
|
(1) |
Includes extraordinary expenses. If these extraordinary expenses were not included, the expense ratio would have been 0.70%. |
HOW DID THE FUND PERFORM LAST YEAR? WHAT AFFECTED THE FUND’S PERFORMANCE?
The Fund returned 4.69% during the 12 months ended March 31, 2026. The Fund underperformed its benchmark, the MSCI ACWI Index, which returned 20.01% for the same Period.
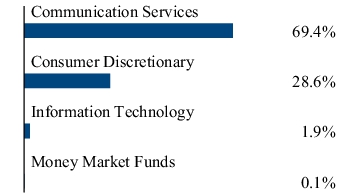
During the Period, investments in the United States received the greatest allocation of any country, with an average weight of 44.8%, and contributed 13.0% to the Fund’s overall return, the largest positive contribution of any country. Investments in Ireland contributed -2.7% to the Fund’s overall return, the largest negative contribution of any country, and held an average weight of 3.9%. The Fund’s currency exposure contributed -0.2% to the Fund’s overall return.
FUND PERFORMANCE (January 25, 2022 to March 31, 2026)
The performance line graph below shows the performance of a hypothetical $10,000 initial investment in the Fund over a ten-year period (or for the life of the Fund, if shorter). The subsequent account value as of the end of the Period is listed next to the name of the Fund or index, as applicable. The performance table below shows the average annual total returns of the Fund for the past one-, five-, and ten-year periods, as applicable (or for the life of the Fund, if shorter), as of the end of the Period. Both the line graph and performance table compare the Fund’s performance to an appropriate broad-based index and may compare to additional indices reflecting the market segment(s) in which the Fund invests over the same periods.
Investment Performance of $10,000
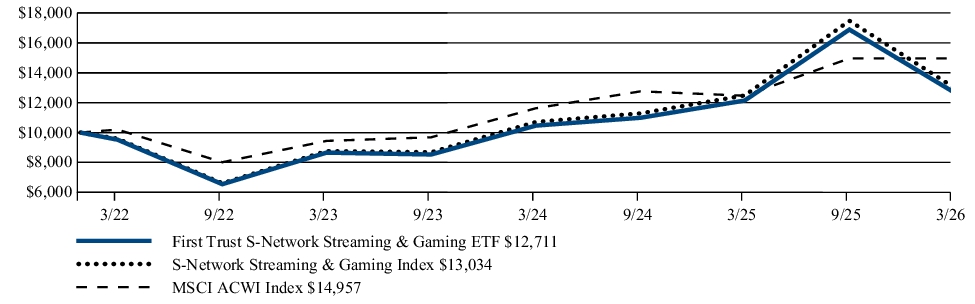
| Average Annual Total Returns (as of March 31, 2026) | 1 Year | Since Inception (1/25/22) |
| First Trust S-Network Streaming & Gaming ETF | 4.69% | 5.91% |
| S-Network Streaming & Gaming Index | 4.42% | 6.55% |
| MSCI ACWI Index | 20.01% | 10.11% |
Visit www.ftportfolios.com/etf/BNGE for more recent performance information.
KEY FUND STATISTICS (As of March 31, 2026)
| Fund net assets | $4,557,883 |
| Total number of portfolio holdings | 47 |
| Total advisory fee paid | $48,067 |
| Portfolio turnover rate | 27% |
WHAT DID THE FUND INVEST IN? (As of March 31, 2026)
The tables below show the investment makeup of the Fund, representing the percentage of total investments (excluding repurchase agreements held as collateral for securities lending arrangements) of the Fund.
Top Ten Holdings
| Netflix, Inc. | 5.9% |
| Electronic Arts, Inc. | 5.5% |
| Warner Bros. Discovery, Inc. | 5.3% |
| Nintendo Co., Ltd. | 4.9% |
| Spotify Technology S.A. | 4.8% |
| Walt Disney (The) Co. | 4.7% |
| Sony Group Corp. | 4.6% |
| NetEase, Inc. | 4.4% |
| Tencent Holdings Ltd. | 4.4% |
| Take-Two Interactive Software, Inc. | 4.3% |
Sector Allocation
Top Ten Holdings
| Netflix, Inc. | 5.9% |
| Electronic Arts, Inc. | 5.5% |
| Warner Bros. Discovery, Inc. | 5.3% |
| Nintendo Co., Ltd. | 4.9% |
| Spotify Technology S.A. | 4.8% |
| Walt Disney (The) Co. | 4.7% |
| Sony Group Corp. | 4.6% |
| NetEase, Inc. | 4.4% |
| Tencent Holdings Ltd. | 4.4% |
| Take-Two Interactive Software, Inc. | 4.3% |
WHAT WERE THE FUND COSTS FOR THE LAST YEAR?
(Based on a hypothetical $10,000 investment)
| Fund | Costs of a $10,000 investment | Costs paid as a percentage of a $10,000 investment |
| First Trust Indxx Medical Devices ETF | $69 | 0.71%(1) |
|
(1) |
Includes extraordinary expenses. If these extraordinary expenses were not included, the expense ratio would have been 0.70%. |
HOW DID THE FUND PERFORM LAST YEAR? WHAT AFFECTED THE FUND’S PERFORMANCE?
The Fund returned -5.46% during the 12 months ended March 31, 2026. The Fund underperformed its benchmark, the MSCI World Health Care Index, which returned 4.23% for the same Period.
During the Period, investments in the United States received the greatest allocation of any country, with an average weight of 58.4%, and contributed -0.6% to the Fund’s overall return. With an average weight of 2.6%, investments in China contributed 1.4% to the Fund’s overall return, the largest positive contribution of any country. Investments in Germany contributed -1.6% to the Fund’s overall return, the largest negative contribution of any country, and held an average weight of 3.7%. The Fund’s currency exposure contributed 1.4% to the Fund’s overall return.
FUND PERFORMANCE (June 22, 2021 to March 31, 2026)
The performance line graph below shows the performance of a hypothetical $10,000 initial investment in the Fund over a ten-year period (or for the life of the Fund, if shorter). The subsequent account value as of the end of the Period is listed next to the name of the Fund or index, as applicable. The performance table below shows the average annual total returns of the Fund for the past one-, five-, and ten-year periods, as applicable (or for the life of the Fund, if shorter), as of the end of the Period. Both the line graph and performance table compare the Fund’s performance to an appropriate broad-based index and may compare to additional indices reflecting the market segment(s) in which the Fund invests over the same periods.
Investment Performance of $10,000
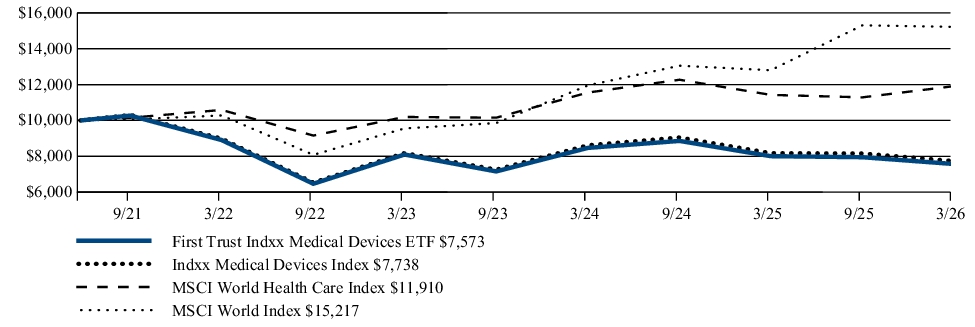
| Average Annual Total Returns (as of March 31, 2026) | 1 Year | Since Inception (6/22/21) |
| First Trust Indxx Medical Devices ETF | -5.46% | -5.66% |
| Indxx Medical Devices Index | -5.35% | -5.23% |
| MSCI World Health Care Index | 4.23% | 3.73% |
| MSCI World Index | 18.90% | 9.20% |
Visit www.ftportfolios.com/etf/MDEV for more recent performance information.
KEY FUND STATISTICS (As of March 31, 2026)
| Fund net assets | $1,905,994 |
| Total number of portfolio holdings | 50 |
| Total advisory fee paid | $14,281 |
| Portfolio turnover rate | 20% |
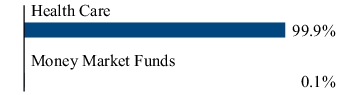
WHAT DID THE FUND INVEST IN? (As of March 31, 2026)
The tables below show the investment makeup of the Fund, representing the percentage of total investments of the Fund.
Top Ten Holdings
| Globus Medical, Inc., Class A | 3.3% |
| Align Technology, Inc. | 3.0% |
| Penumbra, Inc. | 2.7% |
| Masimo Corp. | 2.7% |
| Hoya Corp. | 2.7% |
| Hologic, Inc. | 2.4% |
| Waters Corp. | 2.4% |
| Edwards Lifesciences Corp. | 2.4% |
| Intuitive Surgical, Inc. | 2.3% |
| WuXi AppTec Co., Ltd., Class H | 2.3% |
Sector Allocation
Top Ten Holdings
| Globus Medical, Inc., Class A | 3.3% |
| Align Technology, Inc. | 3.0% |
| Penumbra, Inc. | 2.7% |
| Masimo Corp. | 2.7% |
| Hoya Corp. | 2.7% |
| Hologic, Inc. | 2.4% |
| Waters Corp. | 2.4% |
| Edwards Lifesciences Corp. | 2.4% |
| Intuitive Surgical, Inc. | 2.3% |
| WuXi AppTec Co., Ltd., Class H | 2.3% |
WHAT WERE THE FUND COSTS FOR THE LAST YEAR?
(Based on a hypothetical $10,000 investment)
| Fund | Costs of a $10,000 investment | Costs paid as a percentage of a $10,000 investment |
| First Trust Bloomberg R&D Leaders ETF | $68 | 0.61%(1) |
|
(1) |
Includes extraordinary expenses. If these extraordinary expenses were not included, the expense ratio would have been 0.60%. |
HOW DID THE FUND PERFORM LAST YEAR? WHAT AFFECTED THE FUND’S PERFORMANCE?
The Fund returned 21.52% during the 12 months ended March 31, 2026. The Fund outperformed its benchmark, the S&P 500® Index, which returned 17.80% for the same Period.
During the Period, investments in the Information Technology sector received the greatest allocation of any sector, with an average weight of 42.6%, and contributed 15.7% to the Fund’s overall return, the largest positive contribution of any sector. Investments in the Health Care sector contributed
-0.6% to the Fund’s overall return, the largest negative contribution of any sector, and held an average weight of 17.5%.
-0.6% to the Fund’s overall return, the largest negative contribution of any sector, and held an average weight of 17.5%.
FUND PERFORMANCE (April 30, 2024 to March 31, 2026)
The performance line graph below shows the performance of a hypothetical $10,000 initial investment in the Fund over a ten-year period (or for the life of the Fund, if shorter). The subsequent account value as of the end of the Period is listed next to the name of the Fund or index, as applicable. The performance table below shows the average annual total returns of the Fund for the past one-, five-, and ten-year periods, as applicable (or for the life of the Fund, if shorter), as of the end of the Period. Both the line graph and performance table compare the Fund’s performance to an appropriate broad-based index and may compare to additional indices reflecting the market segment(s) in which the Fund invests over the same periods.
Investment Performance of $10,000
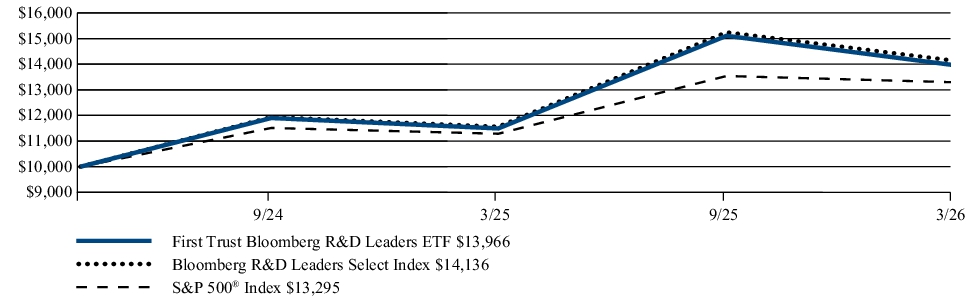
| Average Annual Total Returns (as of March 31, 2026) | 1 Year | Since Inception (4/30/24) |
| First Trust Bloomberg R&D Leaders ETF | 21.52% | 19.03% |
| Bloomberg R&D Leaders Select Index | 22.27% | 19.78% |
| S&P 500® Index | 17.80% | 16.01% |
Visit www.ftportfolios.com/etf/RND for more recent performance information.
KEY FUND STATISTICS (As of March 31, 2026)
| Fund net assets | $4,108,110 |
| Total number of portfolio holdings | 50 |
| Total advisory fee paid | $20,765 |
| Portfolio turnover rate | 46% |
WHAT DID THE FUND INVEST IN? (As of March 31, 2026)
The tables below show the investment makeup of the Fund, representing the percentage of total investments of the Fund.
Top Ten Holdings
| NVIDIA Corp. | 8.3% |
| Apple, Inc. | 8.3% |
| Alphabet, Inc., Class A | 8.2% |
| Amazon.com, Inc. | 8.0% |
| Microsoft Corp. | 6.8% |
| Netflix, Inc. | 4.6% |
| AbbVie, Inc. | 4.2% |
| Broadcom, Inc. | 4.0% |
| Meta Platforms, Inc., Class A | 3.9% |
| Eli Lilly & Co. | 3.8% |
Sector Allocation
Top Ten Holdings
| NVIDIA Corp. | 8.3% |
| Apple, Inc. | 8.3% |
| Alphabet, Inc., Class A | 8.2% |
| Amazon.com, Inc. | 8.0% |
| Microsoft Corp. | 6.8% |
| Netflix, Inc. | 4.6% |
| AbbVie, Inc. | 4.2% |
| Broadcom, Inc. | 4.0% |
| Meta Platforms, Inc., Class A | 3.9% |
| Eli Lilly & Co. | 3.8% |
WHAT WERE THE FUND COSTS FOR THE LAST YEAR?
(Based on a hypothetical $10,000 investment)
| Fund | Costs of a $10,000 investment | Costs paid as a percentage of a $10,000 investment |
| First Trust New Constructs Core Earnings Leaders ETF | $67 | 0.61%(1) |
|
(1) |
Includes extraordinary expenses. If these extraordinary expenses were not included, the expense ratio would have been 0.60%. |
HOW DID THE FUND PERFORM LAST YEAR? WHAT AFFECTED THE FUND’S PERFORMANCE?
The Fund returned 19.82% during the 12 months ended March 31, 2026. The Fund outperformed its benchmark, the S&P 500® Index, which returned 17.80% for the same Period.
During the Period, investments in the Information Technology sector received the greatest allocation of any sector, with an average weight of 34.2%, and contributed 14.7% to the Fund’s overall return, the largest positive contribution of any sector. Investments in the Financials sector contributed
-1.7% to the Fund’s overall return, the largest negative contribution of any sector, and held an average weight of 13.0%.
-1.7% to the Fund’s overall return, the largest negative contribution of any sector, and held an average weight of 13.0%.
FUND PERFORMANCE (October 2, 2024 to March 31, 2026)
The performance line graph below shows the performance of a hypothetical $10,000 initial investment in the Fund over a ten-year period (or for the life of the Fund, if shorter). The subsequent account value as of the end of the Period is listed next to the name of the Fund or index, as applicable. The performance table below shows the average annual total returns of the Fund for the past one-, five-, and ten-year periods, as applicable (or for the life of the Fund, if shorter), as of the end of the Period. Both the line graph and performance table compare the Fund’s performance to an appropriate broad-based index and may compare to additional indices reflecting the market segment(s) in which the Fund invests over the same periods.
Investment Performance of $10,000
| Average Annual Total Returns (as of March 31, 2026) | 1 Year | Since Inception (10/2/24) |
| First Trust New Constructs Core Earnings Leaders ETF | 19.82% | 12.94% |
| Bloomberg New Constructs Core Earnings Leaders Index | 20.71% | 13.70% |
| S&P 500® Index | 17.80% | 10.80% |
Visit www.ftportfolios.com/etf/FTCE for more recent performance information.
KEY FUND STATISTICS (As of March 31, 2026)
| Fund net assets | $63,855,616 |
| Total number of portfolio holdings | 101 |
| Total advisory fee paid | $307,669 |
| Portfolio turnover rate | 110% |
WHAT DID THE FUND INVEST IN? (As of March 31, 2026)
The tables below show the investment makeup of the Fund, representing the percentage of total investments of the Fund.
Top Ten Holdings
| Starbucks Corp. | 4.5% |
| NVIDIA Corp. | 4.5% |
| Meta Platforms, Inc., Class A | 4.1% |
| Eli Lilly & Co. | 4.1% |
| International Business Machines Corp. | 3.9% |
| KLA Corp. | 3.6% |
| Booking Holdings, Inc. | 3.4% |
| JPMorgan Chase & Co. | 3.4% |
| General Motors Co. | 3.1% |
| QUALCOMM, Inc. | 2.6% |
Sector Allocation
Top Ten Holdings
| Starbucks Corp. | 4.5% |
| NVIDIA Corp. | 4.5% |
| Meta Platforms, Inc., Class A | 4.1% |
| Eli Lilly & Co. | 4.1% |
| International Business Machines Corp. | 3.9% |
| KLA Corp. | 3.6% |
| Booking Holdings, Inc. | 3.4% |
| JPMorgan Chase & Co. | 3.4% |
| General Motors Co. | 3.1% |
| QUALCOMM, Inc. | 2.6% |
WHAT WERE THE FUND COSTS FOR THE LAST YEAR?
(Based on a hypothetical $10,000 investment)
| Fund | Costs of a $10,000 investment | Costs paid as a percentage of a $10,000 investment |
| First Trust Balanced Income ETF | $22(1) (2) | 0.25%(1) (3) |
|
(1) |
Excludes any Acquired Fund Fees and Expenses of the underlying investment companies in which the Fund invests. |
|
(2) |
The Fund commenced investment operations on May 28, 2025. Had the Fund been in operation for a complete fiscal year, the cost of a $10,000 investment would have been higher. |
|
(3) |
Annualized. |
HOW DID THE FUND PERFORM LAST YEAR? WHAT AFFECTED THE FUND’S PERFORMANCE?
The Fund’s inception date was May 28, 2025. The Fund returned 11.34% since its inception through March 31, 2026. The Fund underperformed its benchmark, the S&P 500® Index, which returned 12.03% for the same Period.
During the Period, the Fund allocated investments across 14 ETFs. FTHI received the greatest allocation in the Fund, with an average weight of 19.8%, and contributed 2.3% to the Fund’s overall return, the largest positive contribution of any investment. No single investment represented a negative contribution to the Fund’s overall return.
Investments in the Information Technology sector received the greatest allocation of any sector, with an average weight of 21.5%, and contributed 4.0% to the Fund’s overall return, the largest positive contribution of any sector. No sector made a negative contribution to the Fund’s overall return.
FUND PERFORMANCE (May 28, 2025 to March 31, 2026)
The performance line graph below shows the performance of a hypothetical $10,000 initial investment in the Fund over a ten-year period (or for the life of the Fund, if shorter). The subsequent account value as of the end of the Period is listed next to the name of the Fund or index, as applicable. The performance table below shows the average annual total returns of the Fund for the past one-, five-, and ten-year periods, as applicable (or for the life of the Fund, if shorter), as of the end of the Period. Both the line graph and performance table compare the Fund’s performance to an appropriate broad-based index and may compare to additional indices reflecting the market segment(s) in which the Fund invests over the same periods.
Investment Performance of $10,000
| Average Annual Total Returns (as of March 31, 2026) | Since Inception (5/28/25) |
| First Trust Balanced Income ETF | 11.34% |
| S&P 500® Index | 12.03% |
| Bloomberg Moderate Allocation Income Focus Index | 11.64% |
| Bloomberg US Aggregate Bond Index | 5.25% |
Visit www.ftportfolios.com/etf/FTBI for more recent performance information.
KEY FUND STATISTICS (As of March 31, 2026)
| Fund net assets | $18,766,819 |
| Total number of portfolio holdings | 14 |
| Total advisory fee paid | $23,294 |
| Portfolio turnover rate | 5% |
WHAT DID THE FUND INVEST IN? (As of March 31, 2026)
The table below shows the investment makeup of the Fund, representing the percentage of total investments of the Fund.
Top Ten Holdings
| First Trust BuyWrite Income ETF | 19.8% |
| First Trust Nasdaq BuyWrite Income ETF | 9.8% |
| FT Vest Technology Dividend Target Income ETF | 9.8% |
| First Trust Core Investment Grade ETF | 7.1% |
| First Trust Smith Opportunistic Fixed Income ETF | 7.0% |
| FT Vest SMID Rising Dividend Achievers Target Income ETF | 6.8% |
| FT Vest S&P 500® Dividend Aristocrats Target Income ETF® | 6.7% |
| FT Vest Rising Dividend Achievers Target Income ETF | 6.6% |
| FT Vest Gold Strategy Target Income ETF® | 5.2% |
| First Trust Limited Duration Investment Grade Corporate ETF | 4.4% |
| [1] | Includes extraordinary expenses. If these extraordinary expenses were not included, the expense ratio would have been 0.60%. |
| [2] | Includes extraordinary expenses. If these extraordinary expenses were not included, the expense ratio would have been 0.60%. |
| [3] | Includes extraordinary expenses. If these extraordinary expenses were not included, the expense ratio would have been 0.60%. |
| [4] | Includes extraordinary expenses. If these extraordinary expenses were not included, the expense ratio would have been 0.60%. |
| [5] | Includes extraordinary expenses. If these extraordinary expenses were not included, the expense ratio would have been 0.60%. |
| [6] | Includes extraordinary expenses. If these extraordinary expenses were not included, the expense ratio would have been 0.75%. |
| [7] | Includes extraordinary expenses. If these extraordinary expenses were not included, the expense ratio would have been 0.60%. |
| [8] | Includes extraordinary expenses. If these extraordinary expenses were not included, the expense ratio would have been 0.60%. |
| [9] | Excludes any Acquired Fund Fees and Expenses of the underlying investment companies in which the Fund invests. |
| [10] | Includes extraordinary expenses. If these extraordinary expenses were not included, the expense ratio would have been 0.60%. |
| [11] | Includes extraordinary expenses. If these extraordinary expenses were not included, the expense ratio would have been 0.50%. |
| [12] | Includes extraordinary expenses. If these extraordinary expenses were not included, the expense ratio would have been 0.70%. |
| [13] | Includes extraordinary expenses. If these extraordinary expenses were not included, the expense ratio would have been 0.70%. |
| [14] | Includes extraordinary expenses. If these extraordinary expenses were not included, the expense ratio would have been 0.60%. |
| [15] | Includes extraordinary expenses. If these extraordinary expenses were not included, the expense ratio would have been 0.60%. |
| [16] | Excludes any Acquired Fund Fees and Expenses of the underlying investment companies in which the Fund invests. |
| [17] | The Fund commenced investment operations on May 28, 2025. Had the Fund been in operation for a complete fiscal year, the cost of a $10,000 investment would have been higher. |
| [18] | Annualized. |