Shareholder Report |
12 Months Ended | ||||||||||||||||||||||||||||||||||||||||||||||||||||
|---|---|---|---|---|---|---|---|---|---|---|---|---|---|---|---|---|---|---|---|---|---|---|---|---|---|---|---|---|---|---|---|---|---|---|---|---|---|---|---|---|---|---|---|---|---|---|---|---|---|---|---|---|---|
|
Mar. 31, 2026
USD ($)
$ / shares
| |||||||||||||||||||||||||||||||||||||||||||||||||||||
| Shareholder Report [Line Items] | |||||||||||||||||||||||||||||||||||||||||||||||||||||
| Document Type | N-CSR | ||||||||||||||||||||||||||||||||||||||||||||||||||||
| Amendment Flag | false | ||||||||||||||||||||||||||||||||||||||||||||||||||||
| Registrant Name | Manager Directed Portfolios | ||||||||||||||||||||||||||||||||||||||||||||||||||||
| Entity Central Index Key | 0001359057 | ||||||||||||||||||||||||||||||||||||||||||||||||||||
| Entity Investment Company Type | N-1A | ||||||||||||||||||||||||||||||||||||||||||||||||||||
| Document Period End Date | Mar. 31, 2026 | ||||||||||||||||||||||||||||||||||||||||||||||||||||
| Shareholder Report Annual or Semi-Annual | annual shareholder report | ||||||||||||||||||||||||||||||||||||||||||||||||||||
| Pemberwick Fund | |||||||||||||||||||||||||||||||||||||||||||||||||||||
| Shareholder Report [Line Items] | |||||||||||||||||||||||||||||||||||||||||||||||||||||
| Fund Name | Pemberwick Fund | ||||||||||||||||||||||||||||||||||||||||||||||||||||
| Class Name | Pemberwick Fund | ||||||||||||||||||||||||||||||||||||||||||||||||||||
| No Trading Symbol | true | ||||||||||||||||||||||||||||||||||||||||||||||||||||
| Annual or Semi-Annual Statement [Text Block] | This annual shareholder report contains important information about the Pemberwick Fund (the “Fund”) for the period of April 1, 2025, to March 31, 2026. | ||||||||||||||||||||||||||||||||||||||||||||||||||||
| Additional Information [Text Block] | You can find additional information about the Fund at https://pemberwickfund.com/. You can also request this information by contacting us at 1-888-893-4491. | ||||||||||||||||||||||||||||||||||||||||||||||||||||
| Additional Information Phone Number | 1-888-893-4491 | ||||||||||||||||||||||||||||||||||||||||||||||||||||
| Additional Information Website | https://pemberwickfund.com/ | ||||||||||||||||||||||||||||||||||||||||||||||||||||
| Expenses [Text Block] | WHAT WERE THE FUND COSTS FOR THE PAST YEAR? (based on a hypothetical $10,000 investment)
|
||||||||||||||||||||||||||||||||||||||||||||||||||||
| Expenses Paid, Amount | $ 40 | ||||||||||||||||||||||||||||||||||||||||||||||||||||
| Expense Ratio, Percent | 0.39% | ||||||||||||||||||||||||||||||||||||||||||||||||||||
| Factors Affecting Performance [Text Block] | HOW DID THE FUND PERFORM LAST YEAR AND WHAT AFFECTED ITS PERFORMANCE? For the fiscal year ended March 31, 2026, the Fund generated a total investment return of 4.00% net of expenses compared to the Bloomberg U.S. Aggregate Bond Index return of 4.35% (which excludes expenses). Yields on the 2-Year Treasury were relatively flat for the year, resulting in the Fund’s net asset value (“NAV”) remaining flat, at $9.96 per share. POSITIONING The Fund continues to be invested primarily in investment grade floating rate bonds issued by financial institutions with assets greater than $250 billion (currently 55.3% of the Fund’s net assets). The Fund’s strategy is to purchase these floating rate bonds with shorter duration, not exceeding two years, picking up additional yield from the financial sector without taking any more risk in our opinion and tracking the Fed’s current interest rate position.
|
||||||||||||||||||||||||||||||||||||||||||||||||||||
| Performance Past Does Not Indicate Future [Text] | The Fund’s past performance is not a good predictor of how the Fund will perform in the future. | ||||||||||||||||||||||||||||||||||||||||||||||||||||
| Line Graph [Table Text Block] | ![]() |
||||||||||||||||||||||||||||||||||||||||||||||||||||
| Average Annual Return [Table Text Block] | 
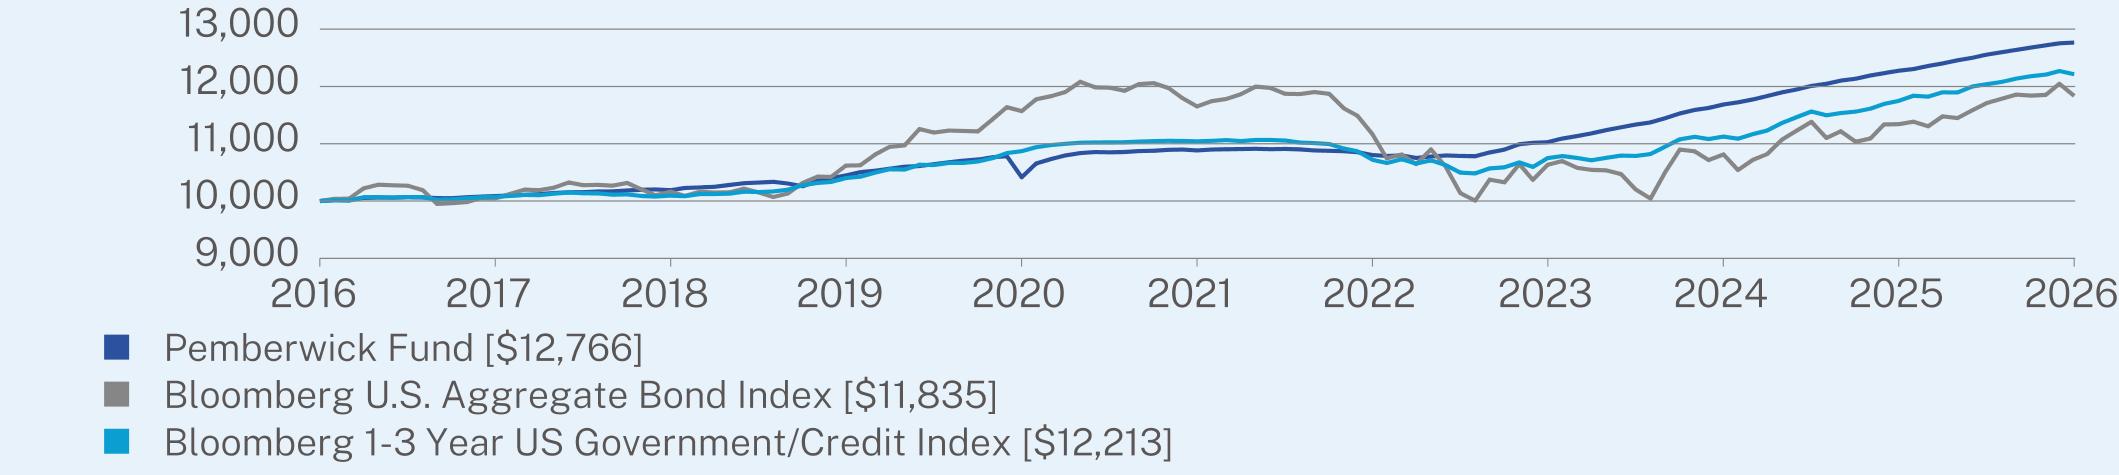
ANNUAL AVERAGE TOTAL RETURN (%)
|
||||||||||||||||||||||||||||||||||||||||||||||||||||
| No Deduction of Taxes [Text Block] | The graph and table do not reflect the deduction of taxes that a shareholder would pay on Fund distributions or redemption of Fund shares. | ||||||||||||||||||||||||||||||||||||||||||||||||||||
| Updated Performance Information Location [Text Block] | Visit https://pemberwickfund.com/ for more recent performance information.
|
||||||||||||||||||||||||||||||||||||||||||||||||||||
| Net Assets | $ 184,602,452 | ||||||||||||||||||||||||||||||||||||||||||||||||||||
| Holdings Count | $ / shares | 158 | ||||||||||||||||||||||||||||||||||||||||||||||||||||
| Advisory Fees Paid, Amount | $ 298,205 | ||||||||||||||||||||||||||||||||||||||||||||||||||||
| Investment Company Portfolio Turnover | 50.00% | ||||||||||||||||||||||||||||||||||||||||||||||||||||
| Additional Fund Statistics [Text Block] | KEY FUND STATISTICS (as of March 31, 2026)
|
||||||||||||||||||||||||||||||||||||||||||||||||||||
| Holdings [Text Block] | WHAT DID THE FUND INVEST IN? (as of March 31, 2026)
|
||||||||||||||||||||||||||||||||||||||||||||||||||||
| Updated Prospectus Web Address | https://pemberwickfund.com/ |