Pay vs Performance Disclosure - USD ($)
Apr. 30, 2025
Feb. 28, 2026
Feb. 28, 2026
Feb. 22, 2025
Feb. 24, 2024
Feb. 25, 2023
Feb. 26, 2022
Pay Versus Performance Disclosure
Pay Versus Performance Table
As required by Section 953(a) of the Dodd-Frank Wall Street Reform and Consumer Protection Act of 2010 and Item 402(v) of Regulation S-K, we are providing the following information regarding the relationship between “compensation actually paid” (“CAP”) to our principal executive officer (“PEO”) and Non-PEO NEOs and certain financial performance metrics of the Company for the fiscal years listed below.
This disclosure has been prepared in accordance with Item 402(v) and does not necessarily reflect the value realized by our NEOs or how the Compensation Committee evaluates compensation decisions in light of Company or individual performance. Specifically, the Compensation Committee does not use CAP as a basis for making compensation decisions. Please refer to our CD&A for a discussion of our executive compensation program objectives and how we design our program to align executive compensation with Company performance.
Year | Summary Compensation Table Total for Former PEO ($) | Compensation Actually Paid To Former PEO ($) | Summary Compensation Table Total for Current PEO ($) | Compensation Actually Paid to Current PEO ($) | Average Summary Compensation Table Total for Non-PEO Named Executive Officers ($) | Average Compensation Actually Paid to Non-PEO Named Executive Officers ($) | Value of Initial Fixed $100 Investment Based on: | Net Income ($) (in millions) | Adjusted EBITDA (in millions) | |||||||||||||||||||||||
Total Stockholder Return ($) | Peer Group Total Stockholder Return ($) | |||||||||||||||||||||||||||||||
(a) | (b) | (c) | (d) | (e) | (f) | (g) | (h) | (i) | (j) | (k) | ||||||||||||||||||||||
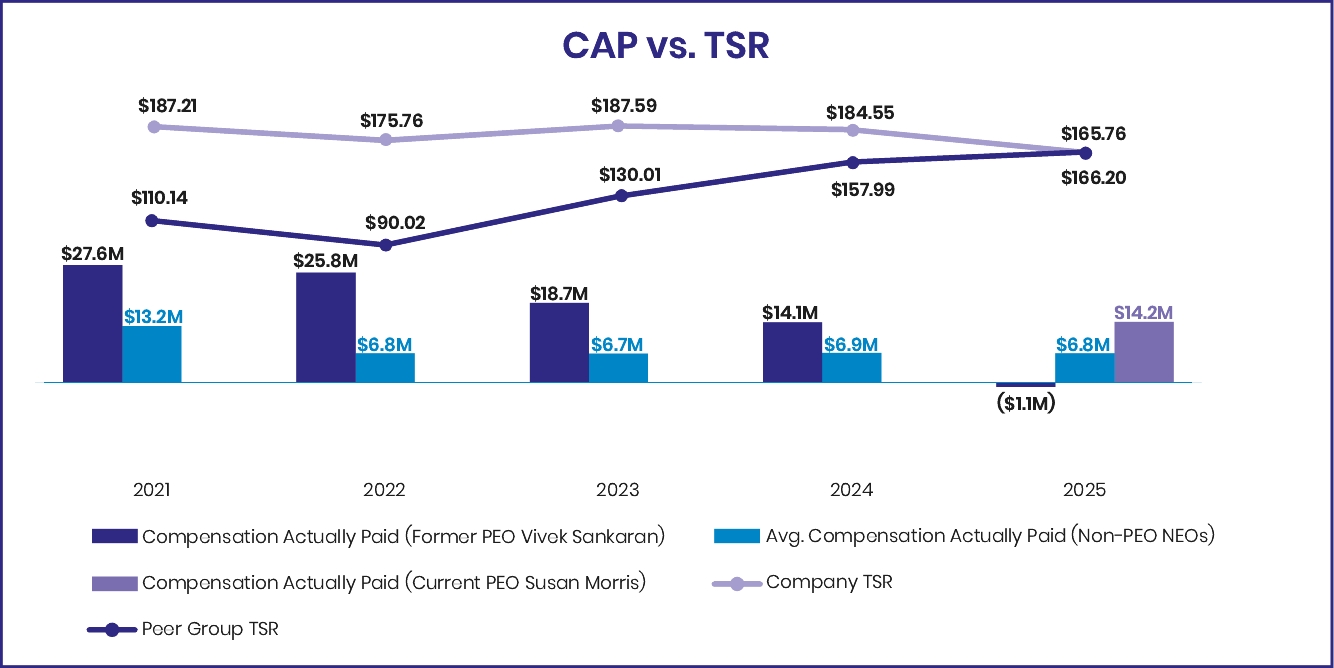
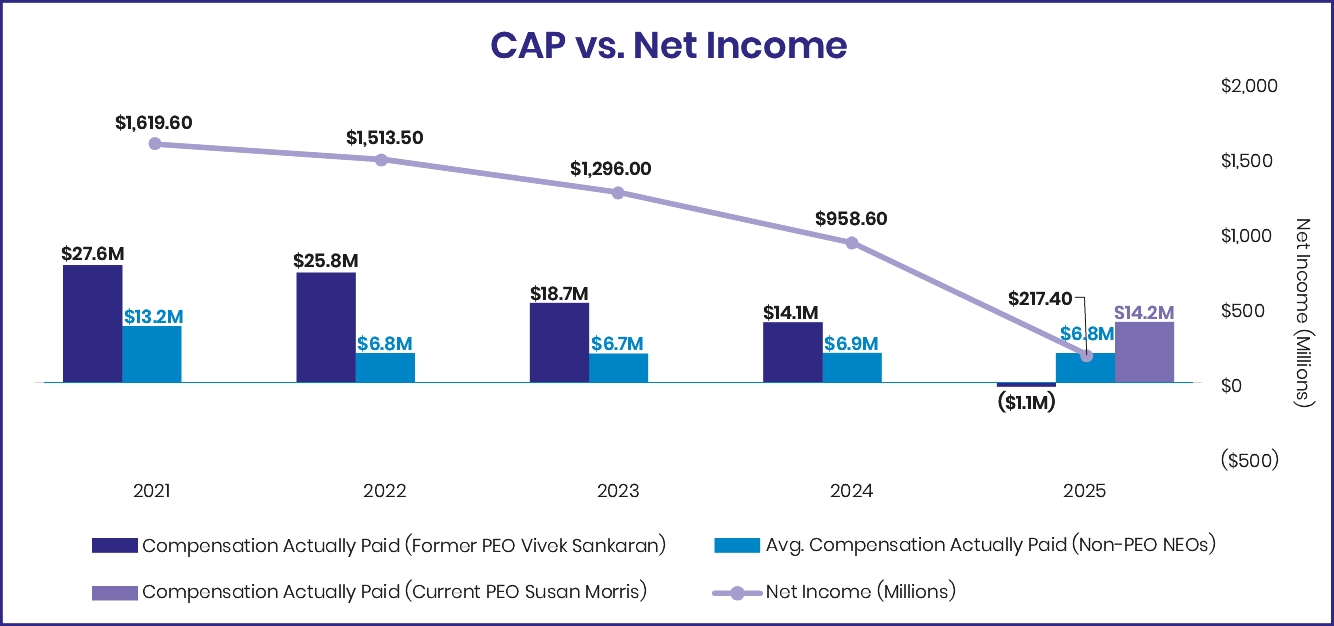
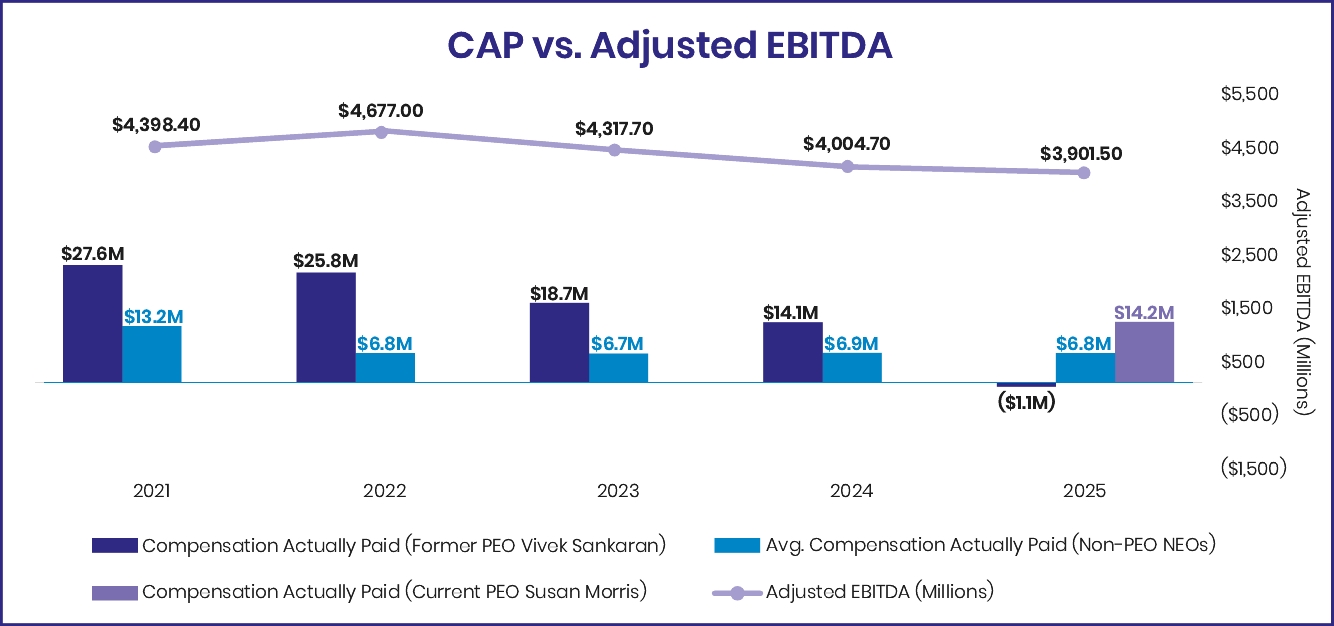
2025 | $546,277 | $(1,092,318) | $16,767,866 | $14,224,406 | $9,377,778 | $6,824,835 | $165.76 | $166.20 | $217.4 | $3,901.5 | ||||||||||||||||||||||
2024 | $15,240,511 | $14,145,124 | $7,210,412 | $6,917,207 | $184.55 | $157.99 | $958.6 | $4,004.7 | ||||||||||||||||||||||||
2023 | $15,125,283 | $18,654,872 | $5,536,823 | $6,712,983 | $187.59 | $130.01 | $1,296.0 | $4,317.7 | ||||||||||||||||||||||||
2022 | $16,103,130 | $25,769,696 | $6,058,219 | $6,794,406 | $175.76 | $90.02 | $1,513.5 | $4,677.0 | ||||||||||||||||||||||||
2021 | $8,639,520 | $27,635,047 | $6,999,472 | $13,173,472 | $187.21 | $110.14 | $1,619.6 | $4,398.4 | ||||||||||||||||||||||||
(b) | Reflects compensation amounts reported in the Summary Compensation Table for our Former PEO, Vivek Sankaran, for the respective fiscal years shown in column (a). |
(c) | Reflects CAP to our Former PEO in each of fiscal 2025, 2024, 2023, 2022, and 2021 adjusted as set forth in the table below, as determined in accordance with the SEC rules. For awards with dividend rights, these amounts are paid in cash or Company shares once the underlying award vests and are incorporated as applicable in the table below. |
PEO | 2021 | 2022 | 2023 | 2024 | 2025 | ||||||||||||
Summary Compensation Table Total | $8,639,520 | $16,103,130 | $15,125,283 | $15,240,511 | $546,277 | ||||||||||||
- Grant Date Fair Value of Stock Awards Granted in Fiscal Year | $— | $(9,499,985) | $(10,500,020) | $(11,499,997) | $— | ||||||||||||
+ Fair Value at Fiscal Year-End of Outstanding and Unvested Stock Awards Granted in Fiscal Year | $— | $6,617,534 | $9,876,672 | $9,321,127 | $— | ||||||||||||
+ Change in Fair Value of Outstanding and Unvested Stock Awards Granted in Prior Fiscal Years | $13,121,698 | $(3,951,035) | $531,887 | $(572,359) | $(791,749) | ||||||||||||
+ Fair Value at Vesting of Stock Awards Granted in Fiscal Year That Vested During Fiscal Year | $— | $1,115,650 | $1,954,170 | $1,963,491 | $— | ||||||||||||
+ Change in Fair Value as of Vesting Date of Stock Awards Granted in Prior Fiscal Years for Which Applicable Vesting Conditions Were Satisfied During Fiscal Year | $5,021,645 | $(1,100,738) | $97,692 | $(653,760) | $(1,121,549) | ||||||||||||
- Fair Value as of Prior Fiscal Year-End of Stock Awards Granted in Prior Fiscal Years That Failed to Meet Applicable Vesting Conditions During Fiscal Year | $— | $— | $— | $— | $— | ||||||||||||
+ Value of Dividends or Other Earnings Paid on Stock Awards in the Fiscal Year That Are Not Included in the Total Compensation for the Fiscal Year | $852,184 | $16,485,140 | $1,569,189 | $346,110 | $274,703 | ||||||||||||
Compensation Actually Paid Total | $27,635,047 | $25,769,696 | $18,654,872 | $14,145,124 | $(1,092,318) | ||||||||||||
(d) | Reflects compensation amounts reported in the Summary Compensation Table for our current PEO, Susan Morris, for the respective fiscal years shown in column (a). |
(e) | Reflects CAP to our current PEO in each of fiscal 2025 adjusted as set forth in the table below, as determined in accordance with the SEC rules. For awards with dividend rights, these amounts are paid in cash or Company shares once the underlying award vests and are incorporated as applicable in the table below. |
PEO | 2025 | ||||
Summary Compensation Table Total | $16,767,866 | ||||
- Grant Date Fair Value of Stock Awards Granted in Fiscal Year | $(11,010,009) | ||||
+ Fair Value at Fiscal Year-End of Outstanding and Unvested Stock Awards Granted in Fiscal Year | $7,460,221 | ||||
+ Change in Fair Value of Outstanding and Unvested Stock Awards Granted in Prior Fiscal Years | $(306,436) | ||||
+ Fair Value at Vesting of Stock Awards Granted in Fiscal Year That Vested During Fiscal Year | $1,513,522 | ||||
+ Change in Fair Value as of Vesting Date of Stock Awards Granted in Prior Fiscal Years for Which Applicable Vesting Conditions Were Satisfied During Fiscal Year | $(452,594) | ||||
- Fair Value as of Prior Fiscal Year-End of Stock Awards Granted in Prior Fiscal Years That Failed to Meet Applicable Vesting Conditions During Fiscal Year | $— | ||||
+ Value of Dividends or Other Earnings Paid on Stock Awards in the Fiscal Year That Are Not Included in the Total Compensation for the Fiscal Year | $251,836 | ||||
Compensation Actually Paid Total | $14,224,406 | ||||
(f) | Average of summary compensation paid to non-PEO NEOs during fiscal 2025, 2024, 2023, 2022, and 2021. Average taken across the non-PEO NEOs as follows: |
2025: Sharon McCollam, Thomas Moriarty, Anuj Dhanda, and Jen Saenz
2024: Sharon McCollam, Susan Morris, Thomas Moriarty, and Omer Gajial
2023: Sharon McCollam, Susan Morris, Thomas Moriarty, and Anuj Dhanda
2022: Sharon McCollam, Susan Morris, Juliette Pryor, and Anuj Dhanda
2021: Sharon McCollam, Robert Dimond, Anuj Dhanda, Susan Morris, and Christine Rupp
(g) | Reflects average CAP to non-PEO NEOs in each of fiscal 2025, 2024, 2023, 2022, and 2021, adjusted as set forth in the table below, as determined in accordance with the SEC rules. For awards with dividend rights, these amounts are paid in cash or shares of our Common Stock once the underlying award vests and are incorporated as applicable in the table below. |
NON-PEO NEOs | 2021 Average | 2022 Average | 2023 Average | 2024 Average | 2025 Average | ||||||||||||
Summary Compensation Table Total | $6,999,472 | $6,058,219 | $5,536,823 | $7,210,412 | $9,377,778 | ||||||||||||
- Grant Date Fair Value of Stock Awards Granted in Fiscal Year | $(3,625,000) | $(3,125,012) | $(3,762,496) | $(3,781,250) | $(6,237,499) | ||||||||||||
+ Fair Value at Fiscal Year-End of Outstanding and Unvested Stock Awards Granted in Fiscal Year | $4,543,324 | $2,176,832 | $3,437,323 | $3,051,841 | $3,847,675 | ||||||||||||
+ Change in Fair Value of Outstanding and Unvested Stock Awards Granted in Prior Fiscal Years | $2,200,072 | $(1,030,267) | $149,369 | $(194,602) | $(182,161) | ||||||||||||
+ Fair Value at Vesting of Stock Awards Granted in Fiscal Year That Vested During Fiscal Year | $810,529 | $410,153 | $680,104 | $657,230 | $562,995 | ||||||||||||
+ Change in Fair Value as of Vesting Date of Stock Awards Granted in Prior Fiscal Years for Which Applicable Vesting Conditions Were Satisfied During Fiscal Year | $2,740,644 | $(841,677) | $190,338 | $(138,267) | $(324,413) | ||||||||||||
- Fair Value as of Prior Fiscal Year-End of Stock Awards Granted in Prior Fiscal Years That Failed to Meet Applicable Vesting Conditions During Fiscal Year | $(521,955) | $— | $— | $— | $(379,875) | ||||||||||||
+ Value of Dividends or Other Earnings Paid on Stock Awards in the Fiscal Year That Are Not Included in the Total Compensation for the Fiscal Year | $26,386 | $3,146,158 | $481,522 | $111,844 | $160,333 | ||||||||||||
Compensation Actually Paid Total | $13,173,472 | $6,794,406 | $6,712,983 | $6,917,207 | $6,824,835 | ||||||||||||
(h) | For the relevant fiscal year, represents the cumulative total stockholder return (“TSR”) of the Company for the measurement periods ending on February 28, 2026, February 22, 2025, February 24, 2024, February 25, 2023, and February 26, 2022, respectively. |
(i) | Represents the total cumulative stockholder return of S&P 500 Retail Index (“Peer Group TSR”) for the measurement periods ending on February 28, 2026, February 22, 2025, February 24, 2024, February 25, 2023, and February 26, 2022, respectively. |
(j) | Reflects “Net Income” as reported in the company’s Consolidated Income Statements included in the Company’s Annual Reports on Form 10-K for each of the years ended February 28, 2026, February 22, 2025, February 24, 2024, February 25, 2023, and February 26, 2022, respectively. |
(k) | Company Selected Measure is Adjusted EBITDA which is described on page 78. |
(b) | Reflects compensation amounts reported in the Summary Compensation Table for our Former PEO, Vivek Sankaran, for the respective fiscal years shown in column (a). |
(d) | Reflects compensation amounts reported in the Summary Compensation Table for our current PEO, Susan Morris, for the respective fiscal years shown in column (a). |
(f) | Average of summary compensation paid to non-PEO NEOs during fiscal 2025, 2024, 2023, 2022, and 2021. Average taken across the non-PEO NEOs as follows: |
2025: Sharon McCollam, Thomas Moriarty, Anuj Dhanda, and Jen Saenz
2024: Sharon McCollam, Susan Morris, Thomas Moriarty, and Omer Gajial
2023: Sharon McCollam, Susan Morris, Thomas Moriarty, and Anuj Dhanda
2022: Sharon McCollam, Susan Morris, Juliette Pryor, and Anuj Dhanda
2021: Sharon McCollam, Robert Dimond, Anuj Dhanda, Susan Morris, and Christine Rupp
(i) | Represents the total cumulative stockholder return of S&P 500 Retail Index (“Peer Group TSR”) for the measurement periods ending on February 28, 2026, February 22, 2025, February 24, 2024, February 25, 2023, and February 26, 2022, respectively. |
(c) | Reflects CAP to our Former PEO in each of fiscal 2025, 2024, 2023, 2022, and 2021 adjusted as set forth in the table below, as determined in accordance with the SEC rules. For awards with dividend rights, these amounts are paid in cash or Company shares once the underlying award vests and are incorporated as applicable in the table below. |
PEO | 2021 | 2022 | 2023 | 2024 | 2025 | ||||||||||||
Summary Compensation Table Total | $8,639,520 | $16,103,130 | $15,125,283 | $15,240,511 | $546,277 | ||||||||||||
- Grant Date Fair Value of Stock Awards Granted in Fiscal Year | $— | $(9,499,985) | $(10,500,020) | $(11,499,997) | $— | ||||||||||||
+ Fair Value at Fiscal Year-End of Outstanding and Unvested Stock Awards Granted in Fiscal Year | $— | $6,617,534 | $9,876,672 | $9,321,127 | $— | ||||||||||||
+ Change in Fair Value of Outstanding and Unvested Stock Awards Granted in Prior Fiscal Years | $13,121,698 | $(3,951,035) | $531,887 | $(572,359) | $(791,749) | ||||||||||||
+ Fair Value at Vesting of Stock Awards Granted in Fiscal Year That Vested During Fiscal Year | $— | $1,115,650 | $1,954,170 | $1,963,491 | $— | ||||||||||||
+ Change in Fair Value as of Vesting Date of Stock Awards Granted in Prior Fiscal Years for Which Applicable Vesting Conditions Were Satisfied During Fiscal Year | $5,021,645 | $(1,100,738) | $97,692 | $(653,760) | $(1,121,549) | ||||||||||||
- Fair Value as of Prior Fiscal Year-End of Stock Awards Granted in Prior Fiscal Years That Failed to Meet Applicable Vesting Conditions During Fiscal Year | $— | $— | $— | $— | $— | ||||||||||||
+ Value of Dividends or Other Earnings Paid on Stock Awards in the Fiscal Year That Are Not Included in the Total Compensation for the Fiscal Year | $852,184 | $16,485,140 | $1,569,189 | $346,110 | $274,703 | ||||||||||||
Compensation Actually Paid Total | $27,635,047 | $25,769,696 | $18,654,872 | $14,145,124 | $(1,092,318) | ||||||||||||
(e) | Reflects CAP to our current PEO in each of fiscal 2025 adjusted as set forth in the table below, as determined in accordance with the SEC rules. For awards with dividend rights, these amounts are paid in cash or Company shares once the underlying award vests and are incorporated as applicable in the table below. |
PEO | 2025 | ||||
Summary Compensation Table Total | $16,767,866 | ||||
- Grant Date Fair Value of Stock Awards Granted in Fiscal Year | $(11,010,009) | ||||
+ Fair Value at Fiscal Year-End of Outstanding and Unvested Stock Awards Granted in Fiscal Year | $7,460,221 | ||||
+ Change in Fair Value of Outstanding and Unvested Stock Awards Granted in Prior Fiscal Years | $(306,436) | ||||
+ Fair Value at Vesting of Stock Awards Granted in Fiscal Year That Vested During Fiscal Year | $1,513,522 | ||||
+ Change in Fair Value as of Vesting Date of Stock Awards Granted in Prior Fiscal Years for Which Applicable Vesting Conditions Were Satisfied During Fiscal Year | $(452,594) | ||||
- Fair Value as of Prior Fiscal Year-End of Stock Awards Granted in Prior Fiscal Years That Failed to Meet Applicable Vesting Conditions During Fiscal Year | $— | ||||
+ Value of Dividends or Other Earnings Paid on Stock Awards in the Fiscal Year That Are Not Included in the Total Compensation for the Fiscal Year | $251,836 | ||||
Compensation Actually Paid Total | $14,224,406 | ||||
(g) | Reflects average CAP to non-PEO NEOs in each of fiscal 2025, 2024, 2023, 2022, and 2021, adjusted as set forth in the table below, as determined in accordance with the SEC rules. For awards with dividend rights, these amounts are paid in cash or shares of our Common Stock once the underlying award vests and are incorporated as applicable in the table below. |
NON-PEO NEOs | 2021 Average | 2022 Average | 2023 Average | 2024 Average | 2025 Average | ||||||||||||
Summary Compensation Table Total | $6,999,472 | $6,058,219 | $5,536,823 | $7,210,412 | $9,377,778 | ||||||||||||
- Grant Date Fair Value of Stock Awards Granted in Fiscal Year | $(3,625,000) | $(3,125,012) | $(3,762,496) | $(3,781,250) | $(6,237,499) | ||||||||||||
+ Fair Value at Fiscal Year-End of Outstanding and Unvested Stock Awards Granted in Fiscal Year | $4,543,324 | $2,176,832 | $3,437,323 | $3,051,841 | $3,847,675 | ||||||||||||
+ Change in Fair Value of Outstanding and Unvested Stock Awards Granted in Prior Fiscal Years | $2,200,072 | $(1,030,267) | $149,369 | $(194,602) | $(182,161) | ||||||||||||
+ Fair Value at Vesting of Stock Awards Granted in Fiscal Year That Vested During Fiscal Year | $810,529 | $410,153 | $680,104 | $657,230 | $562,995 | ||||||||||||
+ Change in Fair Value as of Vesting Date of Stock Awards Granted in Prior Fiscal Years for Which Applicable Vesting Conditions Were Satisfied During Fiscal Year | $2,740,644 | $(841,677) | $190,338 | $(138,267) | $(324,413) | ||||||||||||
- Fair Value as of Prior Fiscal Year-End of Stock Awards Granted in Prior Fiscal Years That Failed to Meet Applicable Vesting Conditions During Fiscal Year | $(521,955) | $— | $— | $— | $(379,875) | ||||||||||||
+ Value of Dividends or Other Earnings Paid on Stock Awards in the Fiscal Year That Are Not Included in the Total Compensation for the Fiscal Year | $26,386 | $3,146,158 | $481,522 | $111,844 | $160,333 | ||||||||||||
Compensation Actually Paid Total | $13,173,472 | $6,794,406 | $6,712,983 | $6,917,207 | $6,824,835 | ||||||||||||
Most Important Financial Performance Measures
The following financial performance measures represent, in the Company’s assessment, the most important financial measures the Company used to link compensation that we actually paid to our NEOs in fiscal 2025 as further described in our CD&A.
Measure | Nature | Explanation | ||||||
Adjusted EBITDA | Financial | Adjusted EBITDA was the primary financial metric of our fiscal 2025 annual incentive plan, and we consider it to be an important indicator of our overall business performance. Adjusted EBITDA is calculated as GAAP earnings (net loss) before interest, income taxes, depreciation and amortization, further adjusted to eliminate the effects of items management does not consider in assessing our ongoing core performance. | ||||||
Identical Sales (“ID Sales”) | Financial | ID Sales include stores operating during the same period in both the current year and the prior year, comparing sales on a daily basis. Direct to consumer digital sales are included in identical sales, and fuel sales are excluded from identical sales. Acquired stores become identical on the one-year anniversary date of the acquisition. | ||||||
Adjusted EPS | Financial | Adjusted EPS is calculated as Adjusted net income divided by the weighted average diluted Class A common shares outstanding, as adjusted to reflect all restricted stock units and awards outstanding at the end of the period, as well as the conversion of Convertible Preferred Stock when it is antidilutive for GAAP. We define Adjusted net income as GAAP net income adjusted to eliminate the effects of items management does not consider in assessing our ongoing core performance. | ||||||
ROIC | Financial | ROIC is calculated as Adjusted ROIC operating income divided by average invested capital. Adjusted ROIC operating income is calculated using GAAP operating income and adding back certain items considered non-core or not applicable to the analysis of our returns. Specifically, Adjusted ROIC operating income adds back depreciation and amortization expense, rent expense, LIFO expense (income), (gains) loss on the sale of assets, and other items that management does not consider in assessing our ongoing core operating income performance. Average Invested Capital is calculated as the sum of (1) the average of our total assets, (2) the average LIFO reserve, and (3) the average accumulated depreciation and amortization; minus (1) the average taxes receivable, (2) the average trade accounts payable, (3) the average accrued salaries and wages, (4) the average non-operating investments and (5) the average other current liabilities, excluding accrued income taxes. Averages are calculated for ROIC by adding the beginning balance of the first quarter and the ending balance of the fourth quarter and dividing by two. | ||||||