Pay vs Performance Disclosure - USD ($)
|
12 Months Ended |
Feb. 28, 2026 |
Feb. 28, 2025 |
Feb. 29, 2024 |
Feb. 28, 2023 |
Feb. 28, 2022 |
| Pay vs Performance Disclosure |
|
|
|
|
|
| Pay vs Performance Disclosure, Table |
| | | | | | | | | | | | | | | | | | | | | | | | | | | | | | | | Value of Initial $100 Investment Based On: | | | | Fiscal Year | Summary Compensation Table Total for PEO | Compensation Actually Paid to PEO (5)(6) | Average Summary Compensation Table Total for Non-PEO NEOs | Average Compensation Actually Paid to Non-PEO NEOs (6)(7) | Total Shareholder Return (8) | Peer Group Total Shareholder Return (9) | Net Income (Loss) (in millions) (10) | Net Sales (in millions) (11) | 2026 (1) | $ | 14,209,126 | $ | 10,903,642 | $ | 4,005,952 | $ | 3,329,617 | $ | 80.28 | $ | 166.86 | $ | 1,756.8 | $ | 9,139.0 | 2025 (1) | $ | 15,006,800 | $ | (853,514) | $ | 3,433,714 | $ | 413,253 | $ | 86.97 | $ | 143.82 | $ | (31.1) | $ | 10,208.7 | 2024 (2) | $ | 14,629,014 | $ | 19,419,251 | $ | 5,257,024 | $ | 6,461,318 | $ | 120.92 | $ | 126.43 | $ | 1,765.2 | $ | 9,961.8 | 2023 (3) | $ | 16,068,340 | $ | 15,728,089 | $ | 10,422,191 | $ | 10,723,561 | $ | 107.27 | $ | 128.79 | $ | (38.5) | $ | 9,452.6 | 2022 (4) | $ | 12,040,281 | $ | 4,988,292 | $ | 6,743,095 | $ | 5,740,281 | $ | 102.03 | $ | 124.61 | $ | 1.0 | $ | 8,820.7 |
|
|
|
|
|
| Company Selected Measure Name |
Net Sales
|
|
|
|
|
| Named Executive Officers, Footnote |
For each of Fiscal 2026 and Fiscal 2025, the Company PEO was William A. Newlands, and the Company's other named executive officers were Garth Hankinson, James A. Sabia, Jr., James O. Bourdeau, and Samuel Glaetzer.For Fiscal 2024, the Company PEO was William A. Newlands, and the Company's other named executive officers were Garth Hankinson, James O. Bourdeau, Robert Hanson, and James A. Sabia, Jr.For Fiscal 2023, the Company PEO was William A. Newlands, and the Company's other named executive officers were Garth Hankinson, James O. Bourdeau, Robert Hanson, James A. Sabia, Jr., Robert Sands, and Richard Sands.For Fiscal 2022, the Company PEO was William A. Newlands, and the Company's other named executive officers were Garth Hankinson, Robert Sands, Richard Sands, and Robert Hanson.
|
|
|
|
|
| Peer Group Issuers, Footnote |
The S&P 500 Food, Beverage, and Tobacco Index is the peer group index selected by the Company for this purpose and for purposes of the Stock Performance Graph in our Annual Report.
|
|
|
|
|
| PEO Total Compensation Amount |
$ 14,209,126
|
$ 15,006,800
|
$ 14,629,014
|
$ 16,068,340
|
$ 12,040,281
|
| PEO Actually Paid Compensation Amount |
$ 10,903,642
|
(853,514)
|
19,419,251
|
15,728,089
|
4,988,292
|
| Adjustment To PEO Compensation, Footnote |
The amounts deducted and added to the Summary Compensation Table Total to calculate the CAP for Fiscal 2026 are as follows: | | | | | | | Fiscal 2026 | | Summary Compensation Table Total | $ | 14,209,126 | | Decreased by the full grant date fair value of RSUs and PSUs granted during the reported fiscal year; | (10,767,749) | | Decreased by the grant date fair value of NQSOs granted during the reported fiscal year; | — | | Increased by the fair value as of the end of the fiscal year of all awards granted during the fiscal year that were outstanding and unvested as of the end of such fiscal year; | 8,685,088 | | Increased (or if negative, decreased) by the change in fair value from the end of the prior fiscal year through the end of the reported fiscal year of any awards granted in any prior fiscal year that are outstanding and unvested as of the end of the reported fiscal year; | (1,690,713) | | Increased by the fair value as of the vesting date, for awards that are granted and vest in the same year; | — | | Increased (or if negative, decreased) by the change in fair value from the end of the prior fiscal year through the vesting date of any awards granted in any prior fiscal year for which all applicable vesting conditions were satisfied at the end of or during the reported fiscal year; | 367,612 | | Decreased by the fair value at the end of the prior fiscal year, of any awards granted in any prior fiscal year that fail to meet the applicable vesting conditions during the reported fiscal year; and | — |
| | | | | | | Fiscal 2026 | | Increased by the dollar value of any dividend equivalents paid on RSUs and PSUs in the covered fiscal year prior to the vesting date that are not otherwise included in the total compensation for the covered fiscal year. | 100,278 | | Compensation Actually Paid | $ | 10,903,642 |
|
|
|
|
|
| Non-PEO NEO Average Total Compensation Amount |
$ 4,005,952
|
3,433,714
|
5,257,024
|
10,422,191
|
6,743,095
|
| Non-PEO NEO Average Compensation Actually Paid Amount |
$ 3,329,617
|
413,253
|
6,461,318
|
10,723,561
|
5,740,281
|
| Adjustment to Non-PEO NEO Compensation Footnote |
The amounts deducted and added to the Average Summary Compensation Table Total to calculate the Average CAP for Fiscal 2026 are as follows: | | | | | | | Fiscal 2026 | | Summary Compensation Table Total | $ | 4,005,952 | | Decreased by the full grant date fair value of RSUs and PSUs granted during the reported fiscal year; | (2,704,445) | | Decreased by the grant date fair value of NQSOs granted during the reported fiscal year; | — | | Increased by the fair value as of the end of the fiscal year of all awards granted during the fiscal year that were outstanding and unvested as of the end of such fiscal year; | 2,247,162 | | Increased (or if negative, decreased) by the change in fair value from the end of the prior fiscal year through the end of the reported fiscal year of any awards granted in any prior fiscal year that are outstanding and unvested as of the end of the reported fiscal year; | (316,405) | | Increased by the fair value as of the vesting date, for awards that are granted and vest in the same year; | — | | Increased (or if negative, decreased) by the change in fair value from the end of the prior fiscal year through the vesting date of any awards granted in any prior fiscal year for which all applicable vesting conditions were satisfied at the end of or during the reported fiscal year; | 73,570 | | Decreased by the fair value at the end of the prior fiscal year, of any awards granted in any prior fiscal year that fail to meet the applicable vesting conditions during the reported fiscal year; and | — | | Increased by the dollar value of any dividend equivalents paid on RSUs and PSUs in the covered fiscal year prior to the vesting date that are not otherwise included in the total compensation for the covered fiscal year. | 23,783 | | Compensation Actually Paid | $ | 3,329,617 |
|
|
|
|
|
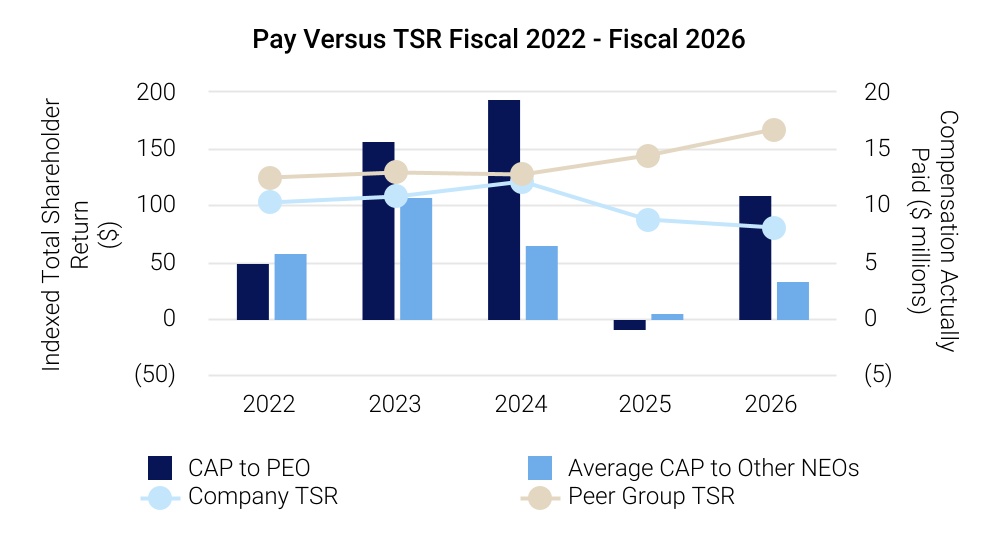
| Compensation Actually Paid vs. Total Shareholder Return |
Relationship Between Compensation Actually Paid and Cumulative Total Shareholder Return
|
|
|
|
|
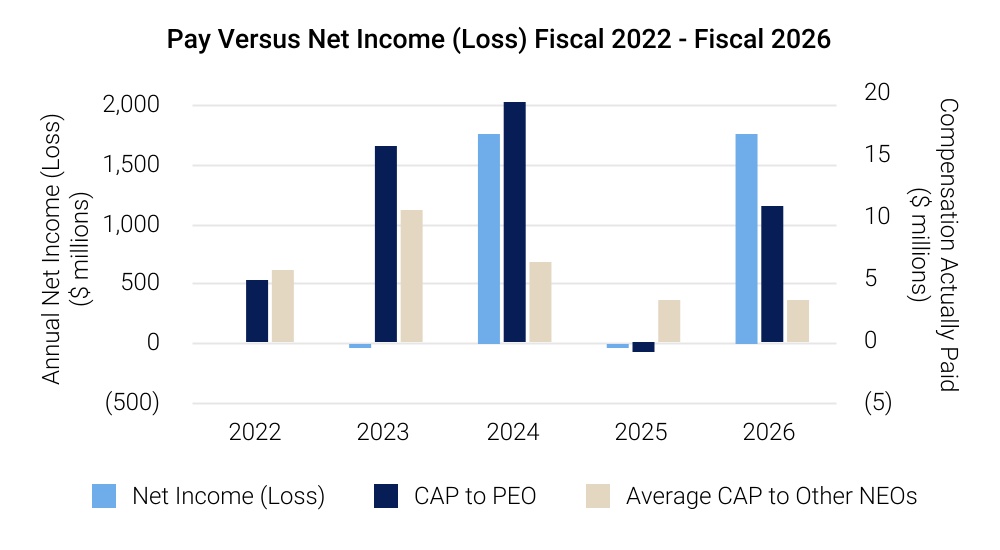
| Compensation Actually Paid vs. Net Income |
Relationship Between Compensation Actually Paid and Net Income (Loss)
|
|
|
|
|
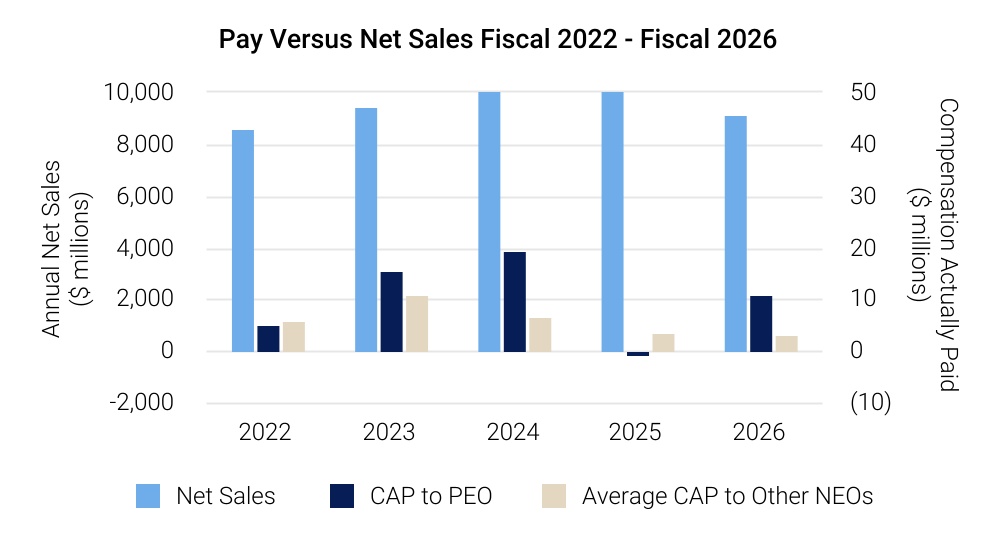
| Compensation Actually Paid vs. Company Selected Measure |
Relationship Between Compensation Actually Paid and Company-Selected Measure (Net Sales)
|
|
|
|
|
| Total Shareholder Return Vs Peer Group |
Relationship Between Compensation Actually Paid and Cumulative Total Shareholder Return
|
|
|
|
|
| Tabular List, Table |
| | | | Net Sales | | Comparable EBIT | | Free Cash Flow | |
|
|
|
|
|
| Total Shareholder Return Amount |
$ 80.28
|
86.97
|
120.92
|
107.27
|
102.03
|
| Peer Group Total Shareholder Return Amount |
166.86
|
143.82
|
126.43
|
128.79
|
124.61
|
| Net Income (Loss), Including Portion Attributable to Noncontrolling Interest |
$ 1,756,800,000
|
$ (31,100,000)
|
$ 1,765,200,000
|
$ (38,500,000)
|
$ 1,000,000.0
|
| Company Selected Measure Amount |
9,139,000,000
|
10,208,700,000
|
9,961,800,000
|
9,452,600,000
|
8,820,700,000
|
| PEO Name |
William A. Newlands
|
|
|
|
|
| Additional 402(v) Disclosure |
Fair value or change in fair value, as applicable, of equity awards in the “Compensation Actually Paid” columns was determined by reference to: (1) for RSU awards, closing price of our Class A Stock on applicable year-end dates or, in the case of vesting dates, the actual vesting price; (2) for PSU awards, the same valuation methodology as RSU awards above except year-end and vesting date values are multiplied by the probability of achievement or actual results, as applicable, as of each such date and, for PSU awards with market-based conditions, the probability is determined based on the outcome of a Monte Carlo simulation; and (3) for NQSOs, the fair value calculated based on the outcome of a Monte Carlo simulation as of the applicable year-end or vesting date(s), determined based on the same methodology as used to determine grant date fair values (but using a Monte Carlo simulation instead of a Black-Scholes pricing model as was used on the grant date), the closing price of our Class A Stock on the applicable revaluation date as the current market price as of the revaluation date, and in all cases determined using assumptions and inputs consistent with those found in Note 19 of our financial statements in our 2026 Form 10-K.TSR is determined based on the value of an initial fixed investment of $100.Net income (loss) as reported in our 2026 Form 10-K in accordance with GAAP.Net Sales was selected as our CSM because management believes it is the most important annual financial performance measure used to link executive pay and Company performance in Fiscal 2026. Net Sales is one of the three performance metrics used under our AMIP, is also discussed under the heading above entitled “Compensation Discussion and Analysis,” and is defined as GAAP net sales as reported in our 2026 Form 10-K.
|
|
|
|
|
| Measure:: 1 |
|
|
|
|
|
| Pay vs Performance Disclosure |
|
|
|
|
|
| Name |
Net Sales
|
|
|
|
|
| Measure:: 2 |
|
|
|
|
|
| Pay vs Performance Disclosure |
|
|
|
|
|
| Name |
Comparable EBIT
|
|
|
|
|
| Measure:: 3 |
|
|
|
|
|
| Pay vs Performance Disclosure |
|
|
|
|
|
| Name |
Free Cash Flow
|
|
|
|
|
| PEO | Year-end Fair Value of Equity Awards Granted in Covered Year that are Outstanding and Unvested |
|
|
|
|
|
| Pay vs Performance Disclosure |
|
|
|
|
|
| Adjustment to Compensation, Amount |
$ 8,685,088
|
|
|
|
|
| PEO | Year-over-Year Change in Fair Value of Equity Awards Granted in Prior Years That are Outstanding and Unvested |
|
|
|
|
|
| Pay vs Performance Disclosure |
|
|
|
|
|
| Adjustment to Compensation, Amount |
(1,690,713)
|
|
|
|
|
| PEO | Vesting Date Fair Value of Equity Awards Granted and Vested in Covered Year |
|
|
|
|
|
| Pay vs Performance Disclosure |
|
|
|
|
|
| Adjustment to Compensation, Amount |
0
|
|
|
|
|
| PEO | Change in Fair Value as of Vesting Date of Prior Year Equity Awards Vested in Covered Year |
|
|
|
|
|
| Pay vs Performance Disclosure |
|
|
|
|
|
| Adjustment to Compensation, Amount |
367,612
|
|
|
|
|
| PEO | Prior Year End Fair Value of Equity Awards Granted in Any Prior Year that Fail to Meet Applicable Vesting Conditions During Covered Year |
|
|
|
|
|
| Pay vs Performance Disclosure |
|
|
|
|
|
| Adjustment to Compensation, Amount |
0
|
|
|
|
|
| PEO | Dividends or Other Earnings Paid on Equity Awards not Otherwise Reflected in Total Compensation for Covered Year |
|
|
|
|
|
| Pay vs Performance Disclosure |
|
|
|
|
|
| Adjustment to Compensation, Amount |
100,278
|
|
|
|
|
| PEO | Equity Awards Reported Value, RSUs And PSUs [Member] |
|
|
|
|
|
| Pay vs Performance Disclosure |
|
|
|
|
|
| Adjustment to Compensation, Amount |
(10,767,749)
|
|
|
|
|
| PEO | Equity Awards Reported Value, NQSOs [Member] |
|
|
|
|
|
| Pay vs Performance Disclosure |
|
|
|
|
|
| Adjustment to Compensation, Amount |
0
|
|
|
|
|
| Non-PEO NEO | Year-end Fair Value of Equity Awards Granted in Covered Year that are Outstanding and Unvested |
|
|
|
|
|
| Pay vs Performance Disclosure |
|
|
|
|
|
| Adjustment to Compensation, Amount |
2,247,162
|
|
|
|
|
| Non-PEO NEO | Year-over-Year Change in Fair Value of Equity Awards Granted in Prior Years That are Outstanding and Unvested |
|
|
|
|
|
| Pay vs Performance Disclosure |
|
|
|
|
|
| Adjustment to Compensation, Amount |
(316,405)
|
|
|
|
|
| Non-PEO NEO | Vesting Date Fair Value of Equity Awards Granted and Vested in Covered Year |
|
|
|
|
|
| Pay vs Performance Disclosure |
|
|
|
|
|
| Adjustment to Compensation, Amount |
0
|
|
|
|
|
| Non-PEO NEO | Change in Fair Value as of Vesting Date of Prior Year Equity Awards Vested in Covered Year |
|
|
|
|
|
| Pay vs Performance Disclosure |
|
|
|
|
|
| Adjustment to Compensation, Amount |
73,570
|
|
|
|
|
| Non-PEO NEO | Prior Year End Fair Value of Equity Awards Granted in Any Prior Year that Fail to Meet Applicable Vesting Conditions During Covered Year |
|
|
|
|
|
| Pay vs Performance Disclosure |
|
|
|
|
|
| Adjustment to Compensation, Amount |
0
|
|
|
|
|
| Non-PEO NEO | Dividends or Other Earnings Paid on Equity Awards not Otherwise Reflected in Total Compensation for Covered Year |
|
|
|
|
|
| Pay vs Performance Disclosure |
|
|
|
|
|
| Adjustment to Compensation, Amount |
23,783
|
|
|
|
|
| Non-PEO NEO | Equity Awards Reported Value, RSUs And PSUs [Member] |
|
|
|
|
|
| Pay vs Performance Disclosure |
|
|
|
|
|
| Adjustment to Compensation, Amount |
(2,704,445)
|
|
|
|
|
| Non-PEO NEO | Equity Awards Reported Value, NQSOs [Member] |
|
|
|
|
|
| Pay vs Performance Disclosure |
|
|
|
|
|
| Adjustment to Compensation, Amount |
$ 0
|
|
|
|
|