Exhibit 99.2
| © 2026 FuelCell Energy 1 Second Quarter 2026 Financial Results & Business Update June 8, 2026 A rendering of a 50-MW FuelCell Energy data center installation © 2026 FuelCell Energy Exhibit 99.2 |
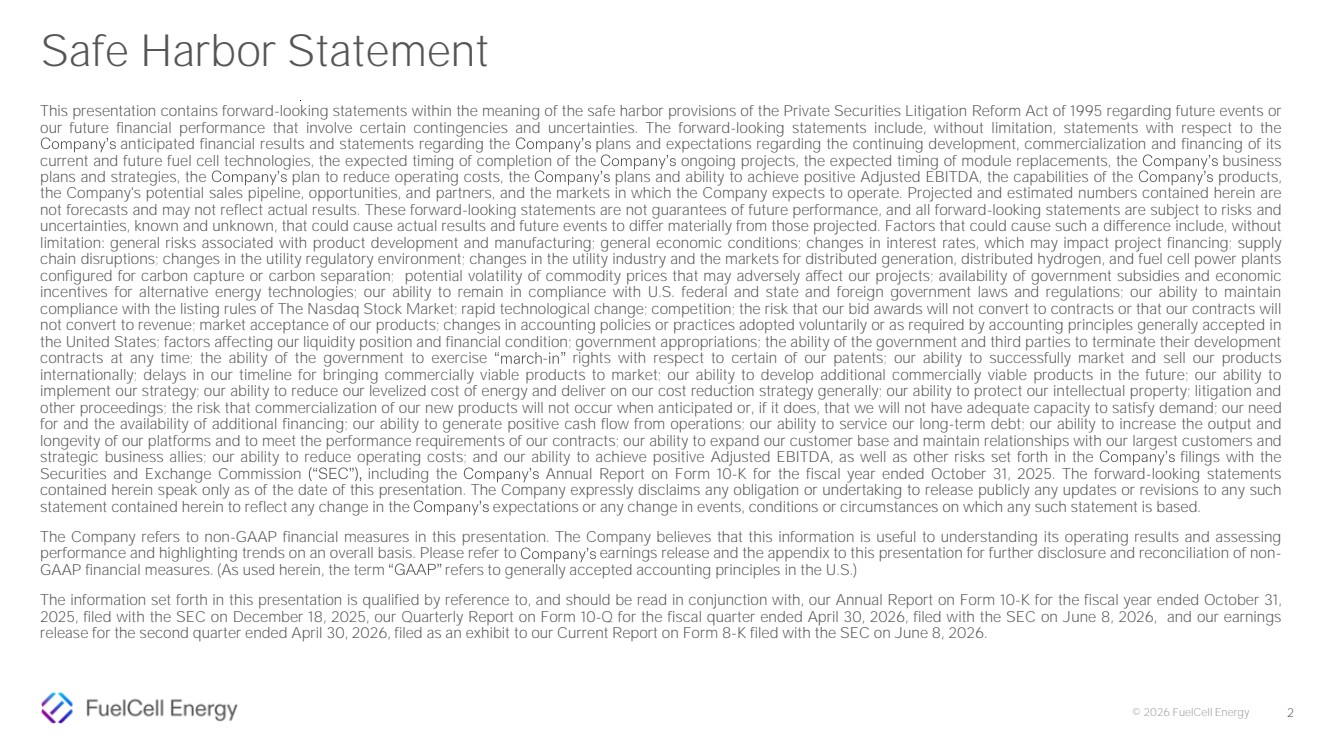
| © 2026 FuelCell Energy This presentation contains forward-looking statements within the meaning of the safe harbor provisions of the Private Securities Litigation Reform Act of 1995 regarding future events or our future financial performance that involve certain contingencies and uncertainties. The forward-looking statements include, without limitation, statements with respect to the Company’s anticipated financial results and statements regarding the Company’s plans and expectations regarding the continuing development, commercialization and financing of its current and future fuel cell technologies, the expected timing of completion of the Company’s ongoing projects, the expected timing of module replacements, the Company’s business plans and strategies, the Company’s plan to reduce operating costs, the Company’s plans and ability to achieve positive Adjusted EBITDA, the capabilities of the Company’s products, the Company's potential sales pipeline, opportunities, and partners, and the markets in which the Company expects to operate. Projected and estimated numbers contained herein are not forecasts and may not reflect actual results. These forward-looking statements are not guarantees of future performance, and all forward-looking statements are subject to risks and uncertainties, known and unknown, that could cause actual results and future events to differ materially from those projected. Factors that could cause such a difference include, without limitation: general risks associated with product development and manufacturing; general economic conditions; changes in interest rates, which may impact project financing; supply chain disruptions; changes in the utility regulatory environment; changes in the utility industry and the markets for distributed generation, distributed hydrogen, and fuel cell power plants configured for carbon capture or carbon separation; potential volatility of commodity prices that may adversely affect our projects; availability of government subsidies and economic incentives for alternative energy technologies; our ability to remain in compliance with U.S. federal and state and foreign government laws and regulations; our ability to maintain compliance with the listing rules of The Nasdaq Stock Market; rapid technological change; competition; the risk that our bid awards will not convert to contracts or that our contracts will not convert to revenue; market acceptance of our products; changes in accounting policies or practices adopted voluntarily or as required by accounting principles generally accepted in the United States; factors affecting our liquidity position and financial condition; government appropriations; the ability of the government and third parties to terminate their development contracts at any time; the ability of the government to exercise “march -in” rights with respect to certain of our patents; our ability to successfully market and sell our products internationally; delays in our timeline for bringing commercially viable products to market; our ability to develop additional commercially viable products in the future; our ability to implement our strategy; our ability to reduce our levelized cost of energy and deliver on our cost reduction strategy generally; our ability to protect our intellectual property; litigation and other proceedings; the risk that commercialization of our new products will not occur when anticipated or, if it does, that we will not have adequate capacity to satisfy demand; our need for and the availability of additional financing; our ability to generate positive cash flow from operations; our ability to service our long-term debt; our ability to increase the output and longevity of our platforms and to meet the performance requirements of our contracts; our ability to expand our customer base and maintain relationships with our largest customers and strategic business allies; our ability to reduce operating costs; and our ability to achieve positive Adjusted EBITDA, as well as other risks set forth in the Company’s filings with the Securities and Exchange Commission (“SEC”), including the Company’s Annual Report on Form 10-K for the fiscal year ended October 31, 2025. The forward-looking statements contained herein speak only as of the date of this presentation. The Company expressly disclaims any obligation or undertaking to release publicly any updates or revisions to any such statement contained herein to reflect any change in the Company’s expectations or any change in events, conditions or circumstances on which any such statement is based. The Company refers to non-GAAP financial measures in this presentation. The Company believes that this information is useful to understanding its operating results and assessing performance and highlighting trends on an overall basis. Please refer to Company’s earnings release and the appendix to this presentation for further disclosure and reconciliation of non-GAAP financial measures. (As used herein, the term “GAAP” refers to generally accepted accounting principles in the U.S.) The information set forth in this presentation is qualified by reference to, and should be read in conjunction with, our Annual Report on Form 10-K for the fiscal year ended October 31, 2025, filed with the SEC on December 18, 2025, our Quarterly Report on Form 10-Q for the fiscal quarter ended April 30, 2026, filed with the SEC on June 8, 2026, and our earnings release for the second quarter ended April 30, 2026, filed as an exhibit to our Current Report on Form 8-K filed with the SEC on June 8, 2026. Safe Harbor Statement 2 |
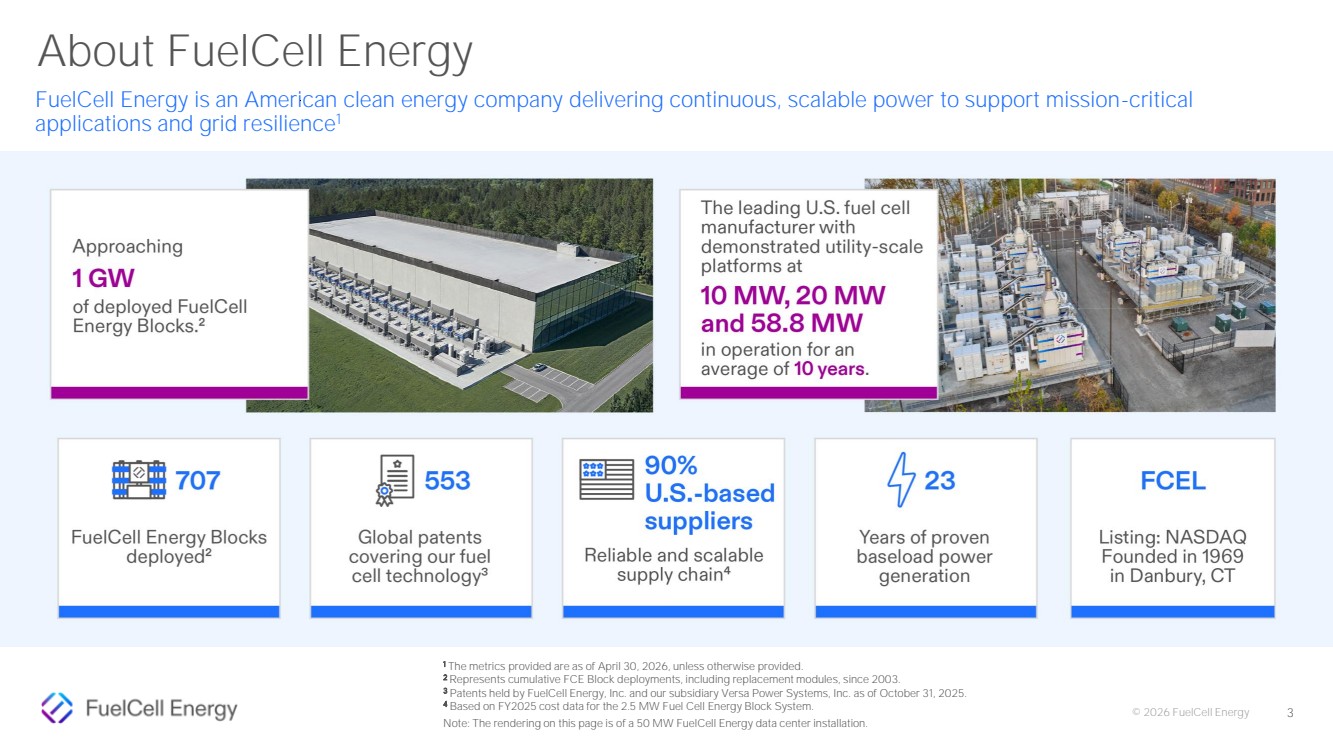
| © 2026 FuelCell Energy 3 1 The metrics provided are as of April 30, 2026, unless otherwise provided. 2 Represents cumulative FCE Block deployments, including replacement modules, since 2003. 3 Patents held by FuelCell Energy, Inc. and our subsidiary Versa Power Systems, Inc. as of October 31, 2025. 4 Based on FY2025 cost data for the 2.5 MW Fuel Cell Energy Block System. Note: The rendering on this page is of a 50 MW FuelCell Energy data center installation. FuelCell Energy is an American clean energy company delivering continuous, scalable power to support mission-critical applications and grid resilience1 About FuelCell Energy |
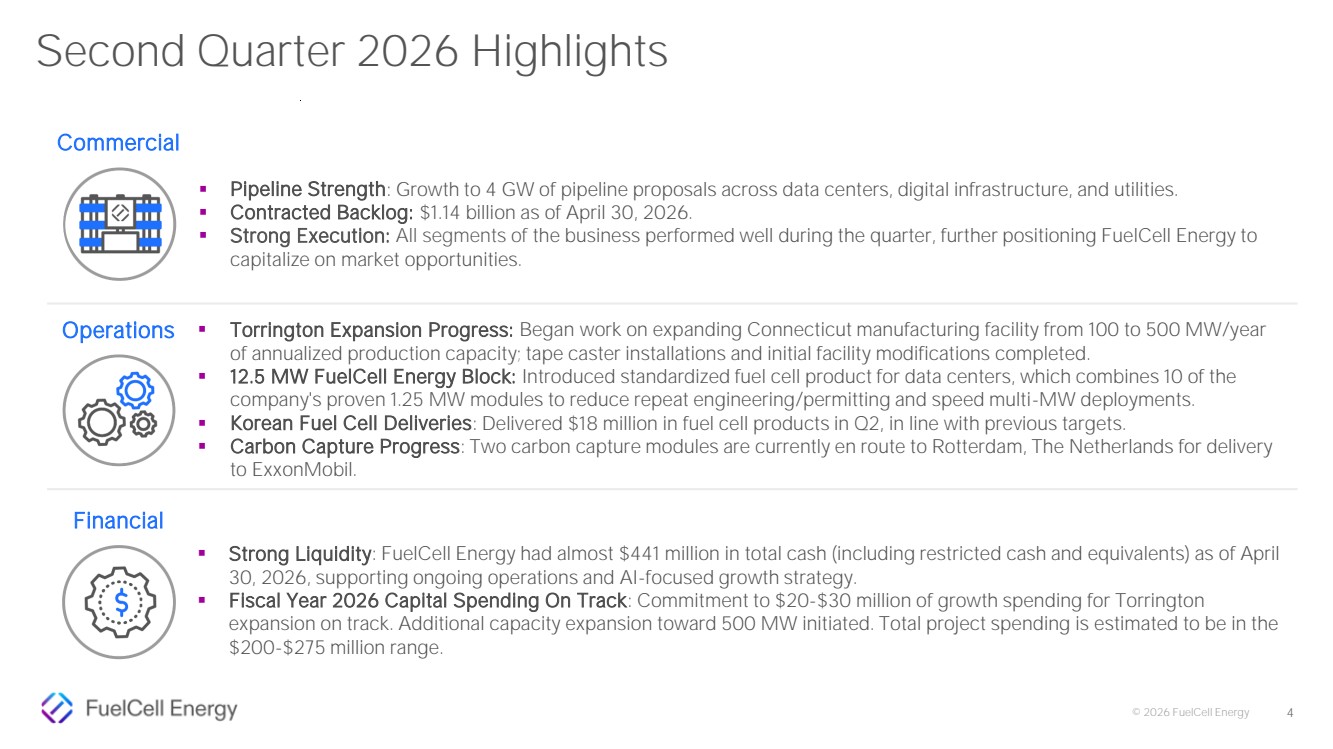
| © 2026 FuelCell Energy 4 Second Quarter 2026 Highlights Commercial Operations Financial ▪ Strong Liquidity: FuelCell Energy had almost $441 million in total cash (including restricted cash and equivalents) as of April 30, 2026, supporting ongoing operations and AI-focused growth strategy. ▪ Fiscal Year 2026 Capital Spending On Track: Commitment to $20-$30 million of growth spending for Torrington expansion on track. Additional capacity expansion toward 500 MW initiated. Total project spending is estimated to be in the $200-$275 million range. ▪ Torrington Expansion Progress: Began work on expanding Connecticut manufacturing facility from 100 to 500 MW/year of annualized production capacity; tape caster installations and initial facility modifications completed. ▪ 12.5 MW FuelCell Energy Block: Introduced standardized fuel cell product for data centers, which combines 10 of the company's proven 1.25 MW modules to reduce repeat engineering/permitting and speed multi-MW deployments. ▪ Korean Fuel Cell Deliveries: Delivered $18 million in fuel cell products in Q2, in line with previous targets. ▪ Carbon Capture Progress: Two carbon capture modules are currently en route to Rotterdam, The Netherlands for delivery to ExxonMobil. ▪ Pipeline Strength: Growth to 4 GW of pipeline proposals across data centers, digital infrastructure, and utilities. ▪ Contracted Backlog: $1.14 billion as of April 30, 2026. ▪ Strong Execution: All segments of the business performed well during the quarter, further positioning FuelCell Energy to capitalize on market opportunities. |
| © 2026 FuelCell Energy Technology and Business Overview 5 |

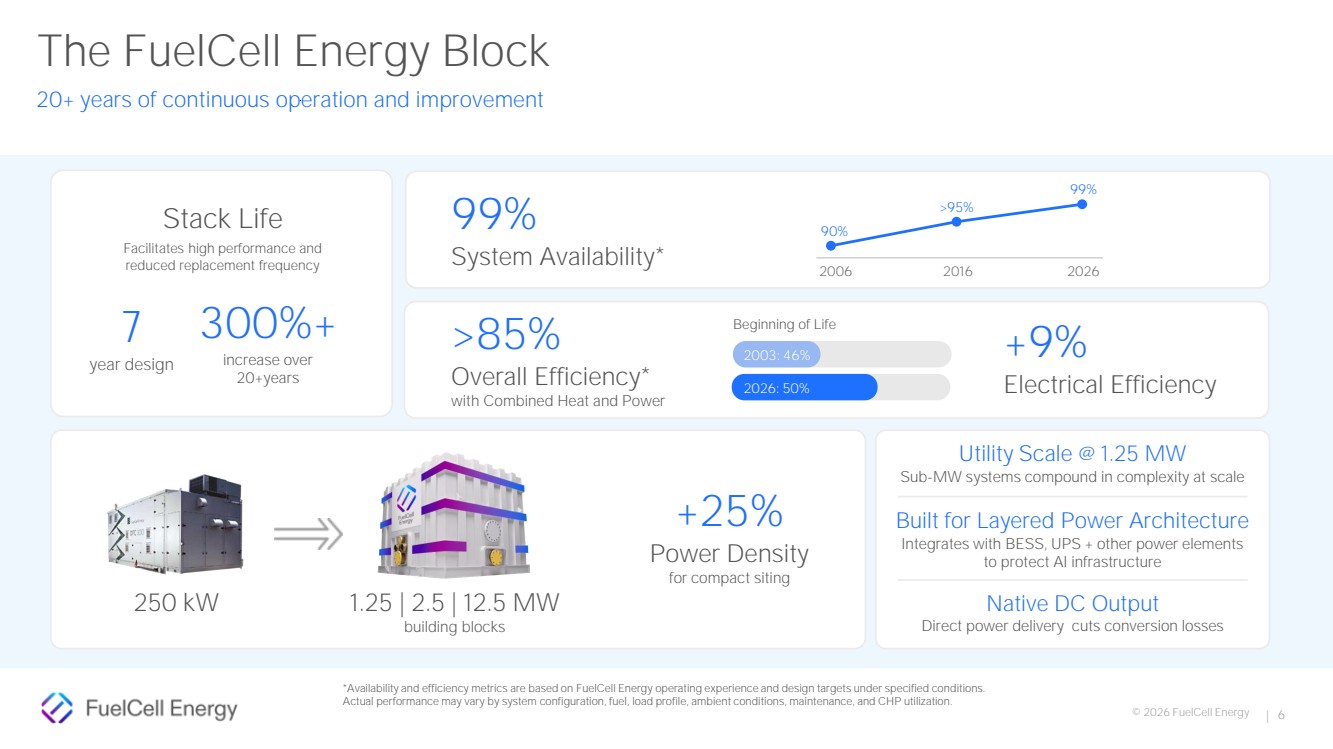
| © 2026 FuelCell Energy 99% System Availability* 90% >95% 99% 2006 +25% Power Density for compact siting >85% Overall Efficiency* with Combined Heat and Power Beginning of Life 2003: 46% 2026: 50% | 6 1.25 | 2.5 | 12.5 MW building blocks 250 kW Stack Life 7 year design 300%+ increase over 20+years Utility Scale @ 1.25 MW Sub-MW systems compound in complexity at scale Built for Layered Power Architecture Integrates with BESS, UPS + other power elements to protect AI infrastructure Native DC Output Direct power delivery cuts conversion losses +9% Electrical Efficiency Facilitates high performance and reduced replacement frequency *Availability and efficiency metrics are based on FuelCell Energy operating experience and design targets under specified conditions. Actual performance may vary by system configuration, fuel, load profile, ambient conditions, maintenance, and CHP utilization. The FuelCell Energy Block 20+ years of continuous operation and improvement 2016 2026 |
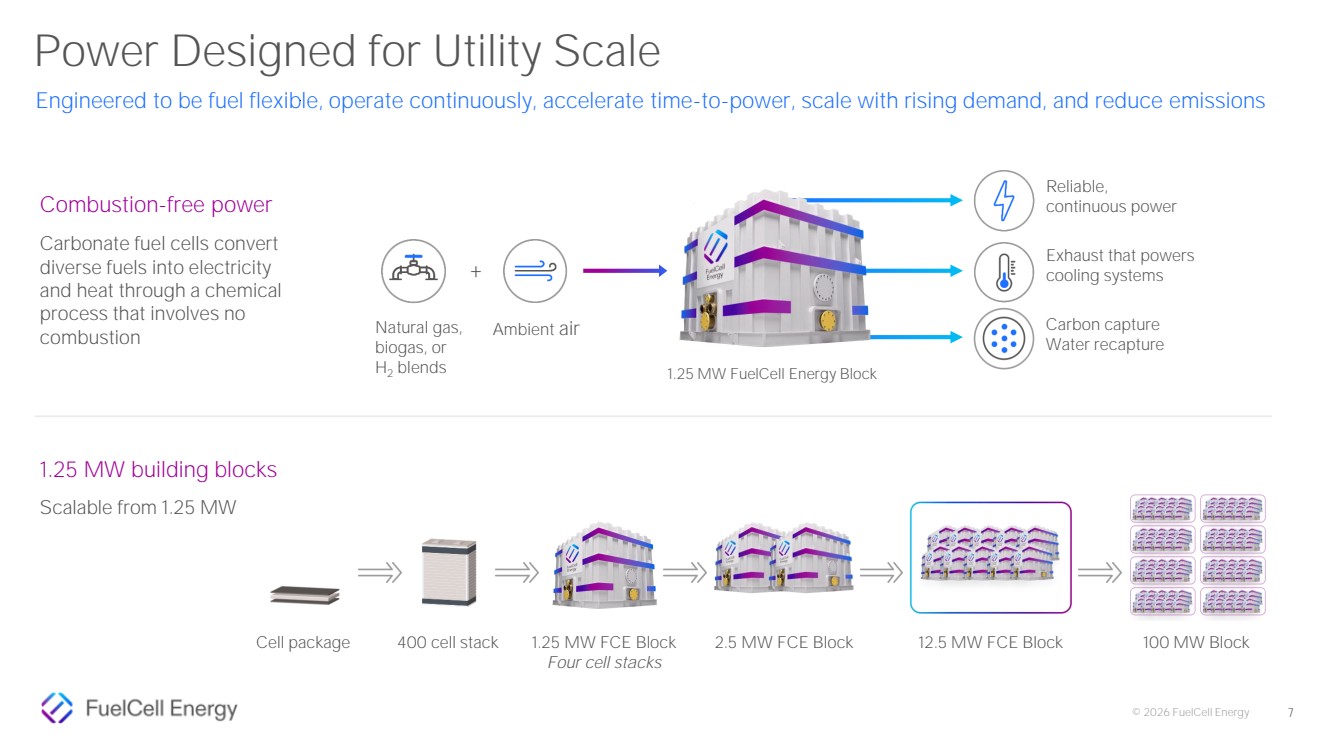
| © 2026 FuelCell Energy 7 Engineered to be fuel flexible, operate continuously, accelerate time-to-power, scale with rising demand, and reduce emissions Carbonate fuel cells convert diverse fuels into electricity and heat through a chemical process that involves no combustion Combustion-free power Scalable from 1.25 MW 1.25 MW building blocks Natural gas, biogas, or H2 blends Ambient air + Exhaust that powers cooling systems Carbon capture Water recapture Reliable, continuous power 1.25 MW FuelCell Energy Block Cell package 1.25 MW FCE Block Four cell stacks 400 cell stack 2.5 MW FCE Block 12.5 MW FCE Block 100 MW Block Power Designed for Utility Scale |
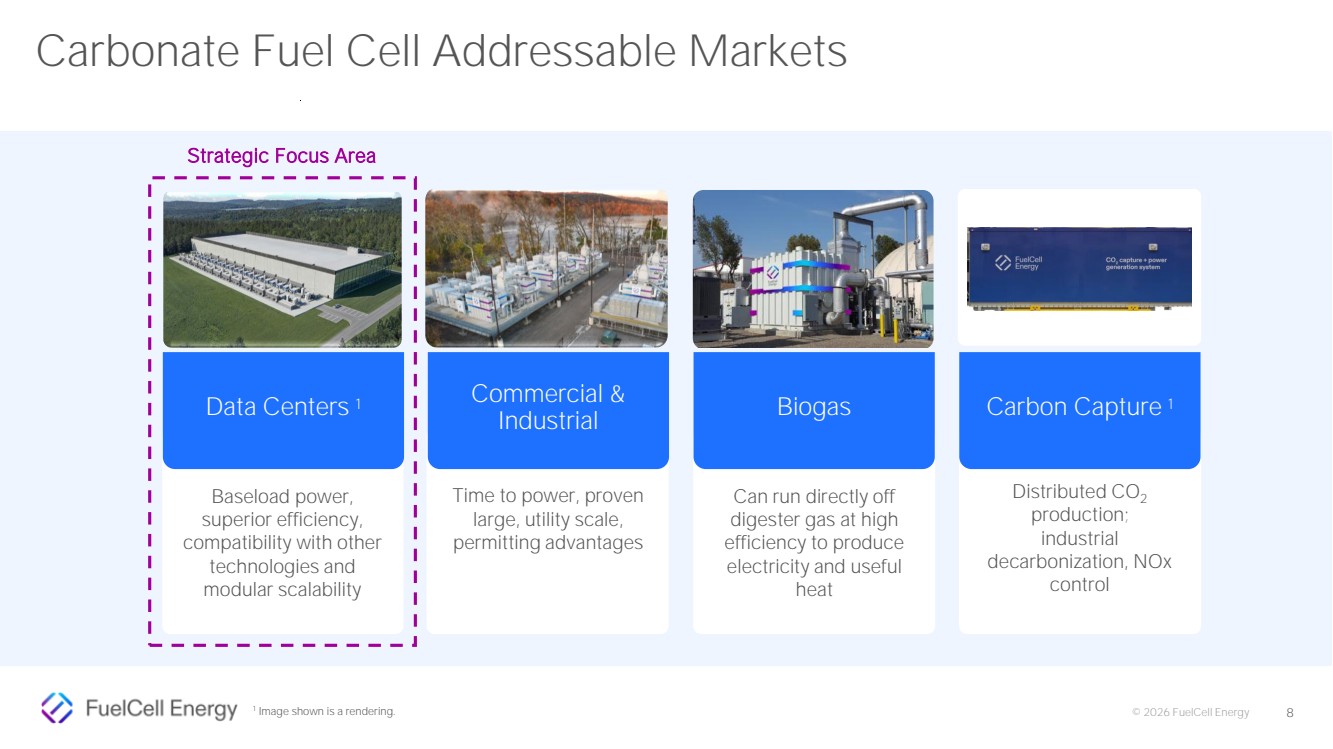
| © 2026 FuelCell Energy 8 Carbonate Fuel Cell Addressable Markets Baseload power, superior efficiency, compatibility with other technologies and modular scalability Distributed CO2 production; industrial decarbonization, NOx control Can run directly off digester gas at high efficiency to produce electricity and useful heat Time to power, proven large, utility scale, permitting advantages 1 Image shown is a rendering. Data Centers 1 Carbon Capture Commercial & Biogas 1 Industrial Strategic Focus Area |
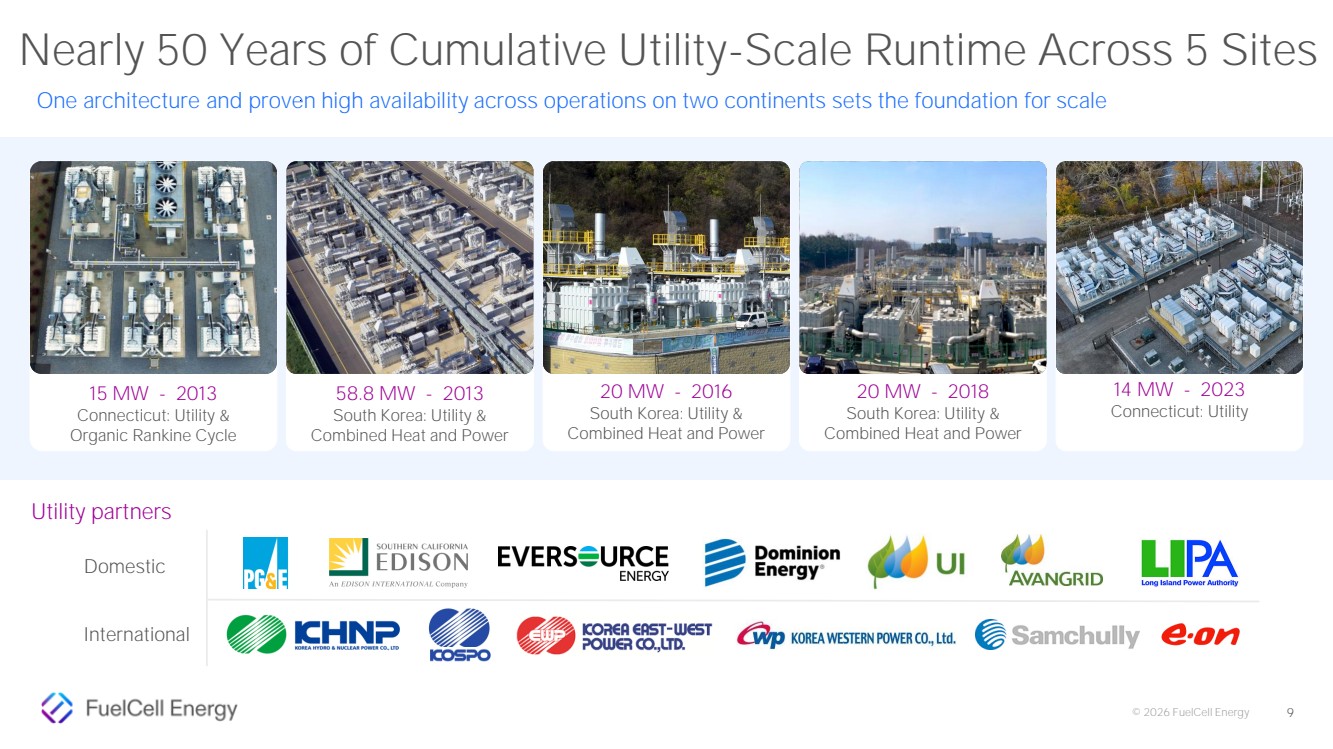
| © 2026 FuelCell Energy 9 Nearly 50 Years of Cumulative Utility-Scale Runtime Across 5 Sites One architecture and proven high availability across operations on two continents sets the foundation for scale International Domestic 58.8 MW - 2013 South Korea: Utility & Combined Heat and Power 20 MW - 2016 South Korea: Utility & Combined Heat and Power 15 MW - 2013 Connecticut: Utility & Organic Rankine Cycle 14 MW - 2023 Connecticut: Utility 20 MW - 2018 South Korea: Utility & Combined Heat and Power Utility partners |
| © 2026 FuelCell Energy AI and Data Center Strategy 10 |
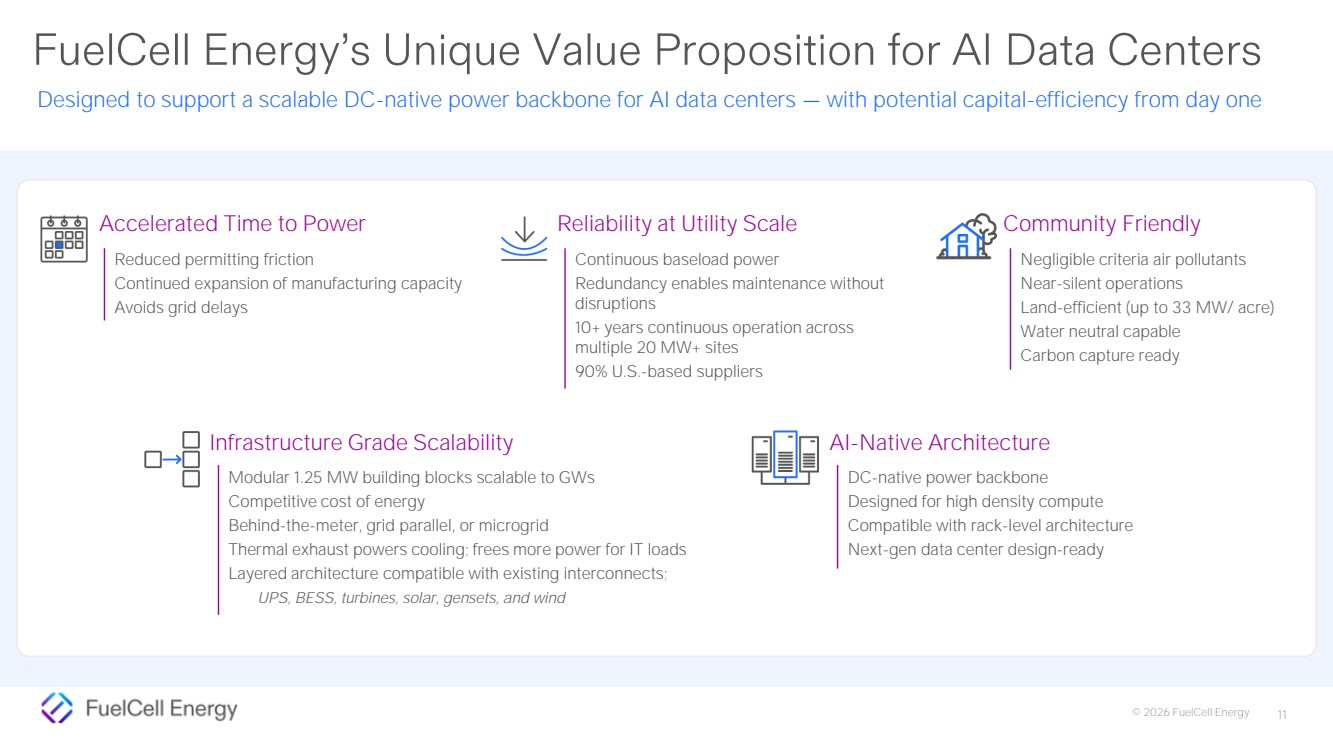
| © 2026 FuelCell Energy 11 FuelCell Energy’s Unique Value Proposition for AI Data Centers Negligible criteria air pollutants Near-silent operations Land-efficient (up to 33 MW/ acre) Water neutral capable Carbon capture ready Community Friendly AI-Native Architecture DC-native power backbone Designed for high density compute Compatible with rack-level architecture Next-gen data center design-ready Accelerated Time to Power Reduced permitting friction Continued expansion of manufacturing capacity Avoids grid delays Reliability at Utility Scale Continuous baseload power Redundancy enables maintenance without disruptions 10+ years continuous operation across multiple 20 MW+ sites 90% U.S.-based suppliers Infrastructure Grade Scalability Modular 1.25 MW building blocks scalable to GWs Competitive cost of energy Behind-the-meter, grid parallel, or microgrid Thermal exhaust powers cooling; frees more power for IT loads Layered architecture compatible with existing interconnects; UPS, BESS, turbines, solar, gensets, and wind Designed to support a scalable DC-native power backbone for AI data centers — with potential capital-efficiency from day one |
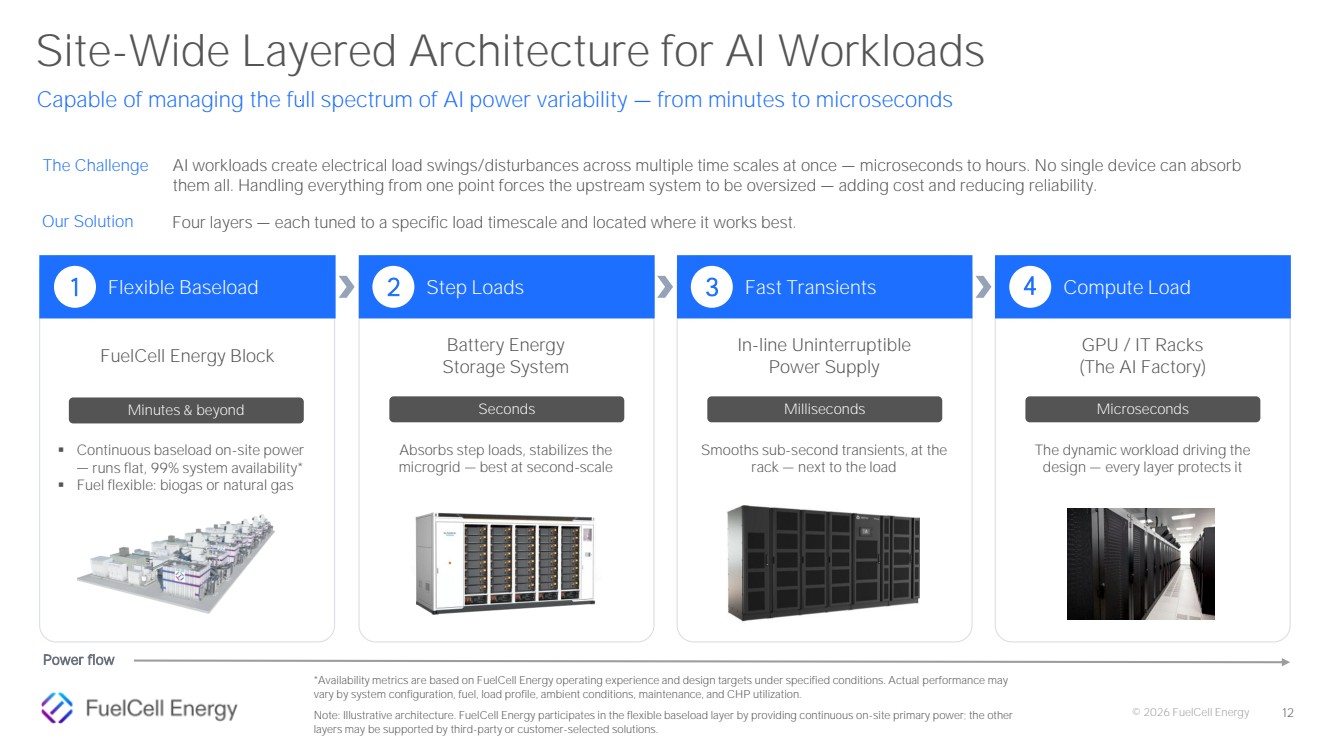
| © 2026 FuelCell Energy Site-Wide Layered Architecture for AI Workloads 12 Capable of managing the full spectrum of AI power variability — from minutes to microseconds The Challenge AI workloads create electrical load swings/disturbances across multiple time scales at once — microseconds to hours. No single device can absorb them all. Handling everything from one point forces the upstream system to be oversized — adding cost and reducing reliability. Four layers — each tuned to a specific load timescale and located where it works best. 1 Flexible Baseload FuelCell Energy Block Power flow Minutes & beyond ▪ Continuous baseload on-site power — runs flat, 99% system availability* ▪ Fuel flexible: biogas or natural gas 2 Step Loads Battery Energy Storage System Absorbs step loads, stabilizes the microgrid — best at second-scale 3 Fast Transients In-line Uninterruptible Power Supply Smooths sub-second transients, at the rack — next to the load 4 Compute Load GPU / IT Racks (The AI Factory) The dynamic workload driving the design — every layer protects it Our Solution Seconds Milliseconds Microseconds *Availability metrics are based on FuelCell Energy operating experience and design targets under specified conditions. Actual performance may vary by system configuration, fuel, load profile, ambient conditions, maintenance, and CHP utilization. Note: Illustrative architecture. FuelCell Energy participates in the flexible baseload layer by providing continuous on-site primary power; the other layers may be supported by third-party or customer-selected solutions. |
| © 2026 FuelCell Energy Commercial & Operations Update 13 |
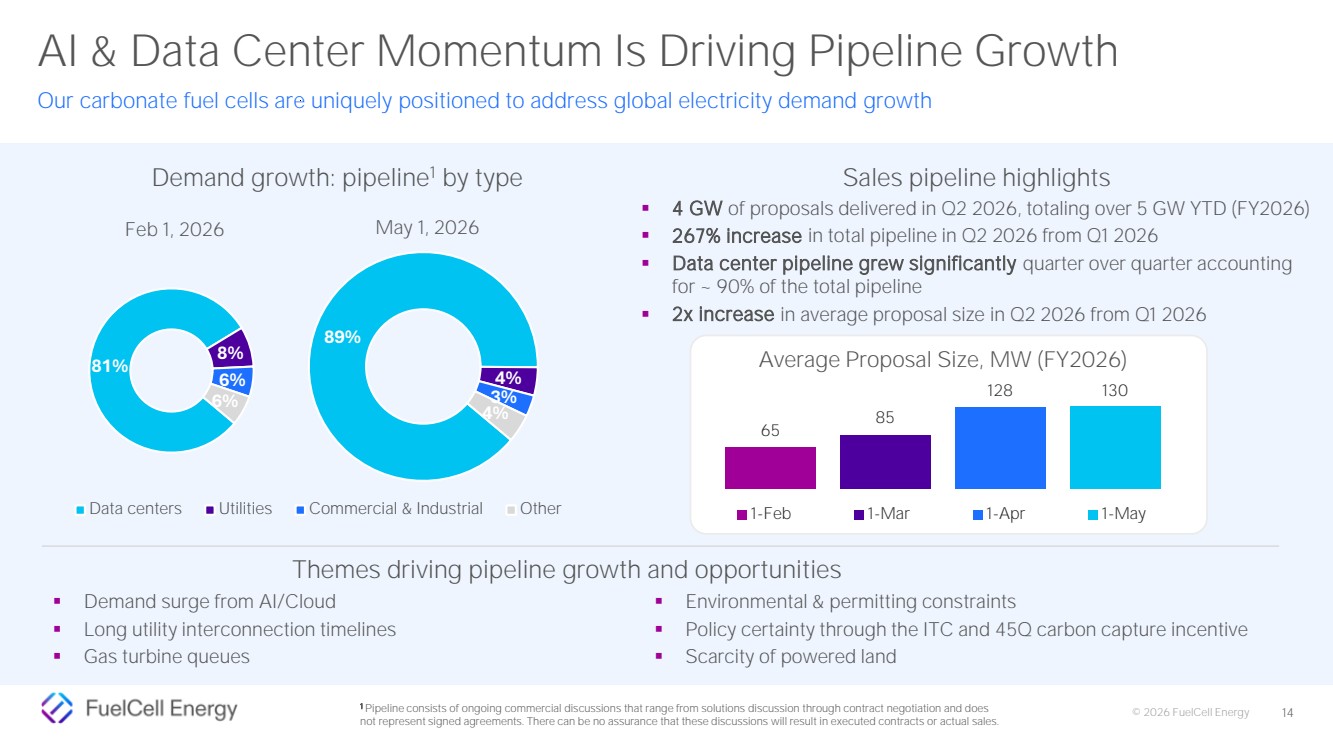
| © 2026 FuelCell Energy Our carbonate fuel cells are uniquely positioned to address global electricity demand growth AI & Data Center Momentum Is Driving Pipeline Growth Demand growth: pipeline1 by type 89% 4% 3% 4% Data centers Utilities Commercial & Industrial Other ▪ Demand surge from AI/Cloud ▪ Long utility interconnection timelines ▪ Gas turbine queues ▪ Environmental & permitting constraints ▪ Policy certainty through the ITC and 45Q carbon capture incentive ▪ Scarcity of powered land Sales pipeline highlights ▪ 4 GW of proposals delivered in Q2 2026, totaling over 5 GW YTD (FY2026) ▪ 267% increase in total pipeline in Q2 2026 from Q1 2026 ▪ Data center pipeline grew significantly quarter over quarter accounting for ~ 90% of the total pipeline ▪ 2x increase in average proposal size in Q2 2026 from Q1 2026 1 Pipeline consists of ongoing commercial discussions that range from solutions discussion through contract negotiation and does not represent signed agreements. There can be no assurance that these discussions will result in executed contracts or actual sales. Feb 1, 2026 May 1, 2026 14 81% 8% 6% 6% Themes driving pipeline growth and opportunities 65 85 128 130 1-Feb 1-Mar 1-Apr 1-May Average Proposal Size, MW (FY2026) |
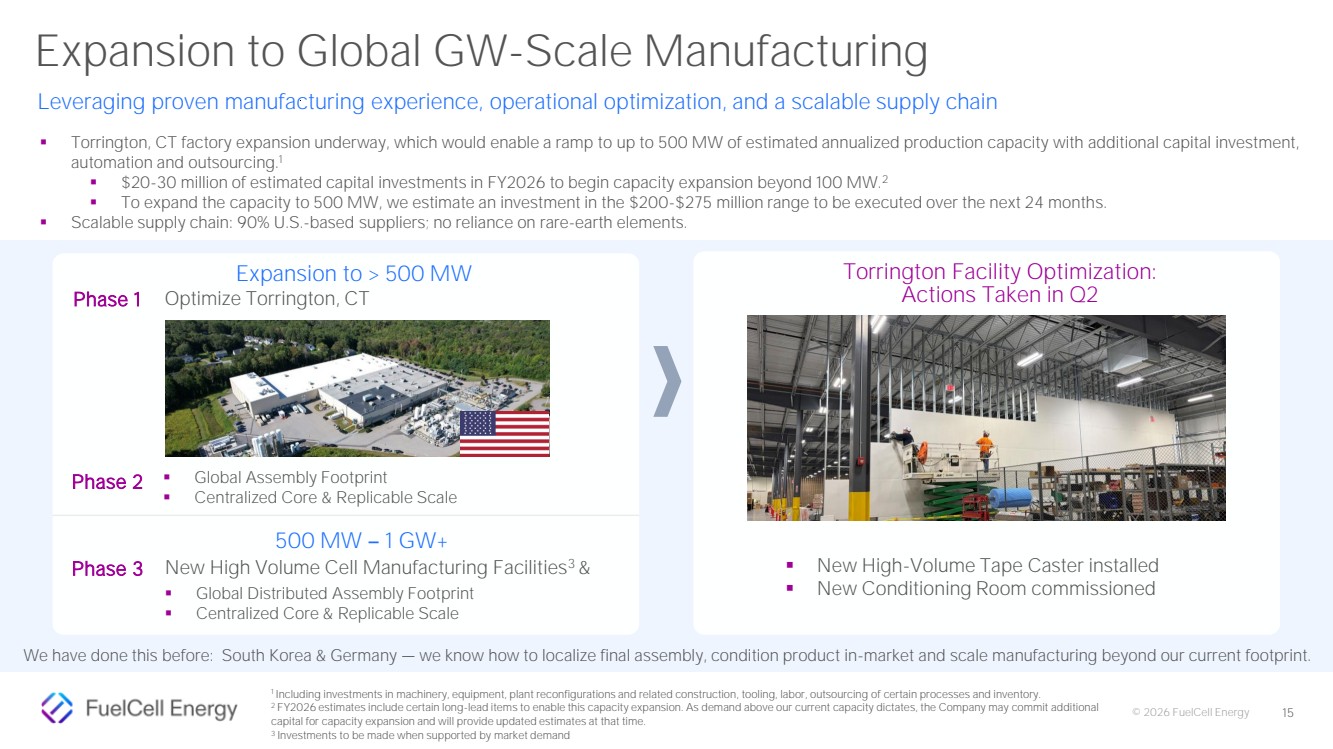
| © 2026 FuelCell Energy 1 Including investments in machinery, equipment, plant reconfigurations and related construction, tooling, labor, outsourcing of certain processes and inventory. 2 FY2026 estimates include certain long-lead items to enable this capacity expansion. As demand above our current capacity dictates, the Company may commit additional capital for capacity expansion and will provide updated estimates at that time. 3 Investments to be made when supported by market demand Expansion to Global GW-Scale Manufacturing Leveraging proven manufacturing experience, operational optimization, and a scalable supply chain ▪ Torrington, CT factory expansion underway, which would enable a ramp to up to 500 MW of estimated annualized production capacity with additional capital investment, automation and outsourcing.1 ▪ $20-30 million of estimated capital investments in FY2026 to begin capacity expansion beyond 100 MW.2 ▪ To expand the capacity to 500 MW, we estimate an investment in the $200-$275 million range to be executed over the next 24 months. ▪ Scalable supply chain: 90% U.S.-based suppliers; no reliance on rare-earth elements. 15 Expansion to > 500 MW Phase 2 ▪ Global Assembly Footprint ▪ Centralized Core & Replicable Scale Phase 1 Optimize Torrington, CT ▪ New High-Volume Tape Caster installed ▪ New Conditioning Room commissioned Torrington Facility Optimization: Actions Taken in Q2 500 MW – 1 GW+ Phase 3 New High Volume Cell Manufacturing Facilities3& ▪ Global Distributed Assembly Footprint ▪ Centralized Core & Replicable Scale We have done this before: South Korea & Germany — we know how to localize final assembly, condition product in-market and scale manufacturing beyond our current footprint. |
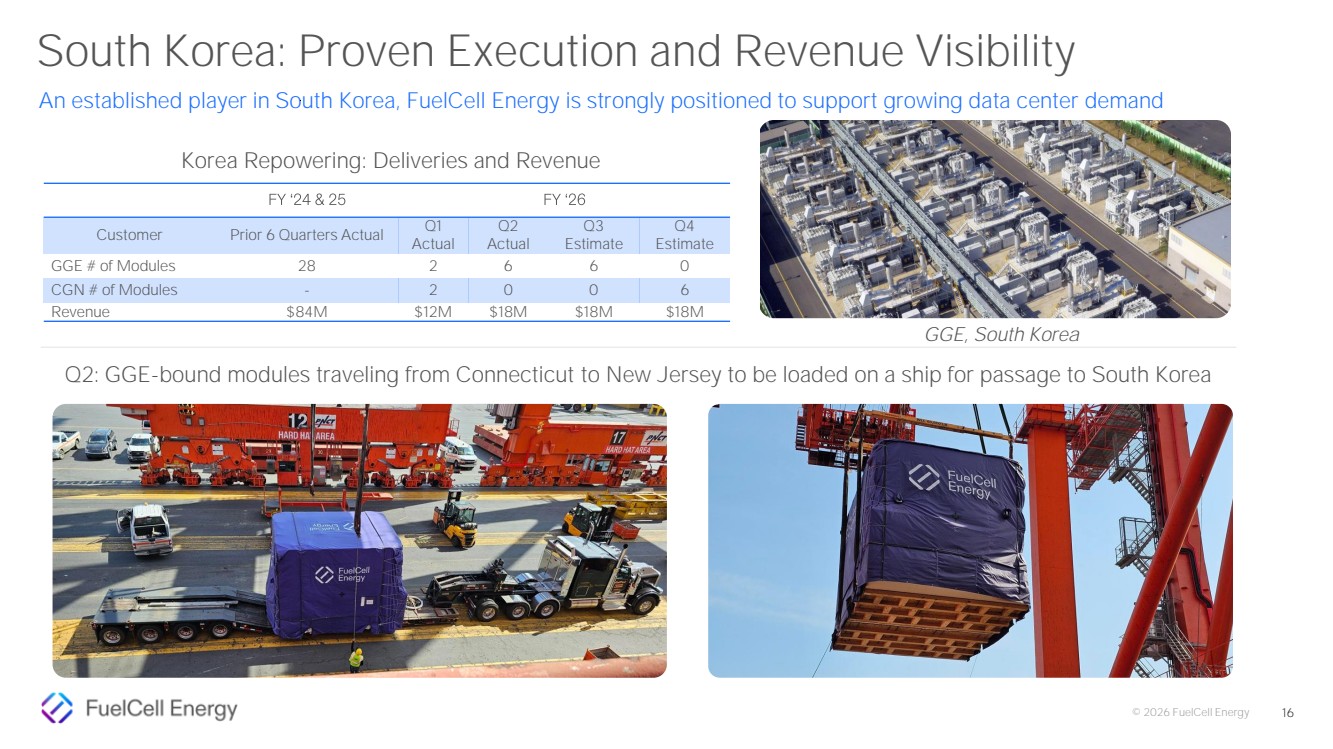
| © 2026 FuelCell Energy 16 South Korea: Proven Execution and Revenue Visibility Q2: GGE-bound modules traveling from Connecticut to New Jersey to be loaded on a ship for passage to South Korea Korea Repowering: Deliveries and Revenue FY ‘24 & 25 FY ‘26 Customer Prior 6 Quarters Actual Q1 Actual Q2 Actual Q3 Estimate Q4 Estimate GGE # of Modules 28 2 6 6 0 CGN # of Modules - 2 0 0 6 Revenue $84M $12M $18M $18M $18M GGE fuel cell park, South Korea Rendering of AI Daegu Data Center, South Korea* An established player in South Korea, FuelCell Energy is strongly positioned to support growing data center demand GGE, South Korea |
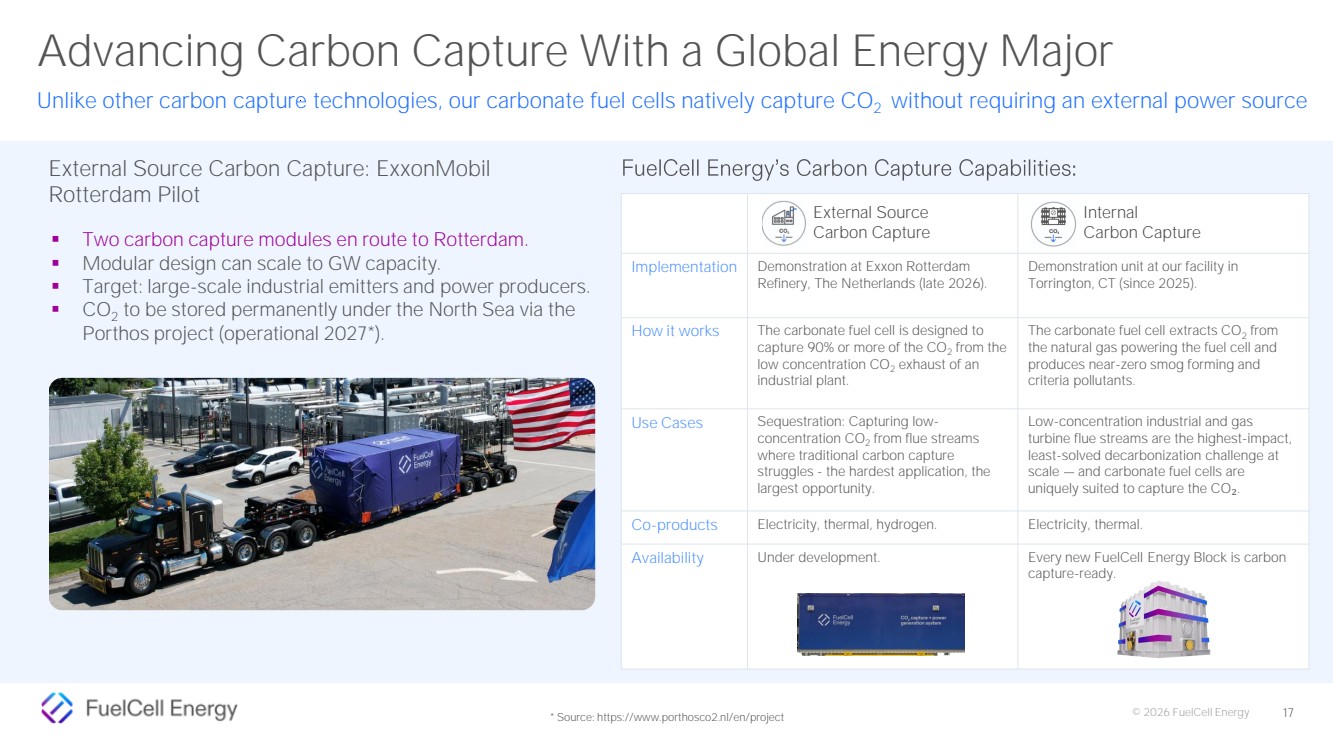
| © 2026 FuelCell Energy Project Pipeline Statistics Market Feedback trends Advancing Carbon Capture With a Global Energy Major Unlike other carbon capture technologies, our carbonate fuel cells natively capture CO2 without requiring an external power source ▪ Two carbon capture modules en route to Rotterdam. ▪ Modular design can scale to GW capacity. ▪ Target: large-scale industrial emitters and power producers. ▪ CO2 to be stored permanently under the North Sea via the Porthos project (operational 2027*). External Source Carbon Capture: ExxonMobil Rotterdam Pilot * Source: https://www.porthosco2.nl/en/project 17 External Source Carbon Capture Internal Carbon Capture Implementation Demonstration at Exxon Rotterdam Refinery, The Netherlands (late 2026). Demonstration unit at our facility in Torrington, CT (since 2025). How it works The carbonate fuel cell is designed to capture 90% or more of the CO2 from the low concentration CO2 exhaust of an industrial plant. The carbonate fuel cell extracts CO2 from the natural gas powering the fuel cell and produces near-zero smog forming and criteria pollutants. Use Cases Sequestration: Capturing low-concentration CO2 from flue streams where traditional carbon capture struggles - the hardest application, the largest opportunity. Low-concentration industrial and gas turbine flue streams are the highest-impact, least-solved decarbonization challenge at scale — and carbonate fuel cells are uniquely suited to capture the CO₂. Co-products Electricity, thermal, hydrogen. Electricity, thermal. Availability Under development. Every new FuelCell Energy Block is carbon capture-ready. FuelCell Energy’s Carbon Capture Capabilities: |
| © 2026 FuelCell Energy Financial Update 18 |

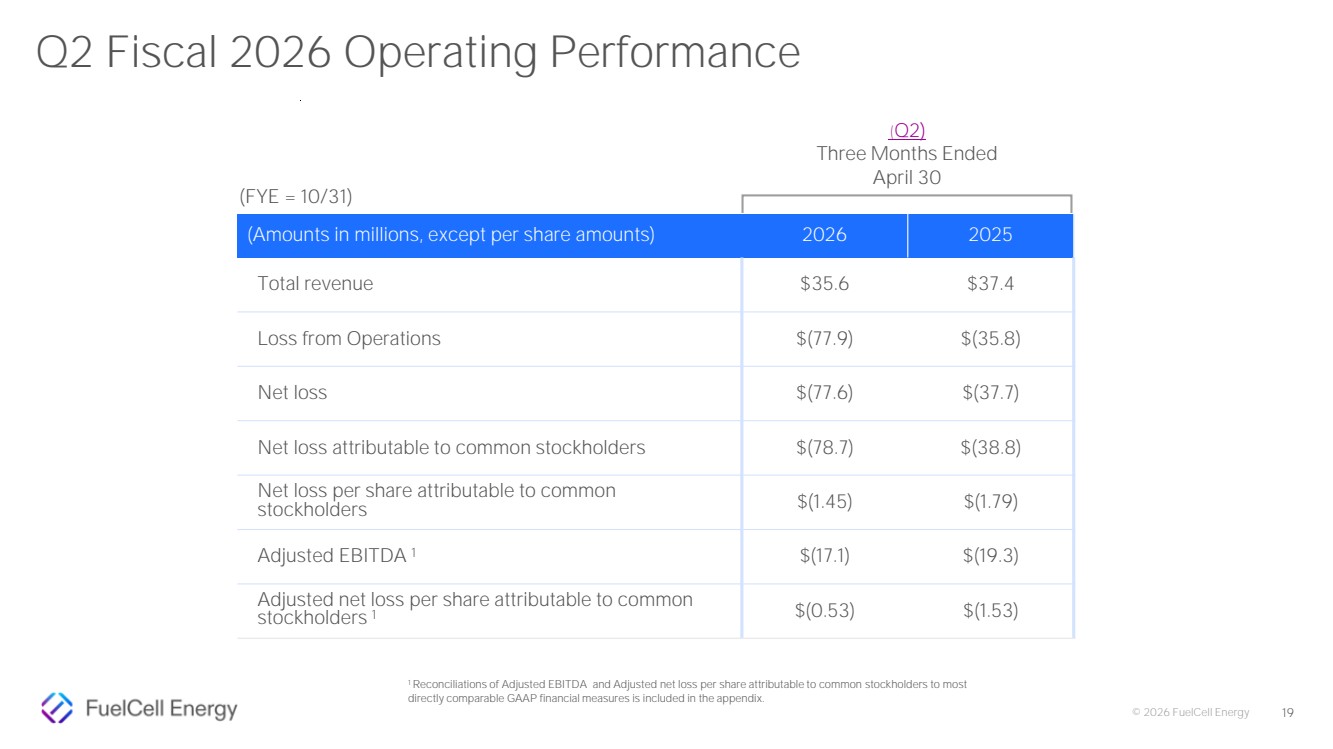
| © 2026 FuelCell Energy (Amounts in millions, except per share amounts) 2026 2025 Total revenue $35.6 $37.4 Loss from Operations $(77.9) $(35.8) Net loss $(77.6) $(37.7) Net loss attributable to common stockholders $(78.7) $(38.8) Net loss per share attributable to common stockholders $(1.45) $(1.79) Adjusted EBITDA 1 $(17.1) $(19.3) Adjusted net loss per share attributable to common stockholders 1 $(0.53) $(1.53) 19 (FYE = 10/31) (Q2) Three Months Ended April 30 1 Reconciliations of Adjusted EBITDA and Adjusted net loss per share attributable to common stockholders to most directly comparable GAAP financial measures is included in the appendix. Q2 Fiscal 2026 Operating Performance |
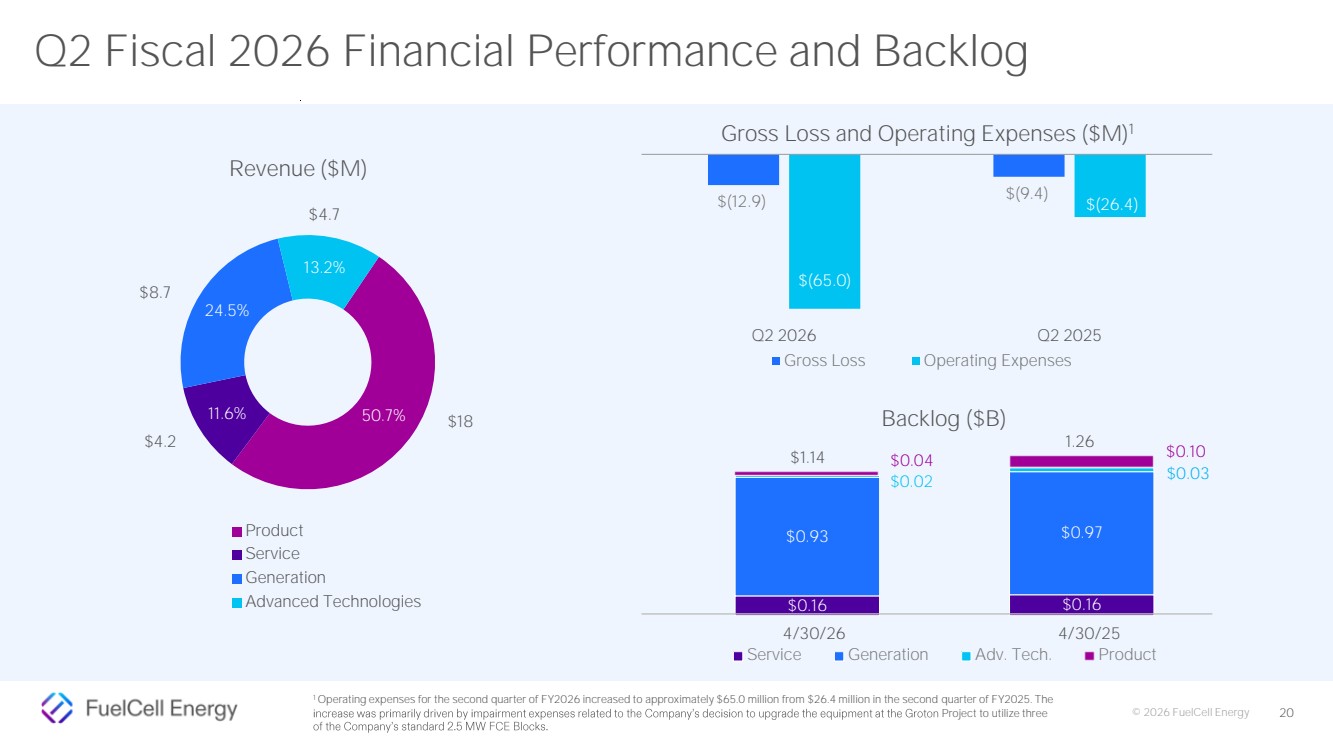
| © 2026 FuelCell Energy $(12.9) $(9.4) $(65.0) $(26.4) Q2 2026 Q2 2025 20 11.6% 50.7% 24.5% 13.2% Product Service Generation Advanced Technologies $4.2 $4.7 $8.7 Gross Loss and Operating Expenses ($M)1 Gross Loss Operating Expenses $0.16 $0.16 $0.93 $0.97 $0.02 $0.03 Service Generation Adv. Tech. Product $1.14 1.26 4/30/26 4/30/25 $0.04 $0.10 Backlog ($B) 1 Operating expenses for the second quarter of FY2026 increased to approximately $65.0 million from $26.4 million in the second quarter of FY2025. The increase was primarily driven by impairment expenses related to the Company’s decision to upgrade the equipment at the Groton Project to utilize three of the Company’s standard 2.5 MW FCE Blocks. Q2 Fiscal 2026 Financial Performance and Backlog $18 Revenue ($M) |
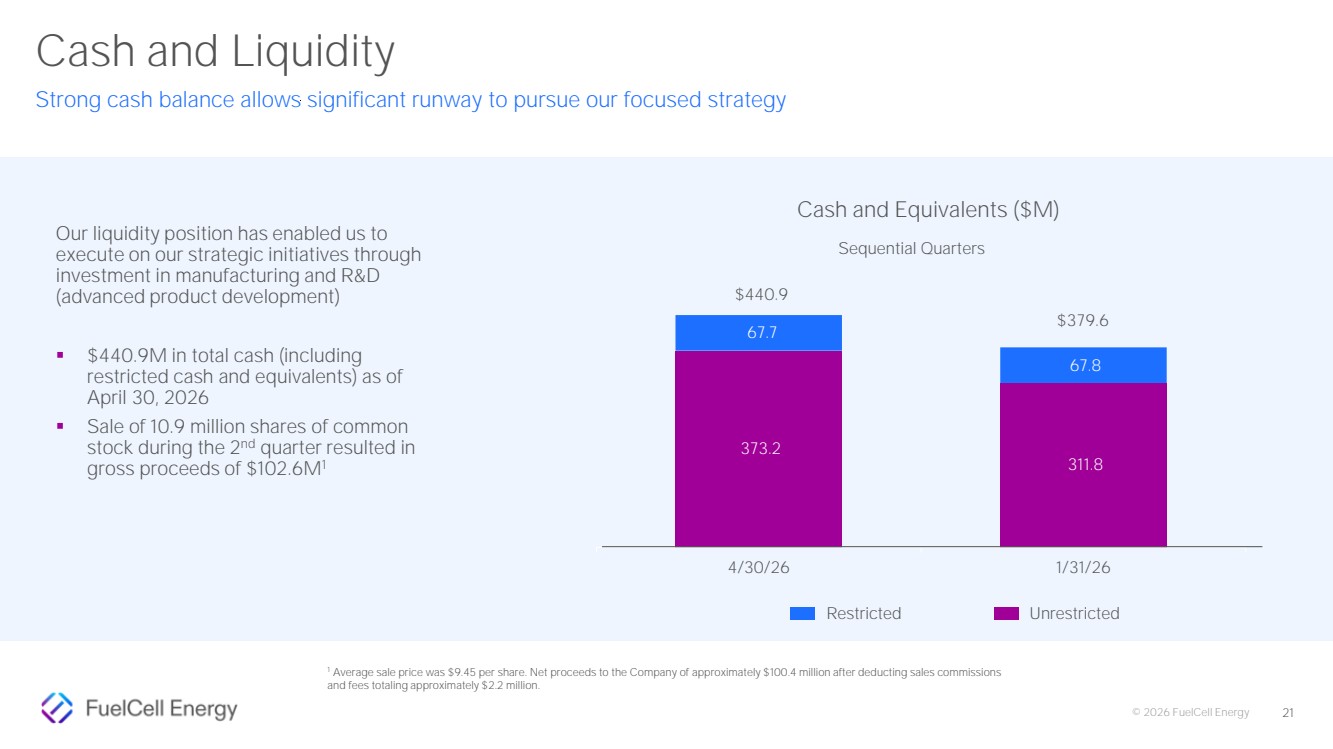
| © 2026 FuelCell Energy Our liquidity position has enabled us to execute on our strategic initiatives through investment in manufacturing and R&D (advanced product development) ▪ $440.9M in total cash (including restricted cash and equivalents) as of April 30, 2026 ▪ Sale of 10.9 million shares of common stock during the 2 nd quarter resulted in gross proceeds of $102.6M1 373.2 311.8 67.7 67.8 4/30/26 1/31/26 Cash and Equivalents ($M) Restricted Unrestricted $379.6 $440.9 Sequential Quarters 1 Average sale price was $9.45 per share. Net proceeds to the Company of approximately $100.4 million after deducting sales commissions and fees totaling approximately $2.2 million. 21 Cash and Liquidity Strong cash balance allows significant runway to pursue our focused strategy |
| © 2026 FuelCell Energy Thank You Investor Relations: ir@fce.com 22 |

| © 2026 FuelCell Energy Appendix 23 |

| © 2026 FuelCell Energy Non-GAAP Financial Measures Financial results are presented in accordance with accounting principles generally accepted in the United States (“GAAP”). Ma nagement also uses non-GAAP measures to analyze and make operating decisions on the business. Earnings before interest, taxes, depreciation and amortization (“EBITDA”), Adjusted EBITDA, Adjusted net loss attributable to common stockholders and Adjusted net loss per share attributable to common stockholders are non-GAAP measures of operations and operating performance by the Company. These supplemental non-GAAP measures are provided to assist readers in assessing operating performance. Management believes EBITDA, Adjusted EBITDA, Adjusted net loss attributable to common stockholders and Adjusted net loss per share attributable to common stockholders are useful in assessing performance and highlighting trends on an overall basis. Management also believes these measures are used by companies in the fuel cell sector and by securities analysts and investors when comparing the results of the Company with those of other companies. EBITDA differs from the most comparable GAAP measure, net loss attributable to the Company, primarily because it does not include finance expense, income taxes and depreciation of property, plant and equipment and project assets. Adjusted EBITDA adjusts EBITDA for stock-based compensation, impairment and restructuring expenses, unrealized non-cash loss (gain) on natural gas contract derivative assets and other unusual items, which are considered either non-cash or non-recurring. Adjusted net loss attributable to common stockholders and Adjusted net loss per share attributable to common stockholders differ from the most comparable GAAP measures, Net loss attributable to common stockholders and Net loss per share attributable to common stockholders, primarily because they do not include stock-based compensation, impairment and restructuring expenses, unrealized non-cash loss (gain) on natural gas contract derivative assets and other unusual items, which are considered either non-cash or non-recurring. While management believes that these non-GAAP financial measures provide useful supplemental information to investors, there are limitations associated with the use of these measures. The measures are not prepared in accordance with GAAP and may not be directly comparable to similarly titled measures of other companies due to differences in the exact method of calculation. The Company’s non -GAAP financial measures are not meant to be considered in isolation or as a substitute for comparable GAAP financial measures and should be read only in conjunction with the Company’s consolidated financial statements prepared in accordance with GAAP. 24 |
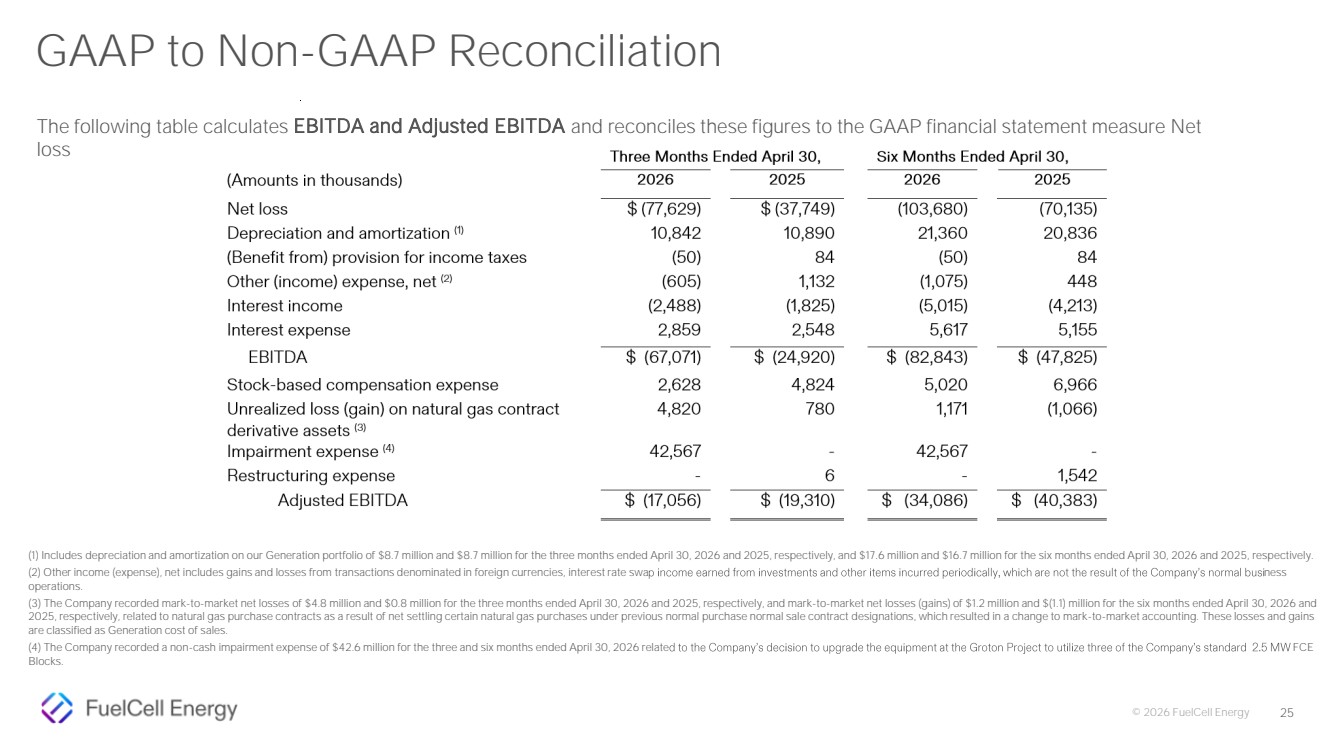
| © 2026 FuelCell Energy 25 (1) Includes depreciation and amortization on our Generation portfolio of $8.7 million and $8.7 million for the three months ended April 30, 2026 and 2025, respectively, and $17.6 million and $16.7 million for the six months ended April 30, 2026 and 2025, respectively. (2) Other income (expense), net includes gains and losses from transactions denominated in foreign currencies, interest rate swap income earned from investments and other items incurred periodically, which are not the result of the Company’s normal busi ness operations. (3) The Company recorded mark-to-market net losses of $4.8 million and $0.8 million for the three months ended April 30, 2026 and 2025, respectively, and mark-to-market net losses (gains) of $1.2 million and $(1.1) million for the six months ended April 30, 2026 and 2025, respectively, related to natural gas purchase contracts as a result of net settling certain natural gas purchases under previous normal purchase normal sale contract designations, which resulted in a change to mark-to-market accounting. These losses and gains are classified as Generation cost of sales. (4) The Company recorded a non-cash impairment expense of $42.6 million for the three and six months ended April 30, 2026 related to the Company’s decision to upgrade the equipment at the Groton Project to utilize three of the Company’s standard 2.5 MW FCE Blocks. GAAP to Non-GAAP Reconciliation The following table calculates EBITDA and Adjusted EBITDA and reconciles these figures to the GAAP financial statement measure Net loss |
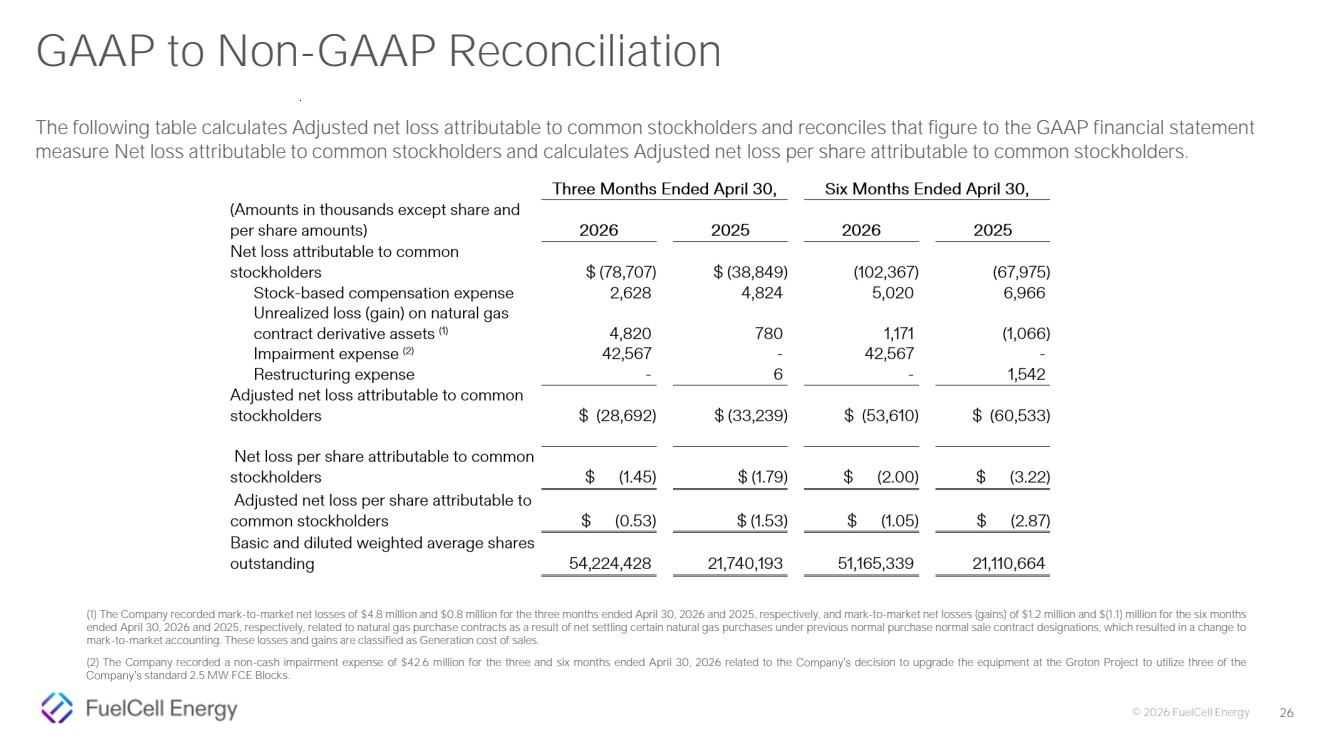
| © 2026 FuelCell Energy 26 GAAP to Non-GAAP Reconciliation (1) The Company recorded mark-to-market net losses of $4.8 million and $0.8 million for the three months ended April 30, 2026 and 2025, respectively, and mark-to-market net losses (gains) of $1.2 million and $(1.1) million for the six months ended April 30, 2026 and 2025, respectively, related to natural gas purchase contracts as a result of net settling certain natural gas purchases under previous normal purchase normal sale contract designations, which resulted in a change to mark-to-market accounting. These losses and gains are classified as Generation cost of sales. (2) The Company recorded a non-cash impairment expense of $42.6 million for the three and six months ended April 30, 2026 related to the Company’s decision to upgrade the equipment at the Groton Project to utilize three of the Company’s standard 2.5 MW FCE Blocks. The following table calculates Adjusted net loss attributable to common stockholders and reconciles that figure to the GAAP financial statement measure Net loss attributable to common stockholders and calculates Adjusted net loss per share attributable to common stockholders. |
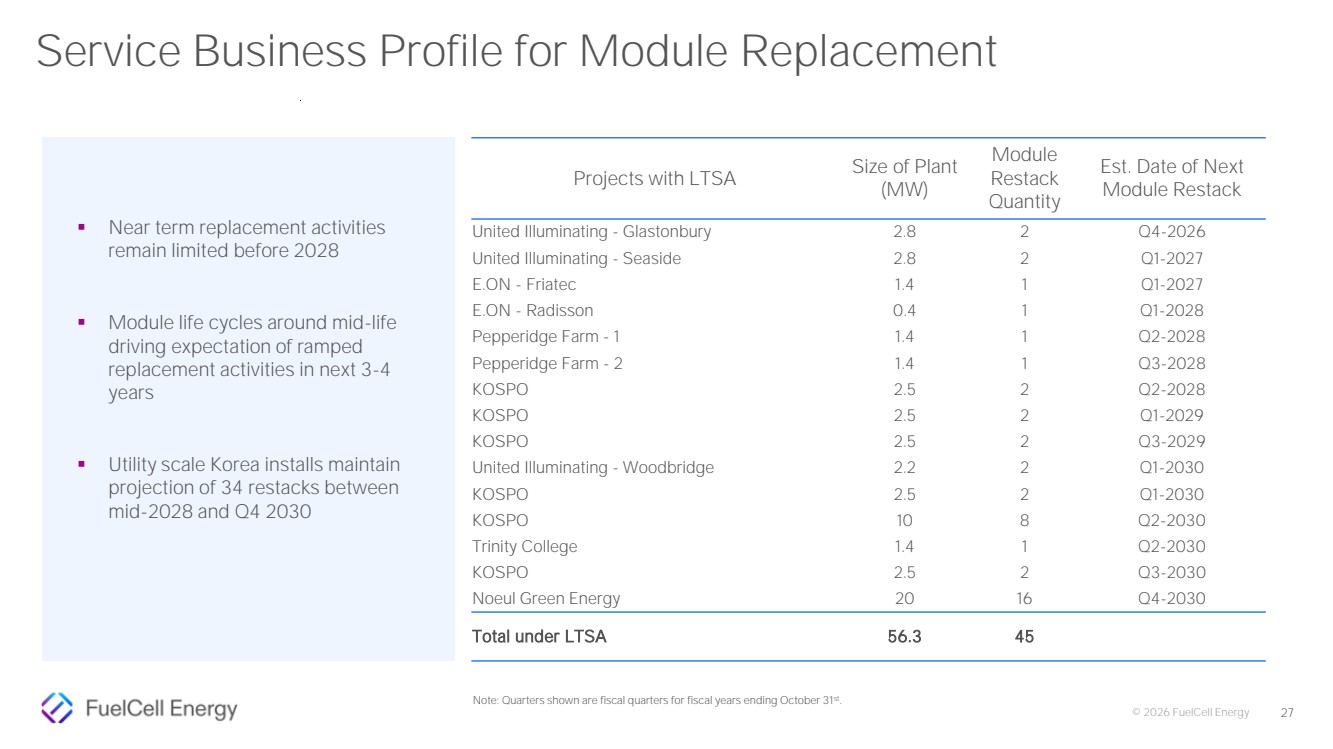
| © 2026 FuelCell Energy Note: Quarters shown are fiscal quarters for fiscal years ending October 31st . Service Business Profile for Module Replacement Projects with LTSA Size of Plant (MW) Module Restack Quantity Est. Date of Next Module Restack United Illuminating - Glastonbury 2.8 2 Q4-2026 United Illuminating - Seaside 2.8 2 Q1-2027 E.ON - Friatec 1.4 1 Q1-2027 E.ON - Radisson 0.4 1 Q1-2028 Pepperidge Farm - 1 1.4 1 Q2-2028 Pepperidge Farm - 2 1.4 1 Q3-2028 KOSPO 2.5 2 Q2-2028 KOSPO 2.5 2 Q1-2029 KOSPO 2.5 2 Q3-2029 United Illuminating - Woodbridge 2.2 2 Q1-2030 KOSPO 2.5 2 Q1-2030 KOSPO 10 8 Q2-2030 Trinity College 1.4 1 Q2-2030 KOSPO 2.5 2 Q3-2030 Noeul Green Energy 20 16 Q4-2030 Total under LTSA 56.3 45 ▪ Near term replacement activities remain limited before 2028 ▪ Module life cycles around mid-life driving expectation of ramped replacement activities in next 3-4 years ▪ Utility scale Korea installs maintain projection of 34 restacks between mid-2028 and Q4 2030 27 |
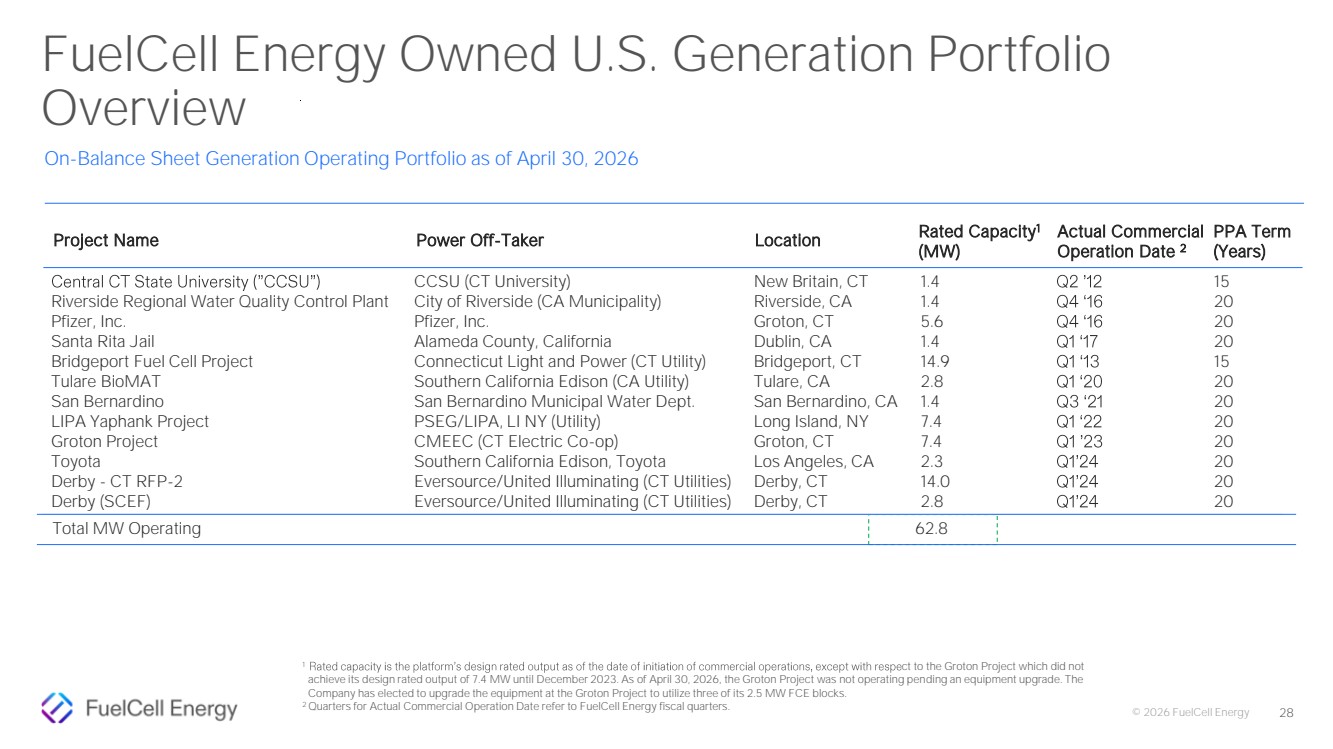
| © 2026 FuelCell Energy 28 1 Rated capacity is the platform’s design rated output as of the date of initiation of commercial operations, except with respe ct to the Groton Project which did not achieve its design rated output of 7.4 MW until December 2023. As of April 30, 2026, the Groton Project was not operating pending an equipment upgrade. The Company has elected to upgrade the equipment at the Groton Project to utilize three of its 2.5 MW FCE blocks. 2 Quarters for Actual Commercial Operation Date refer to FuelCell Energy fiscal quarters. Central CT State University (”CCSU”) Riverside Regional Water Quality Control Plant Pfizer, Inc. Santa Rita Jail Bridgeport Fuel Cell Project Tulare BioMAT San Bernardino LIPA Yaphank Project Groton Project Toyota Derby - CT RFP-2 Derby (SCEF) CCSU (CT University) City of Riverside (CA Municipality) Pfizer, Inc. Alameda County, California Connecticut Light and Power (CT Utility) Southern California Edison (CA Utility) San Bernardino Municipal Water Dept. PSEG/LIPA, LI NY (Utility) CMEEC (CT Electric Co-op) Southern California Edison, Toyota Eversource/United Illuminating (CT Utilities) Eversource/United Illuminating (CT Utilities) New Britain, CT Riverside, CA Groton, CT Dublin, CA Bridgeport, CT Tulare, CA San Bernardino, CA Long Island, NY Groton, CT Los Angeles, CA Derby, CT Derby, CT 1.4 1.4 5.6 1.4 14.9 2.8 1.4 7.4 7.4 2.3 14.0 2.8 Q2 ’12 Q4 ‘16 Q4 ‘16 Q1 ‘17 Q1 ‘13 Q1 ‘20 Q3 ‘21 Q1 ‘22 Q1 ’23 Q1’24 Q1’24 Q1’24 15 20 20 20 15 20 20 20 20 20 20 20 62.8 Project Name Power Off-Taker Location Rated Capacity1 (MW) Actual Commercial Operation Date 2 PPA Term (Years) Total MW Operating FuelCell Energy Owned U.S. Generation Portfolio Overview On-Balance Sheet Generation Operating Portfolio as of April 30, 2026 |