Shareholder Report
Mar. 31, 2026
USD ($)
$ / shares
WHAT WERE THE FUND COSTS FOR THE PAST YEAR? (based on a hypothetical $10,000 investment)
|
Fund Name
|
Costs of a $10,000 investment
|
Costs paid as a percentage of a $10,000 investment
|
|
Osterweis Fund
|
$98
|
0.93%
|
HOW DID THE FUND PERFORM LAST YEAR AND WHAT AFFECTED ITS PERFORMANCE?
For the period April 1, 2025 to March 31, 2026, the Osterweis Fund (the Fund) generated a total return of 11.22% versus 17.80% for the S&P 500 Index.
Equity markets performed well for the vast majority of the previous fiscal year, with the S&P 500 notching solid gains in each of the first three quarters and delivering only modestly negative returns in the final quarter. The period started poorly following the announcement of global reciprocal tariffs on April 2, 2025, but shortly thereafter markets began a rally that lasted for most of the remaining fiscal year. Economic fundamentals were healthy throughout the period and corporate earnings were strong. Inflation was more stable than expected, and the AI buildout continued to be a tailwind for the markets. In addition, the Federal Reserve cut rates three times, which benefited nearly all asset classes. Sentiment finally shifted in March 2026, as concerns about the economic fallout from the conflict in Iran weighed down markets.
Our underperformance for the period was primarily due to security selection. Particularly during the first three fiscal quarters, S&P 500 returns were largely driven by a narrow subset of mega cap technology companies, some of which we did not own as they failed to meet our quality growth criteria (strong fundamentals, growing free cash flow, and reasonable valuations). In addition, our picks in Financials, Health Care, Consumer Discretionary, and Industrials each lagged their counterparts in the Index. However, our selections in Communications Services and Consumer Staples both outperformed.
Sector weighting was slightly additive to our relative performance, but not enough to offset the drag from security selection. Our underweight to Consumer Staples was most beneficial, followed by our overweight to Industrials. On the other hand, our zero exposure to Energy and our overweight to Real Estate both detracted from our relative performance. Our cash reserves generated a positive absolute return during the period but also modestly reduced our relative returns.
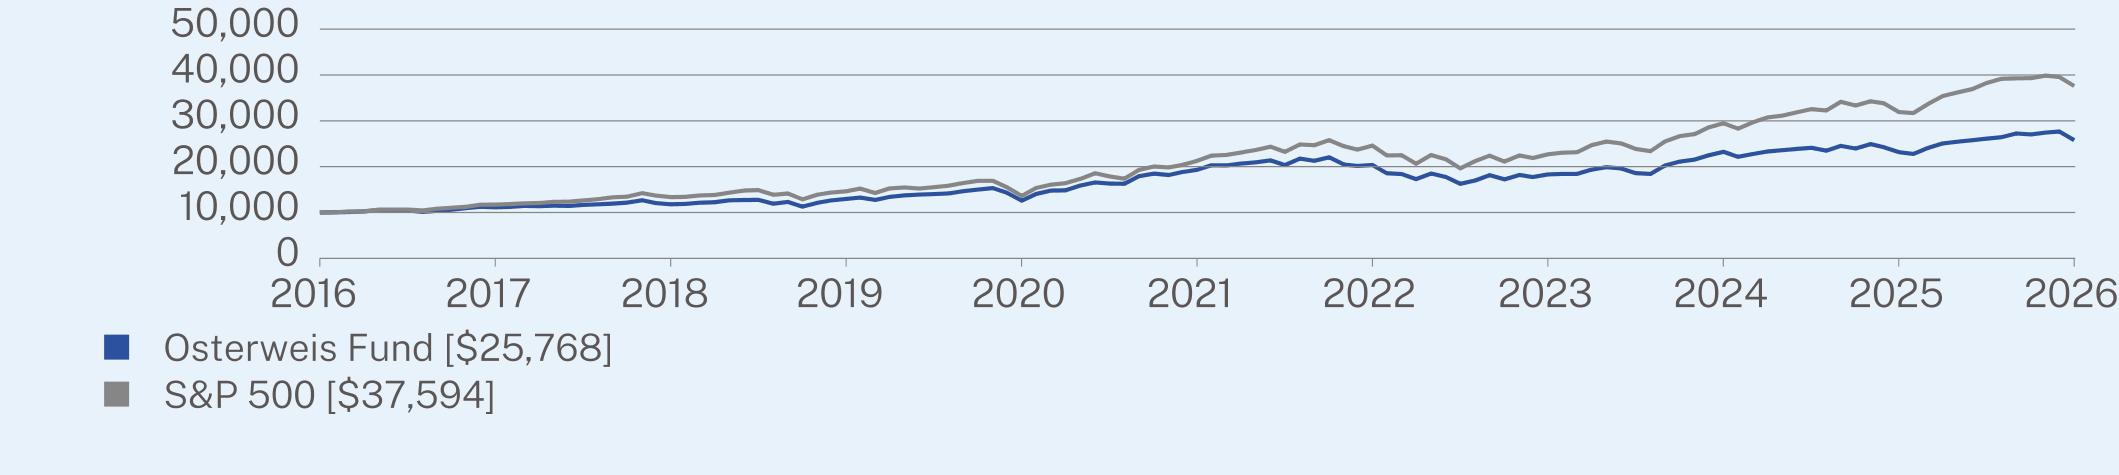
ANNUAL AVERAGE TOTAL RETURN (%)
|
|
1 Year
|
5 Year
|
10 Year
|
|
OSTFX (without sales charge)
|
11.22
|
5.94
|
9.93
|
|
S&P 500
|
17.80
|
12.06
|
14.16
|
Visit https://www.osterweis.com/mutual_funds/performance for more recent performance information.
KEY FUND STATISTICS (as of March 31, 2026)
|
Net Assets
|
$133,497,617
|
|
Number of Holdings
|
40
|
|
Net Advisory Fee
|
$1,107,587
|
|
Portfolio Turnover
|
42%
|
WHAT DID THE FUND INVEST IN? (as of March 31, 2026)
|
Top Holdings
|
(% of net assets)
|
|
Alphabet, Inc. - Class C
|
7.5%
|
|
Amazon.com, Inc.
|
4.1%
|
|
Microsoft Corp.
|
4.0%
|
|
Broadcom, Inc.
|
3.8%
|
|
Visa, Inc. - Class A
|
3.7%
|
|
Analog Devices, Inc.
|
3.7%
|
|
JPMorgan Chase & Co.
|
3.4%
|
|
Applied Materials, Inc.
|
3.2%
|
|
Waste Connections, Inc.
|
3.1%
|
|
AutoZone, Inc.
|
3.0%
|
WHAT WERE THE FUND COSTS FOR THE PAST YEAR? (based on a hypothetical $10,000 investment)
|
Fund Name
|
Costs of a $10,000 investment
|
Costs paid as a percentage of a $10,000 investment
|
|
Osterweis Growth & Income Fund
|
$102
|
0.97%
|
HOW DID THE FUND PERFORM LAST YEAR AND WHAT AFFECTED ITS PERFORMANCE?
For the period April 1, 2025 to March 31, 2026, the Osterweis Growth & Income Fund (the Fund) generated a total return of 9.76% versus 12.35% for the 60% S&P 500 Index/40% Bloomberg U.S. Aggregate Bond Index (the Agg).
Markets performed well for the vast majority of the fiscal year, with the S&P 500 notching solid gains in each of the first three quarters and delivering only modestly negative returns in the final quarter. Fixed income followed a similar pattern, with the Agg delivering positive returns each of the first three quarters before posting a minimal decline in the final quarter.
The announcement of global reciprocal tariffs on April 2, 2025, triggered a sharp selloff at the beginning of the period that impacted both stocks and bonds, but once the White House announced a pause on the program, markets began a rally that lasted for most of the remaining fiscal year. Economic fundamentals were relatively healthy throughout the period and corporate earnings were strong. Inflation was more stable than expected, despite the simmering trade war, and the AI buildout continued to be a tailwind. In addition, the Federal Reserve cut rates three times, which benefited nearly all asset classes. Sentiment finally shifted in March 2026, as concerns about the economic fallout from the conflict in Iran weighed down markets.
Our equity portfolio underperformed during the period primarily due to security selection. Particularly during the first three fiscal quarters, S&P 500 returns were largely driven by a narrow subset of mega cap technology companies, some of which we did not own as they failed to meet our quality growth criteria (strong fundamentals, growing free cash flow, and reasonable valuations). In addition, our picks in Financials, Consumer Discretionary, and Industrials each lagged their counterparts in the index. However, our selections in Communications Services and Consumer Staples were additive to our returns. Sector weighting also helped our relative performance, but not enough to offset the drag from security selection. Our underweight to Consumer Staples was most beneficial, followed by our overweight to Industrials.
Our fixed income portfolio outperformed the Agg over the course of the fiscal year. The first fiscal quarter was particularly favorable, as high yield bonds delivered materially stronger returns than investment grade. In the second and third fiscal quarters, declining interest rates benefited longer-duration securities and caused the fixed income portion of the Fund to trail the Agg due to its lower duration, though it continued to deliver positive absolute returns. In the final fiscal quarter, our fixed income returns were essentially flat and generally in line with the Agg.
Throughout the fiscal year, our allocation to fixed income, equity, and cash was largely unchanged, although we maintained a slightly more defensive posture in our fixed income portfolio than in our equity holdings, selectively adding longer-dated bonds when attractive opportunities arose. We believe this approach remains appropriate going forward, given the ongoing uncertainty related to inflation, monetary policy, and geopolitics.
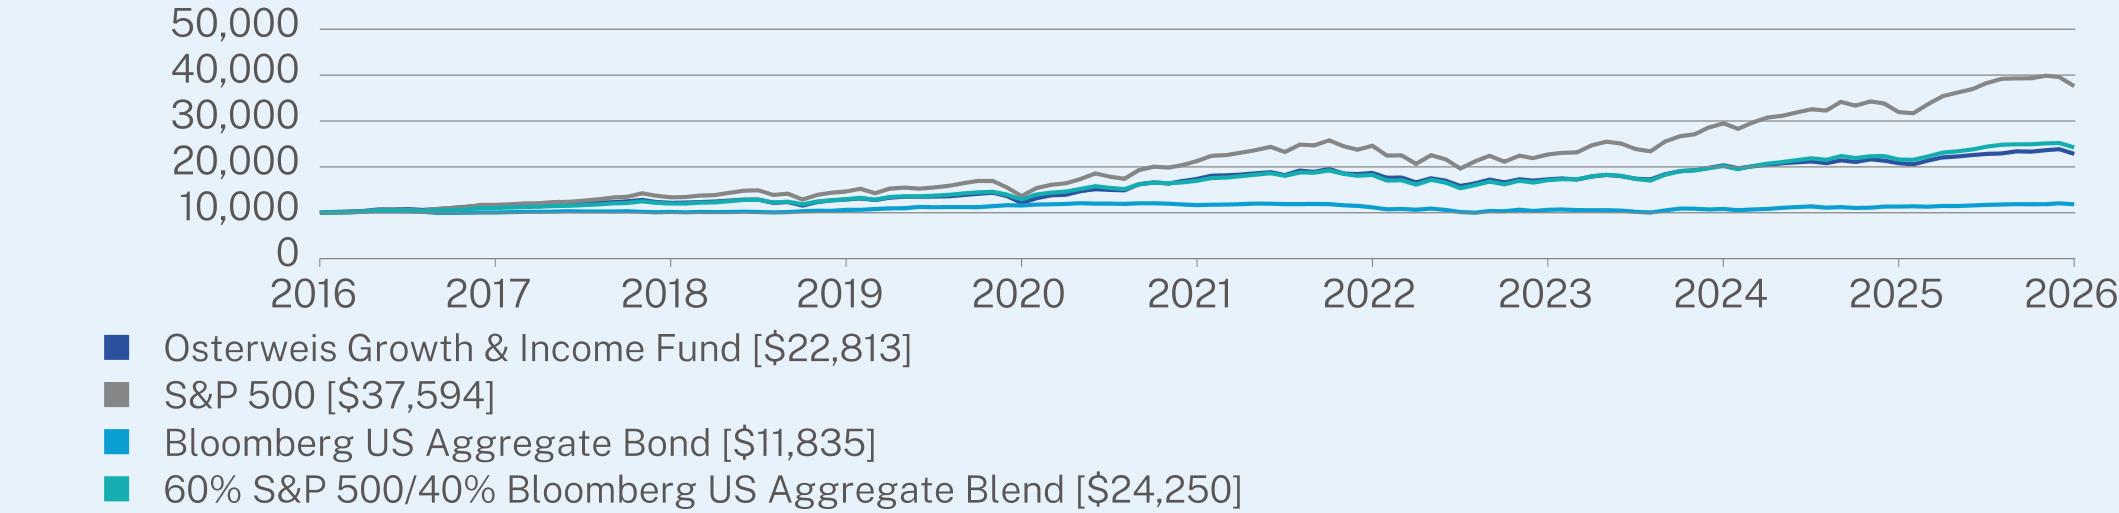
ANNUAL AVERAGE TOTAL RETURN (%)
|
|
1 Year
|
5 Year
|
10 Year
|
|
OSTVX (without sales charge)
|
9.76
|
5.61
|
8.60
|
|
S&P 500
|
17.80
|
12.06
|
14.16
|
|
Bloomberg US Aggregate Bond
|
4.35
|
0.31
|
1.70
|
|
60% S&P 500/40% Bloomberg US Aggregate Blend
|
12.35
|
7.41
|
9.26
|
Visit https://www.osterweis.com/mutual_funds/performance for more recent performance information.
KEY FUND STATISTICS (as of March 31, 2026)
|
Net Assets
|
$179,105,393
|
|
Number of Holdings
|
160
|
|
Net Advisory Fee
|
$1,379,256
|
|
Portfolio Turnover
|
46%
|
WHAT DID THE FUND INVEST IN? (as of March 31, 2026)
|
Top Holdings
|
(% of net assets)
|
|
Alphabet, Inc. - Class C
|
4.3%
|
|
Federated Hermes US Treasury Cash Reserves - Class Institutional
|
3.2%
|
|
Amazon.com, Inc.
|
2.4%
|
|
Microsoft Corp.
|
2.3%
|
|
Broadcom, Inc.
|
2.3%
|
|
Visa, Inc. - Class A
|
2.2%
|
|
Analog Devices, Inc.
|
2.1%
|
|
JPMorgan Chase & Co.
|
2.1%
|
|
Novartis AG - ADR
|
1.9%
|
|
AutoZone, Inc.
|
1.9%
|
WHAT WERE THE FUND COSTS FOR THE PAST YEAR? (based on a hypothetical $10,000 investment)
|
Fund Name
|
Costs of a $10,000 investment
|
Costs paid as a percentage of a $10,000 investment
|
|
Osterweis Opportunity Fund
|
$117
|
1.10%
|
HOW DID THE FUND PERFORM LAST YEAR AND WHAT AFFECTED ITS PERFORMANCE?
For the period April 1, 2025 to March 31, 2026, the Osterweis Opportunity Fund (the Fund) generated a total return of 13.34% versus 23.58% for the Russell 2000 Growth Index.
The small cap growth market performed quite well during the fiscal year, particularly during the first three fiscal quarters. The period opened with a sharp selloff following the announcement of global reciprocal tariffs on April 2, 2025, but as soon as the White House paused the program, markets began a rally that lasted the majority of the fiscal year. Economic fundamentals were healthy throughout the period despite the simmering trade war, and corporate earnings were strong. In addition, the Federal Reserve cut rates three times, which benefited nearly all asset classes. Sentiment finally shifted in the fourth fiscal quarter, primarily due to concerns about the economic fallout from the conflict in Iran.
Although it was a bullish stretch for small cap growth stocks, it was still challenging for active managers, as lower-quality businesses and non-earners outperformed companies with solid fundamentals. The Fund’s underperformance was mostly driven by security selection, particularly within Health Care, where investor interest narrowed largely to speculative biotechnology stocks. Our medical device and life sciences tools companies underperformed despite strong revenue growth and increasing margins. Our picks in Consumer Discretionary, Real Estate, and Energy also lagged their index counterparts.
These headwinds were partially offset by positive security selection in Information Technology and, to a lesser extent, Consumer Staples. Within Information Technology, holdings exposed to semiconductor and hardware companies supporting AI infrastructure contributed positively, benefiting from strong demand in data centers, defense, and communications markets.
For the fiscal year, our underperformance was also partially driven by our sector allocation. The biggest negative factor was our underweight to Industrials, followed by our zero weight in Materials and our underweight to Energy.
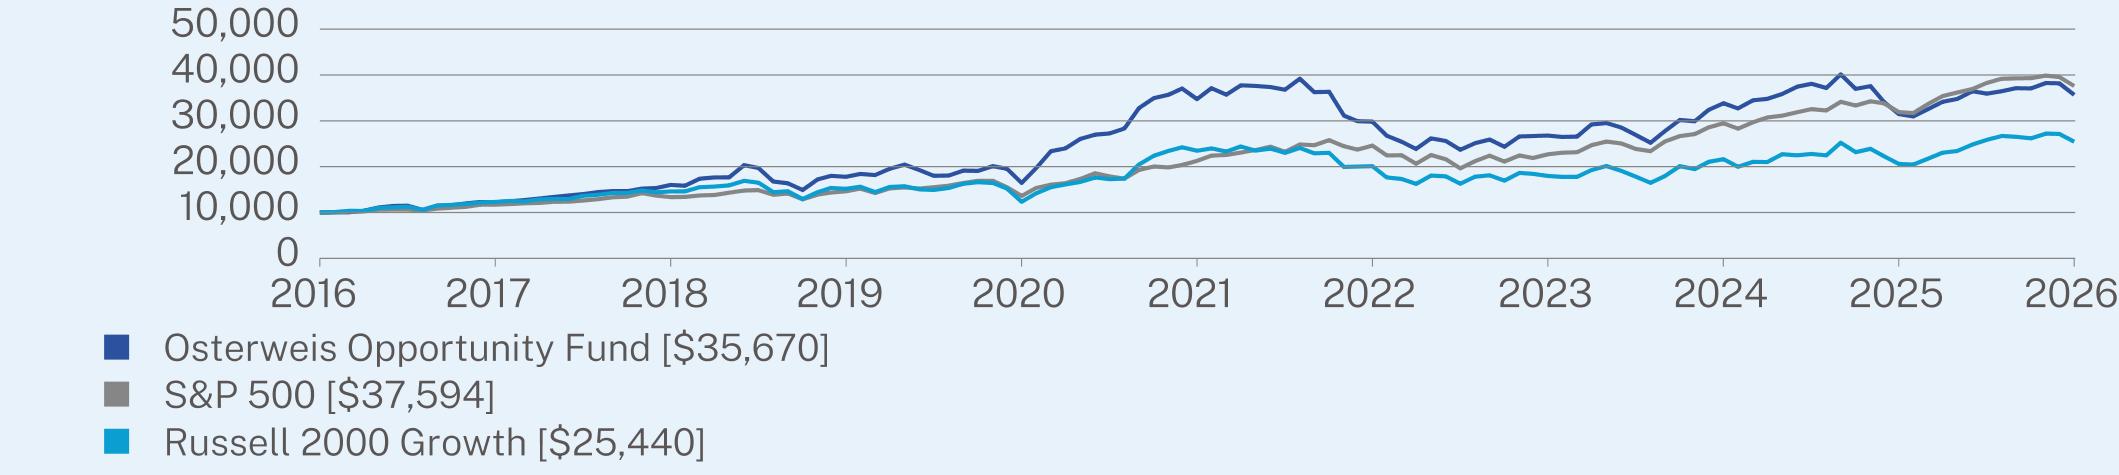
ANNUAL AVERAGE TOTAL RETURN (%)
|
|
1 Year
|
5 Year
|
10 Year
|
|
OSTGX (without sales charge)
|
13.34
|
0.53
|
13.56
|
|
S&P 500
|
17.80
|
12.06
|
14.16
|
|
Russell 2000 Growth
|
23.58
|
1.62
|
9.79
|
Visit https://www.osterweis.com/mutual_funds/performance for more recent performance information.
KEY FUND STATISTICS (as of March 31, 2026)
|
Net Assets
|
$287,197,037
|
|
Number of Holdings
|
42
|
|
Net Advisory Fee
|
$2,798,679
|
|
Portfolio Turnover
|
178%
|
WHAT DID THE FUND INVEST IN? (as of March 31, 2026)
|
Top Holdings
|
(% of net assets)
|
|
Federated Hermes US Treasury Cash Reserves - Class Institutional
|
9.5%
|
|
Axos Financial, Inc.
|
3.7%
|
|
Life Time Group Holdings, Inc.
|
3.7%
|
|
Guardant Health, Inc.
|
3.6%
|
|
CECO Environmental Corp.
|
3.6%
|
|
VSE Corp.
|
3.5%
|
|
Vericel Corp.
|
3.4%
|
|
Novanta, Inc.
|
3.3%
|
|
Fabrinet
|
3.2%
|
|
Casella Waste Systems, Inc. - Class A
|
3.1%
|
WHAT WERE THE FUND COSTS FOR THE PAST YEAR? (based on a hypothetical $10,000 investment)
|
Fund Name
|
Costs of a $10,000 investment
|
Costs paid as a percentage of a $10,000 investment
|
|
Osterweis Strategic Income Fund
|
$87
|
0.85%
|
HOW DID THE FUND PERFORM LAST YEAR AND WHAT AFFECTED ITS PERFORMANCE?
For the period April 1, 2025 to March 31, 2026, the Osterweis Strategic Income Fund (the Fund) generated a total return of 4.69% versus 4.35% for the Bloomberg U.S. Aggregate Bond Index (the Agg).
The past fiscal year was a fluid stretch for bond investors that included shifting interest rate expectations, changes in Federal Reserve policy, and episodes of geopolitical and economic uncertainty. Fixed income markets alternated between periods driven by falling interest rates and risk-on sentiment and periods marked by renewed inflation concerns and market volatility.
During the first fiscal quarter, risk assets rallied amid abundant liquidity, and high yield bonds performed well, benefiting the Fund. In the second and third fiscal quarters, declining interest rates favored longer-duration securities, and the Fund lagged the Agg due to its lower duration, though it continued to deliver positive absolute returns.
In the final fiscal quarter, markets were influenced by heightened geopolitical tensions and renewed concerns about inflation, particularly related to energy prices. The Fund’s performance during the quarter was essentially flat and generally in line with the Agg, as its defensive duration positioning helped offset weakness in segments of the high yield market.
Throughout the fiscal year, we maintained a defensive posture, keeping plenty of dry powder on hand and selectively adding longer-dated securities. We believe this approach remains appropriate given the ongoing uncertainty related to inflation, monetary policy, and geopolitics.
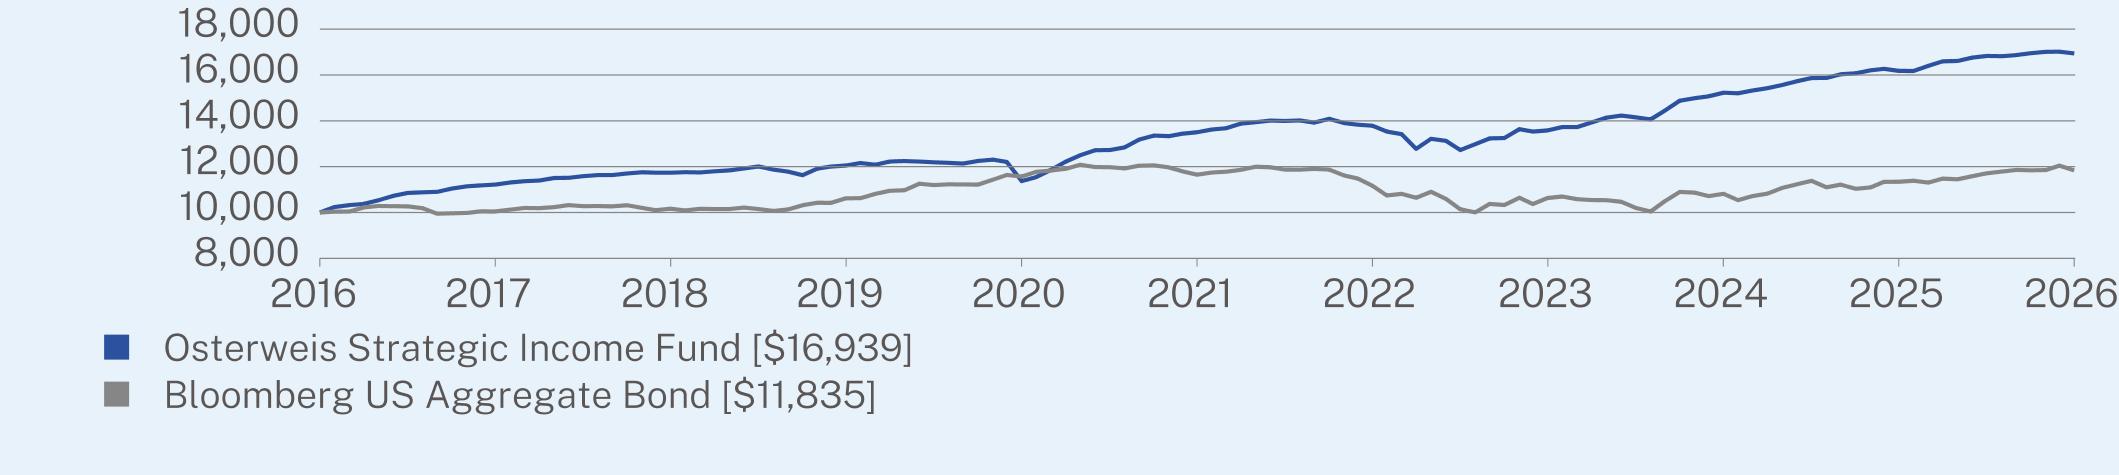
ANNUAL AVERAGE TOTAL RETURN (%)
|
|
1 Year
|
5 Year
|
10 Year
|
|
OSTIX (without sales charge)
|
4.69
|
4.64
|
5.41
|
|
Bloomberg US Aggregate Bond
|
4.35
|
0.31
|
1.70
|
Visit https://www.osterweis.com/mutual_funds/performance for more recent performance information.
KEY FUND STATISTICS (as of March 31, 2026)
|
Net Assets
|
$5,731,127,247
|
|
Number of Holdings
|
165
|
|
Net Advisory Fee
|
$40,883,950
|
|
Portfolio Turnover
|
37%
|
WHAT DID THE FUND INVEST IN? (as of March 31, 2026)
|
Top Holdings
|
(% of net assets)
|
|
MSILF Treasury Securities Portfolio - Class Institutional
|
2.3%
|
|
Federated Hermes US Treasury Cash Reserves - Class Institutional
|
2.3%
|
|
First American US Treasury Money Market Fund - Class X
|
2.2%
|
|
Unisys Corp.
|
1.3%
|
|
Oxford Finance LLC / Oxford Finance Co.-Issuer II, Inc.
|
1.2%
|
|
HAT Holdings I LLC / HAT Holdings II LLC
|
1.1%
|
|
Coeur Mining, Inc.
|
1.1%
|
|
KeHE Distributors LLC / KeHE Finance Corp. / NextWave Distribution, Inc.
|
1.1%
|
|
WESCO Distribution, Inc.
|
1.1%
|
|
Pitney Bowes, Inc.
|
1.1%
|