v3.26.1
Shareholder Report
6 Months Ended
Mar. 31, 2026
USD ($)
Holdings
Shareholder Report [Line Items]  
Document Type N-CSRS
Amendment Flag false
Registrant Name GreenFi Funds Trust
Entity Central Index Key 0001594854
Entity Investment Company Type N-1A
Document Period End Date Mar. 31, 2026
Shareholder Report Annual or Semi-Annual semi-annual shareholder report
GreenFi Redwood Fund  
Shareholder Report [Line Items]  
Fund Name GreenFi Redwood Fund
Class Name GreenFi Redwood Fund
Trading Symbol REDWX
Annual or Semi-Annual Statement [Text Block] This semi-annual shareholder report contains important information about GreenFi Redwood Fund (the "Fund") for the period October 1, 2025 to March 31, 2026.
Shareholder Report Annual or Semi-Annual semi-annual shareholder report
Additional Information [Text Block] You can find additional information about the Fund at https://funds.greenfi.com/redwood. You can also request this information by contacting us at 800 683-8529.
Additional Information Phone Number 800 683-8529
Additional Information Website https://funds.greenfi.com/redwood
Expenses [Text Block]

What were the Fund costs for the past six months?

(based on a hypothetical $10,000 investment)

Fund Name
Costs of a $10,000 investment
Costs paid as a percentage of a $10,000 investment
GreenFi Redwood Fund
$125
1.28
¹Annualized
Expenses Paid, Amount $ 125
Expense Ratio, Percent 1.28% [1]
Net Assets $ 135,749,050
Holdings Count | Holdings 48
Investment Company, Portfolio Turnover 11.90%
Additional Fund Statistics [Text Block]

Key Fund Statistics

(as of March 31, 2026)

Net Assets
$135,749,050
Number of Holdings
48
Portfolio Turnover Rate
11.90%
Holdings [Text Block]

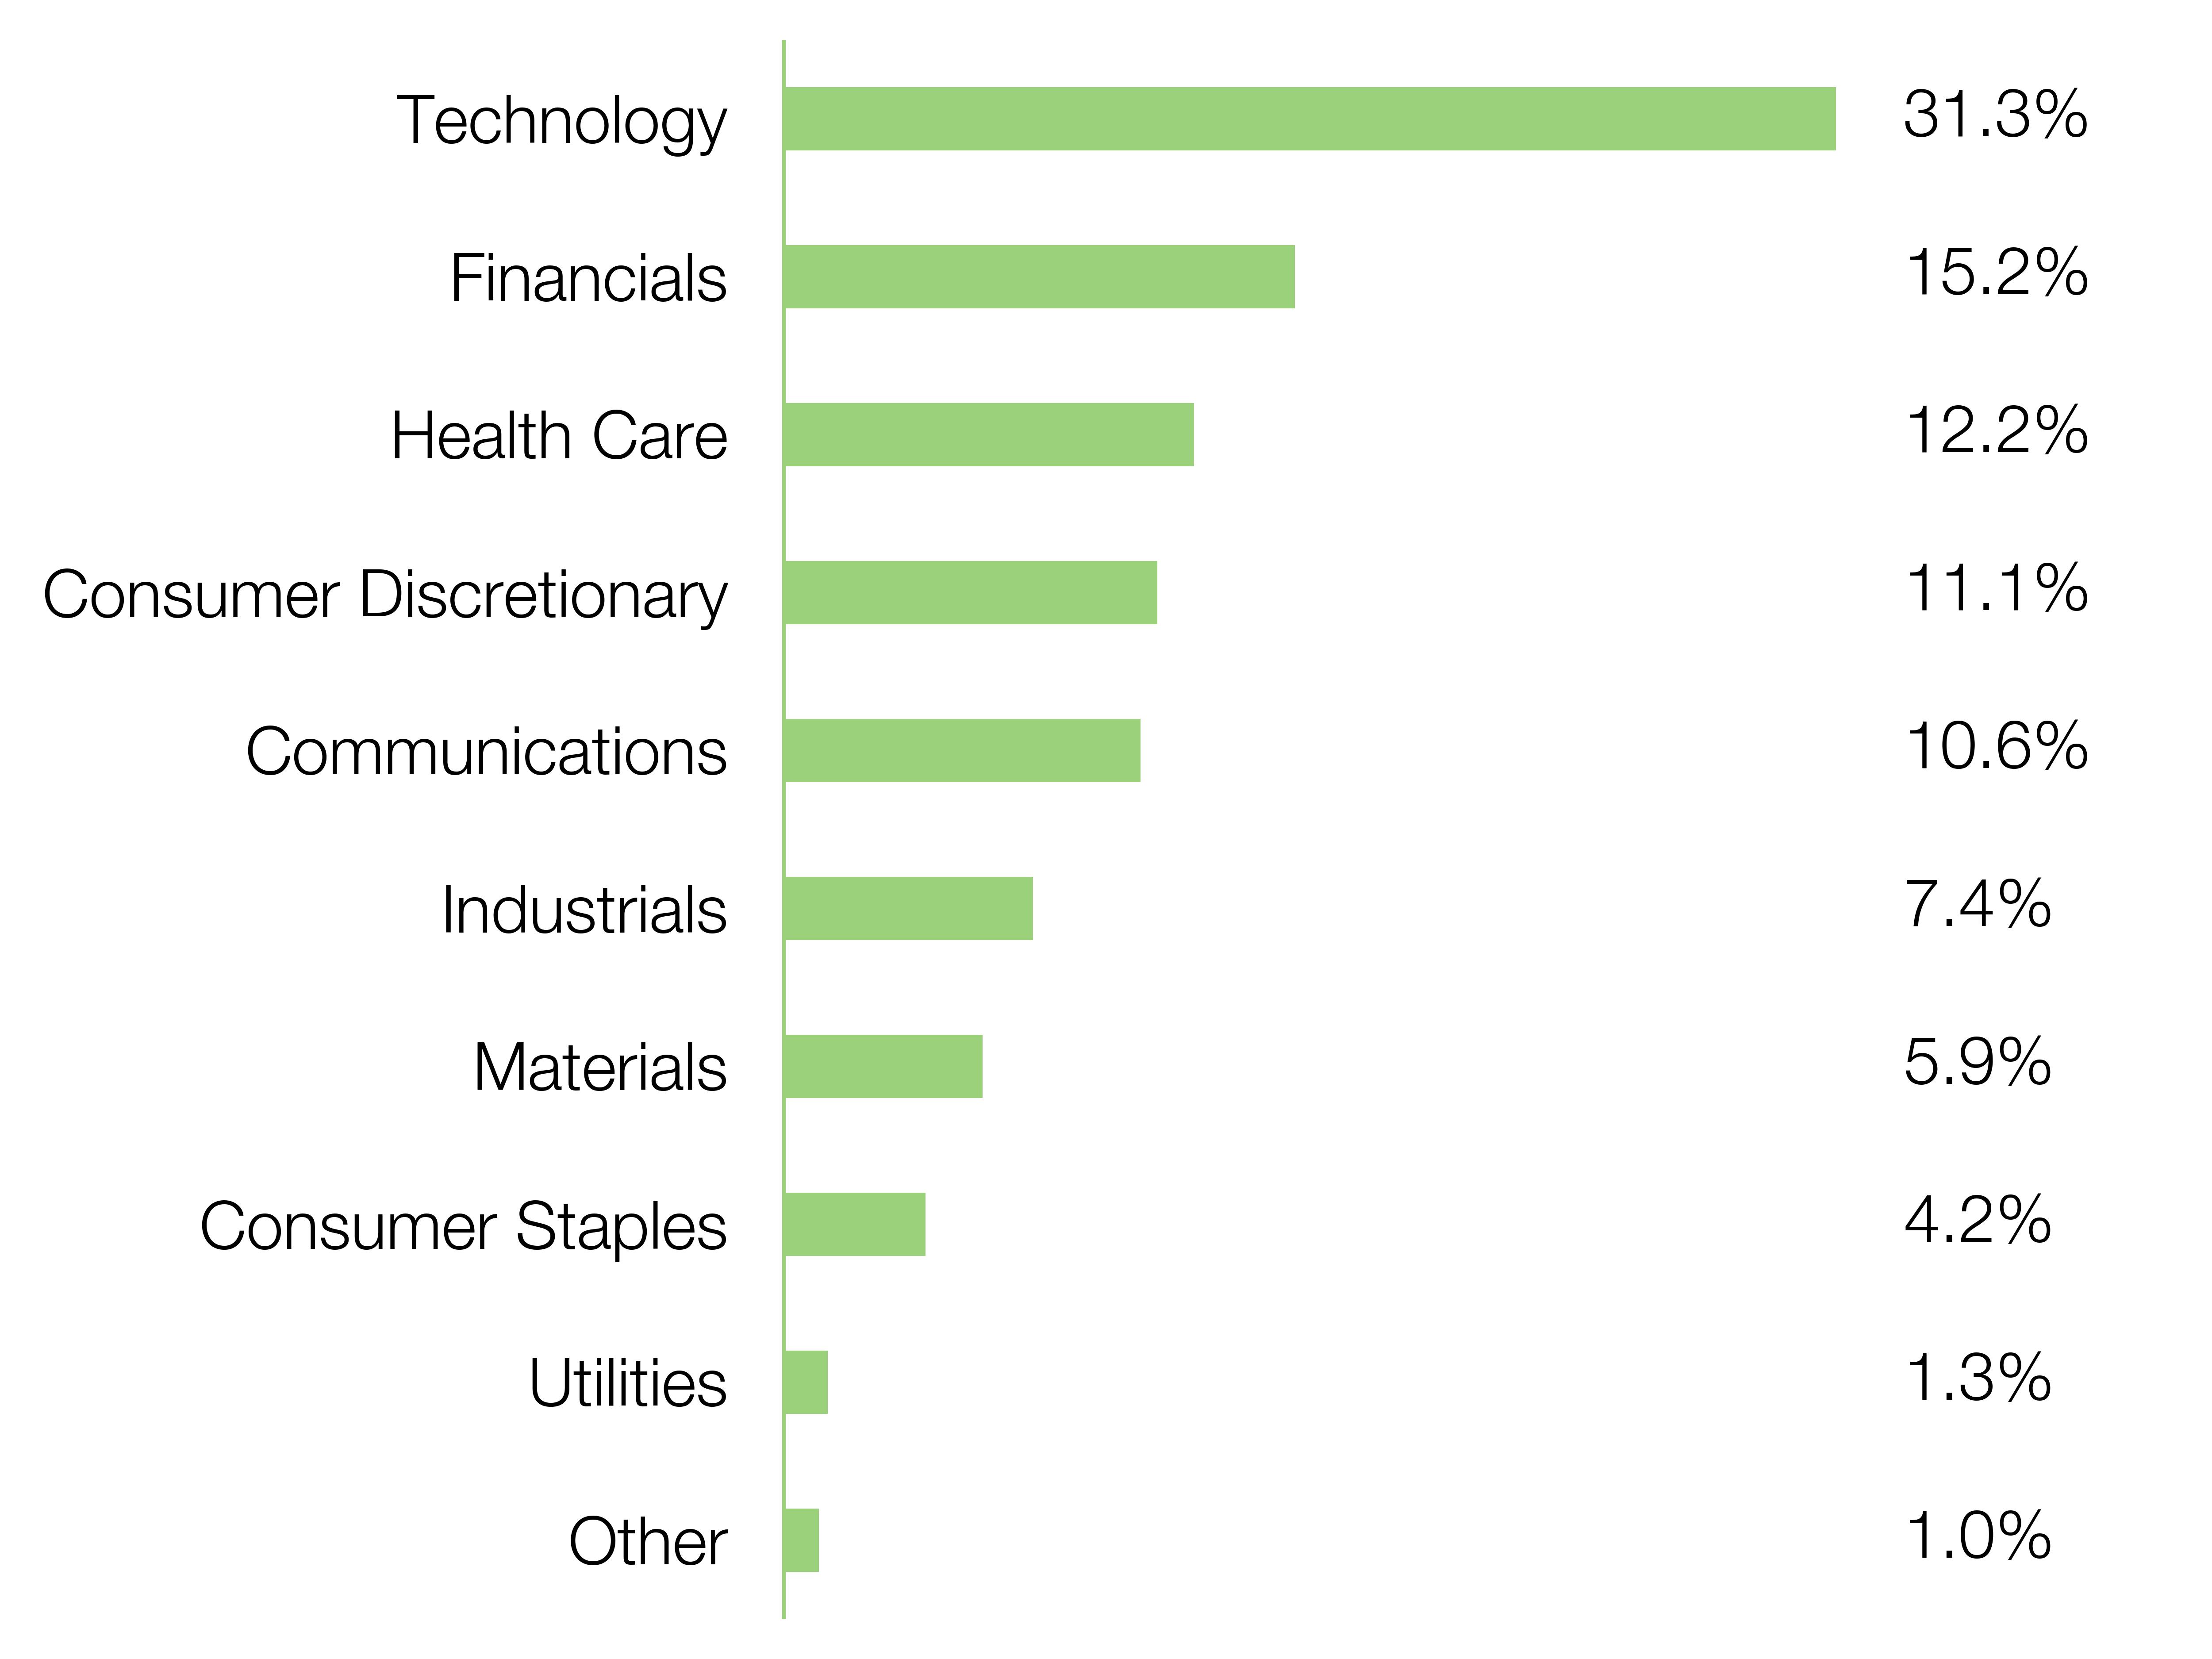
What did the Fund invest in?

(as of March 31, 2026)

Sector Breakdown (% of net assets)

sector
%
Technology
0.313
Financials
0.152
Health Care
0.122
Consumer Discretionary
0.111
Communications
0.106
Industrials
0.074
Materials
0.059
Consumer Staples
0.042
Utilities
0.013
Other
0.010
bar


Largest Holdings [Text Block]
Top Ten Holdings
(% of net assets)
NVIDIA Corp
7.6%
Alphabet Inc
7.6%
Microsoft Corp
6.3%
Amazon.com Inc
4.8%
Visa Inc
3.6%
Costco Wholesale Corp
3.0%
Broadcom Inc
3.0%
Eli Lilly & Co
2.9%
TJX Cos Inc/The
2.9%
Apple Inc
2.8%
[1] Annualized