Pay Versus Performance Disclosure
As required by Section 953(a) of the Dodd-Frank Wall Street Reform and Consumer Protection Act and Item 402(v) of Regulation S-K, we are providing the following disclosure regarding executive compensation for our principal executive officer (“PEO”) and non-PEO named executive officers (“NEOs”) and Company performance for the fiscal years listed below. The Board did not consider the pay versus performance disclosure below in making its pay decisions for the year shown. For the most recently completed fiscal year, as a smaller reporting company, the Company was exempt from providing peer group total shareholder return (TSR) and did not use any “financial performance measures” as defined Item 402(v) of Regulation S-K to link compensation paid to the NEOs. Accordingly, we have omitted the tabular list of financial performance measures and the table below does not include a column for a “Company-Selected Measure” or “Peer Group TSR” as defined in Item 402(v) of Regulation S-K.
As described in more detail above under “Summary Compensation Table,” the Company’s executive compensation program reflects a performance-driven compensation philosophy and the Company generally seeks to incentivize long-term performance, and therefore does not specifically align the Company’s performance measures with “compensation actually paid” (as computed in accordance with Item 402(v) of Regulation S-K) for a particular year. In accordance with Item 402(v) of Regulation S-K, the Company is providing the following descriptions of the relationships between information presented in the Pay Versus Performance table.
| Year(1) | Summary Compensation Table Total for PEO Tabar(2) | Summary Compensation Table Total for Former PEO Bullet(2) | Compensation Actually Paid to PEO Tabar(3) | Compensation Actually Paid to PEO Bullet(3) | Average Summary Compensation Table Total for Non-PEO NEOs(4) | Average Compensation Actually Paid to Non-PEO NEOs(5) | Value of Initial Fixed $100 Investment Based on Total Shareholder Return (TSR”)(6) | Net Income (Loss) (in actuals, USD)(7) | ||||||||||||||||||||||||
| (a) | (b) | (b) | (c) | (c) | (d) | (e) | (f) | (h) | ||||||||||||||||||||||||
| 2025 | $ | 4,065,900 | $ | 4,065,900 | $ | 2,542,064 | $ | 2,449,458 | $ | (68.26 | ) | $ | (80,316,584 | ) | ||||||||||||||||||
| 2024 | $ | 4,822,650 | $ | 4,822,650 | $ | 3,435,542 | $ | 3,341,054 | $ | (51.81 | ) | $ | 28,305,810 | |||||||||||||||||||
| 2023 | $ | 1,614,500 | $ | 1,125,000 | $ | 1,614,500 | $ | 1,125,242 | $ | 1,830,730 | $ | 1,830,850 | $ | (30.43 | ) | $ | (13,893,281 | ) | ||||||||||||||
| (1) | We were a smaller reporting company pursuant to Rule 405 of the Securities Act through December 31, 2025, and as such, we are only required to include information for the past three fiscal years in this table. |
| (2) | The dollar amounts reported in column (b) are the amounts of total compensation reported for Sam Tabar (our CEO from March 31, 2023) and Bryan Bullett (our former CEO until March 31, 2023). The “Total” column of the Summary Compensation Table (“SCT”) refers to “Executive Compensation — Summary Compensation Table for Fiscal 2025, 2024, and 2023 herein. |
| (3) | The dollar amounts reported for Compensation Actually Paid (“CAP”) in column (c) reflects the total compensation reported in column (b) for the applicable year adjusted to include or exclude the amounts shown in the tables below for the Company’s PEOs, as computed in accordance with Item 402(v) of Regulation S-K: |
| Reconciliation of SCT to CAP – PEO Tabar | ||||||||||||||||||||
| Equity Award Adjustments | ||||||||||||||||||||
| Deduct: | Add: | |||||||||||||||||||
| Fiscal Year | Summary Compensation Table Total for PEO Tabar | Value of Equity Awards Reported in Summary Compensation Table | Vesting Date Fair Value of Awards Granted and Vested During the Year | Total Equity Award Adjustments | Compensation Actually Paid to PEO | |||||||||||||||
| ($) | ($)(a) | ($)(b) | ($)(b) | ($) | ||||||||||||||||
| 2025 | 4,065,900 | (2,865,900 | ) | 2,865,900 | 2,865,900 | 4,065,900 | ||||||||||||||
| 2024 | 4,822,650 | (3,222,650 | ) | 3,222,650 | 3,222,650 | 4,822,650 | ||||||||||||||
| 2023 | 1,614,500 | (1,239,500 | ) | 1,239,500 | 1,239,500 | 1,614,500 | ||||||||||||||
| (a) | The amount in this column corresponds with the full grant date fair value, calculated in accordance with ASC 718, of “Stock Awards” for our PEO Tabar as reported in our Summary Compensation Table above. |
| (b) | The equity award adjustments were calculated in accordance with the SEC methodology for determining CAP for each year shown. The amounts in these columns were determined by reference to the closing price of our Ordinary Shares on the applicable vesting date. |
| Reconciliation of SCT to CAP – Former PEO Bullett | ||||||||||||||||
| Equity Award Adjustments | ||||||||||||||||
| Deduct: | Add/(Deduct): | |||||||||||||||
| Fiscal Year | Summary Compensation Table Total for PEO Bullett | Year Over Year Change in Fair Value of Outstanding and Unvested Awards | Change in Fair Value of Awards Granted in Prior Years which Vested During the Year | Total Equity Award Adjustments | Compensation Actually Paid to PEO | |||||||||||
| ($) | ($)(a) | ($)(a) | ($)(a) | ($) | ||||||||||||
| 2023 | 1,125,000 | 242 | 242 | 1,125,242 | ||||||||||||
| (a) | The equity award adjustments were calculated in accordance with the SEC methodology for determining CAP for each year shown. The amounts in these columns were determined by reference to the closing price of our Ordinary Shares on the applicable year end date and/or vesting date. |
| (4) | The dollar amounts reported in column (d) represent the average of the amounts reported for the NEOs as a group (excluding our PEO) in the “Total” column of the Summary Compensation Table in each applicable year. Refer to “Executive Compensation — Summary Compensation Table for Fiscal 2025, 2024 and 2023” herein. The NEO (excluding our PEO) included for purposes of calculating the average amounts in each applicable year is Erke Huang for Fiscal 2025, 2024 and 2023; Sam Tabar for Fiscal 2023 until March 30, 2023, Thomas Sanfilippo for Fiscal 2024 and Justin Zhu for Fiscal 2025. |
| (5) | The dollar amounts reported in column (e) reflect the average compensation reported in column (d) for the applicable year adjusted to include or exclude the amounts shown in the tables below for the Company’s NEOs, as computed in accordance with Item 402(v) of Regulation S-K: |
| Reconciliation of Average Summary Compensation Table Total Compensation for Non-CEO NEOs to CAP | ||||||||||||||||||||||||||||||||
| Equity Award Adjustments | ||||||||||||||||||||||||||||||||
| Deduct: | Add: | Deduct: | Add: | Add/(Deduct): | ||||||||||||||||||||||||||||
| Fiscal Year | Average Summary Compensation Table Total for Non-CEO NEOs | Value of Equity Awards Reported in Summary Compensation Table | Year End Fair Value of Awards Granted During the Year which were Unvested at Year End | Year Over Year Change in Fair Value of Outstanding and Unvested Awards | Vesting Date Fair Value of Awards Granted and Vested During the Year | Change in Fair Value of Awards Granted in Prior Years which Vested During the Year | Total Equity Award Adjustments | Average Compensation Actually Paid to Non-CEO NEOs | ||||||||||||||||||||||||
| ($) | ($)(a) | ($)(b) | ($)(b) | ($)(b) | ($)(b) | ($) | ($) | |||||||||||||||||||||||||
| 2025 | 2,542,064 | (1,521,494 | ) | (1,563 | ) | 1,432,950 | (2,500 | ) | 1,428,888 | 2,449,458 | ||||||||||||||||||||||
| 2024 | 3,435,542 | (2,485,519 | ) | 629,206 | 1,761,825 | 2,391,031 | 3,341,054 | |||||||||||||||||||||||||
| 2023 | 1,830,730 | (2,038,250 | ) | 2,038,250 | 121 | 2,038,371 | 1,830,850 | |||||||||||||||||||||||||
| (a) | The amount in this column corresponds with the full grant date fair value, calculated in accordance with ASC 718, of “Stock Awards” for our non-PEO NEOs as reported in our Summary Compensation Table above. |
| (b) | The equity award adjustments were calculated in accordance with the SEC methodology for determining CAP for each year shown. The amounts in these columns were determined by reference to the closing price of our Ordinary Shares on the applicable year end date and/or vesting date. |
| (6) | The Company did not pay any dividends on Ordinary Shares during the measurement period. Accordingly, cumulative TSR is calculated by dividing the difference between the Company’s share price at the end and the beginning of the measurement period by the Company’s share price at the beginning of the measurement period. |
| (7) | The dollar amounts reported represent the amount of net loss reflected in the Company’s audited financial statements for the applicable year. The Company does not use net (loss) income as a performance measure in its executive compensation program. |
| Reconciliation of SCT to CAP – PEO Tabar | ||||||||||||||||||||
| Equity Award Adjustments | ||||||||||||||||||||
| Deduct: | Add: | |||||||||||||||||||
| Fiscal Year | Summary Compensation Table Total for PEO Tabar | Value of Equity Awards Reported in Summary Compensation Table | Vesting Date Fair Value of Awards Granted and Vested During the Year | Total Equity Award Adjustments | Compensation Actually Paid to PEO | |||||||||||||||
| ($) | ($)(a) | ($)(b) | ($)(b) | ($) | ||||||||||||||||
| 2025 | 4,065,900 | (2,865,900 | ) | 2,865,900 | 2,865,900 | 4,065,900 | ||||||||||||||
| 2024 | 4,822,650 | (3,222,650 | ) | 3,222,650 | 3,222,650 | 4,822,650 | ||||||||||||||
| 2023 | 1,614,500 | (1,239,500 | ) | 1,239,500 | 1,239,500 | 1,614,500 | ||||||||||||||
| (a) | The amount in this column corresponds with the full grant date fair value, calculated in accordance with ASC 718, of “Stock Awards” for our PEO Tabar as reported in our Summary Compensation Table above. |
| (b) | The equity award adjustments were calculated in accordance with the SEC methodology for determining CAP for each year shown. The amounts in these columns were determined by reference to the closing price of our Ordinary Shares on the applicable vesting date. |
| Reconciliation of SCT to CAP – Former PEO Bullett | ||||||||||||||||
| Equity Award Adjustments | ||||||||||||||||
| Deduct: | Add/(Deduct): | |||||||||||||||
| Fiscal Year | Summary Compensation Table Total for PEO Bullett | Year Over Year Change in Fair Value of Outstanding and Unvested Awards | Change in Fair Value of Awards Granted in Prior Years which Vested During the Year | Total Equity Award Adjustments | Compensation Actually Paid to PEO | |||||||||||
| ($) | ($)(a) | ($)(a) | ($)(a) | ($) | ||||||||||||
| 2023 | 1,125,000 | 242 | 242 | 1,125,242 | ||||||||||||
| (a) | The equity award adjustments were calculated in accordance with the SEC methodology for determining CAP for each year shown. The amounts in these columns were determined by reference to the closing price of our Ordinary Shares on the applicable year end date and/or vesting date. |
| Reconciliation of Average Summary Compensation Table Total Compensation for Non-CEO NEOs to CAP | ||||||||||||||||||||||||||||||||
| Equity Award Adjustments | ||||||||||||||||||||||||||||||||
| Deduct: | Add: | Deduct: | Add: | Add/(Deduct): | ||||||||||||||||||||||||||||
| Fiscal Year | Average Summary Compensation Table Total for Non-CEO NEOs | Value of Equity Awards Reported in Summary Compensation Table | Year End Fair Value of Awards Granted During the Year which were Unvested at Year End | Year Over Year Change in Fair Value of Outstanding and Unvested Awards | Vesting Date Fair Value of Awards Granted and Vested During the Year | Change in Fair Value of Awards Granted in Prior Years which Vested During the Year | Total Equity Award Adjustments | Average Compensation Actually Paid to Non-CEO NEOs | ||||||||||||||||||||||||
| ($) | ($)(a) | ($)(b) | ($)(b) | ($)(b) | ($)(b) | ($) | ($) | |||||||||||||||||||||||||
| 2025 | 2,542,064 | (1,521,494 | ) | (1,563 | ) | 1,432,950 | (2,500 | ) | 1,428,888 | 2,449,458 | ||||||||||||||||||||||
| 2024 | 3,435,542 | (2,485,519 | ) | 629,206 | 1,761,825 | 2,391,031 | 3,341,054 | |||||||||||||||||||||||||
| 2023 | 1,830,730 | (2,038,250 | ) | 2,038,250 | 121 | 2,038,371 | 1,830,850 | |||||||||||||||||||||||||
| (a) | The amount in this column corresponds with the full grant date fair value, calculated in accordance with ASC 718, of “Stock Awards” for our non-PEO NEOs as reported in our Summary Compensation Table above. |
| (b) | The equity award adjustments were calculated in accordance with the SEC methodology for determining CAP for each year shown. The amounts in these columns were determined by reference to the closing price of our Ordinary Shares on the applicable year end date and/or vesting date. |
Compensation Actually Paid and Performance Measures
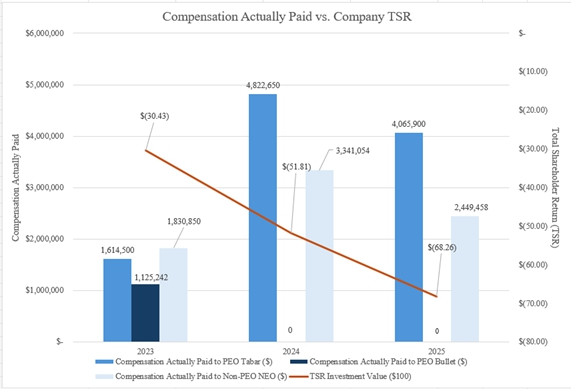
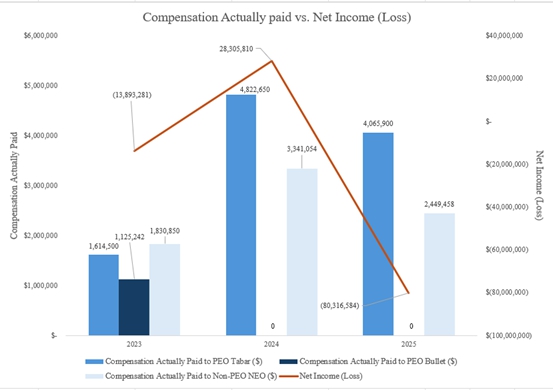
The charts below show, for the past three years, the relationship between the compensation actually paid to our PEO and the average compensation actually paid to our non-PEO NEOs as a group to (i) the Company’s cumulative TSR; and (ii) the Company’s net loss.
| [1] | The dollar amounts reported in column (d) represent the average of the amounts reported for the NEOs as a group (excluding our PEO) in the “Total” column of the Summary Compensation Table in each applicable year. Refer to “Executive Compensation — Summary Compensation Table for Fiscal 2025, 2024 and 2023” herein. The NEO (excluding our PEO) included for purposes of calculating the average amounts in each applicable year is Erke Huang for Fiscal 2025, 2024 and 2023; Sam Tabar for Fiscal 2023 until March 30, 2023, Thomas Sanfilippo for Fiscal 2024 and Justin Zhu for Fiscal 2025. | |||||||||||||||||||||||||||||||||||||||||||||||||||||||||||||||||||||||||||||||||||||||||||||||||||||||||||||||||||||||||||||||||||||||||||||||||||||||||||||||||||||||||||||||||||||||||||||||||||||||||||||||||||||||||||||||||||||||||||||||||||||||||||||||||||||||||||||||||||||||
| [2] | We were a smaller reporting company pursuant to Rule 405 of the Securities Act through December 31, 2025, and as such, we are only required to include information for the past three fiscal years in this table. | |||||||||||||||||||||||||||||||||||||||||||||||||||||||||||||||||||||||||||||||||||||||||||||||||||||||||||||||||||||||||||||||||||||||||||||||||||||||||||||||||||||||||||||||||||||||||||||||||||||||||||||||||||||||||||||||||||||||||||||||||||||||||||||||||||||||||||||||||||||||
| [3] | The
dollar amounts reported in column (e) reflect the average compensation reported in column (d) for the applicable year adjusted
to include or exclude the amounts shown in the tables below for the Company’s NEOs, as computed in accordance with Item 402(v) of
Regulation S-K:
|
|||||||||||||||||||||||||||||||||||||||||||||||||||||||||||||||||||||||||||||||||||||||||||||||||||||||||||||||||||||||||||||||||||||||||||||||||||||||||||||||||||||||||||||||||||||||||||||||||||||||||||||||||||||||||||||||||||||||||||||||||||||||||||||||||||||||||||||||||||||||
| [4] | The Company did not pay any dividends on Ordinary Shares during the measurement period. Accordingly, cumulative TSR is calculated by dividing the difference between the Company’s share price at the end and the beginning of the measurement period by the Company’s share price at the beginning of the measurement period. | |||||||||||||||||||||||||||||||||||||||||||||||||||||||||||||||||||||||||||||||||||||||||||||||||||||||||||||||||||||||||||||||||||||||||||||||||||||||||||||||||||||||||||||||||||||||||||||||||||||||||||||||||||||||||||||||||||||||||||||||||||||||||||||||||||||||||||||||||||||||
| [5] | The dollar amounts reported represent the amount of net loss reflected in the Company’s audited financial statements for the applicable year. The Company does not use net (loss) income as a performance measure in its executive compensation program. | |||||||||||||||||||||||||||||||||||||||||||||||||||||||||||||||||||||||||||||||||||||||||||||||||||||||||||||||||||||||||||||||||||||||||||||||||||||||||||||||||||||||||||||||||||||||||||||||||||||||||||||||||||||||||||||||||||||||||||||||||||||||||||||||||||||||||||||||||||||||
| [6] | The dollar amounts reported in column (b) are the amounts of total compensation reported for Sam Tabar (our CEO from March 31, 2023) and Bryan Bullett (our former CEO until March 31, 2023). The “Total” column of the Summary Compensation Table (“SCT”) refers to “Executive Compensation — Summary Compensation Table for Fiscal 2025, 2024, and 2023 herein. | |||||||||||||||||||||||||||||||||||||||||||||||||||||||||||||||||||||||||||||||||||||||||||||||||||||||||||||||||||||||||||||||||||||||||||||||||||||||||||||||||||||||||||||||||||||||||||||||||||||||||||||||||||||||||||||||||||||||||||||||||||||||||||||||||||||||||||||||||||||||
| [7] | The
dollar amounts reported for Compensation Actually Paid (“CAP”) in column (c) reflects the total compensation reported
in column (b) for the applicable year adjusted to include or exclude the amounts shown in the tables below for the Company’s
PEOs, as computed in accordance with Item 402(v) of Regulation S-K:
|
|||||||||||||||||||||||||||||||||||||||||||||||||||||||||||||||||||||||||||||||||||||||||||||||||||||||||||||||||||||||||||||||||||||||||||||||||||||||||||||||||||||||||||||||||||||||||||||||||||||||||||||||||||||||||||||||||||||||||||||||||||||||||||||||||||||||||||||||||||||||
| [8] | The amount in this column corresponds with the full grant date fair value, calculated in accordance with ASC 718, of “Stock Awards” for our PEO Tabar as reported in our Summary Compensation Table above. | |||||||||||||||||||||||||||||||||||||||||||||||||||||||||||||||||||||||||||||||||||||||||||||||||||||||||||||||||||||||||||||||||||||||||||||||||||||||||||||||||||||||||||||||||||||||||||||||||||||||||||||||||||||||||||||||||||||||||||||||||||||||||||||||||||||||||||||||||||||||
| [9] | The equity award adjustments were calculated in accordance with the SEC methodology for determining CAP for each year shown. The amounts in these columns were determined by reference to the closing price of our Ordinary Shares on the applicable vesting date. | |||||||||||||||||||||||||||||||||||||||||||||||||||||||||||||||||||||||||||||||||||||||||||||||||||||||||||||||||||||||||||||||||||||||||||||||||||||||||||||||||||||||||||||||||||||||||||||||||||||||||||||||||||||||||||||||||||||||||||||||||||||||||||||||||||||||||||||||||||||||
| [10] | The equity award adjustments were calculated in accordance with the SEC methodology for determining CAP for each year shown. The amounts in these columns were determined by reference to the closing price of our Ordinary Shares on the applicable year end date and/or vesting date. | |||||||||||||||||||||||||||||||||||||||||||||||||||||||||||||||||||||||||||||||||||||||||||||||||||||||||||||||||||||||||||||||||||||||||||||||||||||||||||||||||||||||||||||||||||||||||||||||||||||||||||||||||||||||||||||||||||||||||||||||||||||||||||||||||||||||||||||||||||||||
| [11] | The amount in this column corresponds with the full grant date fair value, calculated in accordance with ASC 718, of “Stock Awards” for our non-PEO NEOs as reported in our Summary Compensation Table above. | |||||||||||||||||||||||||||||||||||||||||||||||||||||||||||||||||||||||||||||||||||||||||||||||||||||||||||||||||||||||||||||||||||||||||||||||||||||||||||||||||||||||||||||||||||||||||||||||||||||||||||||||||||||||||||||||||||||||||||||||||||||||||||||||||||||||||||||||||||||||
| [12] | The equity award adjustments were calculated in accordance with the SEC methodology for determining CAP for each year shown. The amounts in these columns were determined by reference to the closing price of our Ordinary Shares on the applicable year end date and/or vesting date. | |||||||||||||||||||||||||||||||||||||||||||||||||||||||||||||||||||||||||||||||||||||||||||||||||||||||||||||||||||||||||||||||||||||||||||||||||||||||||||||||||||||||||||||||||||||||||||||||||||||||||||||||||||||||||||||||||||||||||||||||||||||||||||||||||||||||||||||||||||||||