Shareholder Report
|
6 Months Ended |
|
Mar. 31, 2026
USD ($)
Holding
|
|---|
| Shareholder Report [Line Items] |
|
| Document Type |
N-CSRS
|
| Amendment Flag |
false
|
| Registrant Name |
Victory Portfolios IV
|
| Entity Central Index Key |
0002042316
|
| Entity Investment Company Type |
N-1A
|
| Document Period End Date |
Mar. 31, 2026
|
| Shareholder Report Annual or Semi-Annual |
semi-annual shareholder report
|
| C000256500 |
|
| Shareholder Report [Line Items] |
|
| Fund Name |
Victory Pioneer Strategic Income Fund
|
| Class Name |
Class A
|
| Trading Symbol |
PSRAX
|
| Annual or Semi-Annual Statement [Text Block] |
Semi-Annual Shareholder Report
|
| Additional Information [Text Block] |
You can find additional information about the Fund at advisor.vcm.com/literature/ mutual-fund-prospectuses. You may also request more information by calling 800-539-3863 or visiting vcm.com/contact-us.
|
| Additional Information Phone Number |
800-539-3863
|
| Additional Information Website |
vcm.com
|
| Expenses [Text Block] |
What were the Fund's costs for the last six months?(based on a hypothetical $10,000 investment) Table SummaryClass Name | Costs of a $10,000 Investment | Costs paid as a percentage of a $10,000 InvestmentFootnote Reference* |
|---|
Class A | $50 | 1.00% |
|---|
| | |
|---|
| Footnote | Description | Footnote* | Annualized |
|
| Expenses Paid, Amount |
$ 50
|
| Expense Ratio, Percent |
1.00%
|
| AssetsNet |
$ 3,725,684,000
|
| Holdings Count | Holding |
1,196
|
| InvestmentCompanyPortfolioTurnover |
43.00%
|
| Additional Fund Statistics [Text Block] |
FUND STATISTICS($ amounts in 000s)(as of March 31, 2026)Table SummaryNet Assets | $3,725,684 |
|---|
Number of Holdings | 1,196 |
|---|
Portfolio Turnover | 43% |
|---|
|
| Holdings [Text Block] |
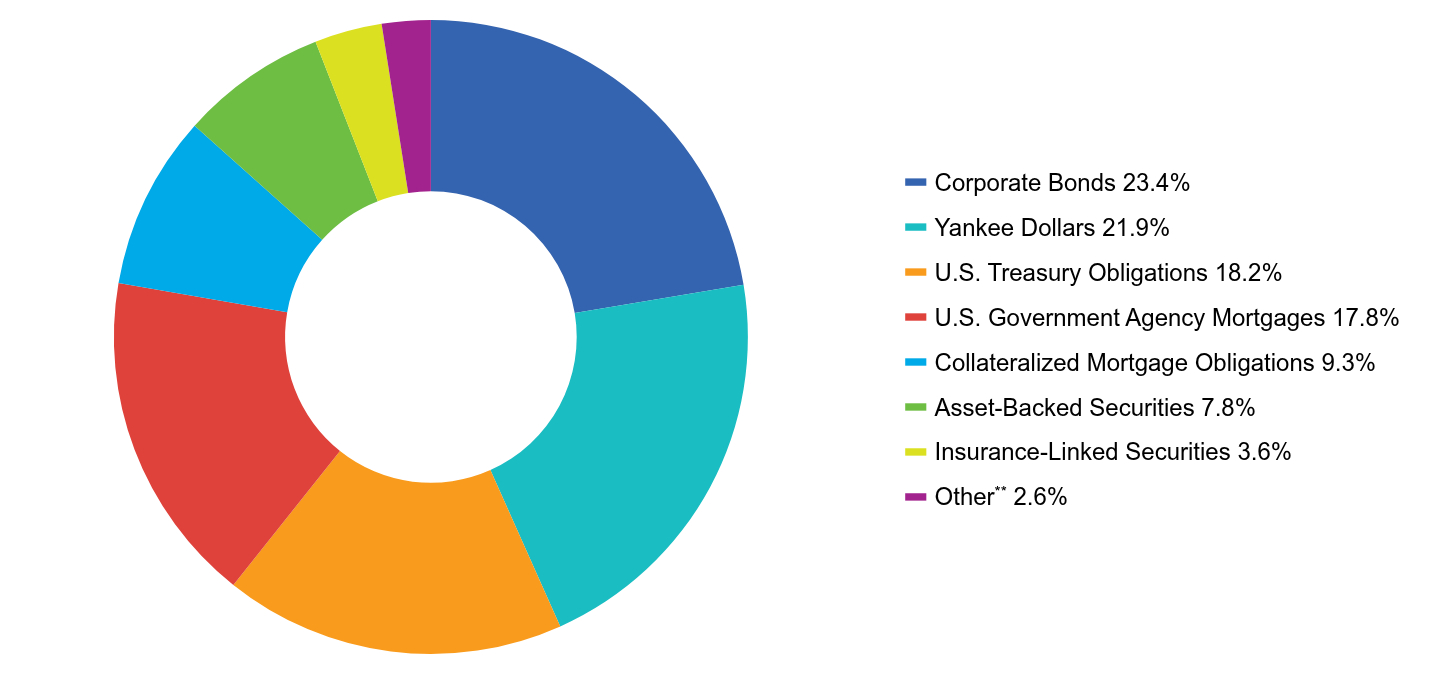
Asset AllocationFootnote Reference* ^ (% of Net Assets)(as of March 31, 2026)Table SummaryValue | Value |
|---|
Corporate Bonds | 23.4% | Yankee Dollars | 21.9% | U.S. Treasury Obligations | 18.2% | U.S. Government Agency Mortgages | 17.8% | Collateralized Mortgage Obligations | 9.3% | Asset-Backed Securities | 7.8% | Insurance-Linked Securities | 3.6% | OtherFootnote Reference** | 2.6% | |
| C000256504 |
|
| Shareholder Report [Line Items] |
|
| Fund Name |
Victory Pioneer Strategic Income Fund
|
| Class Name |
Class C
|
| Trading Symbol |
PSRCX
|
| Annual or Semi-Annual Statement [Text Block] |
Semi-Annual Shareholder Report
|
| Additional Information [Text Block] |
You can find additional information about the Fund at advisor.vcm.com/literature/ mutual-fund-prospectuses. You may also request more information by calling 800-539-3863 or visiting vcm.com/contact-us.
|
| Additional Information Phone Number |
800-539-3863
|
| Additional Information Website |
vcm.com
|
| Expenses [Text Block] |
What were the Fund's costs for the last six months?(based on a hypothetical $10,000 investment) Table SummaryClass Name | Costs of a $10,000 Investment | Costs paid as a percentage of a $10,000 InvestmentFootnote Reference* |
|---|
Class C | $84 | 1.68% |
|---|
| | |
|---|
| Footnote | Description | Footnote* | Annualized |
|
| Expenses Paid, Amount |
$ 84
|
| Expense Ratio, Percent |
1.68%
|
| AssetsNet |
$ 3,725,684,000
|
| Holdings Count | Holding |
1,196
|
| InvestmentCompanyPortfolioTurnover |
43.00%
|
| Additional Fund Statistics [Text Block] |
FUND STATISTICS($ amounts in 000s)(as of March 31, 2026)Table SummaryNet Assets | $3,725,684 |
|---|
Number of Holdings | 1,196 |
|---|
Portfolio Turnover | 43% |
|---|
|
| Holdings [Text Block] |
Asset AllocationFootnote Reference* ^ (% of Net Assets)(as of March 31, 2026)Table SummaryValue | Value |
|---|
Corporate Bonds | 23.4% | Yankee Dollars | 21.9% | U.S. Treasury Obligations | 18.2% | U.S. Government Agency Mortgages | 17.8% | Collateralized Mortgage Obligations | 9.3% | Asset-Backed Securities | 7.8% | Insurance-Linked Securities | 3.6% | OtherFootnote Reference** | 2.6% | |
| C000256503 |
|
| Shareholder Report [Line Items] |
|
| Fund Name |
Victory Pioneer Strategic Income Fund
|
| Class Name |
Class R
|
| Trading Symbol |
STIRX
|
| Annual or Semi-Annual Statement [Text Block] |
Semi-Annual Shareholder Report
|
| Additional Information [Text Block] |
You can find additional information about the Fund at advisor.vcm.com/literature/ mutual-fund-prospectuses. You may also request more information by calling 800-539-3863 or visiting vcm.com/contact-us.
|
| Additional Information Phone Number |
800-539-3863
|
| Additional Information Website |
vcm.com
|
| Expenses [Text Block] |
What were the Fund's costs for the last six months?(based on a hypothetical $10,000 investment) Table SummaryClass Name | Costs of a $10,000 Investment | Costs paid as a percentage of a $10,000 InvestmentFootnote Reference* |
|---|
Class R | $67 | 1.34% |
|---|
| | |
|---|
| Footnote | Description | Footnote* | Annualized |
|
| Expenses Paid, Amount |
$ 67
|
| Expense Ratio, Percent |
1.34%
|
| AssetsNet |
$ 3,725,684,000
|
| Holdings Count | Holding |
1,196
|
| InvestmentCompanyPortfolioTurnover |
43.00%
|
| Additional Fund Statistics [Text Block] |
FUND STATISTICS($ amounts in 000s)(as of March 31, 2026)Table SummaryNet Assets | $3,725,684 |
|---|
Number of Holdings | 1,196 |
|---|
Portfolio Turnover | 43% |
|---|
|
| Holdings [Text Block] |
Asset AllocationFootnote Reference* ^ (% of Net Assets)(as of March 31, 2026)Table SummaryValue | Value |
|---|
Corporate Bonds | 23.4% | Yankee Dollars | 21.9% | U.S. Treasury Obligations | 18.2% | U.S. Government Agency Mortgages | 17.8% | Collateralized Mortgage Obligations | 9.3% | Asset-Backed Securities | 7.8% | Insurance-Linked Securities | 3.6% | OtherFootnote Reference** | 2.6% | |
| C000256501 |
|
| Shareholder Report [Line Items] |
|
| Fund Name |
Victory Pioneer Strategic Income Fund
|
| Class Name |
Class R6
|
| Trading Symbol |
STRKX
|
| Annual or Semi-Annual Statement [Text Block] |
Semi-Annual Shareholder Report
|
| Additional Information [Text Block] |
You can find additional information about the Fund at advisor.vcm.com/literature/ mutual-fund-prospectuses. You may also request more information by calling 800-539-3863 or visiting vcm.com/contact-us.
|
| Additional Information Phone Number |
800-539-3863
|
| Additional Information Website |
vcm.com
|
| Expenses [Text Block] |
What were the Fund's costs for the last six months?(based on a hypothetical $10,000 investment) Table SummaryClass Name | Costs of a $10,000 Investment | Costs paid as a percentage of a $10,000 InvestmentFootnote Reference* |
|---|
Class R6 | $30 | 0.59% |
|---|
| | |
|---|
| Footnote | Description | Footnote* | Annualized |
|
| Expenses Paid, Amount |
$ 30
|
| Expense Ratio, Percent |
0.59%
|
| AssetsNet |
$ 3,725,684,000
|
| Holdings Count | Holding |
1,196
|
| InvestmentCompanyPortfolioTurnover |
43.00%
|
| Additional Fund Statistics [Text Block] |
FUND STATISTICS($ amounts in 000s)(as of March 31, 2026)Table SummaryNet Assets | $3,725,684 |
|---|
Number of Holdings | 1,196 |
|---|
Portfolio Turnover | 43% |
|---|
|
| Holdings [Text Block] |
Asset AllocationFootnote Reference* ^ (% of Net Assets)(as of March 31, 2026)Table SummaryValue | Value |
|---|
Corporate Bonds | 23.4% | Yankee Dollars | 21.9% | U.S. Treasury Obligations | 18.2% | U.S. Government Agency Mortgages | 17.8% | Collateralized Mortgage Obligations | 9.3% | Asset-Backed Securities | 7.8% | Insurance-Linked Securities | 3.6% | OtherFootnote Reference** | 2.6% | |
| C000256502 |
|
| Shareholder Report [Line Items] |
|
| Fund Name |
Victory Pioneer Strategic Income Fund
|
| Class Name |
Class Y
|
| Trading Symbol |
STRYX
|
| Annual or Semi-Annual Statement [Text Block] |
Semi-Annual Shareholder Report
|
| Additional Information [Text Block] |
You can find additional information about the Fund at advisor.vcm.com/literature/ mutual-fund-prospectuses. You may also request more information by calling 800-539-3863 or visiting vcm.com/contact-us.
|
| Additional Information Phone Number |
800-539-3863
|
| Additional Information Website |
vcm.com
|
| Expenses [Text Block] |
What were the Fund's costs for the last six months?(based on a hypothetical $10,000 investment) Table SummaryClass Name | Costs of a $10,000 Investment | Costs paid as a percentage of a $10,000 InvestmentFootnote Reference* |
|---|
Class Y | $34 | 0.68% |
|---|
| | |
|---|
| Footnote | Description | Footnote* | Annualized |
|
| Expenses Paid, Amount |
$ 34
|
| Expense Ratio, Percent |
0.68%
|
| AssetsNet |
$ 3,725,684,000
|
| Holdings Count | Holding |
1,196
|
| InvestmentCompanyPortfolioTurnover |
43.00%
|
| Additional Fund Statistics [Text Block] |
FUND STATISTICS($ amounts in 000s)(as of March 31, 2026)Table SummaryNet Assets | $3,725,684 |
|---|
Number of Holdings | 1,196 |
|---|
Portfolio Turnover | 43% |
|---|
|
| Holdings [Text Block] |
Asset AllocationFootnote Reference* ^ (% of Net Assets)(as of March 31, 2026)Table SummaryValue | Value |
|---|
Corporate Bonds | 23.4% | Yankee Dollars | 21.9% | U.S. Treasury Obligations | 18.2% | U.S. Government Agency Mortgages | 17.8% | Collateralized Mortgage Obligations | 9.3% | Asset-Backed Securities | 7.8% | Insurance-Linked Securities | 3.6% | OtherFootnote Reference** | 2.6% | |