Shareholder Report
|
6 Months Ended |
|
Mar. 31, 2026
USD ($)
Holding
|
|---|
| Shareholder Report [Line Items] |
|
| Document Type |
N-CSRS
|
| Amendment Flag |
false
|
| Registrant Name |
TETON WESTWOOD FUNDS
|
| Entity Central Index Key |
0000796229
|
| Entity Investment Company Type |
N-1A
|
| Document Period End Date |
Mar. 31, 2026
|
| C000002934 |
|
| Shareholder Report [Line Items] |
|
| Fund Name |
Keeley Small Cap Fund
|
| Class Name |
Class AAA
|
| Trading Symbol |
WESCX
|
| Annual or Semi-Annual Statement [Text Block] |
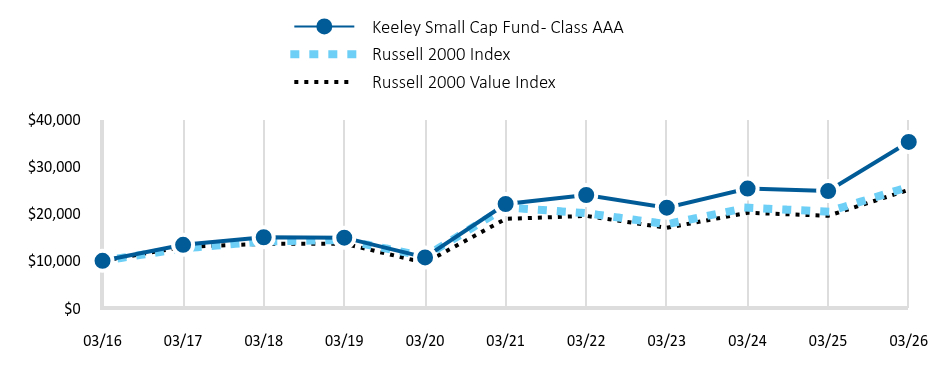
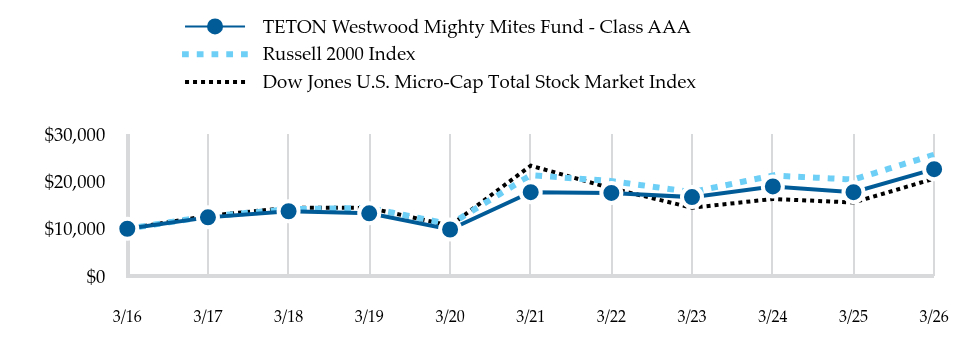
This semi-annual shareholder report contains important information about Keeley Small Cap Fund - Class AAA (the "Fund") for the period of October 1, 2025 to March 31, 2026.
|
| Shareholder Report Annual or Semi-Annual |
semi-annual shareholder report
|
| Additional Information [Text Block] |
You may find additional information about the Fund at
https://gabelli.com/ticker/WESCX/. You may also request information by contacting us at 800-GABELLI (800-422-3554).
|
| Additional Information Phone Number |
800-GABELLI (800-422-3554)
|
| Additional Information Website |
https://gabelli.com/ticker/WESCX/
|
| Expenses [Text Block] |
What were the Fund costs for the last six months? (based on a hypothetical $10,000 investment) Table SummaryClass Name | Costs of a $10k Investment | Costs Paid as a % of a $10k Investment |
|---|
Keeley Small Cap Fund - Class AAA
| $68 | 1.25% |
|---|
|
| Expenses Paid, Amount |
$ 68
|
| Expense Ratio, Percent |
1.25%
|
| Performance Past Does Not Indicate Future [Text] |
Past performance does not guarantee future results.
|
| Line Graph [Table Text Block] |
Table Summary | Keeley Small Cap Fund - Class AAA | Russell 2000 Index | Russell 2000 Value Index |
|---|
03/16 | 10,000 | 10,000 | 10,000 |
|---|
03/17 | 13,379 | 12,622 | 12,937 |
|---|
03/18 | 14,991 | 14,110 | 13,601 |
|---|
03/19 | 14,904 | 14,399 | 13,624 |
|---|
03/20 | 10,720 | 10,945 | 9,586 |
|---|
03/21 | 22,038 | 21,326 | 18,889 |
|---|
03/22 | 23,945 | 20,091 | 19,516 |
|---|
03/23 | 21,260 | 17,759 | 16,986 |
|---|
03/24 | 25,310 | 21,259 | 20,171 |
|---|
03/25 | 24,775 | 20,407 | 19,542 |
|---|
03/26 | 35,185 | 25,655 | 25,031 |
|---|
|
| Average Annual Return [Table Text Block] |
Table Summary | 6 months | 1 Year | 5 Year | 10 Year |
|---|
Keeley Small Cap Fund - Class
AAA | 18.55% | 42.02% | 9.81% | 13.41% |
|---|
Russell 2000 Index | 3.10% | 25.72% | 3.77% | 9.88% |
|---|
Russell 2000 Value Index | 8.37% | 28.09% | 5.79% | 9.61% |
|---|
|
| No Deduction of Taxes [Text Block] |
The table and graph presented above do not reflect the deduction of taxes a shareholder would pay on Fund distributions or the redemption of Fund shares.
|
| AssetsNet |
$ 86,007,468
|
| Holdings Count | Holding |
89
|
| Advisory Fees Paid, Amount |
$ 219,490
|
| InvestmentCompanyPortfolioTurnover |
12.00%
|
| Additional Fund Statistics [Text Block] |
- Total Net Assets$86,007,468
- Number of Portfolio Holdings89
- Portfolio Turnover Rate12%
- Management Fees$219,490
|
| Holdings [Text Block] |
Top 10 Holdings (% of net assets)Table SummaryNetScout Systems Inc. | 3.3% |
|---|
Advanced Energy Industries Inc. | 2.6% |
|---|
Flowserve Corp. | 2.6% |
|---|
AAR Corp. | 2.6% |
|---|
MKS Inc. | 2.5% |
|---|
OPENLANE Inc. | 2.4% |
|---|
TTM Technologies Inc. | 2.3% |
|---|
MYR Group Inc. | 2.2% |
|---|
IMAX Corp. | 2.2% |
|---|
Ultra Clean Holdings Inc. | 2.2% |
|---|
Portfolio Weighting (% of net assets)Table SummaryCommon Stocks | 94.5% |
|---|
U.S. Government Obligations | 5.1% |
|---|
Other Assets and Liabilities (Net) | 0.4% |
|---|
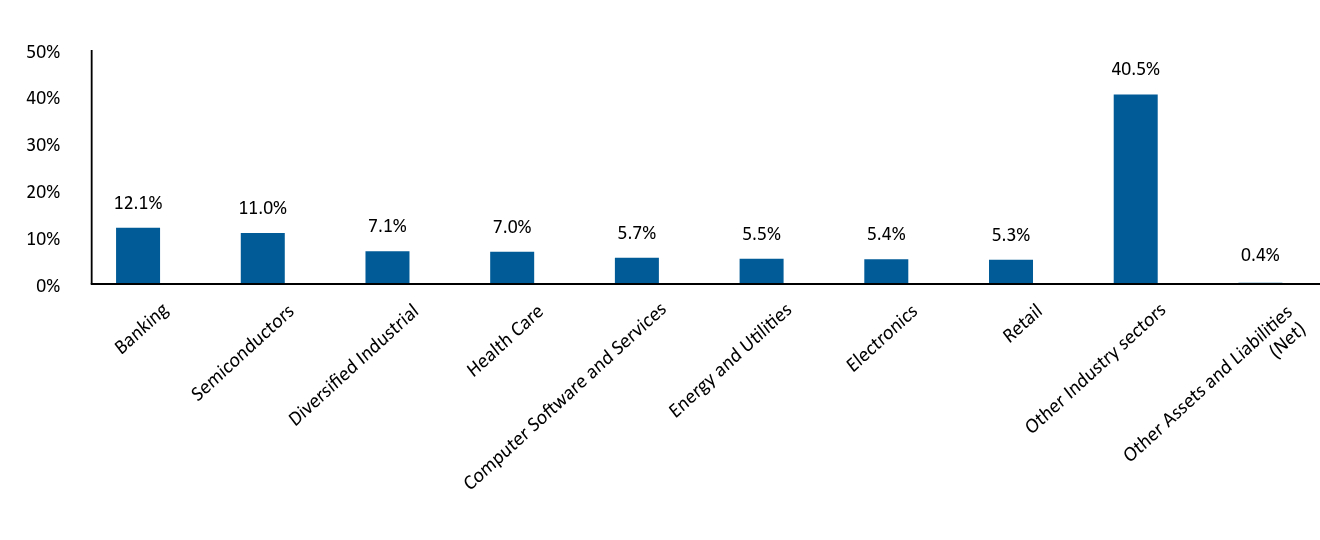
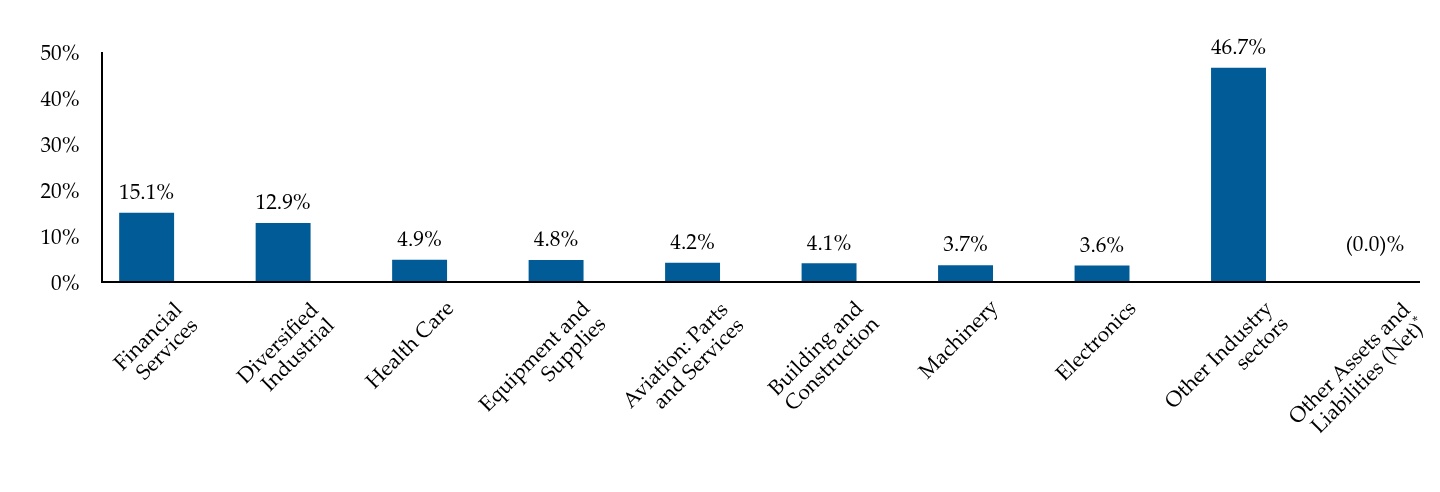
Industry Allocation (% of net assets)Table SummaryIndustry Weighting | . |
|---|
Banking | 12.1% | Semiconductors | 11.0% | Diversified Industrial | 7.1% | Health Care | 7.0% | Computer Software and Services | 5.7% | Energy and Utilities | 5.5% | Electronics | 5.4% | Retail | 5.3% | Other Industry sectors | 40.5% | Other Assets and Liabilities (Net) | 0.4% | |
| Material Fund Change [Text Block] |
|
| Updated Prospectus Phone Number |
800-GABELLI (800-422-3554)
|
| Updated Prospectus Email Address |
<span style="box-sizing: border-box; color: rgb(0, 0, 0); display: inline; flex-wrap: nowrap; font-size: 12px; font-weight: 400; grid-area: auto; line-height: 18px; margin: 0px; overflow: visible; text-align: justify; text-align-last: left; white-space-collapse: preserve-breaks;">info@gabelli.com</span>
|
| Updated Prospectus Web Address |
https://gabelli.com/ticker/WESCX/
|
| C000002933 |
|
| Shareholder Report [Line Items] |
|
| Fund Name |
Keeley Small Cap Fund
|
| Class Name |
Class C
|
| Trading Symbol |
WWSCX
|
| Annual or Semi-Annual Statement [Text Block] |
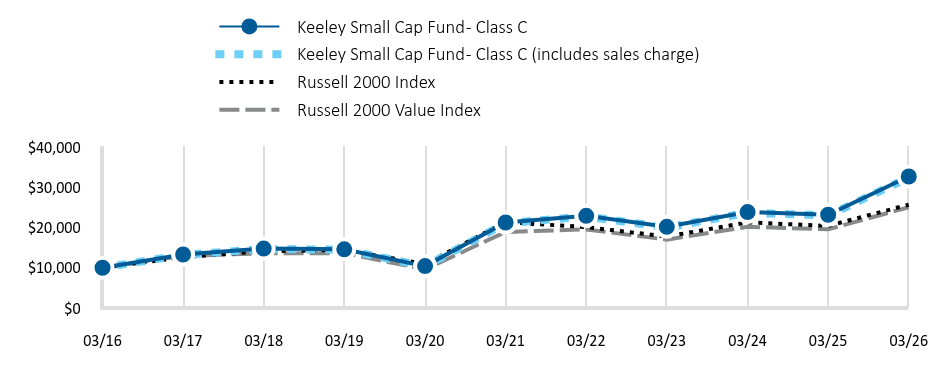
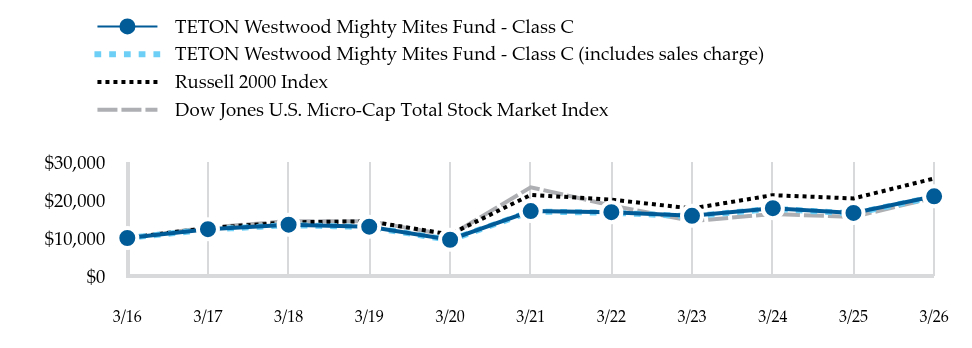
This semi-annual shareholder report contains important information about Keeley Small Cap Fund - Class C (the "Fund") for the period of October 1, 2025 to March 31, 2026.
|
| Shareholder Report Annual or Semi-Annual |
semi-annual shareholder report
|
| Additional Information [Text Block] |
You may find additional information about the Fund at https://gabelli.com/ticker/WWSCX/. You may also request information by contacting us at 800-GABELLI (800-422-3554).
|
| Additional Information Phone Number |
800-GABELLI (800-422-3554)
|
| Additional Information Website |
https://gabelli.com/ticker/WWSCX/
|
| Expenses [Text Block] |
What were the Fund costs for the last six months? (based on a hypothetical $10,000 investment) Table SummaryClass Name | Costs of a $10k Investment | Costs Paid as a % of a $10k Investment |
|---|
Keeley Small Cap Fund - Class C
| $109 | 2.00% |
|---|
|
| Expenses Paid, Amount |
$ 109
|
| Expense Ratio, Percent |
2.00%
|
| Performance Past Does Not Indicate Future [Text] |
Past performance does not guarantee future results.
|
| Line Graph [Table Text Block] |
Table Summary | Keeley Small Cap Fund - Class C | Keeley Small Cap Fund - Class C (includes sales charge) | Russell 2000 Index | Russell 2000 Value Index |
|---|
03/16 | 10,000 | 10,000 | 10,000 | 10,000 |
|---|
03/17 | 13,283 | 13,183 | 12,622 | 12,937 |
|---|
03/18 | 14,763 | 14,652 | 14,110 | 13,601 |
|---|
03/19 | 14,576 | 14,466 | 14,399 | 13,624 |
|---|
03/20 | 10,408 | 10,330 | 10,945 | 9,586 |
|---|
03/21 | 21,227 | 21,067 | 21,326 | 18,889 |
|---|
03/22 | 22,896 | 22,724 | 20,091 | 19,516 |
|---|
03/23 | 20,169 | 20,017 | 17,759 | 16,986 |
|---|
03/24 | 23,829 | 23,650 | 21,259 | 20,171 |
|---|
03/25 | 23,158 | 22,984 | 20,407 | 19,542 |
|---|
03/26 | 32,651 | 32,405 | 25,655 | 25,031 |
|---|
|
| Average Annual Return [Table Text Block] |
Table Summary | 6 months | 1 Year | 5 Year | 10 Year |
|---|
Keeley Small Cap Fund - Class C | 18.16% | 40.99% | 8.99% | 12.56% |
|---|
Keeley Small Cap Fund - Class C (includes sales charge) | 17.16% | 39.99% | 8.99% | 12.56% |
|---|
Russell 2000 Index | 3.10% | 25.72% | 3.77% | 9.88% |
|---|
Russell 2000 Value Index | 8.37% | 28.09% | 5.79% | 9.61% |
|---|
|
| No Deduction of Taxes [Text Block] |
The table and graph presented above do not reflect the deduction of taxes a shareholder would pay on Fund distributions or the redemption of Fund shares.
|
| AssetsNet |
$ 86,007,468
|
| Holdings Count | Holding |
89
|
| Advisory Fees Paid, Amount |
$ 219,490
|
| InvestmentCompanyPortfolioTurnover |
12.00%
|
| Additional Fund Statistics [Text Block] |
- Total Net Assets$86,007,468
- Number of Portfolio Holdings89
- Portfolio Turnover Rate12%
- Management Fees$219,490
|
| Holdings [Text Block] |
Top 10 Holdings (% of net assets)Table SummaryNetScout Systems Inc. | 3.3% |
|---|
Advanced Energy Industries Inc. | 2.6% |
|---|
Flowserve Corp. | 2.6% |
|---|
AAR Corp. | 2.6% |
|---|
MKS Inc. | 2.5% |
|---|
OPENLANE Inc. | 2.4% |
|---|
TTM Technologies Inc. | 2.3% |
|---|
MYR Group Inc. | 2.2% |
|---|
IMAX Corp. | 2.2% |
|---|
Ultra Clean Holdings Inc. | 2.2% |
|---|
Portfolio Weighting (% of net assets)Table SummaryCommon Stocks | 94.5% |
|---|
U.S. Government Obligations | 5.1% |
|---|
Other Assets and Liabilities (Net) | 0.4% |
|---|
Industry Allocation (% of net assets)Table SummaryIndustry Weighting | . |
|---|
Banking | 12.1% | Semiconductors | 11.0% | Diversified Industrial | 7.1% | Health Care | 7.0% | Computer Software and Services | 5.7% | Energy and Utilities | 5.5% | Electronics | 5.4% | Retail | 5.3% | Other Industry sectors | 40.5% | Other Assets and Liabilities (Net) | 0.4% | |
| Material Fund Change [Text Block] |
|
| Updated Prospectus Phone Number |
800-GABELLI (800-422-3554)
|
| Updated Prospectus Email Address |
<span style="box-sizing: border-box; color: rgb(0, 0, 0); display: inline; flex-wrap: nowrap; font-size: 12px; font-weight: 400; grid-area: auto; line-height: 18px; margin: 0px; overflow: visible; text-align: justify; text-align-last: left; white-space-collapse: preserve-breaks;">info@gabelli.com</span>
|
| Updated Prospectus Web Address |
https://gabelli.com/ticker/WWSCX/
|
| C000061068 |
|
| Shareholder Report [Line Items] |
|
| Fund Name |
Keeley Small Cap Fund
|
| Class Name |
Class I
|
| Trading Symbol |
WWSIX
|
| Annual or Semi-Annual Statement [Text Block] |
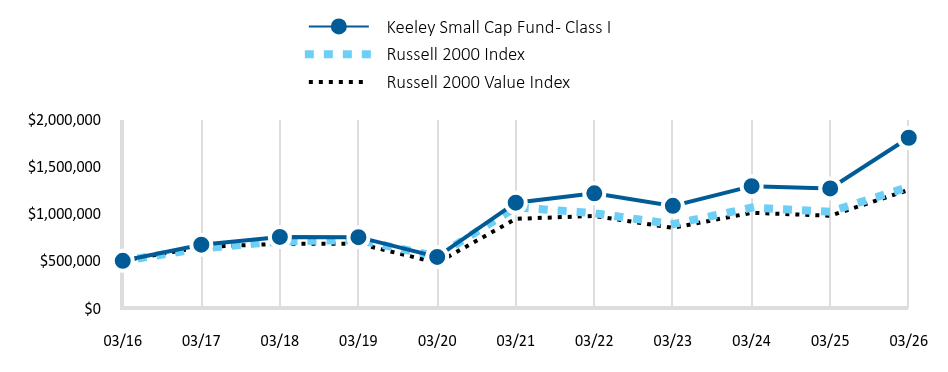
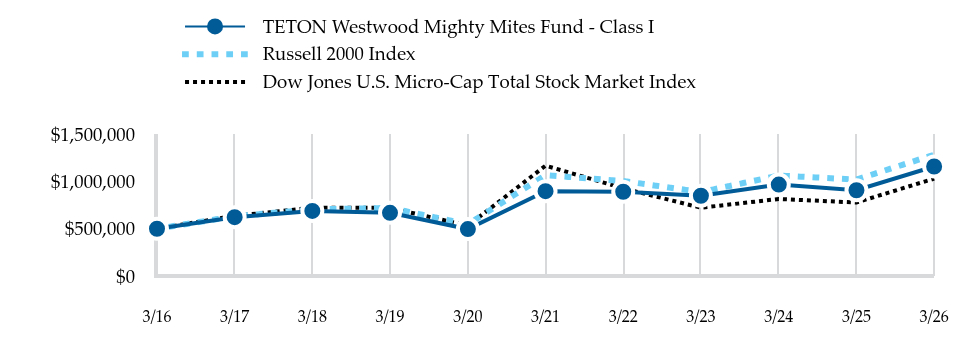
This semi-annual shareholder report contains important information about Keeley Small Cap Fund - Class I (the "Fund") for the period of October 1, 2025 to March 31, 2026.
|
| Shareholder Report Annual or Semi-Annual |
semi-annual shareholder report
|
| Additional Information [Text Block] |
You may find additional information about the Fund at https://gabelli.com/ticker/WWSIX/. You may also request information by contacting us at 800-GABELLI (800-422-3554).
|
| Additional Information Phone Number |
800-GABELLI (800-422-3554)
|
| Additional Information Website |
https://gabelli.com/ticker/WWSIX/
|
| Expenses [Text Block] |
What were the Fund costs for the last six months? (based on a hypothetical $10,000 investment) Table SummaryClass Name | Costs of a $10k Investment | Costs Paid as a % of a $10k Investment |
|---|
Keeley Small Cap Fund - Class I
| $55 | 1.00% |
|---|
|
| Expenses Paid, Amount |
$ 55
|
| Expense Ratio, Percent |
1.00%
|
| Performance Past Does Not Indicate Future [Text] |
Past performance does not guarantee future results.
|
| Line Graph [Table Text Block] |
Table Summary | Keeley Small Cap Fund - Class I | Russell 2000 Index | Russell 2000 Value Index |
|---|
03/16 | 500,000 | 500,000 | 500,000 |
|---|
03/17 | 670,669 | 631,100 | 646,850 |
|---|
03/18 | 753,079 | 705,507 | 680,033 |
|---|
03/19 | 750,507 | 719,970 | 681,189 |
|---|
03/20 | 541,312 | 547,249 | 479,285 |
|---|
03/21 | 1,115,543 | 1,066,314 | 944,431 |
|---|
03/22 | 1,215,144 | 1,004,575 | 975,786 |
|---|
03/23 | 1,081,906 | 887,944 | 849,324 |
|---|
03/24 | 1,290,997 | 1,062,957 | 1,008,572 |
|---|
03/25 | 1,266,647 | 1,020,333 | 977,105 |
|---|
03/26 | 1,803,766 | 1,282,762 | 1,251,574 |
|---|
|
| Average Annual Return [Table Text Block] |
Table Summary | 6 months | 1 Year | 5 Year | 10 Year |
|---|
Keeley Small Cap Fund - Class I | 18.68% | 42.40% | 10.09% | 13.69% |
|---|
Russell 2000 Index | 3.10% | 25.72% | 3.77% | 9.88% |
|---|
Russell 2000 Value Index | 8.37% | 28.09% | 5.79% | 9.61% |
|---|
|
| No Deduction of Taxes [Text Block] |
The table and graph presented above do not reflect the deduction of taxes a shareholder would pay on Fund distributions or the redemption of Fund shares.
|
| AssetsNet |
$ 86,007,468
|
| Holdings Count | Holding |
89
|
| Advisory Fees Paid, Amount |
$ 219,490
|
| InvestmentCompanyPortfolioTurnover |
12.00%
|
| Additional Fund Statistics [Text Block] |
- Total Net Assets$86,007,468
- Number of Portfolio Holdings89
- Portfolio Turnover Rate12%
- Management Fees$219,490
|
| Holdings [Text Block] |
Top 10 Holdings (% of net assets)Table SummaryNetScout Systems Inc. | 3.3% |
|---|
Advanced Energy Industries Inc. | 2.6% |
|---|
Flowserve Corp. | 2.6% |
|---|
AAR Corp. | 2.6% |
|---|
MKS Inc. | 2.5% |
|---|
OPENLANE Inc. | 2.4% |
|---|
TTM Technologies Inc. | 2.3% |
|---|
MYR Group Inc. | 2.2% |
|---|
IMAX Corp. | 2.2% |
|---|
Ultra Clean Holdings Inc. | 2.2% |
|---|
Portfolio Weighting (% of net assets)Table SummaryCommon Stocks | 94.5% |
|---|
U.S. Government Obligations | 5.1% |
|---|
Other Assets and Liabilities (Net) | 0.4% |
|---|
Industry Allocation (% of net assets)Table SummaryIndustry Weighting | . |
|---|
Banking | 12.1% | Semiconductors | 11.0% | Diversified Industrial | 7.1% | Health Care | 7.0% | Computer Software and Services | 5.7% | Energy and Utilities | 5.5% | Electronics | 5.4% | Retail | 5.3% | Other Industry sectors | 40.5% | Other Assets and Liabilities (Net) | 0.4% | |
| Material Fund Change [Text Block] |
|
| Updated Prospectus Phone Number |
800-GABELLI (800-422-3554)
|
| Updated Prospectus Email Address |
<span style="box-sizing: border-box; color: rgb(0, 0, 0); display: inline; flex-wrap: nowrap; font-size: 12px; font-weight: 400; grid-area: auto; line-height: 18px; margin: 0px; overflow: visible; text-align: justify; text-align-last: left; white-space-collapse: preserve-breaks;">info@gabelli.com</span>
|
| Updated Prospectus Web Address |
https://gabelli.com/ticker/WWSIX/
|
| C000002931 |
|
| Shareholder Report [Line Items] |
|
| Fund Name |
Keeley Small Cap Fund
|
| Class Name |
Class A
|
| Trading Symbol |
WWSAX
|
| Annual or Semi-Annual Statement [Text Block] |
This semi-annual shareholder report contains important information about Keeley Small Cap Fund - Class A (the "Fund") for the period of October 1, 2025 to March 31, 2026.
|
| Shareholder Report Annual or Semi-Annual |
semi-annual shareholder report
|
| Additional Information [Text Block] |
You may find additional information about the Fund at https://gabelli.com/ticker/WWSAX/. You may also request information by contacting us at 800-GABELLI (800-422-3554).
|
| Additional Information Phone Number |
800-GABELLI (800-422-3554)
|
| Additional Information Website |
https://gabelli.com/ticker/WWSAX/
|
| Expenses [Text Block] |
What were the Fund costs for the last six months? (based on a hypothetical $10,000 investment) Table SummaryClass Name | Costs of a $10k Investment | Costs Paid as a % of a $10k Investment |
|---|
Keeley Small Cap Fund - Class A
| $68 | 1.25% |
|---|
|
| Expenses Paid, Amount |
$ 68
|
| Expense Ratio, Percent |
1.25%
|
| Performance Past Does Not Indicate Future [Text] |
Past performance does not guarantee future results.
|
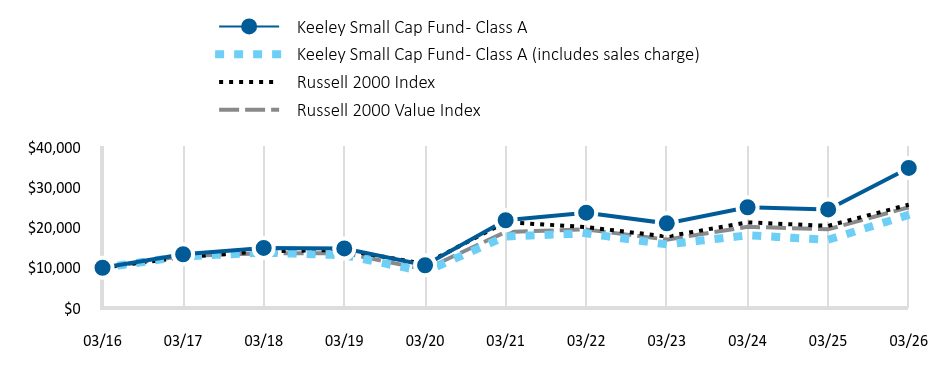
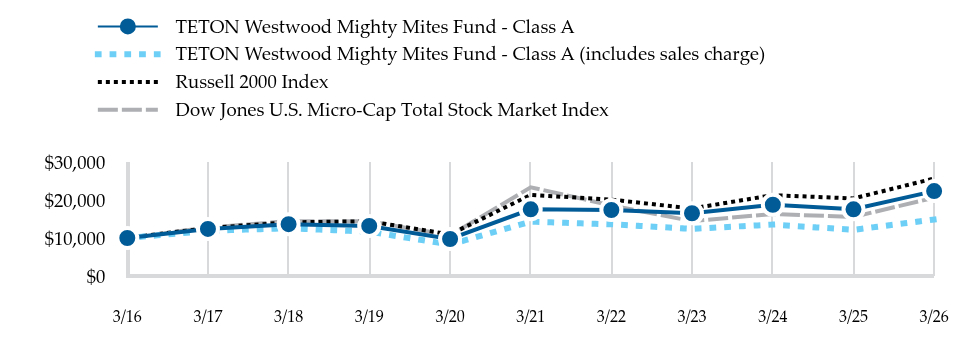
| Line Graph [Table Text Block] |
Table Summary | Keeley Small Cap Fund - Class A | Keeley Small Cap Fund - Class A (includes sales charge) | Russell 2000 Index | Russell 2000 Value Index |
|---|
03/16 | 10,000 | 10,000 | 10,000 | 10,000 |
|---|
03/17 | 13,351 | 12,817 | 12,622 | 12,937 |
|---|
03/18 | 14,918 | 13,748 | 14,110 | 13,601 |
|---|
03/19 | 14,796 | 13,090 | 14,399 | 13,624 |
|---|
03/20 | 10,616 | 9,017 | 10,945 | 9,586 |
|---|
03/21 | 21,794 | 17,770 | 21,326 | 18,889 |
|---|
03/22 | 23,675 | 18,532 | 20,091 | 19,516 |
|---|
03/23 | 21,023 | 15,797 | 17,759 | 16,986 |
|---|
03/24 | 25,024 | 18,052 | 21,259 | 20,171 |
|---|
03/25 | 24,484 | 16,956 | 20,407 | 19,542 |
|---|
03/26 | 34,792 | 23,131 | 25,655 | 25,031 |
|---|
|
| Average Annual Return [Table Text Block] |
Table Summary | 6 months | 1 Year | 5 Year | 10 Year |
|---|
Keeley Small Cap Fund - Class A | 18.57% | 42.10% | 9.81% | 13.28% |
|---|
Keeley Small Cap Fund - Class A (includes sales charge) | 13.83% | 36.41% | 8.91% | 12.82% |
|---|
Russell 2000 Index | 3.10% | 25.72% | 3.77% | 9.88% |
|---|
Russell 2000 Value Index | 8.37% | 28.09% | 5.79% | 9.61% |
|---|
|
| No Deduction of Taxes [Text Block] |
The table and graph presented above do not reflect the deduction of taxes a shareholder would pay on Fund distributions or the redemption of Fund shares.
|
| AssetsNet |
$ 86,007,468
|
| Holdings Count | Holding |
89
|
| Advisory Fees Paid, Amount |
$ 219,490
|
| InvestmentCompanyPortfolioTurnover |
12.00%
|
| Additional Fund Statistics [Text Block] |
- Total Net Assets$86,007,468
- Number of Portfolio Holdings89
- Portfolio Turnover Rate12%
- Management Fees$219,490
|
| Holdings [Text Block] |
Top 10 Holdings (% of net assets)Table SummaryNetScout Systems Inc. | 3.3% |
|---|
Advanced Energy Industries Inc. | 2.6% |
|---|
Flowserve Corp. | 2.6% |
|---|
AAR Corp. | 2.6% |
|---|
MKS Inc. | 2.5% |
|---|
OPENLANE Inc. | 2.4% |
|---|
TTM Technologies Inc. | 2.3% |
|---|
MYR Group Inc. | 2.2% |
|---|
IMAX Corp. | 2.2% |
|---|
Ultra Clean Holdings Inc. | 2.2% |
|---|
Portfolio Weighting (% of net assets)Table SummaryCommon Stocks | 94.5% |
|---|
U.S. Government Obligations | 5.1% |
|---|
Other Assets and Liabilities (Net) | 0.4% |
|---|
Industry Allocation (% of net assets)Table SummaryIndustry Weighting | . |
|---|
Banking | 12.1% | Semiconductors | 11.0% | Diversified Industrial | 7.1% | Health Care | 7.0% | Computer Software and Services | 5.7% | Energy and Utilities | 5.5% | Electronics | 5.4% | Retail | 5.3% | Other Industry sectors | 40.5% | Other Assets and Liabilities (Net) | 0.4% | |
| Material Fund Change [Text Block] |
|
| Updated Prospectus Phone Number |
800-GABELLI (800-422-3554)
|
| Updated Prospectus Email Address |
<span style="box-sizing: border-box; color: rgb(0, 0, 0); display: inline; flex-wrap: nowrap; font-size: 12px; font-weight: 400; grid-area: auto; line-height: 18px; margin: 0px; overflow: visible; text-align: justify; text-align-last: left; white-space-collapse: preserve-breaks;">info@gabelli.com</span>
|
| Updated Prospectus Web Address |
https://gabelli.com/ticker/WWSAX/
|
| C000002912 |
|
| Shareholder Report [Line Items] |
|
| Fund Name |
Balanced Fund
|
| Class Name |
Class AAA
|
| Trading Symbol |
WEBAX
|
| Annual or Semi-Annual Statement [Text Block] |
This semi-annual shareholder report contains important information about TETON Westwood Balanced Fund - Class AAA (the "Fund") for the period of October 1, 2025 to March 31, 2026
|
| Shareholder Report Annual or Semi-Annual |
semi-annual shareholder report
|
| Additional Information [Text Block] |
You can find additional information about the Fund at https://www.tetonadv.com/teton-westwood-funds/tw-balanced/. You can also request this information by contacting us at (800) 422-3554.
|
| Additional Information Phone Number |
(800) 422-3554
|
| Additional Information Website |
https://www.tetonadv.com/teton-westwood-funds/tw-balanced/
|
| Expenses [Text Block] |
What were the Fund costs for the last six months? (based on a hypothetical $10,000 investment) Table SummaryClass Name | Costs of a $10k Investment | Costs Paid as a % of a $10k Investment |
|---|
Balanced Fund - Class AAA
| $82 | 1.65% |
|---|
|
| Expenses Paid, Amount |
$ 82
|
| Expense Ratio, Percent |
1.65%
|
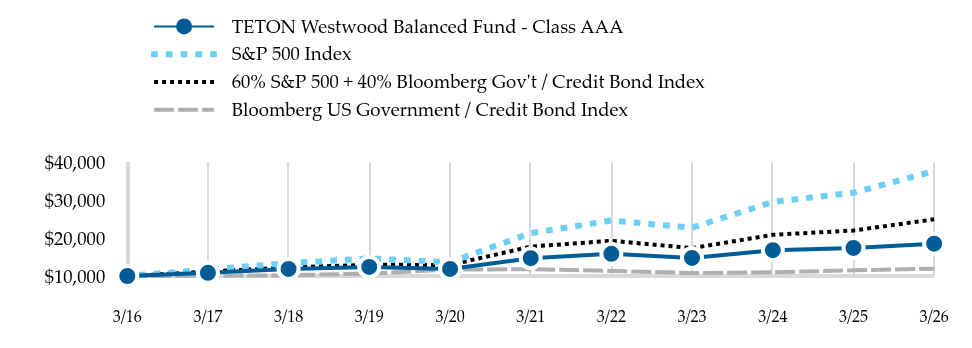
| Factors Affecting Performance [Text Block] |
How did the Fund perform?For the six month period ended March 31, 2026, the Teton Westwood Balanced Fund outperformed its broad-based benchmark, the S&P 500 Index, and underperformed its comparatives, the Bloomberg US Government / Credit Bond Index and 60% S&P 500 + 40% Bloomberg Gov't / Credit Bond Index. the Amid increased volatility in equity and bond markets, the Fund benefitted from its equity investments, which showed gains in the period as the market tilted away from growth names amid concerns about capital expenditures for artificial intelligence. Convertible securities also contributed to returns. |
| Performance Past Does Not Indicate Future [Text] |
Past performance does not guarantee future results.
|
| Line Graph [Table Text Block] |
Table Summary | TETON Westwood Balanced Fund - Class AAA | S&P 500 Index | 60% S&P 500 + 40% Bloomberg Gov't / Credit Bond Index | Bloomberg US Government / Credit Bond Index |
|---|
3/16 | 10,000 | 10,000 | 10,000 | 10,000 |
|---|
3/17 | 10,840 | 11,717 | 11,152 | 10,054 |
|---|
3/18 | 11,856 | 13,356 | 12,267 | 10,193 |
|---|
3/19 | 12,383 | 14,625 | 12,945 | 10,649 |
|---|
3/20 | 11,850 | 13,604 | 12,906 | 11,695 |
|---|
3/21 | 14,677 | 21,270 | 17,730 | 11,796 |
|---|
3/22 | 15,831 | 24,599 | 19,271 | 11,342 |
|---|
3/23 | 14,759 | 22,697 | 17,330 | 10,796 |
|---|
3/24 | 16,784 | 29,479 | 20,834 | 10,984 |
|---|
3/25 | 17,374 | 31,912 | 21,963 | 11,496 |
|---|
3/26 | 18,497 | 37,592 | 24,913 | 11,939 |
|---|
|
| AssetsNet |
$ 30,168,006
|
| Holdings Count | Holding |
109
|
| Advisory Fees Paid, Amount |
$ 121,101
|
| InvestmentCompanyPortfolioTurnover |
19.00%
|
| Additional Fund Statistics [Text Block] |
- Total Net Assets$30,168,006
- Number of Portfolio Holdings109
- Portfolio Turnover Rate19%
- Management Fees$121,101
|
| Holdings [Text Block] |
Portfolio Weighting (% of net assets)Table SummaryCommon Stocks | 61.8% |
|---|
Corporate Bonds | 24.4% |
|---|
U.S. Government Obligations | 7.1% |
|---|
Convertible Corporate Bonds | 4.0% |
|---|
Mandatory Convertible Securities | 1.0% |
|---|
Foreign Government Obligations | 0.9% |
|---|
Short Term Investment | 0.2% |
|---|
Other Assets and Liabilities (Net) | 0.6% |
|---|
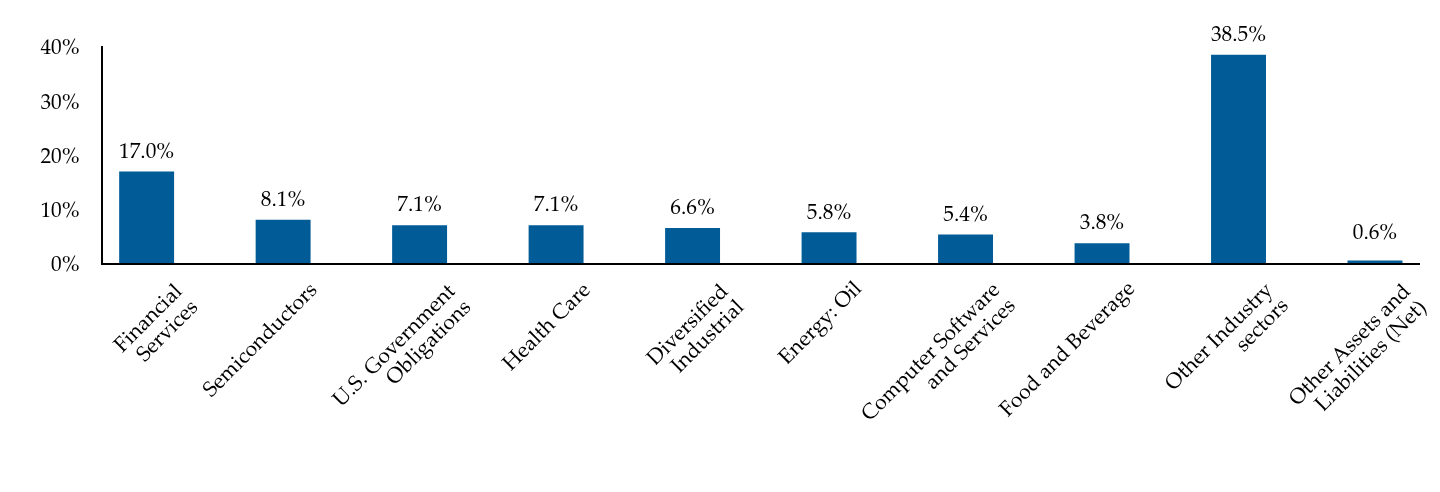
Industry Allocation (% of net assets) Table SummaryIndustry Weighting | . |
|---|
Financial Services | 17.0% | Semiconductors | 8.1% | U.S. Government Obligations | 7.1% | Health Care | 7.1% | Diversified Industrial | 6.6% | Energy: Oil | 5.8% | Computer Software and Services | 5.4% | Food and Beverage | 3.8% | Other Industry sectors | 38.5% | Other Assets and Liabilities (Net) | 0.6% | |
| Largest Holdings [Text Block] |
Top 10 Holdings (% of net assets)Table SummaryU.S. Treasury Bonds | 3.9% |
|---|
Amazon.com Inc. | 3.6% |
|---|
NVIDIA Corp. | 3.5% |
|---|
U.S. Treasury Notes | 3.3% |
|---|
Broadcom Inc. | 2.0% |
|---|
NextEra Energy Inc. | 1.6% |
|---|
Deere & Co. | 1.6% |
|---|
CSX Corp. | 1.5% |
|---|
Johnson & Johnson | 1.5% |
|---|
Thermo Fisher Scientific Inc. | 1.5% |
|---|
|
| Material Fund Change [Text Block] |
|
| C000002914 |
|
| Shareholder Report [Line Items] |
|
| Fund Name |
Balanced Fund
|
| Class Name |
Class C
|
| Trading Symbol |
WBCCX
|
| Annual or Semi-Annual Statement [Text Block] |
This semi-annual shareholder report contains important information about TETON Westwood Balanced Fund - Class C (the "Fund") for the period of October 1, 2025 to March 31, 2026
|
| Shareholder Report Annual or Semi-Annual |
semi-annual shareholder report
|
| Additional Information [Text Block] |
You can find additional information about the Fund at https://www.tetonadv.com/teton-westwood-funds/tw-balanced/. You can also request this information by contacting us at (800) 422-3554.
|
| Additional Information Phone Number |
(800) 422-3554
|
| Additional Information Website |
https://www.tetonadv.com/teton-westwood-funds/tw-balanced/
|
| Expenses [Text Block] |
What were the Fund costs for the last six months? (based on a hypothetical $10,000 investment) Table SummaryClass Name | Costs of a $10k Investment | Costs Paid as a % of a $10k Investment |
|---|
Balanced Fund - Class C
| $119 | 2.40% |
|---|
|
| Expenses Paid, Amount |
$ 119
|
| Expense Ratio, Percent |
2.40%
|
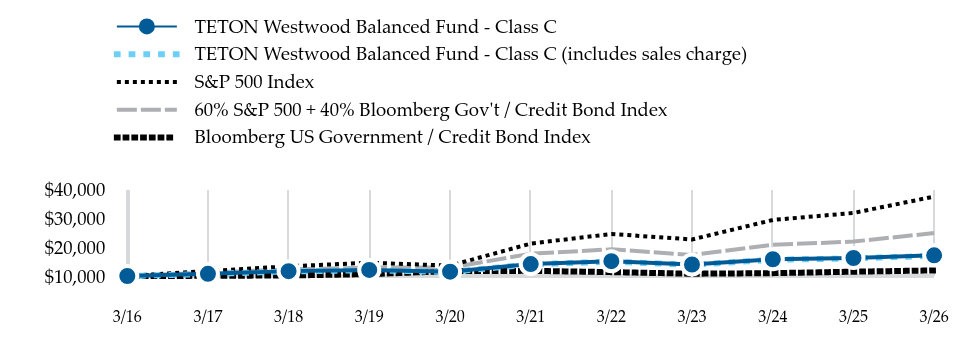
| Factors Affecting Performance [Text Block] |
How did the Fund perform?For the six month period ended March 31, 2026, the Teton Westwood Balanced Fund outperformed its broad-based benchmark, the S&P 500 Index, and underperformed its comparatives, the Bloomberg US Government / Credit Bond Index and 60% S&P 500 + 40% Bloomberg Gov't / Credit Bond Index. the Amid increased volatility in equity and bond markets, the Fund benefitted from its equity investments, which showed gains in the period as the market tilted away from growth names amid concerns about capital expenditures for artificial intelligence. Convertible securities also contributed to returns. |
| Performance Past Does Not Indicate Future [Text] |
Past performance does not guarantee future results.
|
| Line Graph [Table Text Block] |
Table Summary | TETON Westwood Balanced Fund - Class C | TETON Westwood Balanced Fund - Class C (includes sales charge) | S&P 500 Index | 60% S&P 500 + 40% Bloomberg Gov't / Credit Bond Index | Bloomberg US Government / Credit Bond Index |
|---|
3/16 | 10,000 | 10,000 | 10,000 | 10,000 | 10,000 |
|---|
3/17 | 10,766 | 10,666 | 11,717 | 11,152 | 10,054 |
|---|
3/18 | 11,694 | 11,586 | 13,356 | 12,267 | 10,193 |
|---|
3/19 | 12,119 | 12,007 | 14,625 | 12,945 | 10,649 |
|---|
3/20 | 11,509 | 11,402 | 13,604 | 12,906 | 11,695 |
|---|
3/21 | 14,150 | 14,018 | 21,270 | 17,730 | 11,796 |
|---|
3/22 | 15,146 | 15,005 | 24,599 | 19,271 | 11,342 |
|---|
3/23 | 14,006 | 13,876 | 22,697 | 17,330 | 10,796 |
|---|
3/24 | 15,818 | 15,671 | 29,479 | 20,834 | 10,984 |
|---|
3/25 | 16,253 | 16,102 | 31,912 | 21,963 | 11,496 |
|---|
3/26 | 17,170 | 17,010 | 37,592 | 24,913 | 11,939 |
|---|
|
| AssetsNet |
$ 30,168,006
|
| Holdings Count | Holding |
109
|
| Advisory Fees Paid, Amount |
$ 121,101
|
| InvestmentCompanyPortfolioTurnover |
19.00%
|
| Additional Fund Statistics [Text Block] |
- Total Net Assets$30,168,006
- Number of Portfolio Holdings109
- Portfolio Turnover Rate19%
- Management Fees$121,101
|
| Holdings [Text Block] |
Portfolio Weighting (% of net assets)Table SummaryCommon Stocks | 61.8% |
|---|
Corporate Bonds | 24.4% |
|---|
U.S. Government Obligations | 7.1% |
|---|
Convertible Corporate Bonds | 4.0% |
|---|
Mandatory Convertible Securities | 1.0% |
|---|
Foreign Government Obligations | 0.9% |
|---|
Short Term Investment | 0.2% |
|---|
Other Assets and Liabilities (Net) | 0.6% |
|---|
Industry Allocation (% of net assets) Table SummaryIndustry Weighting | . |
|---|
Financial Services | 17.0% | Semiconductors | 8.1% | U.S. Government
Obligations | 7.1% | Health Care | 7.1% | Diversified Industrial | 6.6% | Energy: Oil | 5.8% | Computer Software and Services | 5.4% | Food and Beverage | 3.8% | Other Industry sectors | 38.5% | Other Assets and Liabilities (Net) | 0.6% | |
| Largest Holdings [Text Block] |
Top 10 Holdings (% of net assets)Table SummaryU.S. Treasury Bonds | 3.9% |
|---|
Amazon.com Inc. | 3.6% |
|---|
NVIDIA Corp. | 3.5% |
|---|
U.S. Treasury Notes | 3.3% |
|---|
Broadcom Inc. | 2.0% |
|---|
NextEra Energy Inc. | 1.6% |
|---|
Deere & Co. | 1.6% |
|---|
CSX Corp. | 1.5% |
|---|
Johnson & Johnson | 1.5% |
|---|
Thermo Fisher Scientific Inc. | 1.5% |
|---|
|
| Material Fund Change [Text Block] |
|
| C000061063 |
|
| Shareholder Report [Line Items] |
|
| Fund Name |
Balanced Fund
|
| Class Name |
Class I
|
| Trading Symbol |
WBBIX
|
| Annual or Semi-Annual Statement [Text Block] |
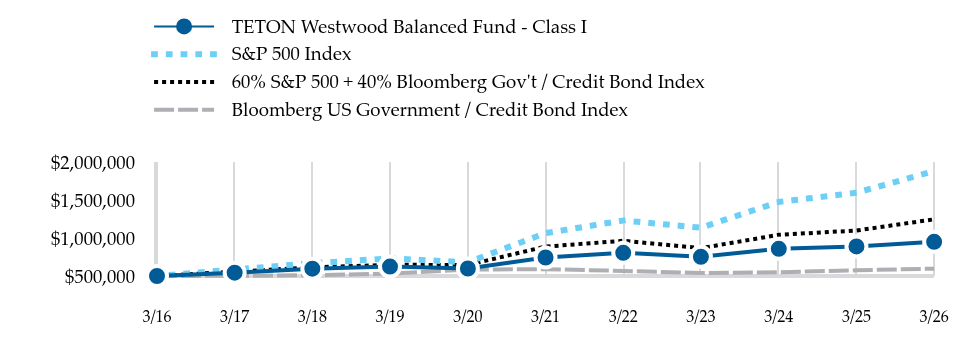
This semi-annual shareholder report contains important information about TETON Westwood Balanced Fund - Class I (the "Fund") for the period of October 1, 2025 to March 31, 2026
|
| Shareholder Report Annual or Semi-Annual |
semi-annual shareholder report
|
| Additional Information [Text Block] |
You can find additional information about the Fund at https://www.tetonadv.com/teton-westwood-funds/tw-balanced/. You can also request this information by contacting us at (800) 422-3554.
|
| Additional Information Phone Number |
(800) 422-3554
|
| Additional Information Website |
https://www.tetonadv.com/teton-westwood-funds/tw-balanced/
|
| Expenses [Text Block] |
What were the Fund costs for the last six months? (based on a hypothetical $10,000 investment) Table SummaryClass Name | Costs of a $10k Investment | Costs Paid as a % of a $10k Investment |
|---|
Balanced Fund - Class I
| $70 | 1.40% |
|---|
|
| Expenses Paid, Amount |
$ 70
|
| Expense Ratio, Percent |
1.40%
|
| Factors Affecting Performance [Text Block] |
How did the Fund perform?For the six month period ended March 31, 2026, the Teton Westwood Balanced Fund outperformed its broad-based benchmark, the S&P 500 Index, and underperformed its comparatives, the Bloomberg US Government / Credit Bond Index and 60% S&P 500 + 40% Bloomberg Gov't / Credit Bond Index. the Amid increased volatility in equity and bond markets, the Fund benefitted from its equity investments, which showed gains in the period as the market tilted away from growth names amid concerns about capital expenditures for artificial intelligence. Convertible securities also contributed to returns. |
| Performance Past Does Not Indicate Future [Text] |
Past performance does not guarantee future results.
|
| Line Graph [Table Text Block] |
Table Summary | TETON Westwood Balanced Fund - Class I | S&P 500 Index | 60% S&P 500 + 40% Bloomberg Gov't / Credit Bond Index | Bloomberg US Government / Credit Bond Index |
|---|
3/16 | 500,000 | 500,000 | 500,000 | 500,000 |
|---|
3/17 | 543,563 | 585,850 | 557,610 | 502,700 |
|---|
3/18 | 595,971 | 667,810 | 613,338 | 509,637 |
|---|
3/19 | 624,084 | 731,252 | 647,267 | 532,469 |
|---|
3/20 | 598,737 | 680,211 | 645,300 | 584,757 |
|---|
3/21 | 743,710 | 1,063,510 | 886,500 | 589,786 |
|---|
3/22 | 804,386 | 1,229,949 | 963,537 | 567,080 |
|---|
3/23 | 751,659 | 1,134,874 | 866,508 | 539,803 |
|---|
3/24 | 857,137 | 1,473,974 | 1,041,682 | 549,196 |
|---|
3/25 | 889,468 | 1,595,577 | 1,098,162 | 574,788 |
|---|
3/26 | 949,306 | 1,879,590 | 1,245,667 | 596,975 |
|---|
|
| AssetsNet |
$ 30,168,006
|
| Holdings Count | Holding |
109
|
| Advisory Fees Paid, Amount |
$ 121,101
|
| InvestmentCompanyPortfolioTurnover |
19.00%
|
| Additional Fund Statistics [Text Block] |
- Total Net Assets$30,168,006
- Number of Portfolio Holdings109
- Portfolio Turnover Rate19%
- Management Fees$121,101
|
| Holdings [Text Block] |
Portfolio Weighting (% of net assets)Table SummaryCommon Stocks | 61.8% |
|---|
Corporate Bonds | 24.4% |
|---|
U.S. Government Obligations | 7.1% |
|---|
Convertible Corporate Bonds | 4.0% |
|---|
Mandatory Convertible Securities | 1.0% |
|---|
Foreign Government Obligations | 0.9% |
|---|
Short Term Investment | 0.2% |
|---|
Other Assets and Liabilities (Net) | 0.6% |
|---|
Industry Allocation (% of net assets) Table SummaryIndustry Weighting | . |
|---|
Financial Services | 17.0% | Semiconductors | 8.1% | U.S. Government Obligations | 7.1% | Health Care | 7.1% | Diversified Industrial | 6.6% | Energy: Oil | 5.8% | Computer Software and Services | 5.4% | Food and Beverage | 3.8% | Other Industry sectors | 38.5% | Other Assets and Liabilities (Net) | 0.6% | |
| Largest Holdings [Text Block] |
Top 10 Holdings (% of net assets)Table SummaryU.S. Treasury Bonds | 3.9% |
|---|
Amazon.com Inc. | 3.6% |
|---|
NVIDIA Corp. | 3.5% |
|---|
U.S. Treasury Notes | 3.3% |
|---|
Broadcom Inc. | 2.0% |
|---|
NextEra Energy Inc. | 1.6% |
|---|
Deere & Co. | 1.6% |
|---|
CSX Corp. | 1.5% |
|---|
Johnson & Johnson | 1.5% |
|---|
Thermo Fisher Scientific Inc. | 1.5% |
|---|
|
| Material Fund Change [Text Block] |
|
| C000002911 |
|
| Shareholder Report [Line Items] |
|
| Fund Name |
Balanced Fund
|
| Class Name |
Class A
|
| Trading Symbol |
WEBCX
|
| Annual or Semi-Annual Statement [Text Block] |
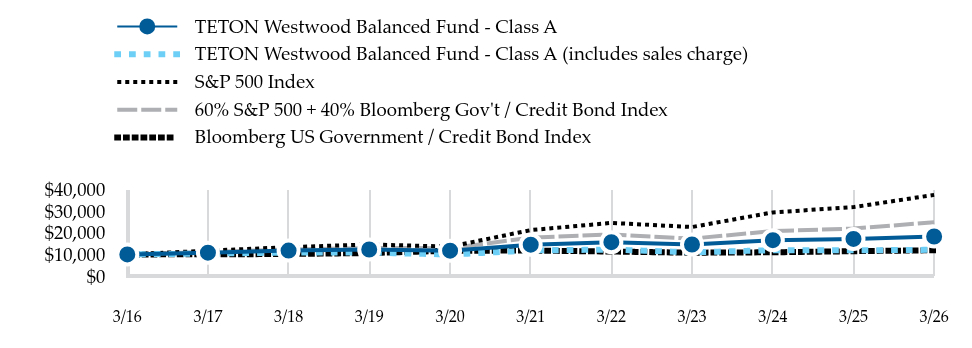
This semi-annual shareholder report contains important information about TETON Westwood Balanced Fund - Class A (the "Fund") for the period of October 1, 2025 to March 31, 2026
|
| Shareholder Report Annual or Semi-Annual |
semi-annual shareholder report
|
| Additional Information [Text Block] |
You can find additional information about the Fund at https://www.tetonadv.com/teton-westwood-funds/tw-balanced/. You can also request this information by contacting us at (800) 422-3554.
|
| Additional Information Phone Number |
(800) 422-3554
|
| Additional Information Website |
https://www.tetonadv.com/teton-westwood-funds/tw-balanced/
|
| Expenses [Text Block] |
What were the Fund costs for the last six months? (based on a hypothetical $10,000 investment) Table SummaryClass Name | Costs of a $10k Investment | Costs Paid as a % of a $10k Investment |
|---|
Balanced Fund - Class A
| $82 | 1.65% |
|---|
|
| Expenses Paid, Amount |
$ 82
|
| Expense Ratio, Percent |
1.65%
|
| Factors Affecting Performance [Text Block] |
How did the Fund perform?For the six month period ended March 31, 2026, the Teton Westwood Balanced Fund outperformed its broad-based benchmark, the S&P 500 Index, and underperformed its comparatives, the Bloomberg US Government / Credit Bond Index and 60% S&P 500 + 40% Bloomberg Gov't / Credit Bond Index. the Amid increased volatility in equity and bond markets, the Fund benefitted from its equity investments, which showed gains in the period as the market tilted away from growth names amid concerns about capital expenditures for artificial intelligence. Convertible securities also contributed to returns. |
| Performance Past Does Not Indicate Future [Text] |
Past performance does not guarantee future results.
|
| Line Graph [Table Text Block] |
Table Summary | TETON Westwood Balanced Fund - Class A | TETON Westwood Balanced Fund - Class A (includes sales charge) | S&P 500 Index | 60% S&P 500 + 40% Bloomberg Gov't / Credit Bond Index | Bloomberg US Government / Credit Bond Index |
|---|
3/16 | 10,000 | 10,000 | 10,000 | 10,000 | 10,000 |
|---|
3/17 | 10,817 | 10,382 | 11,717 | 11,152 | 10,054 |
|---|
3/18 | 11,801 | 10,872 | 13,356 | 12,267 | 10,193 |
|---|
3/19 | 12,292 | 10,868 | 14,625 | 12,945 | 10,649 |
|---|
3/20 | 11,736 | 9,961 | 13,604 | 12,906 | 11,695 |
|---|
3/21 | 14,517 | 11,828 | 21,270 | 17,730 | 11,796 |
|---|
3/22 | 15,662 | 12,252 | 24,599 | 19,271 | 11,342 |
|---|
3/23 | 14,588 | 10,954 | 22,697 | 17,330 | 10,796 |
|---|
3/24 | 16,607 | 11,966 | 29,479 | 20,834 | 10,984 |
|---|
3/25 | 17,194 | 11,890 | 31,912 | 21,963 | 11,496 |
|---|
3/26 | 18,298 | 12,147 | 37,592 | 24,913 | 11,939 |
|---|
|
| AssetsNet |
$ 30,168,006
|
| Holdings Count | Holding |
109
|
| Advisory Fees Paid, Amount |
$ 121,101
|
| InvestmentCompanyPortfolioTurnover |
19.00%
|
| Additional Fund Statistics [Text Block] |
- Total Net Assets$30,168,006
- Number of Portfolio Holdings109
- Portfolio Turnover Rate19%
- Management Fees$121,101
|
| Holdings [Text Block] |
Portfolio Weighting (% of net assets)Table SummaryCommon Stocks | 61.8% |
|---|
Corporate Bonds | 24.4% |
|---|
U.S. Government Obligations | 7.1% |
|---|
Convertible Corporate Bonds | 4.0% |
|---|
Mandatory Convertible Securities | 1.0% |
|---|
Foreign Government Obligations | 0.9% |
|---|
Short Term Investment | 0.2% |
|---|
Other Assets and Liabilities (Net) | 0.6% |
|---|
Industry Allocation (% of net assets) Table SummaryIndustry Weighting | . |
|---|
Financial Services | 17.0% | Semiconductors | 8.1% | U.S. Government
Obligations | 7.1% | Health Care | 7.1% | Diversified Industrial | 6.6% | Energy: Oil | 5.8% | Computer Software and Services | 5.4% | Food and Beverage | 3.8% | Other Industry sectors | 38.5% | Other Assets and Liabilities (Net) | 0.6% | |
| Largest Holdings [Text Block] |
Top 10 Holdings (% of net assets)Table SummaryU.S. Treasury Bonds | 3.9% |
|---|
Amazon.com Inc. | 3.6% |
|---|
NVIDIA Corp. | 3.5% |
|---|
U.S. Treasury Notes | 3.3% |
|---|
Broadcom Inc. | 2.0% |
|---|
NextEra Energy Inc. | 1.6% |
|---|
Deere & Co. | 1.6% |
|---|
CSX Corp. | 1.5% |
|---|
Johnson & Johnson | 1.5% |
|---|
Thermo Fisher Scientific Inc. | 1.5% |
|---|
|
| Material Fund Change [Text Block] |
|
| C000002922 |
|
| Shareholder Report [Line Items] |
|
| Fund Name |
Convertible Securities Fund
|
| Class Name |
Class AAA
|
| Trading Symbol |
WESRX
|
| Annual or Semi-Annual Statement [Text Block] |
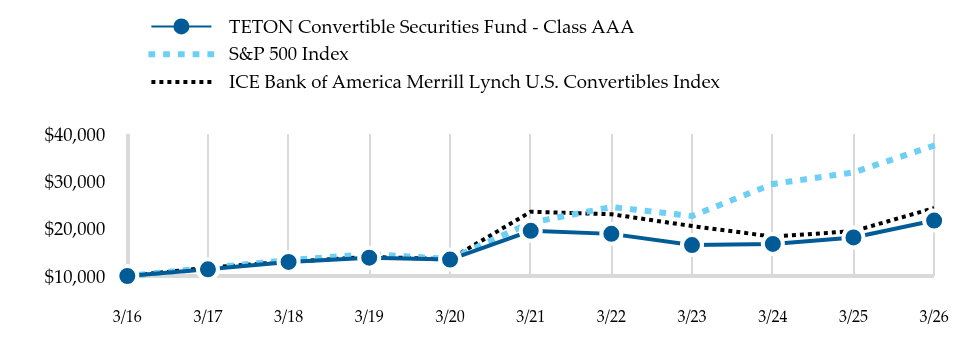
This semi-annual shareholder report contains important information about TETON Convertible Securities Fund - Class AAA (the "Fund") for the period of October 1, 2025 to March 31, 2026
|
| Shareholder Report Annual or Semi-Annual |
semi-annual shareholder report
|
| Additional Information [Text Block] |
You can find additional information about the Fund at https://www.tetonadv.com/teton-westwood-funds/tw-convertible-securities/. You can also request this information by contacting us at (800) 422-3554.
|
| Additional Information Phone Number |
(800) 422-3554
|
| Additional Information Website |
https://www.tetonadv.com/teton-westwood-funds/tw-convertible-securities/
|
| Expenses [Text Block] |
What were the Fund costs for the last six months? (based on a hypothetical $10,000 investment) Table SummaryClass Name | Costs of a $10k Investment | Costs Paid as a % of a $10k Investment |
|---|
Teton Convertible Securities Fund - Class AAA
| $57 | 1.15% |
|---|
|
| Expenses Paid, Amount |
$ 57
|
| Expense Ratio, Percent |
1.15%
|
| Factors Affecting Performance [Text Block] |
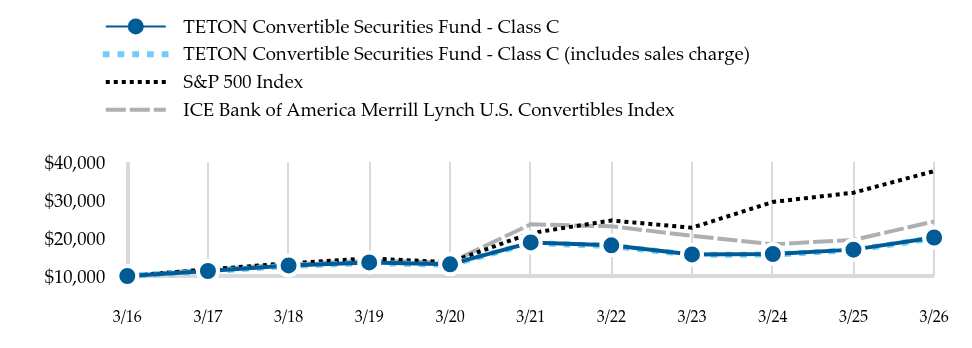
How did the Fund perform?For the six month period ended March 31, 2026, the Teton Convertible Securities Fund underperformed its benchmarks, the S&P 500 and ICE BAML U.S. Convertibles Index. The Fund was underweight a few equity sensitive technology convertibles that accounted for a significant percentage of index performance in the time period. The Fund's focus on balanced convertibles helped it outperform its underlying equities through a volatile market. Top contributors to the portfolio included Lumentum, BridgeBio, Bloom Energy and Brightspring Health Services. Top detractors from performance included Shift4 Payments, Alibaba, and Sofi. |
| Performance Past Does Not Indicate Future [Text] |
Past performance does not guarantee future results.
|
| Line Graph [Table Text Block] |
Table Summary | TETON Convertible Securities Fund - Class AAA | S&P 500 Index | ICE Bank of America Merrill Lynch U.S. Convertibles Index |
|---|
3/16 | 10,000 | 10,000 | 10,000 |
|---|
3/17 | 11,406 | 11,717 | 11,771 |
|---|
3/18 | 12,970 | 13,356 | 13,022 |
|---|
3/19 | 13,877 | 14,625 | 14,043 |
|---|
3/20 | 13,478 | 13,604 | 13,549 |
|---|
3/21 | 19,562 | 21,270 | 23,593 |
|---|
3/22 | 18,913 | 24,599 | 23,071 |
|---|
3/23 | 16,544 | 22,697 | 20,570 |
|---|
3/24 | 16,786 | 29,479 | 18,340 |
|---|
3/25 | 18,157 | 31,912 | 19,490 |
|---|
3/26 | 21,729 | 37,592 | 24,371 |
|---|
|
| AssetsNet |
$ 11,346,286
|
| Holdings Count | Holding |
74
|
| Advisory Fees Paid, Amount |
$ (30,533)
|
| InvestmentCompanyPortfolioTurnover |
48.00%
|
| Additional Fund Statistics [Text Block] |
- Total Net Assets$11,346,286
- Number of Portfolio Holdings74
- Portfolio Turnover Rate48%
- Management Fees$(30,533)
|
| Holdings [Text Block] |
Portfolio Weighting (% of net assets)Table SummaryConvertible Corporate Bonds | 83.2% |
|---|
Mandatory Convertible Securities | 14.4% |
|---|
U.S. Government Obligations | 1.9% |
|---|
Other Assets and Liabilities (Net) | 0.5% |
|---|
Industry Allocation (% of net assets) Table SummaryIndustry Weighting | . |
|---|
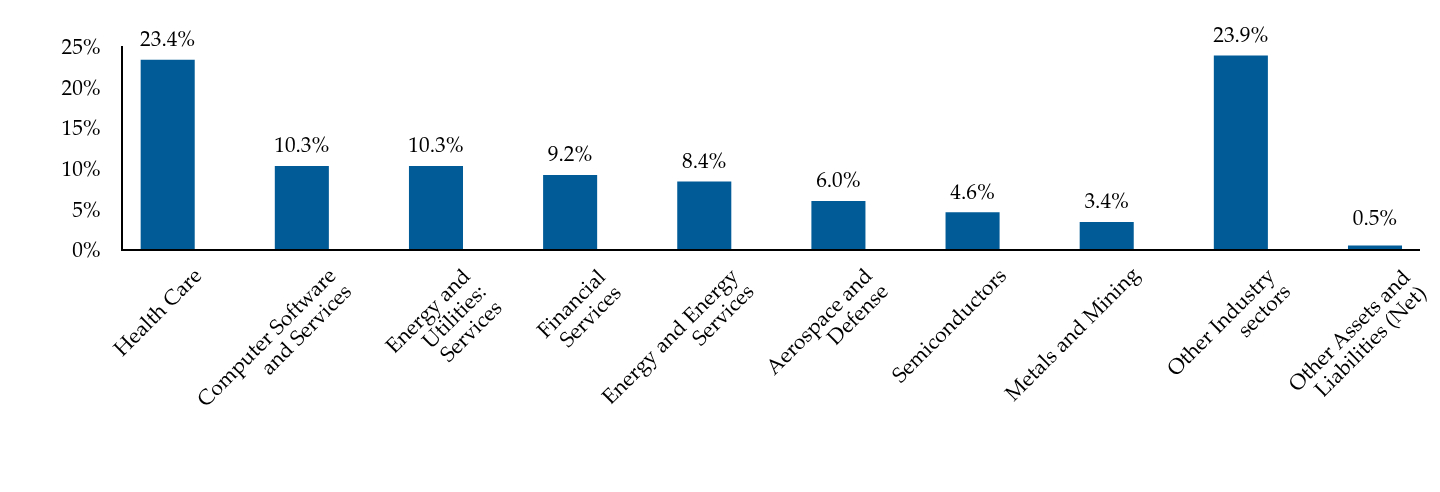
Health Care | 23.4% | Computer Software and Services | 10.3% | Energy and Utilities: Services | 10.3% | Financial Services | 9.2% | Energy and Energy Services | 8.4% | Aerospace and Defense | 6.0% | Semiconductors | 4.6% | Metals and Mining | 3.4% | Other Industry sectors | 23.9% | Other Assets and Liabilities (Net) | 0.5% | |
| Largest Holdings [Text Block] |
Top 10 Holdings (% of net assets)Table SummaryPPL Capital Funding Inc. | 4.1% |
|---|
Bridgebio Pharma Inc. | 3.0% |
|---|
Hewlett Packard Enterprise Co. | 2.8% |
|---|
Digital Realty Trust LP | 2.8% |
|---|
Microchip Technology Inc. | 2.5% |
|---|
BrightSpring Health Services Inc. | 2.5% |
|---|
Alibaba Group Holding Ltd. | 2.5% |
|---|
Lumentum Holdings Inc. | 2.4% |
|---|
Applied Digital Corp. | 2.3% |
|---|
OSI Systems Inc. | 2.3% |
|---|
|
| Material Fund Change [Text Block] |
|
| C000002921 |
|
| Shareholder Report [Line Items] |
|
| Fund Name |
Convertible Securities Fund
|
| Class Name |
Class C
|
| Trading Symbol |
WEICX
|
| Annual or Semi-Annual Statement [Text Block] |
This semi-annual shareholder report contains important information about TETON Convertible Securities Fund - Class C (the "Fund") for the period of October 1, 2025 to March 31, 2026
|
| Shareholder Report Annual or Semi-Annual |
semi-annual shareholder report
|
| Additional Information [Text Block] |
You can find additional information about the Fund at https://www.tetonadv.com/teton-westwood-funds/tw-convertible-securities/. You can also request this information by contacting us at (800) 422-3554.
|
| Additional Information Phone Number |
(800) 422-3554
|
| Additional Information Website |
https://www.tetonadv.com/teton-westwood-funds/tw-convertible-securities/
|
| Expenses [Text Block] |
What were the Fund costs for the last six months? (based on a hypothetical $10,000 investment) Table SummaryClass Name | Costs of a $10k Investment | Costs Paid as a % of a $10k Investment |
|---|
Teton Convertible Securities Fund - Class C
| $94 | 1.90% |
|---|
|
| Expenses Paid, Amount |
$ 94
|
| Expense Ratio, Percent |
1.90%
|
| Factors Affecting Performance [Text Block] |
How did the Fund perform?For the six month period ended March 31, 2026, the Teton Convertible Securities Fund underperformed its benchmarks, the S&P 500 and ICE BAML U.S. Convertibles Index. The Fund was underweight a few equity sensitive technology convertibles that accounted for a significant percentage of index performance in the time period. The Fund's focus on balanced convertibles helped it outperform its underlying equities through a volatile market. Top contributors to the portfolio included Lumentum, BridgeBio, Bloom Energy and Brightspring Health Services. Top detractors from performance included Shift4 Payments, Alibaba, and Sofi. |
| Performance Past Does Not Indicate Future [Text] |
Past performance does not guarantee future results.
|
| Line Graph [Table Text Block] |
Table Summary | TETON Convertible Securities Fund - Class C | TETON Convertible Securities Fund - Class C (includes sales charge) | S&P 500 Index | ICE Bank of America Merrill Lynch U.S. Convertibles Index |
|---|
3/16 | 10,000 | 10,000 | 10,000 | 10,000 |
|---|
3/17 | 11,307 | 11,207 | 11,717 | 11,771 |
|---|
3/18 | 12,771 | 12,658 | 13,356 | 13,022 |
|---|
3/19 | 13,562 | 13,442 | 14,625 | 14,043 |
|---|
3/20 | 13,064 | 12,948 | 13,604 | 13,549 |
|---|
3/21 | 18,823 | 18,656 | 21,270 | 23,593 |
|---|
3/22 | 18,066 | 17,907 | 24,599 | 23,071 |
|---|
3/23 | 15,685 | 15,546 | 22,697 | 20,570 |
|---|
3/24 | 15,792 | 15,652 | 29,479 | 18,340 |
|---|
3/25 | 16,936 | 16,786 | 31,912 | 19,490 |
|---|
3/26 | 20,126 | 19,948 | 37,592 | 24,371 |
|---|
|
| AssetsNet |
$ 11,346,286
|
| Holdings Count | Holding |
74
|
| Advisory Fees Paid, Amount |
$ (30,533)
|
| InvestmentCompanyPortfolioTurnover |
48.00%
|
| Additional Fund Statistics [Text Block] |
- Total Net Assets$11,346,286
- Number of Portfolio Holdings74
- Portfolio Turnover Rate48%
- Management Fees$(30,533)
|
| Holdings [Text Block] |
Portfolio Weighting (% of net assets)Table SummaryConvertible Corporate Bonds | 83.2% |
|---|
Mandatory Convertible Securities | 14.4% |
|---|
U.S. Government Obligations | 1.9% |
|---|
Other Assets and Liabilities (Net) | 0.5% |
|---|
Industry Allocation (% of net assets) Table SummaryIndustry Weighting | . |
|---|
Health Care | 23.4% | Computer Software and Services | 10.3% | Energy and Utilities: Services | 10.3% | Financial Services | 9.2% | Energy and Energy Services | 8.4% | Aerospace and Defense | 6.0% | Semiconductors | 4.6% | Metals and Mining | 3.4% | Other Industry sectors | 23.9% | Other Assets and Liabilities (Net) | 0.5% | |
| Largest Holdings [Text Block] |
Top 10 Holdings (% of net assets)Table SummaryPPL Capital Funding Inc. | 4.1% |
|---|
Bridgebio Pharma Inc. | 3.0% |
|---|
Hewlett Packard Enterprise Co. | 2.8% |
|---|
Digital Realty Trust LP | 2.8% |
|---|
Microchip Technology Inc. | 2.5% |
|---|
BrightSpring Health Services Inc. | 2.5% |
|---|
Alibaba Group Holding Ltd. | 2.5% |
|---|
Lumentum Holdings Inc. | 2.4% |
|---|
Applied Digital Corp. | 2.3% |
|---|
OSI Systems Inc. | 2.3% |
|---|
|
| Material Fund Change [Text Block] |
|
| C000061065 |
|
| Shareholder Report [Line Items] |
|
| Fund Name |
Convertible Securities Fund
|
| Class Name |
Class I
|
| Trading Symbol |
WESIX
|
| Annual or Semi-Annual Statement [Text Block] |
This semi-annual shareholder report contains important information about TETON Convertible Securities Fund - Class I (the "Fund") for the period of October 1, 2025 to March 31, 2026
|
| Shareholder Report Annual or Semi-Annual |
semi-annual shareholder report
|
| Additional Information [Text Block] |
You can find additional information about the Fund at https://www.tetonadv.com/teton-westwood-funds/tw-convertible-securities/. You can also request this information by contacting us at (800) 422-3554.
|
| Additional Information Phone Number |
(800) 422-3554
|
| Additional Information Website |
https://www.tetonadv.com/teton-westwood-funds/tw-convertible-securities/
|
| Expenses [Text Block] |
What were the Fund costs for the last six months? (based on a hypothetical $10,000 investment) Table SummaryClass Name | Costs of a $10k Investment | Costs Paid as a % of a $10k Investment |
|---|
Teton Convertible Securities Fund - Class I
| $44 | 0.90% |
|---|
|
| Expenses Paid, Amount |
$ 44
|
| Expense Ratio, Percent |
0.90%
|
| Factors Affecting Performance [Text Block] |
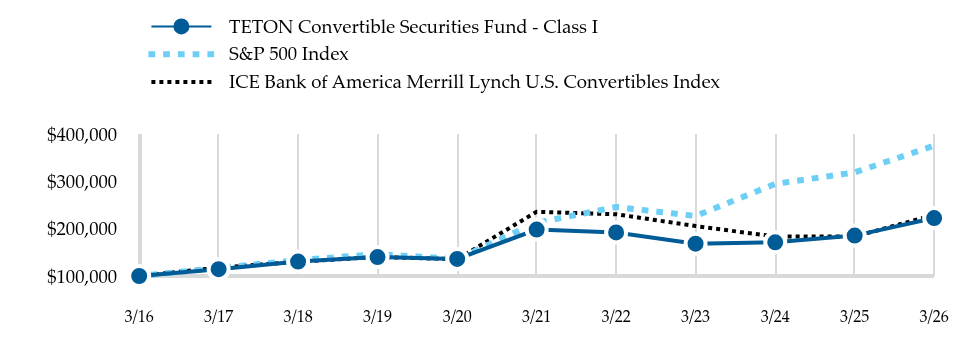
How did the Fund perform?For the six month period ended March 31, 2026, the Teton Convertible Securities Fund underperformed its benchmarks, the S&P 500 and ICE BAML U.S. Convertibles Index. The Fund was underweight a few equity sensitive technology convertibles that accounted for a significant percentage of index performance in the time period. The Fund's focus on balanced convertibles helped it outperform its underlying equities through a volatile market. Top contributors to the portfolio included Lumentum, BridgeBio, Bloom Energy and Brightspring Health Services. Top detractors from performance included Shift4 Payments, Alibaba, and Sofi. |
| Performance Past Does Not Indicate Future [Text] |
Past performance does not guarantee future results.
|
| Line Graph [Table Text Block] |
Table Summary | TETON Convertible Securities Fund - Class I | S&P 500 Index | ICE Bank of America Merrill Lynch U.S. Convertibles Index |
|---|
3/16 | 100,000 | 100,000 | 100,000 |
|---|
3/17 | 114,352 | 117,170 | 117,710 |
|---|
3/18 | 130,528 | 133,562 | 130,223 |
|---|
3/19 | 139,969 | 146,250 | 140,432 |
|---|
3/20 | 136,201 | 136,042 | 135,489 |
|---|
3/21 | 198,180 | 212,702 | 235,927 |
|---|
3/22 | 192,137 | 245,990 | 230,713 |
|---|
3/23 | 168,406 | 226,975 | 205,703 |
|---|
3/24 | 171,217 | 294,795 | 183,399 |
|---|
3/25 | 185,520 | 319,115 | 183,399 |
|---|
3/26 | 222,635 | 375,918 | 229,329 |
|---|
|
| AssetsNet |
$ 11,346,286
|
| Holdings Count | Holding |
74
|
| Advisory Fees Paid, Amount |
$ (30,533)
|
| InvestmentCompanyPortfolioTurnover |
48.00%
|
| Additional Fund Statistics [Text Block] |
- Total Net Assets$11,346,286
- Number of Portfolio Holdings74
- Portfolio Turnover Rate48%
- Management Fees$(30,533)
|
| Holdings [Text Block] |
Portfolio Weighting (% of net assets)Table SummaryConvertible Corporate Bonds | 83.2% |
|---|
Mandatory Convertible Securities | 14.4% |
|---|
U.S. Government Obligations | 1.9% |
|---|
Other Assets and Liabilities (Net) | 0.5% |
|---|
Industry Allocation (% of net assets) Table SummaryIndustry Weighting | . |
|---|
Health Care | 23.4% | Computer Software and Services | 10.3% | Energy and Utilities: Services | 10.3% | Financial Services | 9.2% | Energy and Energy Services | 8.4% | Aerospace and Defense | 6.0% | Semiconductors | 4.6% | Metals and Mining | 3.4% | Other Industry sectors | 23.9% | Other Assets and Liabilities (Net) | 0.5% | |
| Largest Holdings [Text Block] |
Top 10 Holdings (% of net assets)Table SummaryPPL Capital Funding Inc. | 4.1% |
|---|
Bridgebio Pharma Inc. | 3.0% |
|---|
Hewlett Packard Enterprise Co. | 2.8% |
|---|
Digital Realty Trust LP | 2.8% |
|---|
Microchip Technology Inc. | 2.5% |
|---|
BrightSpring Health Services Inc. | 2.5% |
|---|
Alibaba Group Holding Ltd. | 2.5% |
|---|
Lumentum Holdings Inc. | 2.4% |
|---|
Applied Digital Corp. | 2.3% |
|---|
OSI Systems Inc. | 2.3% |
|---|
|
| Material Fund Change [Text Block] |
|
| C000002919 |
|
| Shareholder Report [Line Items] |
|
| Fund Name |
Convertible Securities Fund
|
| Class Name |
Class A
|
| Trading Symbol |
WEIAX
|
| Annual or Semi-Annual Statement [Text Block] |
This semi-annual shareholder report contains important information about TETON Convertible Securities Fund - Class A (the "Fund") for the period of October 1, 2025 to March 31, 2026
|
| Shareholder Report Annual or Semi-Annual |
semi-annual shareholder report
|
| Additional Information [Text Block] |
You can find additional information about the Fund at https://www.tetonadv.com/teton-westwood-funds/tw-convertible-securities/. You can also request this information by contacting us at (800) 422-3554.
|
| Additional Information Phone Number |
(800) 422-3554
|
| Additional Information Website |
https://www.tetonadv.com/teton-westwood-funds/tw-convertible-securities/
|
| Expenses [Text Block] |
What were the Fund costs for the last six months? (based on a hypothetical $10,000 investment) Table SummaryClass Name | Costs of a $10k Investment | Costs Paid as a % of a $10k Investment |
|---|
Teton Convertible Securities Fund - Class A
| $57 | 1.15% |
|---|
|
| Expenses Paid, Amount |
$ 57
|
| Expense Ratio, Percent |
1.15%
|
| Factors Affecting Performance [Text Block] |
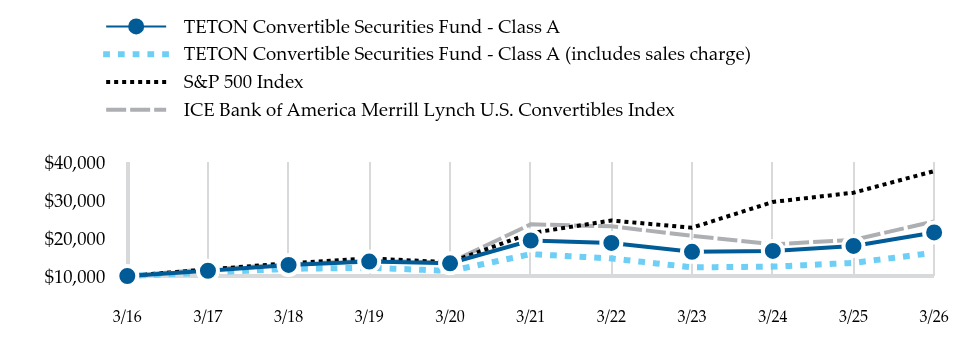
How did the Fund perform?For the six month period ended March 31, 2026, the Teton Convertible Securities Fund underperformed its benchmarks, the S&P 500 and ICE BAML U.S. Convertibles Index. The Fund was underweight a few equity sensitive technology convertibles that accounted for a significant percentage of index performance in the time period. The Fund's focus on balanced convertibles helped it outperform its underlying equities through a volatile market. Top contributors to the portfolio included Lumentum, BridgeBio, Bloom Energy and Brightspring Health Services. Top detractors from performance included Shift4 Payments, Alibaba, and Sofi. |
| Performance Past Does Not Indicate Future [Text] |
Past performance does not guarantee future results.
|
| Line Graph [Table Text Block] |
Table Summary | TETON Convertible Securities Fund - Class A | TETON Convertible Securities Fund - Class A (includes sales charge) | S&P 500 Index | ICE Bank of America Merrill Lynch U.S. Convertibles Index |
|---|
3/16 | 10,000 | 10,000 | 10,000 | 10,000 |
|---|
3/17 | 11,378 | 10,919 | 11,717 | 11,771 |
|---|
3/18 | 12,910 | 11,890 | 13,356 | 13,022 |
|---|
3/19 | 13,781 | 12,186 | 14,625 | 14,043 |
|---|
3/20 | 13,344 | 11,327 | 13,604 | 13,549 |
|---|
3/21 | 19,333 | 15,752 | 21,270 | 23,593 |
|---|
3/22 | 18,692 | 14,617 | 24,599 | 23,071 |
|---|
3/23 | 16,351 | 12,278 | 22,697 | 20,570 |
|---|
3/24 | 16,592 | 12,459 | 29,479 | 18,340 |
|---|
3/25 | 17,913 | 13,450 | 31,912 | 19,490 |
|---|
3/26 | 21,454 | 16,109 | 37,592 | 24,371 |
|---|
|
| AssetsNet |
$ 11,346,286
|
| Holdings Count | Holding |
74
|
| Advisory Fees Paid, Amount |
$ (30,533)
|
| InvestmentCompanyPortfolioTurnover |
48.00%
|
| Additional Fund Statistics [Text Block] |
- Total Net Assets$11,346,286
- Number of Portfolio Holdings74
- Portfolio Turnover Rate48%
- Management Fees$(30,533)
|
| Holdings [Text Block] |
Portfolio Weighting (% of net assets)Table SummaryConvertible Corporate Bonds | 83.2% |
|---|
Mandatory Convertible Securities | 14.4% |
|---|
U.S. Government Obligations | 1.9% |
|---|
Other Assets and Liabilities (Net) | 0.5% |
|---|
Industry Allocation (% of net assets) Table SummaryIndustry Weighting | . |
|---|
Health Care | 23.4% | Computer Software and Services | 10.3% | Energy and Utilities: Services | 10.3% | Financial Services | 9.2% | Energy and Energy Services | 8.4% | Aerospace and Defense | 6.0% | Semiconductors | 4.6% | Metals and Mining | 3.4% | Other Industry sectors | 23.9% | Other Assets and Liabilities (Net) | 0.5% | |
| Largest Holdings [Text Block] |
Top 10 Holdings (% of net assets)Table SummaryPPL Capital Funding Inc. | 4.1% |
|---|
Bridgebio Pharma Inc. | 3.0% |
|---|
Hewlett Packard Enterprise Co. | 2.8% |
|---|
Digital Realty Trust LP | 2.8% |
|---|
Microchip Technology Inc. | 2.5% |
|---|
BrightSpring Health Services Inc. | 2.5% |
|---|
Alibaba Group Holding Ltd. | 2.5% |
|---|
Lumentum Holdings Inc. | 2.4% |
|---|
Applied Digital Corp. | 2.3% |
|---|
OSI Systems Inc. | 2.3% |
|---|
|
| Material Fund Change [Text Block] |
|
| C000002918 |
|
| Shareholder Report [Line Items] |
|
| Fund Name |
Equity Fund
|
| Class Name |
Class AAA
|
| Trading Symbol |
WESWX
|
| Annual or Semi-Annual Statement [Text Block] |
This semi-annual shareholder report contains important information about TETON Westwood Equity Fund - Class AAA (the "Fund") for the period of October 1, 2025 to March 31, 2026
|
| Shareholder Report Annual or Semi-Annual |
semi-annual shareholder report
|
| Additional Information [Text Block] |
You can find additional information about the Fund at https://www.tetonadv.com/teton-westwood-funds/tw-equity/. You can also request this information by contacting us at (800) 422-3554.
|
| Additional Information Phone Number |
(800) 422-3554
|
| Additional Information Website |
https://www.tetonadv.com/teton-westwood-funds/tw-equity/
|
| Expenses [Text Block] |
What were the Fund costs for the last six months? (based on a hypothetical $10,000 investment) Table SummaryClass Name | Costs of a $10k Investment | Costs Paid as a % of a $10k Investment |
|---|
Equity Fund - Class AAA
| $90 | 1.80% |
|---|
|
| Expenses Paid, Amount |
$ 90
|
| Expense Ratio, Percent |
1.80%
|
| Factors Affecting Performance [Text Block] |
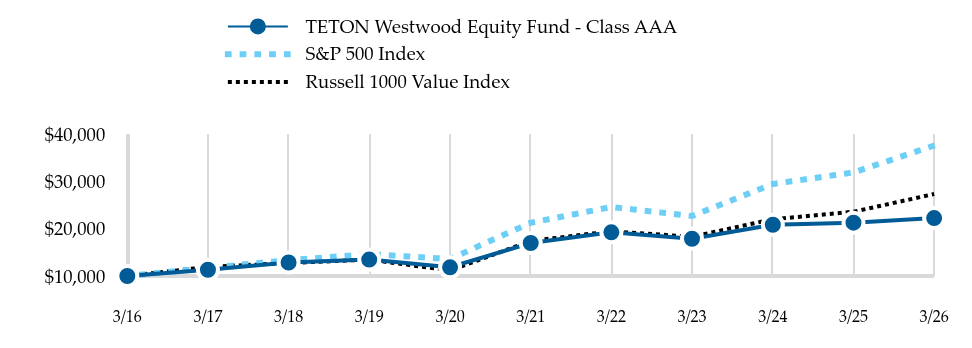
How did the Fund perform?For the six month period ended March 31, 2026, the Teton Westwood Equity Fund outperformed its broad-based benchmark the S&P 500 Index and underperformed its comparative, the Russell 1000 Value Index. The stock market rally that began in 2025 continued into the new year, though it ran out of steam as stocks declined amid war in the Middle East and challenging economic statistics. The selling to close the period was indiscriminate and broad-based, impacting large and small cap, growth and value stocks. |
| Performance Past Does Not Indicate Future [Text] |
Past performance does not guarantee future results.
|
| Line Graph [Table Text Block] |
Table Summary | TETON Westwood Equity Fund - Class AAA | S&P 500 Index | Russell 1000 Value Index |
|---|
3/16 | 10,000 | 10,000 | 10,000 |
|---|
3/17 | 11,327 | 11,717 | 11,922 |
|---|
3/18 | 12,855 | 13,356 | 12,751 |
|---|
3/19 | 13,475 | 14,625 | 13,474 |
|---|
3/20 | 11,844 | 13,604 | 11,160 |
|---|
3/21 | 16,983 | 21,270 | 17,420 |
|---|
3/22 | 19,238 | 24,599 | 19,453 |
|---|
3/23 | 17,877 | 22,697 | 18,303 |
|---|
3/24 | 20,846 | 29,479 | 22,013 |
|---|
3/25 | 21,281 | 31,912 | 23,594 |
|---|
3/26 | 22,258 | 37,592 | 27,338 |
|---|
|
| AssetsNet |
$ 37,790,503
|
| Holdings Count | Holding |
53
|
| Advisory Fees Paid, Amount |
$ 201,070
|
| InvestmentCompanyPortfolioTurnover |
27.00%
|
| Additional Fund Statistics [Text Block] |
- Total Net Assets$37,790,503
- Number of Portfolio Holdings53
- Portfolio Turnover Rate27%
- Management Fees$201,070
|
| Holdings [Text Block] |
Portfolio Weighting (% of net assets)Table SummaryCommon Stocks | 99.6% |
|---|
Short Term Investment | 0.4% |
|---|
Other Assets and Liabilities (Net) Footnote Reference* | 0.0% |
|---|
| Footnote | Description | Footnote* | Amount represents less than 0.05% |
Industry Allocation (% of net assets) Table SummaryIndustry Weighting | . |
|---|
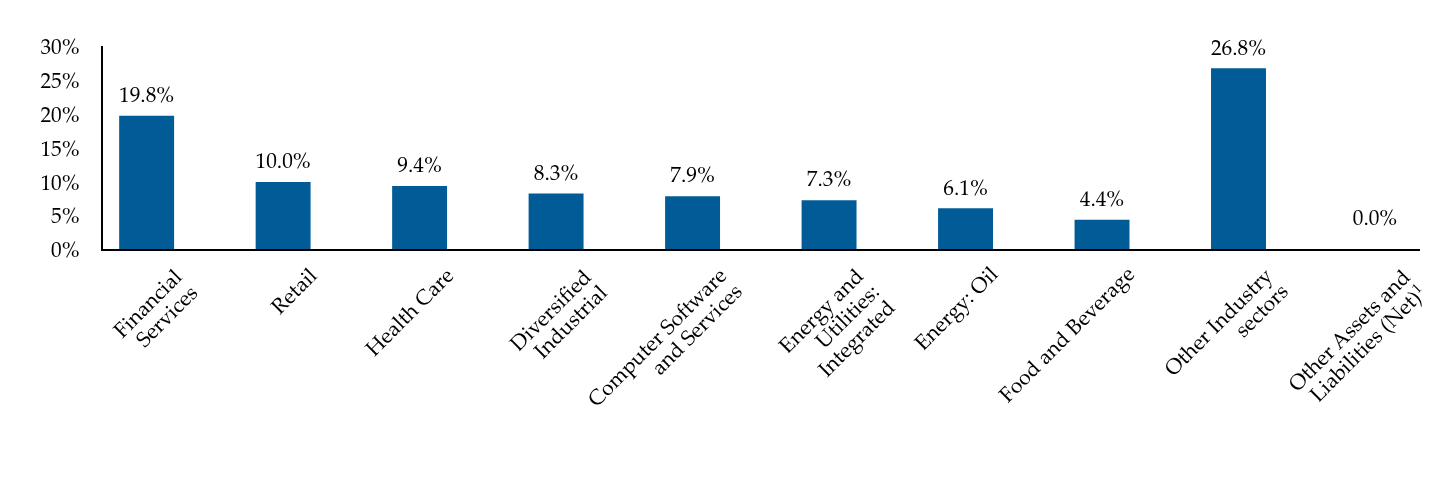
Financial Services | 19.8% | Retail | 10.0% | Health Care | 9.4% | Diversified Industrial | 8.3% | Computer Software and Services | 7.9% | Energy and Utilities: Integrated | 7.3% | Energy: Oil | 6.1% | Food and Beverage | 4.4% | Other Industry sectors | 26.8% | Other Assets and Liabilities (Net)Footnote Reference1 | 0.0% | | Footnote | Description | Footnote1 | Amount represents less than 0.05% |
|
| Largest Holdings [Text Block] |
Top 10 Holdings (% of net assets)Table SummaryAmazon.com Inc. | 3.0% |
|---|
NextEra Energy Inc. | 2.7% |
|---|
Thermo Fisher Scientific Inc. | 2.5% |
|---|
Berkshire Hathaway Inc. | 2.5% |
|---|
RB Global Inc. | 2.5% |
|---|
Alphabet Inc. | 2.4% |
|---|
Johnson & Johnson | 2.4% |
|---|
The Home Depot Inc. | 2.4% |
|---|
CSX Corp. | 2.4% |
|---|
Exxon Mobil Corp. | 2.4% |
|---|
|
| Material Fund Change [Text Block] |
|
| C000002916 |
|
| Shareholder Report [Line Items] |
|
| Fund Name |
Equity Fund
|
| Class Name |
Class C
|
| Trading Symbol |
WEQCX
|
| Annual or Semi-Annual Statement [Text Block] |
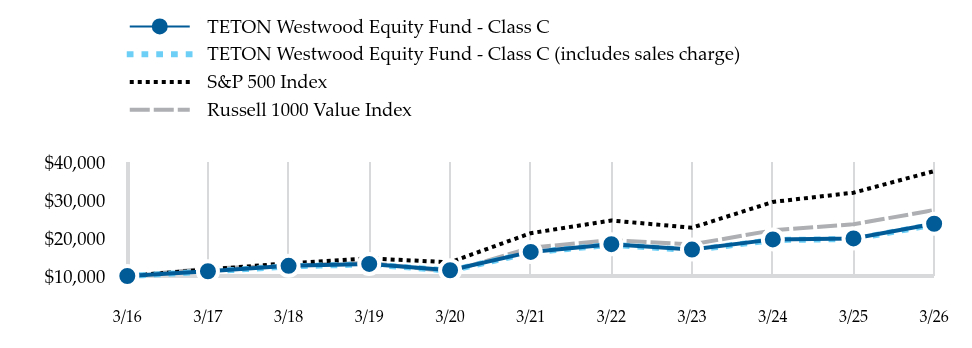
This semi-annual shareholder report contains important information about TETON Westwood Equity Fund - Class C (the "Fund") for the period of October 1, 2025 to March 31, 2026
|
| Shareholder Report Annual or Semi-Annual |
semi-annual shareholder report
|
| Additional Information [Text Block] |
You can find additional information about the Fund at https://www.tetonadv.com/teton-westwood-funds/tw-equity/. You can also request this information by contacting us at (800) 422-3554.
|
| Additional Information Phone Number |
(800) 422-3554
|
| Additional Information Website |
https://www.tetonadv.com/teton-westwood-funds/tw-equity/
|
| Expenses [Text Block] |
What were the Fund costs for the last six months? (based on a hypothetical $10,000 investment) Table SummaryClass Name | Costs of a $10k Investment | Costs Paid as a % of a $10k Investment |
|---|
Equity Fund - Class C
| $137 | 2.56% |
|---|
|
| Expenses Paid, Amount |
$ 137
|
| Expense Ratio, Percent |
2.56%
|
| Factors Affecting Performance [Text Block] |
How did the Fund perform?For the six month period ended March 31, 2026, the Teton Westwood Equity Fund outperformed its broad-based benchmark the S&P 500 Index and underperformed its comparative, the Russell 1000 Value Index. The stock market rally that began in 2025 continued into the new year, though it ran out of steam as stocks declined amid war in the Middle East and challenging economic statistics. The selling to close the period was indiscriminate and broad-based, impacting large and small cap, growth and value stocks. |
| Performance Past Does Not Indicate Future [Text] |
Past performance does not guarantee future results.
|
| Line Graph [Table Text Block] |
Table Summary | TETON Westwood Equity Fund - Class C | TETON Westwood Equity Fund - Class C (includes sales charge) | S&P 500 Index | Russell 1000 Value Index |
|---|
3/16 | 10,000 | 10,000 | 10,000 | 10,000 |
|---|
3/17 | 11,253 | 11,153 | 11,717 | 11,922 |
|---|
3/18 | 12,667 | 12,554 | 13,356 | 12,751 |
|---|
3/19 | 13,174 | 13,057 | 14,625 | 13,474 |
|---|
3/20 | 11,506 | 11,403 | 13,604 | 11,160 |
|---|
3/21 | 16,339 | 16,194 | 21,270 | 17,420 |
|---|
3/22 | 18,376 | 18,213 | 24,599 | 19,453 |
|---|
3/23 | 16,953 | 16,803 | 22,697 | 18,303 |
|---|
3/24 | 19,633 | 19,458 | 29,479 | 22,013 |
|---|
3/25 | 19,892 | 19,715 | 31,912 | 23,594 |
|---|
3/26 | 23,751 | 23,540 | 37,592 | 27,338 |
|---|
|
| AssetsNet |
$ 37,790,503
|
| Holdings Count | Holding |
53
|
| Advisory Fees Paid, Amount |
$ 201,070
|
| InvestmentCompanyPortfolioTurnover |
27.00%
|
| Additional Fund Statistics [Text Block] |
- Total Net Assets$37,790,503
- Number of Portfolio Holdings53
- Portfolio Turnover Rate27%
- Management Fees$201,070
|
| Holdings [Text Block] |
Portfolio Weighting (% of net assets)Table SummaryCommon Stocks | 99.6% |
|---|
Short Term Investment | 0.4% |
|---|
Other Assets and Liabilities (Net) Footnote Reference* | 0.0% |
|---|
| Footnote | Description | Footnote* | Amount represents less than 0.05% |
Industry Allocation (% of net assets) Table SummaryIndustry Weighting | . |
|---|
Financial Services | 19.8% | Retail | 10.0% | Health Care | 9.4% | Diversified Industrial | 8.3% | Computer Software and Services | 7.9% | Energy and Utilities: Integrated | 7.3% | Energy: Oil | 6.1% | Food and Beverage | 4.4% | Other Industry sectors | 26.8% | Other Assets and Liabilities (Net)Footnote Reference1 | 0.0% | | Footnote | Description | Footnote1 | Amount represents less than 0.05% |
|
| Largest Holdings [Text Block] |
Top 10 Holdings (% of net assets)Table SummaryAmazon.com Inc. | 3.0% |
|---|
NextEra Energy Inc. | 2.7% |
|---|
Thermo Fisher Scientific Inc. | 2.5% |
|---|
Berkshire Hathaway Inc. | 2.5% |
|---|
RB Global Inc. | 2.5% |
|---|
Alphabet Inc. | 2.4% |
|---|
Johnson & Johnson | 2.4% |
|---|
The Home Depot Inc. | 2.4% |
|---|
CSX Corp. | 2.4% |
|---|
Exxon Mobil Corp. | 2.4% |
|---|
|
| Material Fund Change [Text Block] |
|
| C000061064 |
|
| Shareholder Report [Line Items] |
|
| Fund Name |
Equity Fund
|
| Class Name |
Class I
|
| Trading Symbol |
WEEIX
|
| Annual or Semi-Annual Statement [Text Block] |
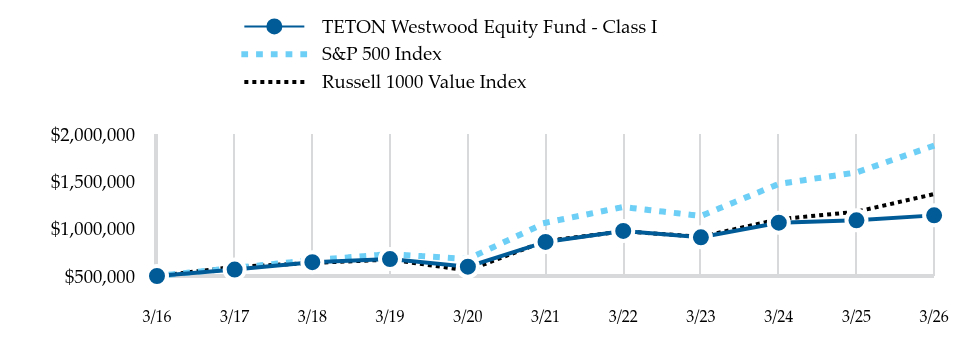
This semi-annual shareholder report contains important information about TETON Westwood Equity Fund - Class I (the "Fund") for the period of October 1, 2025 to March 31, 2026
|
| Shareholder Report Annual or Semi-Annual |
semi-annual shareholder report
|
| Additional Information [Text Block] |
You can find additional information about the Fund at https://www.tetonadv.com/teton-westwood-funds/tw-equity/. You can also request this information by contacting us at (800) 422-3554.
|
| Additional Information Phone Number |
(800) 422-3554
|
| Additional Information Website |
https://www.tetonadv.com/teton-westwood-funds/tw-equity/
|
| Expenses [Text Block] |
What were the Fund costs for the last six months? (based on a hypothetical $10,000 investment) Table SummaryClass Name | Costs of a $10k Investment | Costs Paid as a % of a $10k Investment |
|---|
Equity Fund - Class I
| $77 | 1.55% |
|---|
|
| Expenses Paid, Amount |
$ 77
|
| Expense Ratio, Percent |
1.55%
|
| Factors Affecting Performance [Text Block] |
How did the Fund perform?For the six month period ended March 31, 2026, the Teton Westwood Equity Fund outperformed its broad-based benchmark the S&P 500 Index and underperformed its comparative, the Russell 1000 Value Index. The stock market rally that began in 2025 continued into the new year, though it ran out of steam as stocks declined amid war in the Middle East and challenging economic statistics. The selling to close the period was indiscriminate and broad-based, impacting large and small cap, growth and value stocks. |
| Performance Past Does Not Indicate Future [Text] |
Past performance does not guarantee future results.
|
| Line Graph [Table Text Block] |
Table Summary | TETON Westwood Equity Fund - Class I | S&P 500 Index | Russell 1000 Value Index |
|---|
3/16 | 500,000 | 500,000 | 500,000 |
|---|
3/17 | 567,986 | 585,850 | 596,100 |
|---|
3/18 | 645,997 | 667,810 | 637,529 |
|---|
3/19 | 679,097 | 731,252 | 673,677 |
|---|
3/20 | 598,611 | 680,211 | 558,007 |
|---|
3/21 | 860,262 | 1,063,510 | 870,992 |
|---|
3/22 | 976,969 | 1,229,949 | 972,637 |
|---|
3/23 | 909,434 | 1,134,874 | 915,154 |
|---|
3/24 | 1,064,034 | 1,473,974 | 1,100,656 |
|---|
3/25 | 1,088,742 | 1,595,577 | 1,179,683 |
|---|
3/26 | 1,141,356 | 1,879,590 | 1,366,899 |
|---|
|
| AssetsNet |
$ 37,790,503
|
| Holdings Count | Holding |
53
|
| Advisory Fees Paid, Amount |
$ 201,070
|
| InvestmentCompanyPortfolioTurnover |
27.00%
|
| Additional Fund Statistics [Text Block] |
- Total Net Assets$37,790,503
- Number of Portfolio Holdings53
- Portfolio Turnover Rate27%
- Management Fees$201,070
|
| Holdings [Text Block] |
Portfolio Weighting (% of net assets)Table SummaryCommon Stocks | 99.6% |
|---|
Short Term Investment | 0.4% |
|---|
Other Assets and Liabilities (Net) Footnote Reference* | 0.0% |
|---|
| Footnote | Description | Footnote* | Amount represents less than 0.05% |
Industry Allocation (% of net assets) Table SummaryIndustry Weighting | . |
|---|
Financial Services | 19.8% | Retail | 10.0% | Health Care | 9.4% | Diversified Industrial | 8.3% | Computer Software and Services | 7.9% | Energy and Utilities: Integrated | 7.3% | Energy: Oil | 6.1% | Food and Beverage | 4.4% | Other Industry sectors | 26.8% | Other Assets and Liabilities (Net)Footnote Reference1 | 0.0% | | Footnote | Description | Footnote1 | Amount represents less than 0.05% |
|
| Largest Holdings [Text Block] |
Top 10 Holdings (% of net assets)Table SummaryAmazon.com Inc. | 3.0% |
|---|
NextEra Energy Inc. | 2.7% |
|---|
Thermo Fisher Scientific Inc. | 2.5% |
|---|
Berkshire Hathaway Inc. | 2.5% |
|---|
RB Global Inc. | 2.5% |
|---|
Alphabet Inc. | 2.4% |
|---|
Johnson & Johnson | 2.4% |
|---|
The Home Depot Inc. | 2.4% |
|---|
CSX Corp. | 2.4% |
|---|
Exxon Mobil Corp. | 2.4% |
|---|
|
| Material Fund Change [Text Block] |
|
| C000002917 |
|
| Shareholder Report [Line Items] |
|
| Fund Name |
Equity Fund
|
| Class Name |
Class A
|
| Trading Symbol |
WEECX
|
| Annual or Semi-Annual Statement [Text Block] |
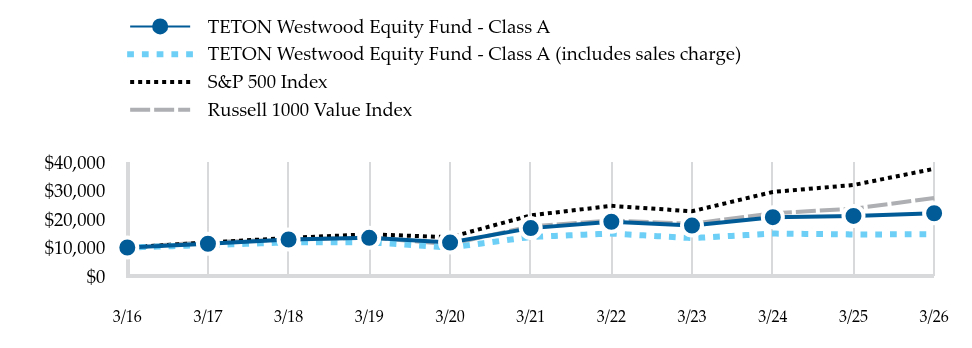
This semi-annual shareholder report contains important information about TETON Westwood Equity Fund - Class A (the "Fund") for the period of October 1, 2025 to March 31, 2026
|
| Shareholder Report Annual or Semi-Annual |
semi-annual shareholder report
|
| Additional Information [Text Block] |
You can find additional information about the Fund at https://www.tetonadv.com/teton-westwood-funds/tw-equity/. You can also request this information by contacting us at (800) 422-3554.
|
| Additional Information Phone Number |
(800) 422-3554
|
| Additional Information Website |
https://www.tetonadv.com/teton-westwood-funds/tw-equity/
|
| Expenses [Text Block] |
What were the Fund costs for the last six months? (based on a hypothetical $10,000 investment) Table SummaryClass Name | Costs of a $10k Investment | Costs Paid as a % of a $10k Investment |
|---|
Equity Fund - Class A
| $90 | 1.80% |
|---|
|
| Expenses Paid, Amount |
$ 90
|
| Expense Ratio, Percent |
1.80%
|
| Factors Affecting Performance [Text Block] |
How did the Fund perform?For the six month period ended March 31, 2026, the Teton Westwood Equity Fund outperformed its broad-based benchmark the S&P 500 Index and underperformed its comparative, the Russell 1000 Value Index. The stock market rally that began in 2025 continued into the new year, though it ran out of steam as stocks declined amid war in the Middle East and challenging economic statistics. The selling to close the period was indiscriminate and broad-based, impacting large and small cap, growth and value stocks. |
| Performance Past Does Not Indicate Future [Text] |
Past performance does not guarantee future results.
|
| Line Graph [Table Text Block] |
Table Summary | TETON Westwood Equity Fund - Class A | TETON Westwood Equity Fund - Class A (includes sales charge) | S&P 500 Index | Russell 1000 Value Index |
|---|
3/16 | 10,000 | 10,000 | 10,000 | 10,000 |
|---|
3/17 | 11,299 | 10,847 | 11,717 | 11,922 |
|---|
3/18 | 12,795 | 11,792 | 13,356 | 12,751 |
|---|
3/19 | 13,372 | 11,831 | 14,625 | 13,474 |
|---|
3/20 | 11,735 | 9,967 | 13,604 | 11,160 |
|---|
3/21 | 16,791 | 13,691 | 21,270 | 17,420 |
|---|
3/22 | 19,021 | 14,889 | 24,599 | 19,453 |
|---|
3/23 | 17,671 | 13,279 | 22,697 | 18,303 |
|---|
3/24 | 20,625 | 14,879 | 29,479 | 22,013 |
|---|
3/25 | 21,054 | 14,581 | 31,912 | 23,594 |
|---|
3/26 | 21,997 | 14,625 | 37,592 | 27,338 |
|---|
|
| AssetsNet |
$ 37,790,503
|
| Holdings Count | Holding |
53
|
| Advisory Fees Paid, Amount |
$ 201,070
|
| InvestmentCompanyPortfolioTurnover |
27.00%
|
| Additional Fund Statistics [Text Block] |
- Total Net Assets$37,790,503
- Number of Portfolio Holdings53
- Portfolio Turnover Rate27%
- Management Fees$201,070
|
| Holdings [Text Block] |
Portfolio Weighting (% of net assets)Table SummaryCommon Stocks | 99.6% |
|---|
Short Term Investment | 0.4% |
|---|
Other Assets and Liabilities (Net) Footnote Reference* | 0.0% |
|---|
| Footnote | Description | Footnote* | Amount represents less than 0.05% |
Industry Allocation (% of net assets) Table SummaryIndustry Weighting | . |
|---|
Financial Services | 19.8% | Retail | 10.0% | Health Care | 9.4% | Diversified Industrial | 8.3% | Computer Software and Services | 7.9% | Energy and Utilities: Integrated | 7.3% | Energy: Oil | 6.1% | Food and Beverage | 4.4% | Other Industry sectors | 26.8% | Other Assets and Liabilities (Net)Footnote Reference1 | 0.0% | | Footnote | Description | Footnote1 | Amount represents less than 0.05% |
|
| Largest Holdings [Text Block] |
Top 10 Holdings (% of net assets)Table SummaryAmazon.com Inc. | 3.0% |
|---|
NextEra Energy Inc. | 2.7% |
|---|
Thermo Fisher Scientific Inc. | 2.5% |
|---|
Berkshire Hathaway Inc. | 2.5% |
|---|
RB Global Inc. | 2.5% |
|---|
Alphabet Inc. | 2.4% |
|---|
Johnson & Johnson | 2.4% |
|---|
The Home Depot Inc. | 2.4% |
|---|
CSX Corp. | 2.4% |
|---|
Exxon Mobil Corp. | 2.4% |
|---|
|
| Material Fund Change [Text Block] |
|
| C000002928 |
|
| Shareholder Report [Line Items] |
|
| Fund Name |
Mighty Mites Fund
|
| Class Name |
Class AAA
|
| Trading Symbol |
WEMMX
|
| Annual or Semi-Annual Statement [Text Block] |
This semi-annual shareholder report contains important information about TETON Westwood Mighty Mites Fund - Class AAA (the "Fund") for the period of October 1, 2025 to March 31, 2026
|
| Shareholder Report Annual or Semi-Annual |
semi-annual shareholder report
|
| Additional Information [Text Block] |
You can find additional information about the Fund at https://www.tetonadv.com/teton-westwood-funds/tw-mighty-mites/. You can also request this information by contacting us at (800) 422-3544.
|
| Additional Information Phone Number |
(800) 422-3544
|
| Additional Information Website |
https://www.tetonadv.com/teton-westwood-funds/tw-mighty-mites/
|
| Expenses [Text Block] |
What were the Fund costs for the last six months? (based on a hypothetical $10,000 investment) Table SummaryClass Name | Costs of a $10k Investment | Costs Paid as a % of a $10k Investment |
|---|
Mighty Mites Fund - Class AAA
| $80 | 1.55% |
|---|
|
| Expenses Paid, Amount |
$ 80
|
| Expense Ratio, Percent |
1.55%
|
| Factors Affecting Performance [Text Block] |
How did the Fund perform?For the six month period ended March 31, 2026, the Teton Westwood Mighty Mites Fund outperformed its broad-based benchmark, the Russell 2000 Index, and its comparative, the Dow Jones U.S. Micro-Cap Total Stock Market Index. Performance was driven by strength across our industrial holdings, particularly within aerospace and defense. This was partially offset by the Fund’s underweight positions in energy and healthcare, primarily biotechnology. Contributors to performance included Astronics Corp, Ultra Clean Holdings, Inc., and Myers Industries, Inc. Detractors from the portfolio included Gibraltar Industries, Inc., Full House Resorts, Inc., and Eastern Company. |
| Performance Past Does Not Indicate Future [Text] |
Past performance does not guarantee future results.
|
| Line Graph [Table Text Block] |
Table Summary | TETON Westwood Mighty Mites Fund - Class AAA | Russell 2000 Index | Dow Jones U.S. Micro-Cap Total Stock Market Index |
|---|
3/16 | 10,000 | 10,000 | 10,000 |
|---|
3/17 | 12,404 | 12,622 | 12,732 |
|---|
3/18 | 13,704 | 14,110 | 14,435 |
|---|
3/19 | 13,268 | 14,399 | 14,409 |
|---|
3/20 | 9,837 | 10,945 | 10,649 |
|---|
3/21 | 17,733 | 21,326 | 23,341 |
|---|
3/22 | 17,571 | 20,091 | 18,556 |
|---|
3/23 | 16,689 | 17,759 | 14,442 |
|---|
3/24 | 18,956 | 21,259 | 16,298 |
|---|
3/25 | 17,744 | 20,407 | 15,549 |
|---|
3/26 | 22,600 | 25,655 | 20,599 |
|---|
|
| AssetsNet |
$ 181,070,086
|
| Holdings Count | Holding |
277
|
| Advisory Fees Paid, Amount |
$ 917,849
|
| InvestmentCompanyPortfolioTurnover |
1.00%
|
| Additional Fund Statistics [Text Block] |
- Total Net Assets$181,070,086
- Number of Portfolio Holdings277
- Portfolio Turnover Rate1%
- Management Fees$917,849
|
| Holdings [Text Block] |
Portfolio Weighting (% of net assets)Table SummaryCommon Stocks | 97.8% |
|---|
U.S. Government Obligations | 2.1% |
|---|
Preferred Stocks | 0.1% |
|---|
Other Assets and Liabilities (Net)Footnote Reference* | (0.0)% |
|---|
| Footnote | Description | Footnote* | Amount represents greater than (0.05%) |
Industry Allocation (% of net assets) Table SummaryIndustry Weighting | . |
|---|
Financial Services | 15.1% | Diversified Industrial | 12.9% | Health Care | 4.9% | Equipment and Supplies | 4.8% | Aviation: Parts and Services | 4.2% | Building and Construction | 4.1% | Machinery | 3.7% | Electronics | 3.6% | Other Industry sectors | 46.7% | Other Assets and Liabilities (Net)Footnote Reference* | (0.0)% | | Footnote | Description | Footnote* | Amount represents greater than (0.05%) |
|
| Largest Holdings [Text Block] |
Top 10 Holdings (% of net assets)Table SummaryMyers Industries Inc. | 2.9% |
|---|
Astronics Corp. | 2.9% |
|---|
Gencor Industries Inc. | 2.1% |
|---|
Park-Ohio Holdings Corp. | 2.1% |
|---|
Burnham Holdings Inc. | 2.0% |
|---|
The Monarch Cement Co. | 1.8% |
|---|
Rush Enterprises Inc. | 1.7% |
|---|
Capital City Bank Group Inc. | 1.6% |
|---|
Nobility Homes Inc. | 1.6% |
|---|
L.B. Foster Co. | 1.5% |
|---|
|
| Material Fund Change [Text Block] |
|
| C000002930 |
|
| Shareholder Report [Line Items] |
|
| Fund Name |
Mighty Mites Fund
|
| Class Name |
Class C
|
| Trading Symbol |
WMMCX
|
| Annual or Semi-Annual Statement [Text Block] |
This semi-annual shareholder report contains important information about TETON Westwood Mighty Mites Fund - Class C (the "Fund") for the period of October 1, 2025 to March 31, 2026
|
| Shareholder Report Annual or Semi-Annual |
semi-annual shareholder report
|
| Additional Information [Text Block] |
You can find additional information about the Fund at https://www.tetonadv.com/teton-westwood-funds/tw-mighty-mites/. You can also request this information by contacting us at (800) 422-3544.
|
| Additional Information Phone Number |
(800) 422-3544
|
| Additional Information Website |
https://www.tetonadv.com/teton-westwood-funds/tw-mighty-mites/
|
| Expenses [Text Block] |
What were the Fund costs for the last six months? (based on a hypothetical $10,000 investment) Table SummaryClass Name | Costs of a $10k Investment | Costs Paid as a % of a $10k Investment |
|---|
Mighty Mites Fund - Class C
| $119 | 2.30% |
|---|
|
| Expenses Paid, Amount |
$ 119
|
| Expense Ratio, Percent |
2.30%
|
| Factors Affecting Performance [Text Block] |
How did the Fund perform?For the six month period ended March 31, 2026, the Teton Westwood Mighty Mites Fund outperformed its broad-based benchmark, the Russell 2000 Index, and its comparative, the Dow Jones U.S. Micro-Cap Total Stock Market Index. Performance was driven by strength across our industrial holdings, particularly within aerospace and defense. This was partially offset by the Fund’s underweight positions in energy and healthcare, primarily biotechnology. Contributors to performance included Astronics Corp, Ultra Clean Holdings, Inc., and Myers Industries, Inc. Detractors from the portfolio included Gibraltar Industries, Inc., Full House Resorts, Inc., and Eastern Company. |
| Performance Past Does Not Indicate Future [Text] |
Past performance does not guarantee future results.
|
| Line Graph [Table Text Block] |
Table Summary | TETON Westwood Mighty Mites Fund - Class C | TETON Westwood Mighty Mites Fund - Class C (includes sales charge) | Russell 2000 Index | Dow Jones U.S. Micro-Cap Total Stock Market Index |
|---|
3/16 | 10,000 | 10,000 | 10,000 | 10,000 |
|---|
3/17 | 12,313 | 12,213 | 12,622 | 12,732 |
|---|
3/18 | 13,499 | 13,389 | 14,110 | 14,435 |
|---|
3/19 | 12,973 | 12,867 | 14,399 | 14,409 |
|---|
3/20 | 9,542 | 9,465 | 10,945 | 10,649 |
|---|
3/21 | 17,083 | 16,944 | 21,326 | 23,341 |
|---|
3/22 | 16,791 | 16,655 | 20,091 | 18,556 |
|---|
3/23 | 15,837 | 15,708 | 17,759 | 14,442 |
|---|
3/24 | 17,849 | 17,704 | 21,259 | 16,298 |
|---|
3/25 | 16,583 | 16,448 | 20,407 | 15,549 |
|---|
3/26 | 20,965 | 20,794 | 25,655 | 20,599 |
|---|
|
| AssetsNet |
$ 181,070,086
|
| Holdings Count | Holding |
277
|
| Advisory Fees Paid, Amount |
$ 917,849
|
| InvestmentCompanyPortfolioTurnover |
1.00%
|
| Additional Fund Statistics [Text Block] |
- Total Net Assets$181,070,086
- Number of Portfolio Holdings277
- Portfolio Turnover Rate1%
- Management Fees$917,849
|
| Holdings [Text Block] |
Portfolio Weighting (% of net assets)Table SummaryCommon Stocks | 97.8% |
|---|
U.S. Government Obligations | 2.1% |
|---|
Preferred Stocks | 0.1% |
|---|
Other Assets and Liabilities (Net)Footnote Reference* | (0.0)% |
|---|
| Footnote | Description | Footnote* | Amount represents greater than (0.05%) |
Industry Allocation (% of net assets) Table SummaryIndustry Weighting | . |
|---|
Financial Services | 15.1% | Diversified Industrial | 12.9% | Health Care | 4.9% | Equipment and Supplies | 4.8% | Aviation: Parts and Services | 4.2% | Building and Construction | 4.1% | Machinery | 3.7% | Electronics | 3.6% | Other Industry sectors | 46.7% | Other Assets and Liabilities (Net)Footnote Reference* | (0.0)% | | Footnote | Description | Footnote* | Amount represents greater than (0.05%) |
|
| Largest Holdings [Text Block] |
Top 10 Holdings (% of net assets)Table SummaryMyers Industries Inc. | 2.9% |
|---|
Astronics Corp. | 2.9% |
|---|
Gencor Industries Inc. | 2.1% |
|---|
Park-Ohio Holdings Corp. | 2.1% |
|---|
Burnham Holdings Inc. | 2.0% |
|---|
The Monarch Cement Co. | 1.8% |
|---|
Rush Enterprises Inc. | 1.7% |
|---|
Capital City Bank Group Inc. | 1.6% |
|---|
Nobility Homes Inc. | 1.6% |
|---|
L.B. Foster Co. | 1.5% |
|---|
|
| Material Fund Change [Text Block] |
|
| C000061067 |
|
| Shareholder Report [Line Items] |
|
| Fund Name |
Mighty Mites Fund
|
| Class Name |
Class I
|
| Trading Symbol |
WEIMX
|
| Annual or Semi-Annual Statement [Text Block] |
This semi-annual shareholder report contains important information about TETON Westwood Mighty Mites Fund - Class I (the "Fund") for the period of October 1, 2025 to March 31, 2026
|
| Shareholder Report Annual or Semi-Annual |
semi-annual shareholder report
|
| Additional Information [Text Block] |
You can find additional information about the Fund at https://www.tetonadv.com/teton-westwood-funds/tw-mighty-mites/. You can also request this information by contacting us at (800) 422-3544.
|
| Additional Information Phone Number |
(800) 422-3544
|
| Additional Information Website |
https://www.tetonadv.com/teton-westwood-funds/tw-mighty-mites/
|
| Expenses [Text Block] |
What were the Fund costs for the last six months? (based on a hypothetical $10,000 investment) Table SummaryClass Name | Costs of a $10k Investment | Costs Paid as a % of a $10k Investment |
|---|
Mighty Mites Fund - Class I
| $67 | 1.30% |
|---|
|
| Expenses Paid, Amount |
$ 67
|
| Expense Ratio, Percent |
1.30%
|
| Factors Affecting Performance [Text Block] |
How did the Fund perform?For the six month period ended March 31, 2026, the Teton Westwood Mighty Mites Fund outperformed its broad-based benchmark, the Russell 2000 Index, and its comparative, the Dow Jones U.S. Micro-Cap Total Stock Market Index. Performance was driven by strength across our industrial holdings, particularly within aerospace and defense. This was partially offset by the Fund’s underweight positions in energy and healthcare, primarily biotechnology. Contributors to performance included Astronics Corp, Ultra Clean Holdings, Inc., and Myers Industries, Inc. Detractors from the portfolio included Gibraltar Industries, Inc., Full House Resorts, Inc., and Eastern Company. |
| Performance Past Does Not Indicate Future [Text] |
Past performance does not guarantee future results.
|
| Line Graph [Table Text Block] |
Table Summary | TETON Westwood Mighty Mites Fund - Class I | Russell 2000 Index | Dow Jones U.S. Micro-Cap Total Stock Market Index |
|---|
3/16 | 500,000 | 500,000 | 500,000 |
|---|
3/17 | 621,893 | 631,100 | 636,592 |
|---|
3/18 | 688,621 | 705,507 | 721,756 |
|---|
3/19 | 668,223 | 719,970 | 720,453 |
|---|
3/20 | 496,790 | 547,249 | 532,431 |
|---|
3/21 | 897,695 | 1,066,314 | 1,167,044 |
|---|
3/22 | 891,489 | 1,004,575 | 927,793 |
|---|
3/23 | 849,038 | 887,944 | 722,114 |
|---|
3/24 | 966,841 | 1,062,957 | 814,905 |
|---|
3/25 | 906,922 | 1,020,333 | 777,473 |
|---|
3/26 | 1,158,546 | 1,282,762 | 1,029,958 |
|---|
|
| AssetsNet |
$ 181,070,086
|
| Holdings Count | Holding |
277
|
| Advisory Fees Paid, Amount |
$ 917,849
|
| InvestmentCompanyPortfolioTurnover |
1.00%
|
| Additional Fund Statistics [Text Block] |
- Total Net Assets$181,070,086
- Number of Portfolio Holdings277
- Portfolio Turnover Rate1%
- Management Fees$917,849
|
| Holdings [Text Block] |
Portfolio Weighting (% of net assets)Table SummaryCommon Stocks | 97.8% |
|---|
U.S. Government Obligations | 2.1% |
|---|
Preferred Stocks | 0.1% |
|---|
Other Assets and Liabilities (Net)Footnote Reference* | (0.0)% |
|---|
| Footnote | Description | Footnote* | Amount represents greater than (0.05%) |
Industry Allocation (% of net assets) Table SummaryIndustry Weighting | . |
|---|
Financial Services | 15.1% | Diversified Industrial | 12.9% | Health Care | 4.9% | Equipment and Supplies | 4.8% | Aviation: Parts and Services | 4.2% | Building and Construction | 4.1% | Machinery | 3.7% | Electronics | 3.6% | Other Industry sectors | 46.7% | Other Assets and Liabilities (Net)Footnote Reference* | (0.0)% | | Footnote | Description | Footnote* | Amount represents greater than (0.05%) |
|
| Largest Holdings [Text Block] |
Top 10 Holdings (% of net assets)Table SummaryMyers Industries Inc. | 2.9% |
|---|
Astronics Corp. | 2.9% |
|---|
Gencor Industries Inc. | 2.1% |
|---|
Park-Ohio Holdings Corp. | 2.1% |
|---|
Burnham Holdings Inc. | 2.0% |
|---|
The Monarch Cement Co. | 1.8% |
|---|
Rush Enterprises Inc. | 1.7% |
|---|
Capital City Bank Group Inc. | 1.6% |
|---|
Nobility Homes Inc. | 1.6% |
|---|
L.B. Foster Co. | 1.5% |
|---|
|
| Material Fund Change [Text Block] |
|
| C000002927 |
|
| Shareholder Report [Line Items] |
|
| Fund Name |
Mighty Mites Fund
|
| Class Name |
Class A
|
| Trading Symbol |
WMMAX
|
| Annual or Semi-Annual Statement [Text Block] |
This semi-annual shareholder report contains important information about TETON Westwood Mighty Mites Fund - Class A (the "Fund") for the period of October 1, 2025 to March 31, 2026
|
| Shareholder Report Annual or Semi-Annual |
semi-annual shareholder report
|
| Additional Information [Text Block] |
You can find additional information about the Fund at https://www.tetonadv.com/teton-westwood-funds/tw-mighty-mites/. You can also request this information by contacting us at (800) 422-3544.
|
| Additional Information Phone Number |
(800) 422-3544
|
| Additional Information Website |
https://www.tetonadv.com/teton-westwood-funds/tw-mighty-mites/
|
| Expenses [Text Block] |
What were the Fund costs for the last six months? (based on a hypothetical $10,000 investment) Table SummaryClass Name | Costs of a $10k Investment | Costs Paid as a % of a $10k Investment |
|---|
Mighty Mites Fund - Class A
| $80 | 1.55% |
|---|
|
| Expenses Paid, Amount |
$ 80
|
| Expense Ratio, Percent |
1.55%
|
| Factors Affecting Performance [Text Block] |
How did the Fund perform?For the six month period ended March 31, 2026, the Teton Westwood Mighty Mites Fund outperformed its broad-based benchmark, the Russell 2000 Index, and its comparative, the Dow Jones U.S. Micro-Cap Total Stock Market Index. Performance was driven by strength across our industrial holdings, particularly within aerospace and defense. This was partially offset by the Fund’s underweight positions in energy and healthcare, primarily biotechnology. Contributors to performance included Astronics Corp, Ultra Clean Holdings, Inc., and Myers Industries, Inc. Detractors from the portfolio included Gibraltar Industries, Inc., Full House Resorts, Inc., and Eastern Company. |
| Performance Past Does Not Indicate Future [Text] |
Past performance does not guarantee future results.
|
| Line Graph [Table Text Block] |
Table Summary | TETON Westwood Mighty Mites Fund - Class A | TETON Westwood Mighty Mites Fund - Class A (includes sales charge) | Russell 2000 Index | Dow Jones U.S. Micro-Cap Total Stock Market Index |
|---|
3/16 | 10,000 | 10,000 | 10,000 | 10,000 |
|---|
3/17 | 12,374 | 11,879 | 12,622 | 12,732 |
|---|
3/18 | 13,636 | 12,567 | 14,110 | 14,435 |
|---|
3/19 | 13,170 | 11,652 | 14,399 | 14,409 |
|---|
3/20 | 9,740 | 8,272 | 10,945 | 10,649 |
|---|
3/21 | 17,533 | 14,296 | 21,326 | 23,341 |
|---|
3/22 | 17,367 | 13,594 | 20,091 | 18,556 |
|---|
3/23 | 16,498 | 12,398 | 17,759 | 14,442 |
|---|
3/24 | 18,748 | 13,524 | 21,259 | 16,298 |
|---|
3/25 | 17,541 | 12,148 | 20,407 | 15,549 |
|---|
3/26 | 22,336 | 14,849 | 25,655 | 20,599 |
|---|
|
| AssetsNet |
$ 181,070,086
|
| Holdings Count | Holding |
277
|
| Advisory Fees Paid, Amount |
$ 917,849
|
| InvestmentCompanyPortfolioTurnover |
1.00%
|
| Additional Fund Statistics [Text Block] |
- Total Net Assets$181,070,086
- Number of Portfolio Holdings277
- Portfolio Turnover Rate1%
- Management Fees$917,849
|
| Holdings [Text Block] |
Portfolio Weighting (% of net assets)Table SummaryCommon Stocks | 97.8% |
|---|
U.S. Government Obligations | 2.1% |
|---|
Preferred Stocks | 0.1% |
|---|
Other Assets and Liabilities (Net)Footnote Reference* | (0.0)% |
|---|
| Footnote | Description | Footnote* | Amount represents greater than (0.05%) |
Industry Allocation (% of net assets) Table SummaryIndustry Weighting | . |
|---|
Financial Services | 15.1% | Diversified Industrial | 12.9% | Health Care | 4.9% | Equipment and Supplies | 4.8% | Aviation: Parts and Services | 4.2% | Building and Construction | 4.1% | Machinery | 3.7% | Electronics | 3.6% | Other Industry sectors | 46.7% | Other Assets and Liabilities (Net)Footnote Reference* | (0.0)% | | Footnote | Description | Footnote* | Amount represents greater than (0.05%) |
|
| Largest Holdings [Text Block] |
Top 10 Holdings (% of net assets)Table SummaryMyers Industries Inc. | 2.9% |
|---|
Astronics Corp. | 2.9% |
|---|
Gencor Industries Inc. | 2.1% |
|---|
Park-Ohio Holdings Corp. | 2.1% |
|---|
Burnham Holdings Inc. | 2.0% |
|---|
The Monarch Cement Co. | 1.8% |
|---|
Rush Enterprises Inc. | 1.7% |
|---|
Capital City Bank Group Inc. | 1.6% |
|---|
Nobility Homes Inc. | 1.6% |
|---|
L.B. Foster Co. | 1.5% |
|---|
|
| Material Fund Change [Text Block] |
|