Shareholder Report
|
6 Months Ended |
|
Mar. 31, 2026
USD ($)
Holding
|
|---|
| Shareholder Report [Line Items] |
|
|
| Document Type |
N-CSRS
|
|
| Amendment Flag |
false
|
|
| Registrant Name |
Destra Investment Trust
|
|
| Entity Central Index Key |
0001492374
|
|
| Entity Investment Company Type |
N-1A
|
|
| Document Period End Date |
Mar. 31, 2026
|
|
| Shareholder Report Annual or Semi-Annual |
Semi-Annual Shareholder Report
|
|
| C000174035 |
|
|
| Shareholder Report [Line Items] |
|
|
| Fund Name |
Destra Flaherty & Crumrine Preferred and Income Fund
|
|
| Class Name |
Class A
|
|
| Trading Symbol |
DPIAX
|
|
| Additional Information Phone Number |
1-877-855-3434
|
|
| Expenses [Text Block] |
What were the Fund’s costs for the last six months?(based on a hypothetical $10,000 investment) Table SummaryClass Name | Costs of a $10,000 investment | Costs paid as a percentage of a $10,000 investment |
|---|
Class A | $72 | 1.45%Footnote Reference* |
|---|
| Footnote | Description | Footnote* | Annualized |
|
|
| Expenses Paid, Amount |
$ 72
|
|
| Expense Ratio, Percent |
1.45%
|
[1] |
| AssetsNet |
$ 221,705,622
|
|
| Holdings Count | Holding |
219
|
|
| Advisory Fees Paid, Amount |
$ 846,808
|
|
| InvestmentCompanyPortfolioTurnover |
8.00%
|
|
| Additional Fund Statistics [Text Block] |
- Net Assets$221,705,622
- Number of Portfolio Holdings219
- Advisory Fee $846,808
- Portfolio Turnover8%
|
|
| Holdings [Text Block] |
Asset Weighting (% of total investments)Table SummaryValue | Value |
|---|
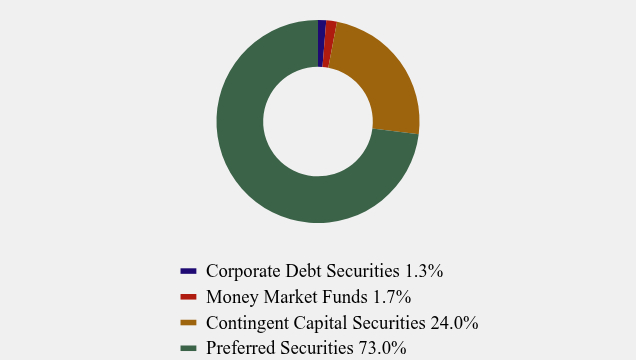
Corporate Debt Securities | 1.3% | Money Market Funds | 1.7% | Contingent Capital Securities | 24.0% | Preferred Securities | 73.0% | Sector Weighting (% of net assets)Table SummaryValue | Value |
|---|
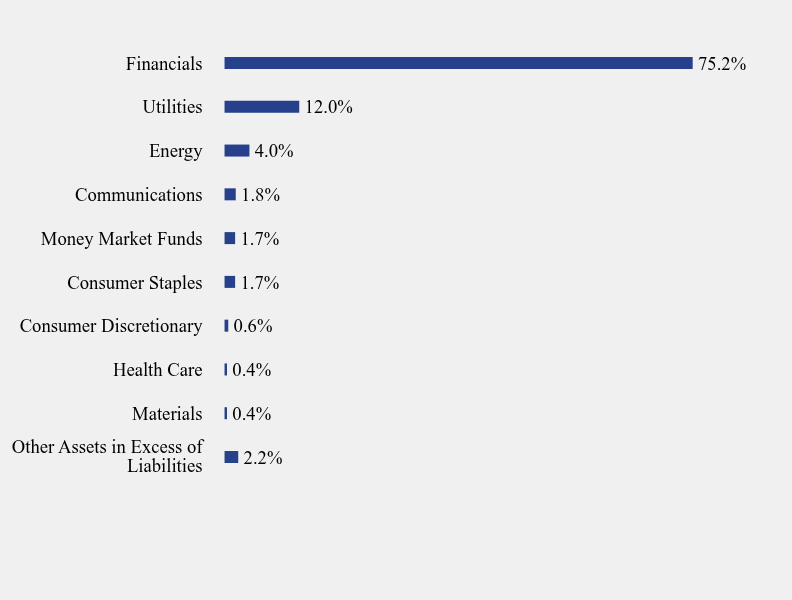
Other Assets in Excess of Liabilities | 2.2% | Materials | 0.4% | Health Care | 0.4% | Consumer Discretionary | 0.6% | Consumer Staples | 1.7% | Money Market Funds | 1.7% | Communications | 1.8% | Energy | 4.0% | Utilities | 12.0% | Financials | 75.2% | Top 10 Holdings (% of net assets)Table SummaryHolding Name | % of Net Assets |
|---|
Liberty Mutual Group, Inc., 7.800%, 03/15/27 | 3.5% |
|---|
Banco Santander S.A., 4.750%, 05/12/27 | 2.5% |
|---|
Provident Financing Trust I, 7.405%, 03/15/38 | 2.2% |
|---|
M&T Bank Corporation, 5.625%, 12/15/26 | 1.7% |
|---|
Flagstar Financial Inc., 6.375%, 03/17/27 | 1.6% |
|---|
Athene Holding Ltd., 6.350%, 06/30/29 | 1.6% |
|---|
Pinnacle Financial Partners, Inc., 8.397% | 1.5% |
|---|
Delphi Financial Group, Inc., 7.107%, 05/15/37 | 1.4% |
|---|
HSBC Holdings PLC, 8.000%, 09/07/28 | 1.4% |
|---|
Land O' Lakes, Inc., 8.000% | 1.4% |
|---|
|
|
| C000174036 |
|
|
| Shareholder Report [Line Items] |
|
|
| Fund Name |
Destra Flaherty & Crumrine Preferred and Income Fund
|
|
| Class Name |
Class C
|
|
| Trading Symbol |
DPICX
|
|
| Additional Information Phone Number |
1-877-855-3434
|
|
| Expenses [Text Block] |
What were the Fund’s costs for the last six months?(based on a hypothetical $10,000 investment) Table SummaryClass Name | Costs of a $10,000 investment | Costs paid as a percentage of a $10,000 investment |
|---|
Class C | $110 | 2.21%Footnote Reference* |
|---|
| Footnote | Description | Footnote* | Annualized |
|
|
| Expenses Paid, Amount |
$ 110
|
|
| Expense Ratio, Percent |
2.21%
|
[2] |
| AssetsNet |
$ 221,705,622
|
|
| Holdings Count | Holding |
219
|
|
| Advisory Fees Paid, Amount |
$ 846,808
|
|
| InvestmentCompanyPortfolioTurnover |
8.00%
|
|
| Additional Fund Statistics [Text Block] |
- Net Assets$221,705,622
- Number of Portfolio Holdings219
- Advisory Fee $846,808
- Portfolio Turnover8%
|
|
| Holdings [Text Block] |
Asset Weighting (% of total investments)Table SummaryValue | Value |
|---|
Corporate Debt Securities | 1.3% | Money Market Funds | 1.7% | Contingent Capital Securities | 24.0% | Preferred Securities | 73.0% | Sector Weighting (% of net assets)Table SummaryValue | Value |
|---|
Other Assets in Excess of Liabilities | 2.2% | Materials | 0.4% | Health Care | 0.4% | Consumer Discretionary | 0.6% | Consumer Staples | 1.7% | Money Market Funds | 1.7% | Communications | 1.8% | Energy | 4.0% | Utilities | 12.0% | Financials | 75.2% | Top 10 Holdings (% of net assets)Table SummaryHolding Name | % of Net Assets |
|---|
Liberty Mutual Group, Inc., 7.800%, 03/15/27 | 3.5% |
|---|
Banco Santander S.A., 4.750%, 05/12/27 | 2.5% |
|---|
Provident Financing Trust I, 7.405%, 03/15/38 | 2.2% |
|---|
M&T Bank Corporation, 5.625%, 12/15/26 | 1.7% |
|---|
Flagstar Financial Inc., 6.375%, 03/17/27 | 1.6% |
|---|
Athene Holding Ltd., 6.350%, 06/30/29 | 1.6% |
|---|
Pinnacle Financial Partners, Inc., 8.397% | 1.5% |
|---|
Delphi Financial Group, Inc., 7.107%, 05/15/37 | 1.4% |
|---|
HSBC Holdings PLC, 8.000%, 09/07/28 | 1.4% |
|---|
Land O' Lakes, Inc., 8.000% | 1.4% |
|---|
|
|
| C000174037 |
|
|
| Shareholder Report [Line Items] |
|
|
| Fund Name |
Destra Flaherty & Crumrine Preferred and Income Fund
|
|
| Class Name |
Class I
|
|
| Trading Symbol |
DPIIX
|
|
| Additional Information Phone Number |
1-877-855-3434
|
|
| Expenses [Text Block] |
What were the Fund’s costs for the last six months?(based on a hypothetical $10,000 investment) Table SummaryClass Name | Costs of a $10,000 investment | Costs paid as a percentage of a $10,000 investment |
|---|
Class I | $60 | 1.20%Footnote Reference* |
|---|
| Footnote | Description | Footnote* | Annualized |
|
|
| Expenses Paid, Amount |
$ 60
|
|
| Expense Ratio, Percent |
1.20%
|
[3] |
| AssetsNet |
$ 221,705,622
|
|
| Holdings Count | Holding |
219
|
|
| Advisory Fees Paid, Amount |
$ 846,808
|
|
| InvestmentCompanyPortfolioTurnover |
8.00%
|
|
| Additional Fund Statistics [Text Block] |
- Net Assets$221,705,622
- Number of Portfolio Holdings219
- Advisory Fee $846,808
- Portfolio Turnover8%
|
|
| Holdings [Text Block] |
Asset Weighting (% of total investments)Table SummaryValue | Value |
|---|
Corporate Debt Securities | 1.3% | Money Market Funds | 1.7% | Contingent Capital Securities | 24.0% | Preferred Securities | 73.0% | Sector Weighting (% of net assets)Table SummaryValue | Value |
|---|
Other Assets in Excess of Liabilities | 2.2% | Materials | 0.4% | Health Care | 0.4% | Consumer Discretionary | 0.6% | Consumer Staples | 1.7% | Money Market Funds | 1.7% | Communications | 1.8% | Energy | 4.0% | Utilities | 12.0% | Financials | 75.2% | Top 10 Holdings (% of net assets)Table SummaryHolding Name | % of Net Assets |
|---|
Liberty Mutual Group, Inc., 7.800%, 03/15/27 | 3.5% |
|---|
Banco Santander S.A., 4.750%, 05/12/27 | 2.5% |
|---|
Provident Financing Trust I, 7.405%, 03/15/38 | 2.2% |
|---|
M&T Bank Corporation, 5.625%, 12/15/26 | 1.7% |
|---|
Flagstar Financial Inc., 6.375%, 03/17/27 | 1.6% |
|---|
Athene Holding Ltd., 6.350%, 06/30/29 | 1.6% |
|---|
Pinnacle Financial Partners, Inc., 8.397% | 1.5% |
|---|
Delphi Financial Group, Inc., 7.107%, 05/15/37 | 1.4% |
|---|
HSBC Holdings PLC, 8.000%, 09/07/28 | 1.4% |
|---|
Land O' Lakes, Inc., 8.000% | 1.4% |
|---|
|
|
|
|