Shareholder Report
|
6 Months Ended |
|
Mar. 31, 2026
USD ($)
Holding
|
|---|
| Shareholder Report [Line Items] |
|
|
| Document Type |
N-CSRS
|
|
| Amendment Flag |
false
|
|
| Registrant Name |
New Age Alpha Funds Trust
|
|
| Entity Central Index Key |
0002013853
|
|
| Entity Investment Company Type |
N-1A
|
|
| Document Period End Date |
Mar. 31, 2026
|
|
| Shareholder Report Annual or Semi-Annual |
Semi-Annual Shareholder Report
|
|
| C000253472 |
|
|
| Shareholder Report [Line Items] |
|
|
| Fund Name |
NAA Allocation Fund
|
|
| Trading Symbol |
TVRAX
|
|
| Annual or Semi-Annual Statement [Text Block] |
This semi-annual shareholder report contains important information about NAA Allocation Fund for the period of October 1, 2025 to March 31, 2026.
|
|
| Additional Information [Text Block] |
You can find additional information about the Fund at www.naafunds.com. You can also request this information by contacting us at 833-840-3937.
|
|
| Additional Information Phone Number |
833-840-3937
|
|
| Additional Information Website |
www.naafunds.com
|
|
| Expenses [Text Block] |
What were the Fund’s costs for the last six months?(based on a hypothetical $10,000 investment) Table SummaryClass Name | Costs of a $10,000 investment | Costs paid as a percentage of a $10,000 investment |
|---|
Class A | $71 | 1.45%Footnote Reference* |
|---|
| Footnote | Description | Footnote* | Annualized |
|
|
| Expenses Paid, Amount |
$ 71
|
|
| Expense Ratio, Percent |
1.45%
|
[1] |
| AssetsNet |
$ 176,360,273
|
|
| Holdings Count | Holding |
176
|
|
| Advisory Fees Paid, Amount |
$ 835,093
|
|
| InvestmentCompanyPortfolioTurnover |
30.00%
|
|
| Additional Fund Statistics [Text Block] |
- Net Assets$176,360,273
- Number of Portfolio Holdings176
- Advisory Fee $835,093
- Portfolio Turnover30%
|
|
| Holdings [Text Block] |
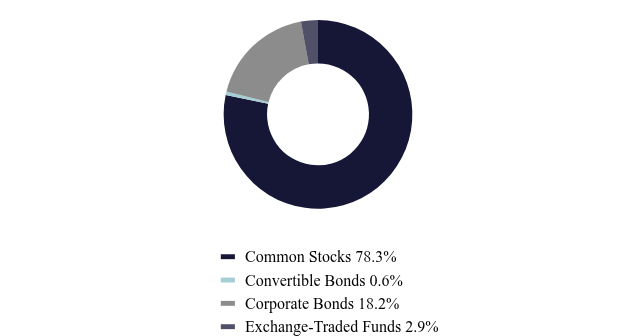
Asset Weighting (% of total investments)Table SummaryValue | Value |
|---|
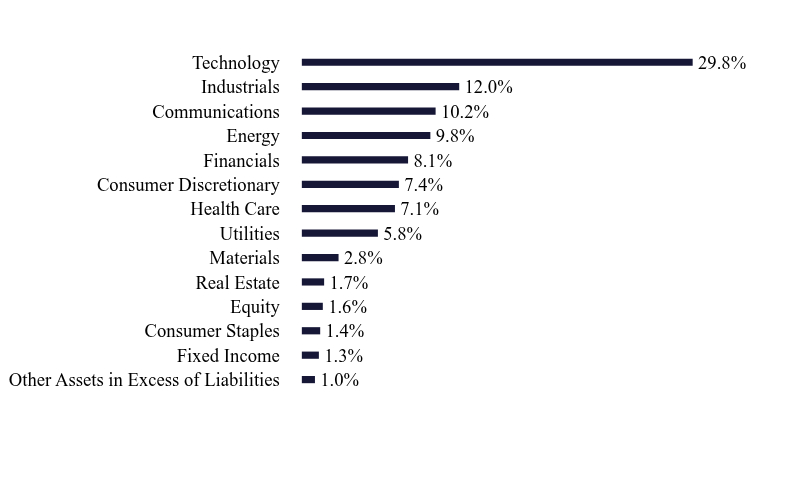
Common Stocks | 78.3% | Convertible Bonds | 0.6% | Corporate Bonds | 18.2% | Exchange-Traded Funds | 2.9% | Sector Weighting (% of net assets)Table SummaryValue | Value |
|---|
Other Assets in Excess of Liabilities | 1.0% | Fixed Income | 1.3% | Consumer Staples | 1.4% | Equity | 1.6% | Real Estate | 1.7% | Materials | 2.8% | Utilities | 5.8% | Health Care | 7.1% | Consumer Discretionary | 7.4% | Financials | 8.1% | Energy | 9.8% | Communications | 10.2% | Industrials | 12.0% | Technology | 29.8% | Industry comparisons within this Tailored Shareholder Report (TSR) are based on the Bloomberg Industry Classification Standard (BICS), which provides a hierarchical system for classifying companies by their primary source of revenue. |
|
| Largest Holdings [Text Block] |
Top 10 Holdings (% of net assets)Table SummaryHolding Name | % of Net Assets |
|---|
NVIDIA Corporation | 5.7% |
|---|
Apple, Inc. | 5.3% |
|---|
Microsoft Corporation | 3.8% |
|---|
Alphabet, Inc. - Class C | 2.2% |
|---|
Amazon.com, Inc. | 2.0% |
|---|
Broadcom, Inc. | 2.0% |
|---|
Exxon Mobil Corporation | 1.8% |
|---|
Tesla, Inc. | 1.5% |
|---|
Chevron Corporation | 1.4% |
|---|
Micron Technology, Inc. | 1.3% |
|---|
|
|
| Material Fund Change [Text Block] |
No material changes occurred during the period ended March 31, 2026. |
|
| C000253469 |
|
|
| Shareholder Report [Line Items] |
|
|
| Fund Name |
NAA Allocation Fund
|
|
| Trading Symbol |
TVRCX
|
|
| Annual or Semi-Annual Statement [Text Block] |
This semi-annual shareholder report contains important information about NAA Allocation Fund for the period of October 1, 2025 to March 31, 2026.
|
|
| Additional Information [Text Block] |
You can find additional information about the Fund at www.naafunds.com. You can also request this information by contacting us at 833-840-3937.
|
|
| Additional Information Phone Number |
833-840-3937
|
|
| Additional Information Website |
www.naafunds.com
|
|
| Expenses [Text Block] |
What were the Fund’s costs for the last six months?(based on a hypothetical $10,000 investment) Table SummaryClass Name | Costs of a $10,000 investment | Costs paid as a percentage of a $10,000 investment |
|---|
Class C | $101 | 2.05%Footnote Reference* |
|---|
| Footnote | Description | Footnote* | Annualized |
|
|
| Expenses Paid, Amount |
$ 101
|
|
| Expense Ratio, Percent |
2.05%
|
[2] |
| AssetsNet |
$ 176,360,273
|
|
| Holdings Count | Holding |
176
|
|
| Advisory Fees Paid, Amount |
$ 835,093
|
|
| InvestmentCompanyPortfolioTurnover |
30.00%
|
|
| Additional Fund Statistics [Text Block] |
- Net Assets$176,360,273
- Number of Portfolio Holdings176
- Advisory Fee $835,093
- Portfolio Turnover30%
|
|
| Holdings [Text Block] |
Asset Weighting (% of total investments)Table SummaryValue | Value |
|---|
Common Stocks | 78.3% | Convertible Bonds | 0.6% | Corporate Bonds | 18.2% | Exchange-Traded Funds | 2.9% | Sector Weighting (% of net assets)Table SummaryValue | Value |
|---|
Other Assets in Excess of Liabilities | 1.0% | Fixed Income | 1.3% | Consumer Staples | 1.4% | Equity | 1.6% | Real Estate | 1.7% | Materials | 2.8% | Utilities | 5.8% | Health Care | 7.1% | Consumer Discretionary | 7.4% | Financials | 8.1% | Energy | 9.8% | Communications | 10.2% | Industrials | 12.0% | Technology | 29.8% | Industry comparisons within this Tailored Shareholder Report (TSR) are based on the Bloomberg Industry Classification Standard (BICS), which provides a hierarchical system for classifying companies by their primary source of revenue. |
|
| Largest Holdings [Text Block] |
Top 10 Holdings (% of net assets)Table SummaryHolding Name | % of Net Assets |
|---|
NVIDIA Corporation | 5.7% |
|---|
Apple, Inc. | 5.3% |
|---|
Microsoft Corporation | 3.8% |
|---|
Alphabet, Inc. - Class C | 2.2% |
|---|
Amazon.com, Inc. | 2.0% |
|---|
Broadcom, Inc. | 2.0% |
|---|
Exxon Mobil Corporation | 1.8% |
|---|
Tesla, Inc. | 1.5% |
|---|
Chevron Corporation | 1.4% |
|---|
Micron Technology, Inc. | 1.3% |
|---|
|
|
| Material Fund Change [Text Block] |
No material changes occurred during the period ended March 31, 2026. |
|
| C000253471 |
|
|
| Shareholder Report [Line Items] |
|
|
| Fund Name |
NAA Allocation Fund
|
|
| Trading Symbol |
TVRIX
|
|
| Annual or Semi-Annual Statement [Text Block] |
This semi-annual shareholder report contains important information about NAA Allocation Fund for the period of October 1, 2025 to March 31, 2026.
|
|
| Additional Information [Text Block] |
You can find additional information about the Fund at www.naafunds.com. You can also request this information by contacting us at 833-840-3937.
|
|
| Additional Information Phone Number |
833-840-3937
|
|
| Additional Information Website |
www.naafunds.com
|
|
| Expenses [Text Block] |
What were the Fund’s costs for the last six months?(based on a hypothetical $10,000 investment) Table SummaryClass Name | Costs of a $10,000 investment | Costs paid as a percentage of a $10,000 investment |
|---|
Institutional | $52 | 1.05%Footnote Reference* |
|---|
| Footnote | Description | Footnote* | Annualized |
|
|
| Expenses Paid, Amount |
$ 52
|
|
| Expense Ratio, Percent |
1.05%
|
[3] |
| AssetsNet |
$ 176,360,273
|
|
| Holdings Count | Holding |
176
|
|
| Advisory Fees Paid, Amount |
$ 835,093
|
|
| InvestmentCompanyPortfolioTurnover |
30.00%
|
|
| Additional Fund Statistics [Text Block] |
- Net Assets$176,360,273
- Number of Portfolio Holdings176
- Advisory Fee $835,093
- Portfolio Turnover30%
|
|
| Holdings [Text Block] |
Asset Weighting (% of total investments)Table SummaryValue | Value |
|---|
Common Stocks | 78.3% | Convertible Bonds | 0.6% | Corporate Bonds | 18.2% | Exchange-Traded Funds | 2.9% | Sector Weighting (% of net assets)Table SummaryValue | Value |
|---|
Other Assets in Excess of Liabilities | 1.0% | Fixed Income | 1.3% | Consumer Staples | 1.4% | Equity | 1.6% | Real Estate | 1.7% | Materials | 2.8% | Utilities | 5.8% | Health Care | 7.1% | Consumer Discretionary | 7.4% | Financials | 8.1% | Energy | 9.8% | Communications | 10.2% | Industrials | 12.0% | Technology | 29.8% | Industry comparisons within this Tailored Shareholder Report (TSR) are based on the Bloomberg Industry Classification Standard (BICS), which provides a hierarchical system for classifying companies by their primary source of revenue. |
|
| Largest Holdings [Text Block] |
Top 10 Holdings (% of net assets)Table SummaryHolding Name | % of Net Assets |
|---|
NVIDIA Corporation | 5.7% |
|---|
Apple, Inc. | 5.3% |
|---|
Microsoft Corporation | 3.8% |
|---|
Alphabet, Inc. - Class C | 2.2% |
|---|
Amazon.com, Inc. | 2.0% |
|---|
Broadcom, Inc. | 2.0% |
|---|
Exxon Mobil Corporation | 1.8% |
|---|
Tesla, Inc. | 1.5% |
|---|
Chevron Corporation | 1.4% |
|---|
Micron Technology, Inc. | 1.3% |
|---|
|
|
| Material Fund Change [Text Block] |
No material changes occurred during the period ended March 31, 2026. |
|
| C000253470 |
|
|
| Shareholder Report [Line Items] |
|
|
| Fund Name |
NAA Allocation Fund
|
|
| Trading Symbol |
TVFRX
|
|
| Annual or Semi-Annual Statement [Text Block] |
This semi-annual shareholder report contains important information about NAA Allocation Fund for the period of October 1, 2025 to March 31, 2026.
|
|
| Additional Information [Text Block] |
You can find additional information about the Fund at www.naafunds.com. You can also request this information by contacting us at 833-840-3937.
|
|
| Additional Information Phone Number |
833-840-3937
|
|
| Additional Information Website |
www.naafunds.com
|
|
| Expenses [Text Block] |
What were the Fund’s costs for the last six months?(based on a hypothetical $10,000 investment) Table SummaryClass Name | Costs of a $10,000 investment | Costs paid as a percentage of a $10,000 investment |
|---|
Class P | $64 | 1.30%Footnote Reference* |
|---|
| Footnote | Description | Footnote* | Annualized |
|
|
| Expenses Paid, Amount |
$ 64
|
|
| Expense Ratio, Percent |
1.30%
|
[4] |
| AssetsNet |
$ 176,360,273
|
|
| Holdings Count | Holding |
176
|
|
| Advisory Fees Paid, Amount |
$ 835,093
|
|
| InvestmentCompanyPortfolioTurnover |
30.00%
|
|
| Additional Fund Statistics [Text Block] |
- Net Assets$176,360,273
- Number of Portfolio Holdings176
- Advisory Fee $835,093
- Portfolio Turnover30%
|
|
| Holdings [Text Block] |
Asset Weighting (% of total investments)Table SummaryValue | Value |
|---|
Common Stocks | 78.3% | Convertible Bonds | 0.6% | Corporate Bonds | 18.2% | Exchange-Traded Funds | 2.9% | Sector Weighting (% of net assets)Table SummaryValue | Value |
|---|
Other Assets in Excess of Liabilities | 1.0% | Fixed Income | 1.3% | Consumer Staples | 1.4% | Equity | 1.6% | Real Estate | 1.7% | Materials | 2.8% | Utilities | 5.8% | Health Care | 7.1% | Consumer Discretionary | 7.4% | Financials | 8.1% | Energy | 9.8% | Communications | 10.2% | Industrials | 12.0% | Technology | 29.8% | Industry comparisons within this Tailored Shareholder Report (TSR) are based on the Bloomberg Industry Classification Standard (BICS), which provides a hierarchical system for classifying companies by their primary source of revenue. |
|
| Largest Holdings [Text Block] |
Top 10 Holdings (% of net assets)Table SummaryHolding Name | % of Net Assets |
|---|
NVIDIA Corporation | 5.7% |
|---|
Apple, Inc. | 5.3% |
|---|
Microsoft Corporation | 3.8% |
|---|
Alphabet, Inc. - Class C | 2.2% |
|---|
Amazon.com, Inc. | 2.0% |
|---|
Broadcom, Inc. | 2.0% |
|---|
Exxon Mobil Corporation | 1.8% |
|---|
Tesla, Inc. | 1.5% |
|---|
Chevron Corporation | 1.4% |
|---|
Micron Technology, Inc. | 1.3% |
|---|
|
|
| Material Fund Change [Text Block] |
No material changes occurred during the period ended March 31, 2026. |
|
| C000253473 |
|
|
| Shareholder Report [Line Items] |
|
|
| Fund Name |
NAA Large Cap Value Fund
|
|
| Trading Symbol |
SECIX
|
|
| Annual or Semi-Annual Statement [Text Block] |
This semi-annual shareholder report contains important information about NAA Large Cap Value Fund for the period of October 1, 2025 to March 31, 2026.
|
|
| Additional Information [Text Block] |
You can find additional information about the Fund at www.naafunds.com. You can also request this information by contacting us at 833-840-3937.
|
|
| Additional Information Phone Number |
833-840-3937
|
|
| Additional Information Website |
www.naafunds.com
|
|
| Expenses [Text Block] |
What were the Fund’s costs for the last six months?(based on a hypothetical $10,000 investment) Table SummaryClass Name | Costs of a $10,000 investment | Costs paid as a percentage of a $10,000 investment |
|---|
Class A | $55 | 1.10%Footnote Reference* |
|---|
| Footnote | Description | Footnote* | Annualized |
|
|
| Expenses Paid, Amount |
$ 55
|
|
| Expense Ratio, Percent |
1.10%
|
[5] |
| AssetsNet |
$ 66,581,545
|
|
| Holdings Count | Holding |
102
|
|
| Advisory Fees Paid, Amount |
$ 175,891
|
|
| InvestmentCompanyPortfolioTurnover |
34.00%
|
|
| Additional Fund Statistics [Text Block] |
- Net Assets$66,581,545
- Number of Portfolio Holdings102
- Advisory Fee $175,891
- Portfolio Turnover34%
|
|
| Holdings [Text Block] |
Asset Weighting (% of total investments)Table SummaryValue | Value |
|---|
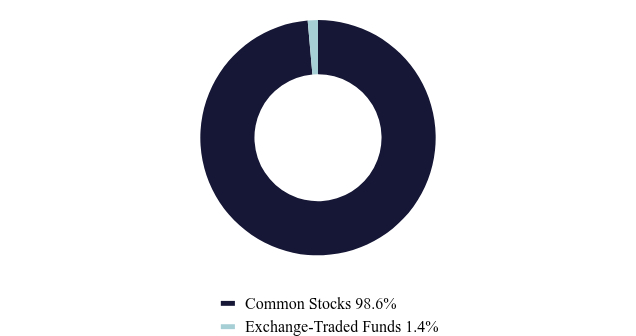
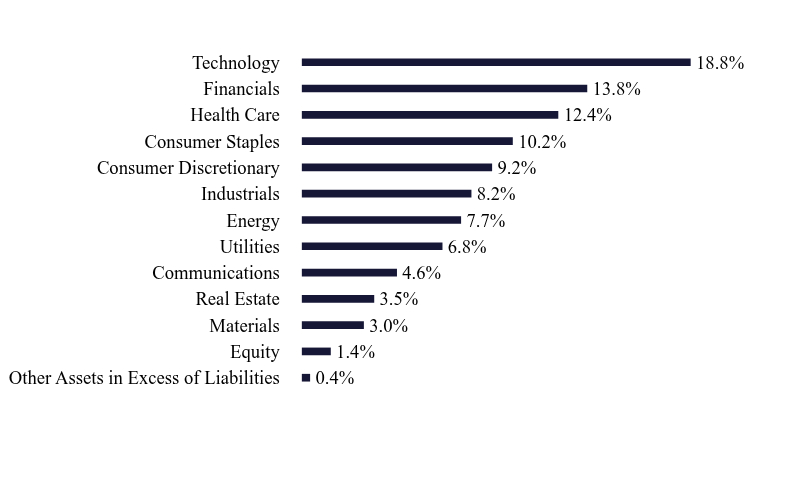
Common Stocks | 98.6% | Exchange-Traded Funds | 1.4% | Sector Weighting (% of net assets)Table SummaryValue | Value |
|---|
Other Assets in Excess of Liabilities | 0.4% | Equity | 1.4% | Materials | 3.0% | Real Estate | 3.5% | Communications | 4.6% | Utilities | 6.8% | Energy | 7.7% | Industrials | 8.2% | Consumer Discretionary | 9.2% | Consumer Staples | 10.2% | Health Care | 12.4% | Financials | 13.8% | Technology | 18.8% | Industry comparisons within this Tailored Shareholder Report (TSR) are based on the Bloomberg Industry Classification Standard (BICS), which provides a hierarchical system for classifying companies by their primary source of revenue. |
|
| Largest Holdings [Text Block] |
Top 10 Holdings (% of net assets)Table SummaryHolding Name | % of Net Assets |
|---|
Apple, Inc. | 6.9% |
|---|
Amazon.com, Inc. | 3.5% |
|---|
Exxon Mobil Corporation | 2.6% |
|---|
Walmart, Inc. | 2.0% |
|---|
Costco Wholesale Corporation | 1.6% |
|---|
Tesla, Inc. | 1.5% |
|---|
Chevron Corporation | 1.3% |
|---|
ConocoPhillips | 1.3% |
|---|
Procter & Gamble Company (The) | 1.2% |
|---|
Bank of America Corporation | 1.2% |
|---|
|
|
| Material Fund Change [Text Block] |
No material changes occurred during the period ended March 31, 2026. |
|
| C000253474 |
|
|
| Shareholder Report [Line Items] |
|
|
| Fund Name |
NAA Large Cap Value Fund
|
|
| Trading Symbol |
SEGIX
|
|
| Annual or Semi-Annual Statement [Text Block] |
This semi-annual shareholder report contains important information about NAA Large Cap Value Fund for the period of October 1, 2025 to March 31, 2026.
|
|
| Additional Information [Text Block] |
You can find additional information about the Fund at www.naafunds.com. You can also request this information by contacting us at 833-840-3937.
|
|
| Additional Information Phone Number |
833-840-3937
|
|
| Additional Information Website |
www.naafunds.com
|
|
| Expenses [Text Block] |
What were the
Fund’s costs for the last six months?(based on a hypothetical $10,000 investment) Table SummaryClass Name | Costs of a $10,000 investment | Costs paid as a percentage of a $10,000 investment |
|---|
Class C | $93 | 1.85%Footnote Reference* |
|---|
| Footnote | Description | Footnote* | Annualized |
|
|
| Expenses Paid, Amount |
$ 93
|
|
| Expense Ratio, Percent |
1.85%
|
[6] |
| AssetsNet |
$ 66,581,545
|
|
| Holdings Count | Holding |
102
|
|
| Advisory Fees Paid, Amount |
$ 175,891
|
|
| InvestmentCompanyPortfolioTurnover |
34.00%
|
|
| Additional Fund Statistics [Text Block] |
- Net Assets$66,581,545
- Number of Portfolio Holdings102
- Advisory Fee $175,891
- Portfolio Turnover34%
|
|
| Holdings [Text Block] |
Asset Weighting (% of total investments)Table SummaryValue | Value |
|---|
Common Stocks | 98.6% | Exchange-Traded Funds | 1.4% | Sector Weighting (% of net assets)Table SummaryValue | Value |
|---|
Other Assets in Excess of Liabilities | 0.4% | Equity | 1.4% | Materials | 3.0% | Real Estate | 3.5% | Communications | 4.6% | Utilities | 6.8% | Energy | 7.7% | Industrials | 8.2% | Consumer Discretionary | 9.2% | Consumer Staples | 10.2% | Health Care | 12.4% | Financials | 13.8% | Technology | 18.8% | Industry comparisons within this Tailored Shareholder Report (TSR) are based on the Bloomberg Industry Classification Standard (BICS), which provides a hierarchical system for classifying companies by their primary source of revenue. |
|
| Largest Holdings [Text Block] |
Top 10 Holdings (% of net assets)Table SummaryHolding Name | % of Net Assets |
|---|
Apple, Inc. | 6.9% |
|---|
Amazon.com, Inc. | 3.5% |
|---|
Exxon Mobil Corporation | 2.6% |
|---|
Walmart, Inc. | 2.0% |
|---|
Costco Wholesale Corporation | 1.6% |
|---|
Tesla, Inc. | 1.5% |
|---|
Chevron Corporation | 1.3% |
|---|
ConocoPhillips | 1.3% |
|---|
Procter & Gamble Company (The) | 1.2% |
|---|
Bank of America Corporation | 1.2% |
|---|
|
|
| Material Fund Change [Text Block] |
No material changes occurred during the period ended March 31, 2026. |
|
| C000253476 |
|
|
| Shareholder Report [Line Items] |
|
|
| Fund Name |
NAA Large Cap Value Fund
|
|
| Trading Symbol |
GILCX
|
|
| Annual or Semi-Annual Statement [Text Block] |
This semi-annual shareholder report contains important information about NAA Large Cap Value Fund for the period of October 1, 2025 to March 31, 2026.
|
|
| Additional Information [Text Block] |
You can find additional information about the Fund at www.naafunds.com. You can also request this information by contacting us at 833-840-3937.
|
|
| Additional Information Phone Number |
833-840-3937
|
|
| Additional Information Website |
www.naafunds.com
|
|
| Expenses [Text Block] |
What were the Fund’s costs for the last six months?(based on a hypothetical $10,000 investment) Table SummaryClass Name | Costs of a $10,000 investment | Costs paid as a percentage of a $10,000 investment |
|---|
Institutional | $43 | 0.85%Footnote Reference* |
|---|
| Footnote | Description | Footnote* | Annualized |
|
|
| Expenses Paid, Amount |
$ 43
|
|
| Expense Ratio, Percent |
0.85%
|
[7] |
| AssetsNet |
$ 66,581,545
|
|
| Holdings Count | Holding |
102
|
|
| Advisory Fees Paid, Amount |
$ 175,891
|
|
| InvestmentCompanyPortfolioTurnover |
34.00%
|
|
| Additional Fund Statistics [Text Block] |
- Net Assets$66,581,545
- Number of Portfolio Holdings102
- Advisory Fee $175,891
- Portfolio Turnover34%
|
|
| Holdings [Text Block] |
Asset Weighting (% of total investments)Table SummaryValue | Value |
|---|
Common Stocks | 98.6% | Exchange-Traded Funds | 1.4% | Sector Weighting (% of net assets)Table SummaryValue | Value |
|---|
Other Assets in Excess of Liabilities | 0.4% | Equity | 1.4% | Materials | 3.0% | Real Estate | 3.5% | Communications | 4.6% | Utilities | 6.8% | Energy | 7.7% | Industrials | 8.2% | Consumer Discretionary | 9.2% | Consumer Staples | 10.2% | Health Care | 12.4% | Financials | 13.8% | Technology | 18.8% | Industry comparisons within this Tailored Shareholder Report (TSR) are based on the Bloomberg Industry Classification Standard (BICS), which provides a hierarchical system for classifying companies by their primary source of revenue. |
|
| Largest Holdings [Text Block] |
Top 10 Holdings (% of net assets)Table SummaryHolding Name | % of Net Assets |
|---|
Apple, Inc. | 6.9% |
|---|
Amazon.com, Inc. | 3.5% |
|---|
Exxon Mobil Corporation | 2.6% |
|---|
Walmart, Inc. | 2.0% |
|---|
Costco Wholesale Corporation | 1.6% |
|---|
Tesla, Inc. | 1.5% |
|---|
Chevron Corporation | 1.3% |
|---|
ConocoPhillips | 1.3% |
|---|
Procter & Gamble Company (The) | 1.2% |
|---|
Bank of America Corporation | 1.2% |
|---|
|
|
| Material Fund Change [Text Block] |
No material changes occurred during the period ended March 31, 2026. |
|
| C000249826 |
|
|
| Shareholder Report [Line Items] |
|
|
| Fund Name |
NAA Large Core Fund
|
|
| Trading Symbol |
SECEX
|
|
| Annual or Semi-Annual Statement [Text Block] |
This semi-annual shareholder report contains important information about NAA Large Core Fund for the period of October 1, 2025 to March 31, 2026.
|
|
| Additional Information [Text Block] |
You can find additional information about the Fund at www.naafunds.com. You can also request this information by contacting us at 833-840-3937.
|
|
| Additional Information Phone Number |
833-840-3937
|
|
| Additional Information Website |
www.naafunds.com
|
|
| Expenses [Text Block] |
What were the Fund’s costs for the last six months?(based on a hypothetical $10,000 investment) Table SummaryClass Name | Costs of a $10,000 investment | Costs paid as a percentage of a $10,000 investment |
|---|
Class A | $61 | 1.25%Footnote Reference* |
|---|
| Footnote | Description | Footnote* | Annualized |
|
|
| Expenses Paid, Amount |
$ 61
|
|
| Expense Ratio, Percent |
1.25%
|
[8] |
| AssetsNet |
$ 235,448,251
|
|
| Holdings Count | Holding |
140
|
|
| Advisory Fees Paid, Amount |
$ 954,313
|
|
| InvestmentCompanyPortfolioTurnover |
32.00%
|
|
| Additional Fund Statistics [Text Block] |
- Net Assets$235,448,251
- Number of Portfolio Holdings140
- Advisory Fee $954,313
- Portfolio Turnover32%
|
|
| Holdings [Text Block] |
Asset Weighting (% of total investments)Table SummaryValue | Value |
|---|
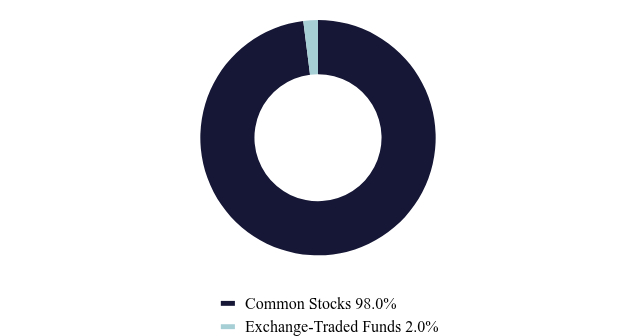
Common Stocks | 98.0% | Exchange-Traded Funds | 2.0% | Sector Weighting (% of net assets)Table SummaryValue | Value |
|---|
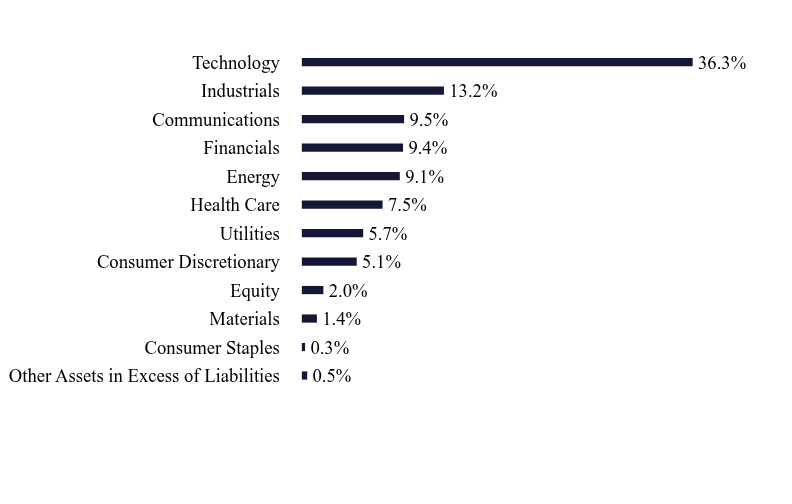
Other Assets in Excess of Liabilities | 0.5% | Consumer Staples | 0.3% | Materials | 1.4% | Equity | 2.0% | Consumer Discretionary | 5.1% | Utilities | 5.7% | Health Care | 7.5% | Energy | 9.1% | Financials | 9.4% | Communications | 9.5% | Industrials | 13.2% | Technology | 36.3% | Industry comparisons within this Tailored Shareholder Report (TSR) are based on the Bloomberg Industry Classification Standard (BICS), which provides a hierarchical system for classifying companies by their primary source of revenue. |
|
| Largest Holdings [Text Block] |
Top 10 Holdings (% of net assets)Table SummaryHolding Name | % of Net Assets |
|---|
NVIDIA Corporation | 7.2% |
|---|
Apple, Inc. | 6.7% |
|---|
Microsoft Corporation | 4.8% |
|---|
Alphabet, Inc. - Class A | 4.3% |
|---|
Amazon.com, Inc. | 2.5% |
|---|
Broadcom, Inc. | 2.5% |
|---|
Exxon Mobil Corporation | 2.3% |
|---|
Tesla, Inc. | 1.9% |
|---|
Chevron Corporation | 1.7% |
|---|
Micron Technology, Inc. | 1.6% |
|---|
|
|
| Material Fund Change [Text Block] |
No material changes occurred during the period ended March 31, 2026. |
|
| C000249827 |
|
|
| Shareholder Report [Line Items] |
|
|
| Fund Name |
NAA Large Core Fund
|
|
| Trading Symbol |
SFECX
|
|
| Annual or Semi-Annual Statement [Text Block] |
This semi-annual shareholder report contains important information about NAA Large Core Fund for the period of October 1, 2025 to March 31, 2026.
|
|
| Additional Information [Text Block] |
You can find additional information about the Fund at www.naafunds.com. You can also request this information by contacting us at 833-840-3937.
|
|
| Additional Information Phone Number |
833-840-3937
|
|
| Additional Information Website |
www.naafunds.com
|
|
| Expenses [Text Block] |
What were the Fund’s costs for the last six months?(based on a hypothetical $10,000 investment) Table SummaryClass Name | Costs of a $10,000 investment | Costs paid as a percentage of a $10,000 investment |
|---|
Class C | $98 | 2.00%Footnote Reference* |
|---|
| Footnote | Description | Footnote* | Annualized |
|
|
| Expenses Paid, Amount |
$ 98
|
|
| Expense Ratio, Percent |
2.00%
|
[9] |
| AssetsNet |
$ 235,448,251
|
|
| Holdings Count | Holding |
140
|
|
| Advisory Fees Paid, Amount |
$ 954,313
|
|
| InvestmentCompanyPortfolioTurnover |
32.00%
|
|
| Additional Fund Statistics [Text Block] |
- Net Assets$235,448,251
- Number of Portfolio Holdings140
- Advisory Fee $954,313
- Portfolio Turnover32%
|
|
| Holdings [Text Block] |
Asset Weighting (% of total investments)Table SummaryValue | Value |
|---|
Common Stocks | 98.0% | Exchange-Traded Funds | 2.0% | Sector Weighting (% of net assets)Table SummaryValue | Value |
|---|
Other Assets in Excess of Liabilities | 0.5% | Consumer Staples | 0.3% | Materials | 1.4% | Equity | 2.0% | Consumer Discretionary | 5.1% | Utilities | 5.7% | Health Care | 7.5% | Energy | 9.1% | Financials | 9.4% | Communications | 9.5% | Industrials | 13.2% | Technology | 36.3% | Industry comparisons within this Tailored Shareholder Report (TSR) are based on the Bloomberg Industry Classification Standard (BICS), which provides a hierarchical system for classifying companies by their primary source of revenue. |
|
| Largest Holdings [Text Block] |
Top 10 Holdings (% of net assets)Table SummaryHolding Name | % of Net Assets |
|---|
NVIDIA Corporation | 7.2% |
|---|
Apple, Inc. | 6.7% |
|---|
Microsoft Corporation | 4.8% |
|---|
Alphabet, Inc. - Class A | 4.3% |
|---|
Amazon.com, Inc. | 2.5% |
|---|
Broadcom, Inc. | 2.5% |
|---|
Exxon Mobil Corporation | 2.3% |
|---|
Tesla, Inc. | 1.9% |
|---|
Chevron Corporation | 1.7% |
|---|
Micron Technology, Inc. | 1.6% |
|---|
|
|
| Material Fund Change [Text Block] |
No material changes occurred during the period ended March 31, 2026. |
|
| C000249825 |
|
|
| Shareholder Report [Line Items] |
|
|
| Fund Name |
NAA Large Core Fund
|
|
| Trading Symbol |
GILIX
|
|
| Annual or Semi-Annual Statement [Text Block] |
This semi-annual shareholder report contains important information about NAA Large Core Fund for the period of October 1, 2025 to March 31, 2026.
|
|
| Additional Information [Text Block] |
You can find additional information about the Fund at www.naafunds.com. You can also request this information by contacting us at 833-840-3937.
|
|
| Additional Information Phone Number |
833-840-3937
|
|
| Additional Information Website |
www.naafunds.com
|
|
| Expenses [Text Block] |
What were the Fund’s costs for the last six months?(based on a hypothetical $10,000 investment) Table SummaryClass Name | Costs of a $10,000 investment | Costs paid as a percentage of a $10,000 investment |
|---|
Institutional | $49 | 1.00%Footnote Reference* |
|---|
| Footnote | Description | Footnote* | Annualized |
|
|
| Expenses Paid, Amount |
$ 49
|
|
| Expense Ratio, Percent |
1.00%
|
[10] |
| AssetsNet |
$ 235,448,251
|
|
| Holdings Count | Holding |
140
|
|
| Advisory Fees Paid, Amount |
$ 954,313
|
|
| InvestmentCompanyPortfolioTurnover |
32.00%
|
|
| Additional Fund Statistics [Text Block] |
- Net Assets$235,448,251
- Number of Portfolio Holdings140
- Advisory Fee $954,313
- Portfolio Turnover32%
|
|
| Holdings [Text Block] |
Asset Weighting (% of total investments)Table SummaryValue | Value |
|---|
Common Stocks | 98.0% | Exchange-Traded Funds | 2.0% | Sector Weighting (% of net assets)Table SummaryValue | Value |
|---|
Other Assets in Excess of Liabilities | 0.5% | Consumer Staples | 0.3% | Materials | 1.4% | Equity | 2.0% | Consumer Discretionary | 5.1% | Utilities | 5.7% | Health Care | 7.5% | Energy | 9.1% | Financials | 9.4% | Communications | 9.5% | Industrials | 13.2% | Technology | 36.3% | Industry comparisons within this Tailored Shareholder Report (TSR) are based on the Bloomberg Industry Classification Standard (BICS), which provides a hierarchical system for classifying companies by their primary source of revenue. |
|
| Largest Holdings [Text Block] |
Top 10 Holdings (% of net assets)Table SummaryHolding Name | % of Net Assets |
|---|
NVIDIA Corporation | 7.2% |
|---|
Apple, Inc. | 6.7% |
|---|
Microsoft Corporation | 4.8% |
|---|
Alphabet, Inc. - Class A | 4.3% |
|---|
Amazon.com, Inc. | 2.5% |
|---|
Broadcom, Inc. | 2.5% |
|---|
Exxon Mobil Corporation | 2.3% |
|---|
Tesla, Inc. | 1.9% |
|---|
Chevron Corporation | 1.7% |
|---|
Micron Technology, Inc. | 1.6% |
|---|
|
|
| Material Fund Change [Text Block] |
No material changes occurred during the period ended March 31, 2026. |
|
| C000253484 |
|
|
| Shareholder Report [Line Items] |
|
|
| Fund Name |
NAA Mid Growth Fund
|
|
| Trading Symbol |
SECUX
|
|
| Annual or Semi-Annual Statement [Text Block] |
This semi-annual shareholder report contains important information about NAA Mid Growth Fund for the period of October 1, 2025 to March 31, 2026.
|
|
| Additional Information [Text Block] |
You can find additional information about the Fund at www.naafunds.com. You can also request this information by contacting us at 833-840-3937.
|
|
| Additional Information Phone Number |
833-840-3937
|
|
| Additional Information Website |
www.naafunds.com
|
|
| Expenses [Text Block] |
What were the Fund’s costs for the last six months?(based on a hypothetical $10,000 investment) Table SummaryClass Name | Costs of a $10,000 investment | Costs paid as a percentage of a $10,000 investment |
|---|
Class A | $70 | 1.41%Footnote Reference* |
|---|
| Footnote | Description | Footnote* | Annualized |
|
|
| Expenses Paid, Amount |
$ 70
|
|
| Expense Ratio, Percent |
1.41%
|
[11] |
| AssetsNet |
$ 67,685,795
|
|
| Holdings Count | Holding |
127
|
|
| Advisory Fees Paid, Amount |
$ 262,860
|
|
| InvestmentCompanyPortfolioTurnover |
44.00%
|
|
| Additional Fund Statistics [Text Block] |
- Net Assets$67,685,795
- Number of Portfolio Holdings127
- Advisory Fee $262,860
- Portfolio Turnover44%
|
|
| Holdings [Text Block] |
Asset Weighting (% of total investments)Table SummaryValue | Value |
|---|
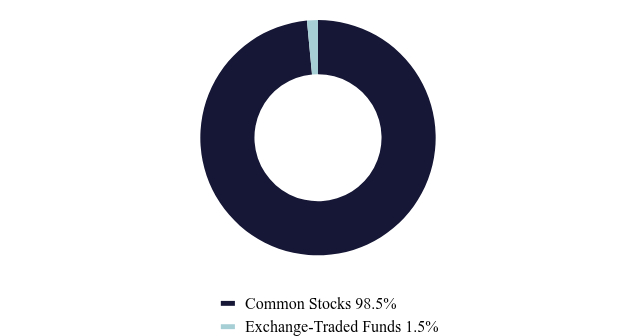
Common Stocks | 98.5% | Exchange-Traded Funds | 1.5% | Sector Weighting (% of net assets)Table SummaryValue | Value |
|---|
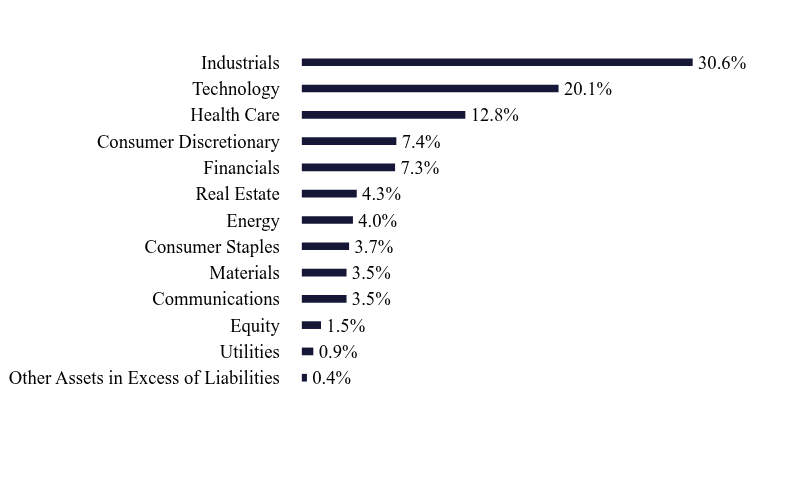
Other Assets in Excess of Liabilities | 0.4% | Utilities | 0.9% | Equity | 1.5% | Communications | 3.5% | Materials | 3.5% | Consumer Staples | 3.7% | Energy | 4.0% | Real Estate | 4.3% | Financials | 7.3% | Consumer Discretionary | 7.4% | Health Care | 12.8% | Technology | 20.1% | Industrials | 30.6% | Industry comparisons within this Tailored Shareholder Report (TSR) are based on the Bloomberg Industry Classification Standard (BICS), which provides a hierarchical system for classifying companies by their primary source of revenue. |
|
| Largest Holdings [Text Block] |
Top 10 Holdings (% of net assets)Table SummaryHolding Name | % of Net Assets |
|---|
Ciena Corporation | 2.7% |
|---|
TechnipFMC plc | 2.2% |
|---|
MasTec, Inc. | 2.0% |
|---|
Coherent Corp. | 2.0% |
|---|
Curtiss-Wright Corporation | 1.8% |
|---|
ATI, Inc. | 1.8% |
|---|
Woodward, Inc. | 1.8% |
|---|
nVent Electric PLC | 1.8% |
|---|
BWX Technologies, Inc. | 1.7% |
|---|
Carpenter Technology Corporation | 1.7% |
|---|
|
|
| Material Fund Change [Text Block] |
No material changes occurred during the period ended March 31, 2026. |
|
| C000253483 |
|
|
| Shareholder Report [Line Items] |
|
|
| Fund Name |
NAA Mid Growth Fund
|
|
| Trading Symbol |
SUFCX
|
|
| Annual or Semi-Annual Statement [Text Block] |
This semi-annual shareholder report contains important information about NAA Mid Growth Fund for the period of October 1, 2025 to March 31, 2026.
|
|
| Additional Information [Text Block] |
You can find additional information about the Fund at www.naafunds.com. You can also request this information by contacting us at 833-840-3937.
|
|
| Additional Information Phone Number |
833-840-3937
|
|
| Additional Information Website |
www.naafunds.com
|
|
| Expenses [Text Block] |
What were the Fund’s costs for the last six months?(based on a hypothetical $10,000 investment) Table SummaryClass Name | Costs of a $10,000 investment | Costs paid as a percentage of a $10,000 investment |
|---|
Class C | $107 | 2.16%Footnote Reference* |
|---|
| Footnote | Description | Footnote* | Annualized |
|
|
| Expenses Paid, Amount |
$ 107
|
|
| Expense Ratio, Percent |
2.16%
|
[12] |
| AssetsNet |
$ 67,685,795
|
|
| Holdings Count | Holding |
127
|
|
| Advisory Fees Paid, Amount |
$ 262,860
|
|
| InvestmentCompanyPortfolioTurnover |
44.00%
|
|
| Additional Fund Statistics [Text Block] |
- Net Assets$67,685,795
- Number of Portfolio Holdings127
- Advisory Fee $262,860
- Portfolio Turnover44%
|
|
| Holdings [Text Block] |
Asset Weighting (% of total investments)Table SummaryValue | Value |
|---|
Common Stocks | 98.5% | Exchange-Traded Funds | 1.5% | Sector Weighting (% of net assets)Table SummaryValue | Value |
|---|
Other Assets in Excess of Liabilities | 0.4% | Utilities | 0.9% | Equity | 1.5% | Communications | 3.5% | Materials | 3.5% | Consumer Staples | 3.7% | Energy | 4.0% | Real Estate | 4.3% | Financials | 7.3% | Consumer Discretionary | 7.4% | Health Care | 12.8% | Technology | 20.1% | Industrials | 30.6% | Industry comparisons within this Tailored Shareholder Report (TSR) are based on the Bloomberg Industry Classification Standard (BICS), which provides a hierarchical system for classifying companies by their primary source of revenue. |
|
| Largest Holdings [Text Block] |
Top 10 Holdings (% of net assets)Table SummaryHolding Name | % of Net Assets |
|---|
Ciena Corporation | 2.7% |
|---|
TechnipFMC plc | 2.2% |
|---|
MasTec, Inc. | 2.0% |
|---|
Coherent Corp. | 2.0% |
|---|
Curtiss-Wright Corporation | 1.8% |
|---|
ATI, Inc. | 1.8% |
|---|
Woodward, Inc. | 1.8% |
|---|
nVent Electric PLC | 1.8% |
|---|
BWX Technologies, Inc. | 1.7% |
|---|
Carpenter Technology Corporation | 1.7% |
|---|
|
|
| Material Fund Change [Text Block] |
No material changes occurred during the period ended March 31, 2026. |
|
| C000253481 |
|
|
| Shareholder Report [Line Items] |
|
|
| Fund Name |
NAA Mid Growth Fund
|
|
| Trading Symbol |
GIUIX
|
|
| Annual or Semi-Annual Statement [Text Block] |
This semi-annual shareholder report contains important information about NAA Mid Growth Fund for the period of October 1, 2025 to March 31, 2026.
|
|
| Additional Information [Text Block] |
You can find additional information about the Fund at www.naafunds.com. You can also request this information by contacting us at 833-840-3937.
|
|
| Additional Information Phone Number |
833-840-3937
|
|
| Additional Information Website |
www.naafunds.com
|
|
| Expenses [Text Block] |
What were the Fund’s costs for the last six months?(based on a hypothetical $10,000 investment) Table SummaryClass Name | Costs of a $10,000 investment | Costs paid as a percentage of a $10,000 investment |
|---|
Institutional | $58 | 1.16%Footnote Reference* |
|---|
| Footnote | Description | Footnote* | Annualized |
|
|
| Expenses Paid, Amount |
$ 58
|
|
| Expense Ratio, Percent |
1.16%
|
[13] |
| AssetsNet |
$ 67,685,795
|
|
| Holdings Count | Holding |
127
|
|
| Advisory Fees Paid, Amount |
$ 262,860
|
|
| InvestmentCompanyPortfolioTurnover |
44.00%
|
|
| Additional Fund Statistics [Text Block] |
- Net Assets$67,685,795
- Number of Portfolio Holdings127
- Advisory Fee $262,860
- Portfolio Turnover44%
|
|
| Holdings [Text Block] |
Asset Weighting (% of total investments)Table SummaryValue | Value |
|---|
Common Stocks | 98.5% | Exchange-Traded Funds | 1.5% | Sector Weighting (% of net assets)Table SummaryValue | Value |
|---|
Other Assets in Excess of Liabilities | 0.4% | Utilities | 0.9% | Equity | 1.5% | Communications | 3.5% | Materials | 3.5% | Consumer Staples | 3.7% | Energy | 4.0% | Real Estate | 4.3% | Financials | 7.3% | Consumer Discretionary | 7.4% | Health Care | 12.8% | Technology | 20.1% | Industrials | 30.6% | Industry comparisons within this Tailored Shareholder Report (TSR) are based on the Bloomberg Industry Classification Standard (BICS), which provides a hierarchical system for classifying companies by their primary source of revenue. |
|
| Largest Holdings [Text Block] |
Top 10 Holdings (% of net assets)Table SummaryHolding Name | % of Net Assets |
|---|
Ciena Corporation | 2.7% |
|---|
TechnipFMC plc | 2.2% |
|---|
MasTec, Inc. | 2.0% |
|---|
Coherent Corp. | 2.0% |
|---|
Curtiss-Wright Corporation | 1.8% |
|---|
ATI, Inc. | 1.8% |
|---|
Woodward, Inc. | 1.8% |
|---|
nVent Electric PLC | 1.8% |
|---|
BWX Technologies, Inc. | 1.7% |
|---|
Carpenter Technology Corporation | 1.7% |
|---|
|
|
| Material Fund Change [Text Block] |
No material changes occurred during the period ended March 31, 2026. |
|
| C000253488 |
|
|
| Shareholder Report [Line Items] |
|
|
| Fund Name |
NAA Opportunity Fund
|
|
| Trading Symbol |
SAOAX
|
|
| Annual or Semi-Annual Statement [Text Block] |
This semi-annual shareholder report contains important information about NAA Opportunity Fund for the period of October 1, 2025 to March 31, 2026.
|
|
| Additional Information [Text Block] |
You can find additional information about the Fund at www.naafunds.com. You can also request this information by contacting us at 833-840-3937.
|
|
| Additional Information Phone Number |
833-840-3937
|
|
| Additional Information Website |
www.naafunds.com
|
|
| Expenses [Text Block] |
What were the Fund’s costs for the last six months?(based on a hypothetical $10,000 investment) Table SummaryClass Name | Costs of a $10,000 investment | Costs paid as a percentage of a $10,000 investment |
|---|
Class A | $87 | 1.64%Footnote Reference* |
|---|
| Footnote | Description | Footnote* | Annualized |
|
|
| Expenses Paid, Amount |
$ 87
|
|
| Expense Ratio, Percent |
1.64%
|
[14] |
| AssetsNet |
$ 39,803,028
|
|
| Holdings Count | Holding |
424
|
|
| Advisory Fees Paid, Amount |
$ 163,280
|
|
| InvestmentCompanyPortfolioTurnover |
75.00%
|
|
| Additional Fund Statistics [Text Block] |
- Net Assets$39,803,028
- Number of Portfolio Holdings424
- Advisory Fee $163,280
- Portfolio Turnover75%
|
|
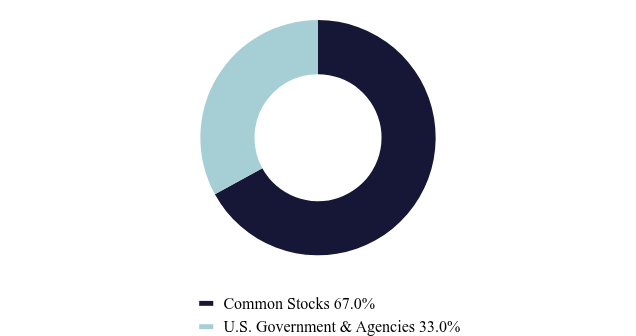
| Holdings [Text Block] |
Asset Weighting (% of total investments)Table SummaryValue | Value |
|---|
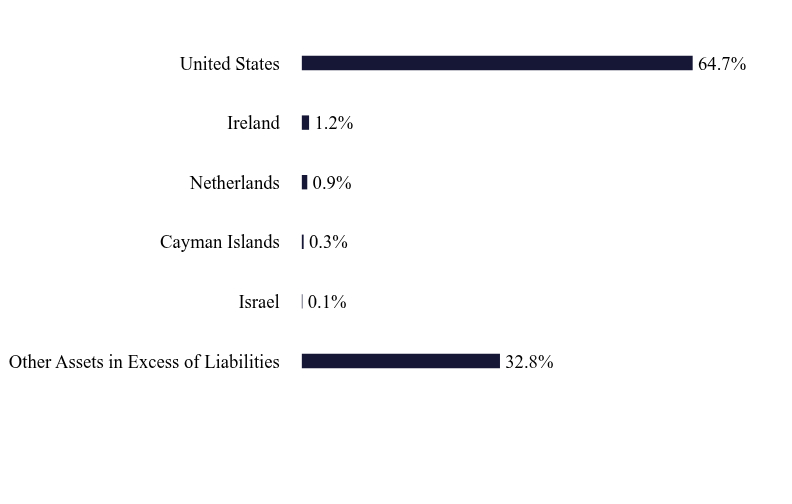
Common Stocks | 67.0% | U.S. Government & Agencies | 33.0% | Country Weighting (% of net assets)Table SummaryValue | Value |
|---|
Other Assets in Excess of Liabilities | 32.8% | Israel | 0.1% | Cayman Islands | 0.3% | Netherlands | 0.9% | Ireland | 1.2% | United States | 64.7% | Country weightings within this Tailored Shareholder Report (TSR) are based on the country of risk provided by ICE, the pricing vendor, at the time the security is set up |
|
| Largest Holdings [Text Block] |
Top 10 Holdings (% of net assets)Table SummaryHolding Name | % of Net Assets |
|---|
United States Treasury Bill | 22.2% |
|---|
Chevron Corporation | 1.9% |
|---|
Exxon Mobil Corporation | 1.7% |
|---|
Cheniere Energy, Inc. | 1.5% |
|---|
Pfizer, Inc. | 1.5% |
|---|
Bristol-Myers Squibb Company | 1.4% |
|---|
Exelon Corporation | 1.3% |
|---|
Merck & Company, Inc. | 1.3% |
|---|
Ameren Corporation | 1.1% |
|---|
AT&T, Inc. | 1.0% |
|---|
|
|
| Material Fund Change [Text Block] |
No material changes occurred during the period ended March 31, 2026. |
|
| C000253485 |
|
|
| Shareholder Report [Line Items] |
|
|
| Fund Name |
NAA Opportunity Fund
|
|
| Trading Symbol |
SAOCX
|
|
| Annual or Semi-Annual Statement [Text Block] |
This semi-annual shareholder report contains important information about NAA Opportunity Fund for the period of October 1, 2025 to March 31, 2026.
|
|
| Additional Information [Text Block] |
You can find additional information about the Fund at www.naafunds.com. You can also request this information by contacting us at 833-840-3937.
|
|
| Additional Information Phone Number |
833-840-3937
|
|
| Additional Information Website |
www.naafunds.com
|
|
| Expenses [Text Block] |
What were the Fund’s costs for the last six months?(based on a hypothetical $10,000 investment) Table SummaryClass Name | Costs of a $10,000 investment | Costs paid as a percentage of a $10,000 investment |
|---|
Class C | $126 | 2.39%Footnote Reference* |
|---|
| Footnote | Description | Footnote* | Annualized |
|
|
| Expenses Paid, Amount |
$ 126
|
|
| Expense Ratio, Percent |
2.39%
|
[15] |
| AssetsNet |
$ 39,803,028
|
|
| Holdings Count | Holding |
424
|
|
| Advisory Fees Paid, Amount |
$ 163,280
|
|
| InvestmentCompanyPortfolioTurnover |
75.00%
|
|
| Additional Fund Statistics [Text Block] |
- Net Assets$39,803,028
- Number of Portfolio Holdings424
- Advisory Fee $163,280
- Portfolio Turnover75%
|
|
| Holdings [Text Block] |
Asset Weighting (% of total investments)Table SummaryValue | Value |
|---|
Common Stocks | 67.0% | U.S. Government & Agencies | 33.0% | Country Weighting (% of net assets)Table SummaryValue | Value |
|---|
Other Assets in Excess of Liabilities | 32.8% | Israel | 0.1% | Cayman Islands | 0.3% | Netherlands | 0.9% | Ireland | 1.2% | United States | 64.7% | Country weightings within this Tailored Shareholder Report (TSR) are based on the country of risk provided by ICE, the pricing vendor, at the time the security is set up |
|
| Largest Holdings [Text Block] |
Top 10 Holdings (% of net assets)Table SummaryHolding Name | % of Net Assets |
|---|
United States Treasury Bill | 22.2% |
|---|
Chevron Corporation | 1.9% |
|---|
Exxon Mobil Corporation | 1.7% |
|---|
Cheniere Energy, Inc. | 1.5% |
|---|
Pfizer, Inc. | 1.5% |
|---|
Bristol-Myers Squibb Company | 1.4% |
|---|
Exelon Corporation | 1.3% |
|---|
Merck & Company, Inc. | 1.3% |
|---|
Ameren Corporation | 1.1% |
|---|
AT&T, Inc. | 1.0% |
|---|
|
|
| Material Fund Change [Text Block] |
No material changes occurred during the period ended March 31, 2026. |
|
| C000253487 |
|
|
| Shareholder Report [Line Items] |
|
|
| Fund Name |
NAA Opportunity Fund
|
|
| Trading Symbol |
SAOIX
|
|
| Annual or Semi-Annual Statement [Text Block] |
This semi-annual shareholder report contains important information about NAA Opportunity Fund for the period of October 1, 2025 to March 31, 2026.
|
|
| Additional Information [Text Block] |
You can find additional information about the Fund at www.naafunds.com. You can also request this information by contacting us at 833-840-3937.
|
|
| Additional Information Phone Number |
833-840-3937
|
|
| Additional Information Website |
www.naafunds.com
|
|
| Expenses [Text Block] |
What were the Fund’s costs for the last six months?(based on a hypothetical $10,000 investment) Table SummaryClass Name | Costs of a $10,000 investment | Costs paid as a percentage of a $10,000 investment |
|---|
Institutional | $74 | 1.39%Footnote Reference* |
|---|
| Footnote | Description | Footnote* | Annualized |
|
|
| Expenses Paid, Amount |
$ 74
|
|
| Expense Ratio, Percent |
1.39%
|
[16] |
| AssetsNet |
$ 39,803,028
|
|
| Holdings Count | Holding |
424
|
|
| Advisory Fees Paid, Amount |
$ 163,280
|
|
| InvestmentCompanyPortfolioTurnover |
75.00%
|
|
| Additional Fund Statistics [Text Block] |
- Net Assets$39,803,028
- Number of Portfolio Holdings424
- Advisory Fee $163,280
- Portfolio Turnover75%
|
|
| Holdings [Text Block] |
Asset Weighting (% of total investments)Table SummaryValue | Value |
|---|
Common Stocks | 67.0% | U.S. Government & Agencies | 33.0% | Country Weighting (% of net assets)Table SummaryValue | Value |
|---|
Other Assets in Excess of Liabilities | 32.8% | Israel | 0.1% | Cayman Islands | 0.3% | Netherlands | 0.9% | Ireland | 1.2% | United States | 64.7% | Country weightings within this Tailored Shareholder Report (TSR) are based on the country of risk provided by ICE, the pricing vendor, at the time the security is set up |
|
| Largest Holdings [Text Block] |
Top 10 Holdings (% of net assets)Table SummaryHolding Name | % of Net Assets |
|---|
United States Treasury Bill | 22.2% |
|---|
Chevron Corporation | 1.9% |
|---|
Exxon Mobil Corporation | 1.7% |
|---|
Cheniere Energy, Inc. | 1.5% |
|---|
Pfizer, Inc. | 1.5% |
|---|
Bristol-Myers Squibb Company | 1.4% |
|---|
Exelon Corporation | 1.3% |
|---|
Merck & Company, Inc. | 1.3% |
|---|
Ameren Corporation | 1.1% |
|---|
AT&T, Inc. | 1.0% |
|---|
|
|
| Material Fund Change [Text Block] |
No material changes occurred during the period ended March 31, 2026. |
|
| C000253490 |
|
|
| Shareholder Report [Line Items] |
|
|
| Fund Name |
NAA Risk Managed Real Estate Fund
|
|
| Trading Symbol |
GURAX
|
|
| Annual or Semi-Annual Statement [Text Block] |
This semi-annual shareholder report contains important information about NAA Risk Managed Real Estate Fund for the period of October 1, 2025 to March 31, 2026.
|
|
| Additional Information [Text Block] |
You can find additional information about the Fund at www.naafunds.com. You can also request this information by contacting us at 833-840-3937.
|
|
| Additional Information Phone Number |
833-840-3937
|
|
| Additional Information Website |
www.naafunds.com
|
|
| Expenses [Text Block] |
What were the Fund’s costs for the last six months?(based on a hypothetical $10,000 investment) Table SummaryClass Name | Costs of a $10,000 investment | Costs paid as a percentage of a $10,000 investment |
|---|
Class A | $95 | 1.89%Footnote Reference* |
|---|
| Footnote | Description | Footnote* | Annualized |
|
|
| Expenses Paid, Amount |
$ 95
|
|
| Expense Ratio, Percent |
1.89%
|
[17] |
| AssetsNet |
$ 180,182,861
|
|
| Holdings Count | Holding |
121
|
|
| Advisory Fees Paid, Amount |
$ 613,809
|
|
| InvestmentCompanyPortfolioTurnover |
8.00%
|
|
| Additional Fund Statistics [Text Block] |
- Net Assets$180,182,861
- Number of Portfolio Holdings121
- Advisory Fee $613,809
- Portfolio Turnover8%
|
|
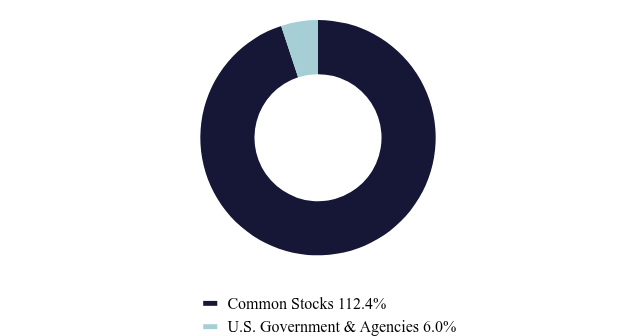
| Holdings [Text Block] |
Asset Weighting (% of total investments)Table SummaryValue | Value |
|---|
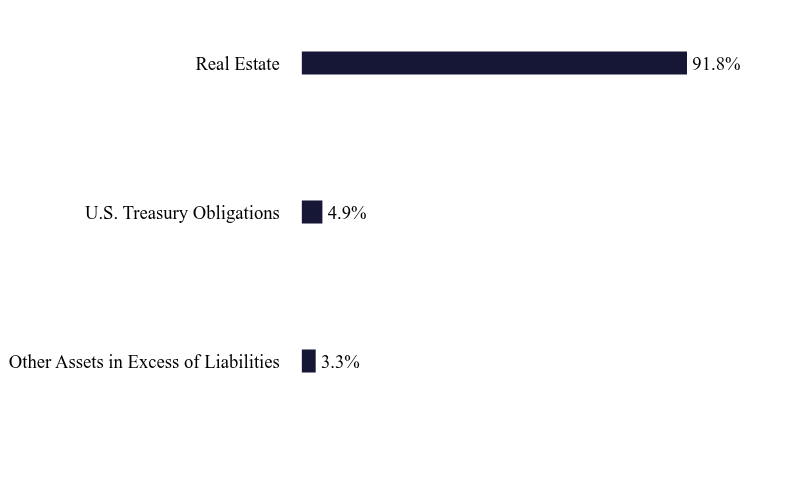
Common Stocks | 112.4% | U.S. Government & Agencies | 6.0% | Sector Weighting (% of net assets)Table SummaryValue | Value |
|---|
Other Assets in Excess of Liabilities | 3.3% | U.S. Treasury Obligations | 4.9% | Real Estate | 91.8% | Industry comparisons within this Tailored Shareholder Report (TSR) are based on the Bloomberg Industry Classification Standard (BICS), which provides a hierarchical system for classifying companies by their primary source of revenue. |
|
| Largest Holdings [Text Block] |
Top 10 Holdings (% of net assets)Table SummaryHolding Name | % of Net Assets |
|---|
Welltower, Inc. | 9.8% |
|---|
Prologis, Inc. | 8.8% |
|---|
Equinix, Inc. | 6.8% |
|---|
United States Treasury Bill | 4.9% |
|---|
Digital Realty Trust, Inc. | 4.5% |
|---|
Simon Property Group, Inc. | 4.4% |
|---|
Realty Income Corporation | 4.4% |
|---|
Public Storage | 4.4% |
|---|
Ventas, Inc. | 3.6% |
|---|
VICI Properties, Inc. | 2.9% |
|---|
|
|
| Material Fund Change [Text Block] |
No material changes occurred during the period ended March 31, 2026. |
|
| C000253492 |
|
|
| Shareholder Report [Line Items] |
|
|
| Fund Name |
NAA Risk Managed Real Estate Fund
|
|
| Trading Symbol |
GURCX
|
|
| Annual or Semi-Annual Statement [Text Block] |
This semi-annual shareholder report contains important information about NAA Risk Managed Real Estate Fund for the period of October 1, 2025 to March 31, 2026.
|
|
| Additional Information [Text Block] |
You can find additional information about the Fund at www.naafunds.com. You can also request this information by contacting us at 833-840-3937.
|
|
| Additional Information Phone Number |
833-840-3937
|
|
| Additional Information Website |
www.naafunds.com
|
|
| Expenses [Text Block] |
What were the Fund’s costs for the last six months?(based on a hypothetical $10,000 investment) Table SummaryClass Name | Costs of a $10,000 investment | Costs paid as a percentage of a $10,000 investment |
|---|
Class C | $129 | 2.59%Footnote Reference* |
|---|
| Footnote | Description | Footnote* | Annualized |
|
|
| Expenses Paid, Amount |
$ 129
|
|
| Expense Ratio, Percent |
2.59%
|
[18] |
| AssetsNet |
$ 180,182,861
|
|
| Holdings Count | Holding |
121
|
|
| Advisory Fees Paid, Amount |
$ 613,809
|
|
| InvestmentCompanyPortfolioTurnover |
8.00%
|
|
| Additional Fund Statistics [Text Block] |
- Net Assets$180,182,861
- Number of Portfolio Holdings121
- Advisory Fee $613,809
- Portfolio Turnover8%
|
|
| Holdings [Text Block] |
Asset Weighting (% of total investments)Table SummaryValue | Value |
|---|
Common Stocks | 112.4% | U.S. Government & Agencies | 6.0% | Sector Weighting (% of net assets)Table SummaryValue | Value |
|---|
Other Assets in Excess of Liabilities | 3.3% | U.S. Treasury Obligations | 4.9% | Real Estate | 91.8% | Industry comparisons within this Tailored Shareholder Report (TSR) are based on the Bloomberg Industry Classification Standard (BICS), which provides a hierarchical system for classifying companies by their primary source of revenue. |
|
| Largest Holdings [Text Block] |
Top 10 Holdings (% of net assets)Table SummaryHolding Name | % of Net Assets |
|---|
Welltower, Inc. | 9.8% |
|---|
Prologis, Inc. | 8.8% |
|---|
Equinix, Inc. | 6.8% |
|---|
United States Treasury Bill | 4.9% |
|---|
Digital Realty Trust, Inc. | 4.5% |
|---|
Simon Property Group, Inc. | 4.4% |
|---|
Realty Income Corporation | 4.4% |
|---|
Public Storage | 4.4% |
|---|
Ventas, Inc. | 3.6% |
|---|
VICI Properties, Inc. | 2.9% |
|---|
|
|
| Material Fund Change [Text Block] |
No material changes occurred during the period ended March 31, 2026. |
|
| C000253489 |
|
|
| Shareholder Report [Line Items] |
|
|
| Fund Name |
NAA Risk Managed Real Estate Fund
|
|
| Trading Symbol |
GURIX
|
|
| Annual or Semi-Annual Statement [Text Block] |
This semi-annual shareholder report contains important information about NAA Risk Managed Real Estate Fund for the period of October 1, 2025 to March 31, 2026.
|
|
| Additional Information [Text Block] |
You can find additional information about the Fund at www.naafunds.com. You can also request this information by contacting us at 833-840-3937.
|
|
| Additional Information Phone Number |
833-840-3937
|
|
| Additional Information Website |
www.naafunds.com
|
|
| Expenses [Text Block] |
What were the Fund’s costs for the last six months?(based on a hypothetical $10,000 investment) Table SummaryClass Name | Costs of a $10,000 investment | Costs paid as a percentage of a $10,000 investment |
|---|
Institutional | $79 | 1.57%Footnote Reference* |
|---|
| Footnote | Description | Footnote* | Annualized |
|
|
| Expenses Paid, Amount |
$ 79
|
|
| Expense Ratio, Percent |
1.57%
|
[19] |
| AssetsNet |
$ 180,182,861
|
|
| Holdings Count | Holding |
121
|
|
| Advisory Fees Paid, Amount |
$ 613,809
|
|
| InvestmentCompanyPortfolioTurnover |
8.00%
|
|
| Additional Fund Statistics [Text Block] |
- Net Assets$180,182,861
- Number of Portfolio Holdings121
- Advisory Fee $613,809
- Portfolio Turnover8%
|
|
| Holdings [Text Block] |
Asset Weighting (% of total investments)Table SummaryValue | Value |
|---|
Common Stocks | 112.4% | U.S. Government & Agencies | 6.0% | Sector Weighting (% of net assets)Table SummaryValue | Value |
|---|
Other Assets in Excess of Liabilities | 3.3% | U.S. Treasury Obligations | 4.9% | Real Estate | 91.8% | Industry comparisons within this Tailored Shareholder Report (TSR) are based on the Bloomberg Industry Classification Standard (BICS), which provides a hierarchical system for classifying companies by their primary source of revenue. |
|
| Largest Holdings [Text Block] |
Top 10 Holdings (% of net assets)Table SummaryHolding Name | % of Net Assets |
|---|
Welltower, Inc. | 9.8% |
|---|
Prologis, Inc. | 8.8% |
|---|
Equinix, Inc. | 6.8% |
|---|
United States Treasury Bill | 4.9% |
|---|
Digital Realty Trust, Inc. | 4.5% |
|---|
Simon Property Group, Inc. | 4.4% |
|---|
Realty Income Corporation | 4.4% |
|---|
Public Storage | 4.4% |
|---|
Ventas, Inc. | 3.6% |
|---|
VICI Properties, Inc. | 2.9% |
|---|
|
|
| Material Fund Change [Text Block] |
No material changes occurred during the period ended March 31, 2026. |
|
| C000253495 |
|
|
| Shareholder Report [Line Items] |
|
|
| Fund Name |
NAA SMid Cap Value Fund
|
|
| Trading Symbol |
SEVAX
|
|
| Annual or Semi-Annual Statement [Text Block] |
This semi-annual shareholder report contains important information about NAA SMid Cap Value Fund for the period of October 1, 2025 to March 31, 2026.
|
|
| Additional Information [Text Block] |
You can find additional information about the Fund at www.naafunds.com. You can also request this information by contacting us at 833-840-3937.
|
|
| Additional Information Phone Number |
833-840-3937
|
|
| Additional Information Website |
www.naafunds.com
|
|
| Expenses [Text Block] |
What were the Fund’s costs for the last six months?(based on a hypothetical $10,000 investment) Table SummaryClass Name | Costs of a $10,000 investment | Costs paid as a percentage of a $10,000 investment |
|---|
Class A | $58 | 1.15%Footnote Reference* |
|---|
| Footnote | Description | Footnote* | Annualized |
|
|
| Expenses Paid, Amount |
$ 58
|
|
| Expense Ratio, Percent |
1.15%
|
[20] |
| AssetsNet |
$ 282,421,306
|
|
| Holdings Count | Holding |
122
|
|
| Advisory Fees Paid, Amount |
$ 970,503
|
|
| InvestmentCompanyPortfolioTurnover |
46.00%
|
|
| Additional Fund Statistics [Text Block] |
- Net Assets$282,421,306
- Number of Portfolio Holdings122
- Advisory Fee $970,503
- Portfolio Turnover46%
|
|
| Holdings [Text Block] |
Asset Weighting (% of total investments)Table SummaryValue | Value |
|---|
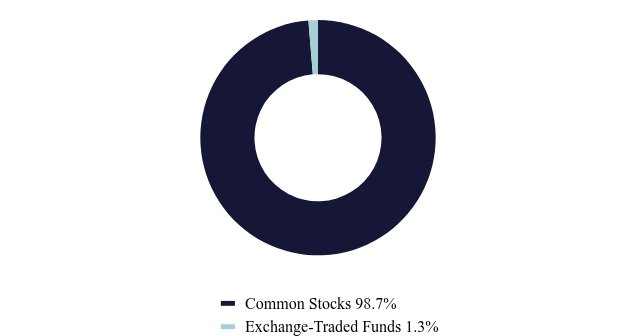
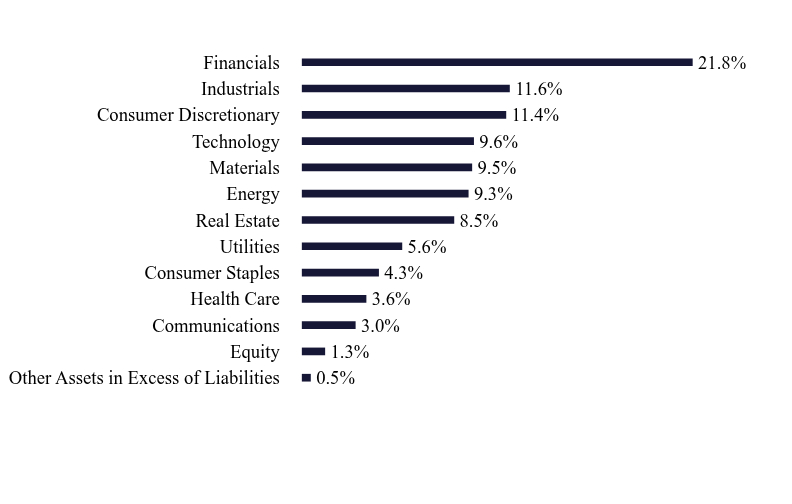
Common Stocks | 98.7% | Exchange-Traded Funds | 1.3% | Sector Weighting (% of net assets)Table SummaryValue | Value |
|---|
Other Assets in Excess of Liabilities | 0.5% | Equity | 1.3% | Communications | 3.0% | Health Care | 3.6% | Consumer Staples | 4.3% | Utilities | 5.6% | Real Estate | 8.5% | Energy | 9.3% | Materials | 9.5% | Technology | 9.6% | Consumer Discretionary | 11.4% | Industrials | 11.6% | Financials | 21.8% | Industry comparisons within this Tailored Shareholder Report (TSR) are based on the Bloomberg Industry Classification Standard (BICS), which provides a hierarchical system for classifying companies by their primary source of revenue. |
|
| Largest Holdings [Text Block] |
Top 10 Holdings (% of net assets)Table SummaryHolding Name | % of Net Assets |
|---|
Alcoa Corporation | 2.1% |
|---|
ConocoPhillips | 2.1% |
|---|
Chord Energy Corporation | 1.8% |
|---|
Patterson-UTI Energy, Inc. | 1.6% |
|---|
Cardinal Health, Inc. | 1.6% |
|---|
AptarGroup, Inc. | 1.5% |
|---|
Ecolab, Inc. | 1.5% |
|---|
Reinsurance Group of America, Inc. | 1.5% |
|---|
Nov, Inc. COM | 1.5% |
|---|
OGE Energy Corporation | 1.4% |
|---|
|
|
| Material Fund Change [Text Block] |
No material changes occurred during the period ended March 31, 2026. |
|
| C000253494 |
|
|
| Shareholder Report [Line Items] |
|
|
| Fund Name |
NAA SMid Cap Value Fund
|
|
| Trading Symbol |
SEVSX
|
|
| Annual or Semi-Annual Statement [Text Block] |
This semi-annual shareholder report contains important information about NAA SMid Cap Value Fund for the period of October 1, 2025 to March 31, 2026.
|
|
| Additional Information [Text Block] |
You can find additional information about the Fund at www.naafunds.com. You can also request this information by contacting us at 833-840-3937.
|
|
| Additional Information Phone Number |
833-840-3937
|
|
| Additional Information Website |
www.naafunds.com
|
|
| Expenses [Text Block] |
What were the
Fund’s costs for the last six months?(based on a hypothetical $10,000 investment) Table SummaryClass Name | Costs of a $10,000 investment | Costs paid as a percentage of a $10,000 investment |
|---|
Class C | $100 | 2.00%Footnote Reference* |
|---|
| Footnote | Description | Footnote* | Annualized |
|
|
| Expenses Paid, Amount |
$ 100
|
|
| Expense Ratio, Percent |
2.00%
|
[21] |
| AssetsNet |
$ 282,421,306
|
|
| Holdings Count | Holding |
122
|
|
| Advisory Fees Paid, Amount |
$ 970,503
|
|
| InvestmentCompanyPortfolioTurnover |
46.00%
|
|
| Additional Fund Statistics [Text Block] |
- Net Assets$282,421,306
- Number of Portfolio Holdings122
- Advisory Fee $970,503
- Portfolio Turnover46%
|
|
| Holdings [Text Block] |
Asset Weighting (% of total investments)Table SummaryValue | Value |
|---|
Common Stocks | 98.7% | Exchange-Traded Funds | 1.3% | Sector Weighting (% of net assets)Table SummaryValue | Value |
|---|
Other Assets in Excess of Liabilities | 0.5% | Equity | 1.3% | Communications | 3.0% | Health Care | 3.6% | Consumer Staples | 4.3% | Utilities | 5.6% | Real Estate | 8.5% | Energy | 9.3% | Materials | 9.5% | Technology | 9.6% | Consumer Discretionary | 11.4% | Industrials | 11.6% | Financials | 21.8% | Industry comparisons within this Tailored Shareholder Report (TSR) are based on the Bloomberg Industry Classification Standard (BICS), which provides a hierarchical system for classifying companies by their primary source of revenue. |
|
| Largest Holdings [Text Block] |
Top 10 Holdings (% of net assets)Table SummaryHolding Name | % of Net Assets |
|---|
Alcoa Corporation | 2.1% |
|---|
ConocoPhillips | 2.1% |
|---|
Chord Energy Corporation | 1.8% |
|---|
Patterson-UTI Energy, Inc. | 1.6% |
|---|
Cardinal Health, Inc. | 1.6% |
|---|
AptarGroup, Inc. | 1.5% |
|---|
Ecolab, Inc. | 1.5% |
|---|
Reinsurance Group of America, Inc. | 1.5% |
|---|
Nov, Inc. COM | 1.5% |
|---|
OGE Energy Corporation | 1.4% |
|---|
|
|
| Material Fund Change [Text Block] |
No material changes occurred during the period ended March 31, 2026. |
|
| C000253493 |
|
|
| Shareholder Report [Line Items] |
|
|
| Fund Name |
NAA SMid Cap Value Fund
|
|
| Trading Symbol |
SVUIX
|
|
| Annual or Semi-Annual Statement [Text Block] |
This semi-annual shareholder report contains important information about NAA SMid Cap Value Fund for the period of October 1, 2025 to March 31, 2026.
|
|
| Additional Information [Text Block] |
You can find additional information about the Fund at www.naafunds.com. You can also request this information by contacting us at 833-840-3937.
|
|
| Additional Information Phone Number |
833-840-3937
|
|
| Additional Information Website |
www.naafunds.com
|
|
| Expenses [Text Block] |
What were the Fund’s costs for the last six months?(based on a hypothetical $10,000 investment) Table SummaryClass Name | Costs of a $10,000 investment | Costs paid as a percentage of a $10,000 investment |
|---|
Institutional | $46 | 0.92%Footnote Reference* |
|---|
| Footnote | Description | Footnote* | Annualized |
|
|
| Expenses Paid, Amount |
$ 46
|
|
| Expense Ratio, Percent |
0.92%
|
[22] |
| AssetsNet |
$ 282,421,306
|
|
| Holdings Count | Holding |
122
|
|
| Advisory Fees Paid, Amount |
$ 970,503
|
|
| InvestmentCompanyPortfolioTurnover |
46.00%
|
|
| Additional Fund Statistics [Text Block] |
- Net Assets$282,421,306
- Number of Portfolio Holdings122
- Advisory Fee $970,503
- Portfolio Turnover46%
|
|
| Holdings [Text Block] |
Asset Weighting (% of total investments)Table SummaryValue | Value |
|---|
Common Stocks | 98.7% | Exchange-Traded Funds | 1.3% | Sector Weighting (% of net assets)Table SummaryValue | Value |
|---|
Other Assets in Excess of Liabilities | 0.5% | Equity | 1.3% | Communications | 3.0% | Health Care | 3.6% | Consumer Staples | 4.3% | Utilities | 5.6% | Real Estate | 8.5% | Energy | 9.3% | Materials | 9.5% | Technology | 9.6% | Consumer Discretionary | 11.4% | Industrials | 11.6% | Financials | 21.8% | Industry comparisons within this Tailored Shareholder Report (TSR) are based on the Bloomberg Industry Classification Standard (BICS), which provides a hierarchical system for classifying companies by their primary source of revenue. |
|
| Largest Holdings [Text Block] |
Top 10 Holdings (% of net assets)Table SummaryHolding Name | % of Net Assets |
|---|
Alcoa Corporation | 2.1% |
|---|
ConocoPhillips | 2.1% |
|---|
Chord Energy Corporation | 1.8% |
|---|
Patterson-UTI Energy, Inc. | 1.6% |
|---|
Cardinal Health, Inc. | 1.6% |
|---|
AptarGroup, Inc. | 1.5% |
|---|
Ecolab, Inc. | 1.5% |
|---|
Reinsurance Group of America, Inc. | 1.5% |
|---|
Nov, Inc. COM | 1.5% |
|---|
OGE Energy Corporation | 1.4% |
|---|
|
|
| Material Fund Change [Text Block] |
No material changes occurred during the period ended March 31, 2026. |
|
| C000253500 |
|
|
| Shareholder Report [Line Items] |
|
|
| Fund Name |
NAA World Equity Income Fund
|
|
| Trading Symbol |
SEQAX
|
|
| Annual or Semi-Annual Statement [Text Block] |
This semi-annual shareholder report contains important information about NAA World Equity Income Fund for the period of October 1, 2025 to March 31, 2026.
|
|
| Additional Information [Text Block] |
You can find additional information about the Fund at www.naafunds.com. You can also request this information by contacting us at 833-840-3937.
|
|
| Additional Information Phone Number |
833-840-3937
|
|
| Additional Information Website |
www.naafunds.com
|
|
| Expenses [Text Block] |
What were the Fund’s costs for the last six months?(based on a hypothetical $10,000 investment) Table SummaryClass Name | Costs of a $10,000 investment | Costs paid as a percentage of a $10,000 investment |
|---|
Class A | $60 | 1.17%Footnote Reference* |
|---|
| Footnote | Description | Footnote* | Annualized |
|
|
| Expenses Paid, Amount |
$ 60
|
|
| Expense Ratio, Percent |
1.17%
|
[23] |
| AssetsNet |
$ 46,258,350
|
|
| Holdings Count | Holding |
173
|
|
| Advisory Fees Paid, Amount |
$ 98,792
|
|
| InvestmentCompanyPortfolioTurnover |
27.00%
|
|
| Additional Fund Statistics [Text Block] |
- Net Assets$46,258,350
- Number of Portfolio Holdings173
- Advisory Fee $98,792
- Portfolio Turnover27%
|
|
| Holdings [Text Block] |
Asset Weighting (% of total investments)Table SummaryValue | Value |
|---|
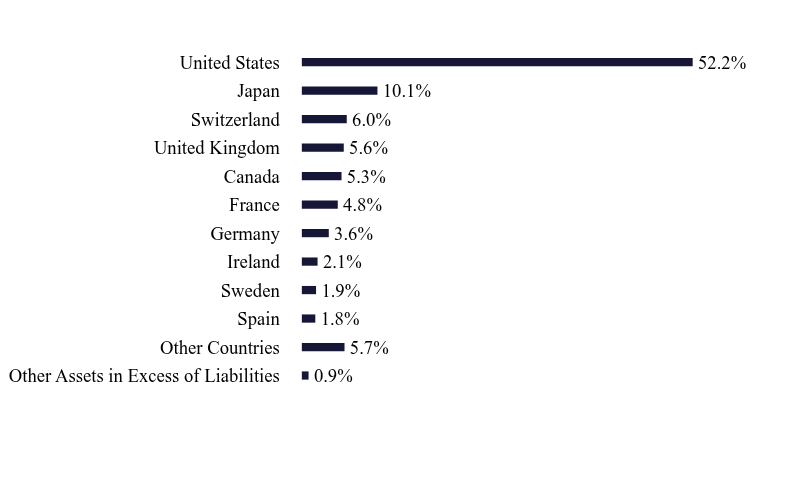
Common Stocks | 98.5% | Exchange-Traded Funds | 1.5% | Country Weighting (% of net assets)Table SummaryValue | Value |
|---|
Other Assets in Excess of Liabilities | 0.9% | Other Countries | 5.7% | Spain | 1.8% | Sweden | 1.9% | Ireland | 2.1% | Germany | 3.6% | France | 4.8% | Canada | 5.3% | United Kingdom | 5.6% | Switzerland | 6.0% | Japan | 10.1% | United States | 52.2% | Country weightings within this Tailored Shareholder Report (TSR) are based on the country of risk provided by ICE, the pricing vendor, at the time the security is set up |
|
| Largest Holdings [Text Block] |
Top 10 Holdings (% of net assets)Table SummaryHolding Name | % of Net Assets |
|---|
Broadcom, Inc. | 7.6% |
|---|
JPMorgan Chase & Company | 3.2% |
|---|
Exxon Mobil Corporation | 3.0% |
|---|
Mitsubishi UFJ Financial Group, Inc. | 2.7% |
|---|
Johnson & Johnson | 2.4% |
|---|
Walmart, Inc. | 2.3% |
|---|
HSBC Holdings PLC | 2.3% |
|---|
Sony Group Corporation | 2.0% |
|---|
Novartis A.G. | 1.8% |
|---|
Chevron Corporation | 1.6% |
|---|
|
|
| Material Fund Change [Text Block] |
No material changes occurred during the period ended March 31, 2026. |
|
| C000253498 |
|
|
| Shareholder Report [Line Items] |
|
|
| Fund Name |
NAA World Equity Income Fund
|
|
| Trading Symbol |
SFGCX
|
|
| Annual or Semi-Annual Statement [Text Block] |
This semi-annual shareholder report contains important information about NAA World Equity Income Fund for the period of October 1, 2025 to March 31, 2026.
|
|
| Additional Information [Text Block] |
You can find additional information about the Fund at www.naafunds.com. You can also request this information by contacting us at 833-840-3937.
|
|
| Additional Information Phone Number |
833-840-3937
|
|
| Additional Information Website |
www.naafunds.com
|
|
| Expenses [Text Block] |
What were the Fund’s costs for the last six months?(based on a hypothetical $10,000 investment) Table SummaryClass Name | Costs of a $10,000 investment | Costs paid as a percentage of a $10,000 investment |
|---|
Class C | $99 | 1.92%Footnote Reference* |
|---|
| Footnote | Description | Footnote* | Annualized |
|
|
| Expenses Paid, Amount |
$ 99
|
|
| Expense Ratio, Percent |
1.92%
|
[24] |
| AssetsNet |
$ 46,258,350
|
|
| Holdings Count | Holding |
173
|
|
| Advisory Fees Paid, Amount |
$ 98,792
|
|
| InvestmentCompanyPortfolioTurnover |
27.00%
|
|
| Additional Fund Statistics [Text Block] |
- Net Assets$46,258,350
- Number of Portfolio Holdings173
- Advisory Fee $98,792
- Portfolio Turnover27%
|
|
| Holdings [Text Block] |
Asset Weighting (% of total investments)Table SummaryValue | Value |
|---|
Common Stocks | 98.5% | Exchange-Traded Funds | 1.5% | Country Weighting (% of net assets)Table SummaryValue | Value |
|---|
Other Assets in Excess of Liabilities | 0.9% | Other Countries | 5.7% | Spain | 1.8% | Sweden | 1.9% | Ireland | 2.1% | Germany | 3.6% | France | 4.8% | Canada | 5.3% | United Kingdom | 5.6% | Switzerland | 6.0% | Japan | 10.1% | United States | 52.2% | Country weightings within this Tailored Shareholder Report (TSR) are based on the country of risk provided by ICE, the pricing vendor, at the time the security is set up |
|
| Largest Holdings [Text Block] |
Top 10 Holdings (% of net assets)Table SummaryHolding Name | % of Net Assets |
|---|
Broadcom, Inc. | 7.6% |
|---|
JPMorgan Chase & Company | 3.2% |
|---|
Exxon Mobil Corporation | 3.0% |
|---|
Mitsubishi UFJ Financial Group, Inc. | 2.7% |
|---|
Johnson & Johnson | 2.4% |
|---|
Walmart, Inc. | 2.3% |
|---|
HSBC Holdings PLC | 2.3% |
|---|
Sony Group Corporation | 2.0% |
|---|
Novartis A.G. | 1.8% |
|---|
Chevron Corporation | 1.6% |
|---|
|
|
| Material Fund Change [Text Block] |
No material changes occurred during the period ended March 31, 2026. |
|
| C000253499 |
|
|
| Shareholder Report [Line Items] |
|
|
| Fund Name |
NAA World Equity Income Fund
|
|
| Trading Symbol |
SEWIX
|
|
| Annual or Semi-Annual Statement [Text Block] |
This semi-annual shareholder report contains important information about NAA World Equity Income Fund for the period of October 1, 2025 to March 31, 2026.
|
|
| Additional Information [Text Block] |
You can find additional information about the Fund at www.naafunds.com. You can also request this information by contacting us at 833-840-3937.
|
|
| Additional Information Phone Number |
833-840-3937
|
|
| Additional Information Website |
www.naafunds.com
|
|
| Expenses [Text Block] |
What were the Fund’s costs for the last six months?(based on a hypothetical $10,000 investment) Table SummaryClass Name | Costs of a $10,000 investment | Costs paid as a percentage of a $10,000 investment |
|---|
Institutional | $47 | 0.92%Footnote Reference* |
|---|
| Footnote | Description | Footnote* | Annualized |
|
|
| Expenses Paid, Amount |
$ 47
|
|
| Expense Ratio, Percent |
0.92%
|
[25] |
| AssetsNet |
$ 46,258,350
|
|
| Holdings Count | Holding |
173
|
|
| Advisory Fees Paid, Amount |
$ 98,792
|
|
| InvestmentCompanyPortfolioTurnover |
27.00%
|
|
| Additional Fund Statistics [Text Block] |
- Net Assets$46,258,350
- Number of Portfolio Holdings173
- Advisory Fee $98,792
- Portfolio Turnover27%
|
|
| Holdings [Text Block] |
Asset Weighting (% of total investments)Table SummaryValue | Value |
|---|
Common Stocks | 98.5% | Exchange-Traded Funds | 1.5% | Country Weighting (% of net assets)Table SummaryValue | Value |
|---|
Other Assets in Excess of Liabilities | 0.9% | Other Countries | 5.7% | Spain | 1.8% | Sweden | 1.9% | Ireland | 2.1% | Germany | 3.6% | France | 4.8% | Canada | 5.3% | United Kingdom | 5.6% | Switzerland | 6.0% | Japan | 10.1% | United States | 52.2% | Country weightings within this Tailored Shareholder Report (TSR) are based on the country of risk provided by ICE, the pricing vendor, at the time the security is set up |
|
| Largest Holdings [Text Block] |
Top 10 Holdings (% of net assets)Table SummaryHolding Name | % of Net Assets |
|---|
Broadcom, Inc. | 7.6% |
|---|
JPMorgan Chase & Company | 3.2% |
|---|
Exxon Mobil Corporation | 3.0% |
|---|
Mitsubishi UFJ Financial Group, Inc. | 2.7% |
|---|
Johnson & Johnson | 2.4% |
|---|
Walmart, Inc. | 2.3% |
|---|
HSBC Holdings PLC | 2.3% |
|---|
Sony Group Corporation | 2.0% |
|---|
Novartis A.G. | 1.8% |
|---|
Chevron Corporation | 1.6% |
|---|
|
|
| Material Fund Change [Text Block] |
No material changes occurred during the period ended March 31, 2026. |
|
|
|