Exhibit 96.1
 |  |
DATE AND SIGNATURE PAGE
This report titled “S-K 1300 Technical Report Summary on the Songwe Hill Rare Earth Element Project in Malawi” dated 5 June 2026 was prepared and signed by:
| /s/ Christoff Badenhorst | ||
| (Signed) SENET, a DRA Global Group Company | ||
| Dated at Location | ||
| 08-Jun-2026 | Mr. Christoff Badenhorst, Managing Director of SENET, a DRA Global Group Company | |
| /s/ Scott Swinden | ||
| (Signed) Swinden Geoscience Consultants Ltd | ||
| Dated at Location | ||
| 05-Jun-2026 | Swinden Geoscience Consultants Ltd | |
| /s/ Jeremy Witley | ||
| (Signed) The MSA Group | ||
| Dated at Location | ||
| 06-Jun-2026 | The MSA Group (Pty) Ltd | |
| /s/ Clive Brown | ||
| (Signed) Bara Consulting (Pty) Ltd. | ||
| Dated at Location | ||
| 08-Jun-2026 | Bara Consulting (Pty) Ltd. | |
| /s/ Graham Trusler | ||
| (Signed) Digby Wells Environmental | ||
| Dated at Location | ||
| 08-Jun-2026 | Digby Wells Environmental | |
| /s/ Guy Wiid | ||
| (Signed) Epoch Resources (Pty) Ltd. | ||
| Dated at Location | ||
| 05-Jun-2026 | Epoch Resources (Pty) Ltd. | |
| /s/ Trevor Mills | ||
| (Signed) Dahrouge Geological Consultant USA LTD. | ||
| Dated at Location | ||
| 05-Jun-2026 | Dahrouge Geological Consultant USA Ltd. |
| S-K 1300 Technical Report Summary on the Songwe Hill REE Project | Page 2 of 489 |
| |
TABLE OF CONTENTS
| 1 | Executive Summary | 27 | ||
| 1.1 | Introduction | 27 | ||
| 1.2 | Property Description | 28 | ||
| 1.3 | Geology and Mineralisation | 29 | ||
| 1.4 | Status of Exploration | 29 | ||
| 1.5 | Mineral Resource Estimate | 30 | ||
| 1.6 | Development And Operations | 32 | ||
| 1.6.1 | Mining Methods | 32 | ||
| 1.6.2 | Mining Geotechnical Study | 32 | ||
| 1.6.3 | Pit Optimisation | 34 | ||
| 1.6.4 | Mine Design and Schedule | 35 | ||
| 1.6.5 | Mining Operations | 38 | ||
| 1.6.6 | Waste Dump and Stockpiles | 38 | ||
| 1.7 | Mineral Reserve Estimate | 39 | ||
| 1.8 | Recovery Methods | 39 | ||
| 1.8.1 | Concentrator | 39 | ||
| 1.8.2 | Process Water Distribution | 41 | ||
| 1.8.3 | Hydrometallurgical Plant | 41 | ||
| 1.9 | Capital and Operating Costs | 43 | ||
| 1.9.1 | Capital Costs | 43 | ||
| 1.9.2 | Operating Costs | 45 | ||
| 1.10 | Market Studies and Contracts | 46 | ||
| 1.10.1 | Rare Earth Market Outlook | 46 | ||
| 1.10.2 | Forecasted TREO Demand by End-Use Category | 47 | ||
| 1.10.3 | Rare Earth Price Forecasts | 49 | ||
| 1.11 | Economic Analysis | 51 | ||
| 1.11.1 | Capital and Operating Costs | 53 | ||
| 1.11.2 | Discounted Cash Flow Valuation Analysis | 54 | ||
| 1.11.3 | Sensitivity Analysis | 55 | ||
| 1.12 | Conclusions | 57 | ||
| 1.13 | Recommendations | 59 | ||
| 2 | Introduction | 62 | ||
| 2.1 | Qualified Persons and Their Contributions | 62 | ||
| 2.2 | Qualified Persons’ Personal Inspection of the Property | 68 | ||
| 3 | Property Description | 71 | ||
| 3.1 | Location | 71 | ||
| 3.2 | Mineral Tenure, Permitting, Rights and Agreements | 72 | ||
| 3.2.1 | Retention Licences in Malawi | 72 | ||
| 3.2.2 | Retention Licence RTL 0001/21 | 72 | ||
| 3.2.3 | General Provisions | 74 | ||
| 3.2.4 | Overlapping Licences | 75 | ||
| 3.3 | Environmental Liabilities | 75 | ||
| 4 | Accessibility, Climate, Local Resources, Infrastructure and Physiography | 76 | ||
| 4.1 | Accessibility | 76 | ||
| S-K 1300 Technical Report Summary on the Songwe Hill REE Project | Page 3 of 489 |
| |
| 4.2 | Climate and Meteorological Overview | 76 | ||
| 4.2.1 | Wind Speed and Direction | 76 | ||
| 4.2.2 | Temperature | 77 | ||
| 4.2.3 | Relative Humidity | 78 | ||
| 4.2.4 | Precipitation | 78 | ||
| 4.3 | Physiography | 79 | ||
| 4.4 | Local Resources and Infrastructure | 80 | ||
| 5 | History | 81 | ||
| 5.1 | Ownership History | 81 | ||
| 5.2 | Historical Exploration | 81 | ||
| 5.2.1 | Pre-1981 Programmes | 81 | ||
| 5.2.2 | Post-1981 Programmes | 82 | ||
| 6 | Geological Setting, Mineralisation, and Deposit | 84 | ||
| 6.1 | Geological Setting | 84 | ||
| 6.1.1 | Regional Geology | 84 | ||
| 6.1.2 | Geology of the Songwe Hill Carbonatite Complex | 86 | ||
| 6.1.3 | Geological/Geochemical Modelling of the Songwe Hill Complex | 98 | ||
| 6.2 | Mineralisation | 102 | ||
| 6.2.1 | Mineralogy | 103 | ||
| 6.2.2 | Genetic Model for REE Mineralisation | 106 | ||
| 6.3 | Deposit | 107 | ||
| 7 | Exploration | 110 | ||
| 7.1 | Litho-Geochemical Sampling | 110 | ||
| 7.2 | Ground Geophysical Programme | 113 | ||
| 7.2.1 | Magnetic Survey | 114 | ||
| 7.2.2 | Radiometric Survey | 115 | ||
| 7.2.3 | Gravity Survey | 116 | ||
| 7.2.4 | NSAMT Survey | 117 | ||
| 7.2.5 | IP Survey | 119 | ||
| 7.3 | Geological Mapping | 121 | ||
| 7.4 | Surface Channel Sampling | 121 | ||
| 7.5 | Bulk Sampling | 124 | ||
| 7.6 | Research Programmes | 126 | ||
| 7.7 | Drilling | 126 | ||
| 7.7.1 | Historical Diamond Drilling (1988) | 126 | ||
| 7.7.2 | Phase 1 (2011), Phase 2 (2012) and Phase 3 (2018) Diamond Drilling | 127 | ||
| 7.7.3 | Core Recovery | 129 | ||
| 7.7.4 | Collar Surveys | 129 | ||
| 7.7.5 | Downhole Surveys | 130 | ||
| 7.7.6 | Drillhole Programme Management | 131 | ||
| 7.7.7 | Results of the Drilling Programmes | 132 | ||
| 7.7.8 | Hydrogeology | 135 | ||
| 7.7.9 | Geotechnical | 135 | ||
| 8 | Sample Preparation, Analyses, and Security | 136 | ||
| 8.1 | Sample Preparation | 136 | ||
| 8.1.1 | Core Handling | 136 | ||
| 8.1.2 | Core Logging | 136 | ||
| 8.1.3 | Core Sampling | 137 | ||
| 8.1.4 | Density Measurements | 139 | ||
| S-K 1300 Technical Report Summary on the Songwe Hill REE Project | Page 4 of 489 |
| |
| 8.2 | Sample Analyses | 139 | ||
| 8.2.1 | Primary Laboratory | 139 | ||
| 8.2.2 | Verification (Umpire) Laboratory | 140 | ||
| 8.3 | Sample Security and Dispatch | 141 | ||
| 8.4 | Quality Assurance and Quality Control | 142 | ||
| 8.4.1 | Phase 1 and Phase 2 Blank Samples | 143 | ||
| 8.4.2 | Phase 1 and Phase 2 Certified Reference Material | 144 | ||
| 8.4.3 | Phase 1 and Phase 2 Duplicates | 144 | ||
| 8.4.4 | Phase 1 and Phase 2 Umpire Laboratory samples | 144 | ||
| 8.4.5 | Phase 3 Blank Samples | 144 | ||
| 8.4.6 | Phase 3 Certified Reference Materials | 146 | ||
| 8.4.7 | Phase 3 Duplicate Samples | 147 | ||
| 8.4.8 | Phase 3 Umpire Sample Assays | 148 | ||
| 8.5 | Adequacy of Sample Preparation, Security and Analytical Procedures | 148 | ||
| 9 | Data Verification | 150 | ||
| 10 | Mineral Processing and Metallurgical Testing | 151 | ||
| 10.1 | Early Test Work (2010 to 2018) | 151 | ||
| 10.1.1 | Mineral Processing and Metallurgical Testing Overview | 151 | ||
| 10.1.2 | Early Test Work and PFS | 152 | ||
| 10.1.3 | Test Work for DFS | 152 | ||
| 10.1.4 | Mineralogical Analysis by ALS | 152 | ||
| 10.1.5 | Flotation Testing by KYSPYmet | 152 | ||
| 10.1.6 | Bulk Sampling and Variability Testing | 152 | ||
| 10.1.7 | Ore Variability Test Work by ALS | 152 | ||
| 10.1.8 | Grinding Solutions Comparison | 153 | ||
| 10.1.9 | Pilot-Plant Test Work Overview | 153 | ||
| 10.1.10 | Hydrometallurgical Test Work by ANSTO | 154 | ||
| 10.1.11 | Rare Earth Leach and Solution Purification | 154 | ||
| 10.1.12 | Rare Earth Carbonate Precipitation | 154 | ||
| 10.1.13 | Solid-Liquid Separation and Tailings Testing | 155 | ||
| 10.1.14 | Classification of Type 2 Material | 155 | ||
| 10.1.15 | Geochemical Testing Overview | 155 | ||
| 10.2 | Test Work used for the 2022 DFS | 155 | ||
| 10.2.1 | ALS | 155 | ||
| 10.2.2 | Grinding Solutions (2019) – IsaMill versus SMD Signature Plots | 161 | ||
| 10.2.3 | Keramos (2020) | 161 | ||
| 10.2.4 | ALS Comminution and Flotation Piloting | 161 | ||
| 10.2.5 | ANSTO Hydrometallurgical Test Work | 163 | ||
| 10.2.6 | Solid-Liquid Separation Test Work | 167 | ||
| 10.3 | QP Opinion | 170 | ||
| 11 | Mineral Resource Estimates | 171 | ||
| 11.1 | Mineral Resource Estimation Database | 171 | ||
| 11.2 | Exploratory Analysis of the Raw Data | 172 | ||
| 11.2.1 | Attributes | 172 | ||
| 11.2.2 | Validation of the Data | 172 | ||
| 11.2.3 | Statistics of the Sample Data | 173 | ||
| S-K 1300 Technical Report Summary on the Songwe Hill REE Project | Page 5 of 489 |
| |
| 11.3 | Geological Modelling | 174 | ||
| 11.3.1 | Topography | 174 | ||
| 11.3.2 | Mineralised Zones | 174 | ||
| 11.4 | Statistical Analysis of the Composite Data | 175 | ||
| 11.4.1 | Cutting and Capping | 177 | ||
| 11.5 | Geostatistical Analysis | 177 | ||
| 11.5.1 | Semi-Variograms | 177 | ||
| 11.5.2 | Indicator Semi-Variograms | 180 | ||
| 11.5.3 | Kriging Neighbourhood Analysis | 180 | ||
| 11.6 | Block Modelling | 181 | ||
| 11.7 | Estimation | 181 | ||
| 11.8 | Validation of the Estimates | 184 | ||
| 11.9 | Mineral Resource Classification | 186 | ||
| 11.10 | Assessment of reasonable prospects for economic extraction | 188 | ||
| 11.11 | Mineral Resource Tabulation | 191 | ||
| 11.11.1 | Exclusive Mineral Resource | 191 | ||
| 11.11.2 | Inclusive Mineral Resource | 197 | ||
| 12 | Mineral Reserve Estimates | 202 | ||
| 12.1 | Mining Limits | 202 | ||
| 12.2 | Geological Data for Mine Design | 202 | ||
| 12.3 | Pit Optimisation | 202 | ||
| 12.3.1 | Material Definition | 202 | ||
| 12.3.2 | Optimisation Parameters | 206 | ||
| 12.3.3 | Results of Pit Optimisation | 208 | ||
| 12.4 | Pit Design | 215 | ||
| 12.4.1 | Pit Design Overview | 215 | ||
| 12.4.2 | Design Criteria | 217 | ||
| 12.4.3 | Ultimate Pit Design Volumes | 218 | ||
| 12.4.4 | Mining Modifying Factors | 219 | ||
| 12.5 | Mineral Reserve Statement | 220 | ||
| 12.6 | Mineral Reserve Reconciliation | 223 | ||
| 13 | Mining Methods | 224 | ||
| 13.1 | Mining Overview | 224 | ||
| 13.2 | Mining Geotechnical Evaluation | 224 | ||
| 13.2.1 | Hydrogeology | 225 | ||
| 13.2.2 | Seismicity | 225 | ||
| 13.2.3 | Geotechnical Data Acquisition | 225 | ||
| 13.2.4 | Geotechnical Characterisation | 228 | ||
| 13.2.5 | Slope Engineering | 238 | ||
| 13.3 | Mine Operation | 245 | ||
| 13.3.1 | Drill and Blast | 246 | ||
| 13.3.2 | Load and Haul | 247 | ||
| 13.3.3 | Technical Services | 248 | ||
| 13.4 | In-Pit Services | 249 | ||
| 13.4.1 | Dewatering | 249 | ||
| 13.4.2 | Lighting | 252 | ||
| 13.5 | Waste ROCK Dump and Stockpiles | 252 | ||
| 13.5.1 | Description | 252 | ||
| 13.5.2 | Rehabilitation and Closure | 255 | ||
| S-K 1300 Technical Report Summary on the Songwe Hill REE Project | Page 6 of 489 |
| |
| 13.6 | Mine Scheduling | 255 | ||
| 13.6.1 | Schedule Parameters | 255 | ||
| 13.6.2 | Production Requirements | 255 | ||
| 13.6.3 | Mining Sequence | 257 | ||
| 13.7 | Mining Equipment | 259 | ||
| 13.8 | Manpower | 260 | ||
| 14 | Processing and Recovery Methods | 263 | ||
| 14.1 | Overview | 263 | ||
| 14.2 | Process Description | 266 | ||
| 14.2.1 | Introduction | 266 | ||
| 14.2.2 | Crushing | 267 | ||
| 14.2.3 | Ball Milling | 268 | ||
| 14.2.4 | Fine Grinding | 268 | ||
| 14.2.5 | Flotation | 268 | ||
| 14.2.6 | Concentrate Thickening | 272 | ||
| 14.2.7 | Concentrate Filtration | 272 | ||
| 14.2.8 | Tailings Thickening | 273 | ||
| 14.2.9 | Tailings Storage and Return Water | 273 | ||
| 14.2.10 | Reagents | 274 | ||
| 14.2.11 | Grinding Media | 276 | ||
| 14.2.12 | Air Services | 277 | ||
| 14.2.13 | Water Services | 277 | ||
| 14.2.14 | Gangue Leach | 279 | ||
| 14.2.15 | Caustic Conversion | 279 | ||
| 14.2.16 | Cerium Oxidation | 280 | ||
| 14.2.17 | Rare Earth Leach | 280 | ||
| 14.2.18 | PLS Purification | 281 | ||
| 14.2.19 | Uranium Ion Exchange | 282 | ||
| 14.2.20 | Rare Earth Precipitation | 282 | ||
| 14.2.21 | Hydrometallurgical Tails Neutralisation | 283 | ||
| 14.2.22 | Gangue Leach Liquor Purification | 283 | ||
| 14.2.23 | Hydrochloric Acid Regeneration | 284 | ||
| 14.2.24 | Sodium Hydroxide Evaporation | 284 | ||
| 14.2.25 | Causticisation | 285 | ||
| 14.2.26 | Off-Gas Scrubbing | 286 | ||
| 14.2.27 | Lime | 286 | ||
| 14.2.28 | Purification Reagents 1 – Sodium Sulphide | 286 | ||
| 14.2.29 | Purification Reagents 2 – Barium Chloride and Calcium Sulphate | 286 | ||
| 14.2.30 | Ammonium Bicarbonate | 287 | ||
| 14.2.31 | Calcium Chloride | 287 | ||
| 14.2.32 | Steam | 287 | ||
| 14.2.33 | Air Services | 287 | ||
| 14.2.34 | Process Water | 288 | ||
| 14.2.35 | Potable Water | 288 | ||
| 14.3 | QP Opinion | 288 | ||
| 15 | Infrastructure | 289 | ||
| 15.1 | Project On-Site Infrastructure – Process Plant | 289 | ||
| 15.1.1 | Earthworks | 291 | ||
| S-K 1300 Technical Report Summary on the Songwe Hill REE Project | Page 7 of 489 |
| |
| 15.1.2 | Civil Works | 292 | ||
| 15.1.3 | Plant Buildings | 293 | ||
| 15.1.4 | Process Plant Site Drainage | 293 | ||
| 15.1.5 | Sewage Disposal | 294 | ||
| 15.1.6 | Security | 294 | ||
| 15.1.7 | Water Supply | 294 | ||
| 15.1.8 | Power Supply | 295 | ||
| 15.1.9 | Communications (IT Network) | 300 | ||
| 15.2 | Project On-Site Infrastructure – Mining | 300 | ||
| 15.2.1 | Mining Staff Complement | 301 | ||
| 15.2.2 | Offices for Management and Operations | 301 | ||
| 15.2.3 | Mine Workshop and Vehicle Servicing | 301 | ||
| 15.2.4 | Diesel Storage | 302 | ||
| 15.2.5 | Explosives Magazine Storage | 302 | ||
| 15.2.6 | Potable Water | 302 | ||
| 15.2.7 | Other Supporting Infrastructure | 302 | ||
| 15.2.8 | Wastewater | 302 | ||
| 15.2.9 | Power Supply and Reticulation | 302 | ||
| 15.2.10 | Storm Water Management | 303 | ||
| 15.2.11 | Haul Roads | 303 | ||
| 15.3 | Project Off-Site Infrastructure | 305 | ||
| 15.3.1 | Site Location and Accessibility | 305 | ||
| 15.3.2 | Camp and Catering Facilities | 306 | ||
| 15.3.3 | Medical Facilities | 307 | ||
| 15.3.4 | PV Power Plants | 307 | ||
| 15.3.5 | Diesel Fuel Storage | 307 | ||
| 15.3.6 | Communication | 307 | ||
| 15.3.7 | Water Supply System | 307 | ||
| 15.3.8 | Sewage Disposal | 307 | ||
| 15.4 | Tailings Storage Facility | 308 | ||
| 15.4.1 | Introduction | 308 | ||
| 15.4.2 | Design Criteria and Project Information | 308 | ||
| 15.4.3 | Characterisation of the Tailings | 309 | ||
| 15.4.4 | Geochemical Characterisation of the Waste Rock Material | 313 | ||
| 15.4.5 | Site Selection | 313 | ||
| 15.4.6 | Geotechnical Investigation | 315 | ||
| 15.4.7 | Tailings Storage Facility Design | 315 | ||
| 15.4.8 | Slope Stability Analyses | 323 | ||
| 15.5 | Logistics | 323 | ||
| 15.5.1 | Routing | 325 | ||
| 15.5.2 | Port Facilities | 327 | ||
| 15.5.3 | Summary of Findings | 328 | ||
| 15.5.4 | Consultants’ Recommendations | 328 | ||
| 15.5.5 | Charter Aircraft and Airfreight | 329 | ||
| 15.5.6 | Project Cargo | 330 | ||
| 15.6 | QP Opinion | 330 | ||
| 16 | Market Studies | 331 | ||
| 16.1 | Rare Earth Market Outlook | 331 | ||
| 16.1.1 | REEs: Critical Enablers of Electric Mobility, Automation and Energy Efficiency | 331 | ||
| S-K 1300 Technical Report Summary on the Songwe Hill REE Project | Page 8 of 489 |
| |
| 16.1.2 | Classification and Terminology | 331 | ||
| 16.1.3 | Rarely Enriched in Nature | 332 | ||
| 16.1.4 | Historical Production | 333 | ||
| 16.1.5 | Eight End-Use Categories | 334 | ||
| 16.1.6 | Global Rare Earth Consumption in 2024 | 335 | ||
| 16.1.7 | Rare Earth Balance Problem | 336 | ||
| 16.1.8 | Implications of the Balance Problem | 337 | ||
| 16.1.9 | Forecasted TREO Demand by End-Use Category | 337 | ||
| 16.1.10 | NdFeB Permanent Magnets: Enablers of Modern Technology | 338 | ||
| 16.1.11 | Forecasted TREO Demand for Permanent Magnets by End-Use Category | 339 | ||
| 16.1.12 | EVs, Robotics, AAM, and Energy Efficient Applications to Drive 76 % of Demand by 2040 | 341 | ||
| 16.1.13 | Forecasted Production – Demand Balance for NdPr Oxide to 2040 | 341 | ||
| 16.1.14 | Forecasted REO Prices to 2040 | 342 | ||
| 16.1.15 | Forecasted per-REO Contribution to Songwe Hill Project Basket Value | 343 | ||
| 16.1.16 | Forecasted Basket Value and Implications for Project | 344 | ||
| 16.1.17 | Forecasted Value of Songwe Hill Mixed Rare Earth Carbonate | 345 | ||
| 16.1.18 | International Supply Chain Development | 346 | ||
| 16.1.19 | Current State of the Market and Near-Term Outlook | 348 | ||
| 16.1.20 | Adoption of Ex-China Price Floors Adds Potential for Additional Upside | 349 | ||
| 16.1.21 | Key Takeaways | 350 | ||
| 16.2 | QP Opinion | 351 | ||
| 17 | Environmental Studies, Permitting, and Plans, Negotiations, or Agreements with local Individuals or Groups | 352 | ||
| 17.1 | Legal Framework | 352 | ||
| 17.1.1 | Malawian Legislation | 352 | ||
| 17.1.2 | Licences Required for the Project | 356 | ||
| 17.1.3 | International Guidelines and Standards | 357 | ||
| 17.2 | Surface Water | 358 | ||
| 17.2.1 | Hydrological Units | 358 | ||
| 17.2.2 | Water Quality | 358 | ||
| 17.2.3 | Flood Line Modelling | 359 | ||
| 17.3 | Groundwater | 359 | ||
| 17.3.1 | Groundwater Occurrence | 359 | ||
| 17.3.2 | Groundwater Levels | 360 | ||
| 17.3.3 | Water Quality | 360 | ||
| 17.4 | Geochemistry | 360 | ||
| 17.4.1 | Tailings | 361 | ||
| 17.4.2 | Waste Rock | 362 | ||
| 17.4.3 | Barren Liquid | 362 | ||
| 17.5 | Terrestrial Biodiversity | 362 | ||
| 17.5.1 | Flora | 362 | ||
| 17.5.2 | Fauna | 363 | ||
| S-K 1300 Technical Report Summary on the Songwe Hill REE Project | Page 9 of 489 |
| |
| 17.6 | Wetlands and Aquatic Biodiversity | 364 | ||
| 17.7 | Soils and Land Use | 364 | ||
| 17.8 | Radiation | 365 | ||
| 17.8.1 | Radiological Baseline | 365 | ||
| 17.8.2 | Public Radiation Protection | 366 | ||
| 17.9 | Cultural Heritage | 367 | ||
| 17.10 | Social and Community Health | 368 | ||
| 17.10.1 | Socio-Economic Profile | 368 | ||
| 17.10.2 | Health | 369 | ||
| 17.10.3 | Socio-Economic Activities | 369 | ||
| 17.10.4 | Resettlement | 369 | ||
| 17.11 | Stakeholder Engagement | 371 | ||
| 17.12 | Potential Environmental Impacts | 371 | ||
| 17.13 | Cumulative Impacts | 372 | ||
| 17.14 | Environmental Management and Recommendations | 373 | ||
| 17.14.1 | Management of Impacts and Issues | 373 | ||
| 17.14.2 | Rehabilitation and Closure Planning | 374 | ||
| 17.14.3 | Environmental, Social and Health Management Plan | 377 | ||
| 17.15 | Waste Management | 377 | ||
| 17.15.1 | Tailings | 377 | ||
| 17.15.2 | Waste Rock Dump | 378 | ||
| 17.15.3 | Type 2 Material Stockpile | 379 | ||
| 17.15.4 | General Waste | 379 | ||
| 17.15.5 | Management Measures | 380 | ||
| 18 | Capital and Operating Costs | 382 | ||
| 18.1 | Capital Costs | 382 | ||
| 18.1.1 | Responsibilities | 382 | ||
| 18.1.2 | Escalation | 382 | ||
| 18.1.3 | Exclusions | 382 | ||
| 18.1.4 | Exchange Rates | 382 | ||
| 18.1.5 | Scope of the Estimate | 383 | ||
| 18.1.6 | Summary of Total CAPEX | 383 | ||
| 18.1.7 | Basis of Estimate, Assumptions and Exclusions | 384 | ||
| 18.1.8 | Mining Capital Costs | 387 | ||
| 18.1.9 | Process Plant and Infrastructure Capital Costs | 391 | ||
| 18.1.10 | Main Contracts | 391 | ||
| 18.1.11 | Supply-Only Contracts | 394 | ||
| 18.1.12 | Supply and Install Contracts | 397 | ||
| 18.1.13 | Engineering, Procurement and Construction Management (EPCM) | 399 | ||
| 18.1.14 | First Fills | 399 | ||
| 18.1.15 | Contingency | 400 | ||
| 18.1.16 | Vendor Services | 400 | ||
| 18.1.17 | Freight | 400 | ||
| 18.1.18 | Power Plant | 401 | ||
| 18.1.19 | Fuel Supply Depot | 401 | ||
| 18.1.20 | Spares | 402 | ||
| 18.1.21 | Insurances | 402 | ||
| 18.1.22 | TSF Costs | 402 | ||
| S-K 1300 Technical Report Summary on the Songwe Hill REE Project | Page 10 of 489 |
| |
| 18.1.23 | Other Supporting Infrastructure and Equipment Costs | 404 | ||
| 18.1.24 | Raw Water Management and Supply | 404 | ||
| 18.1.25 | Pit Dewatering | 405 | ||
| 18.1.26 | Plant Access and Haul Roads | 405 | ||
| 18.1.27 | Plant Support and Operational Vehicles | 406 | ||
| 18.1.28 | Owner’s Pre-Production Costs | 406 | ||
| 18.1.29 | Pre-Production Labour | 407 | ||
| 18.1.30 | Other Pre-Production Costs | 407 | ||
| 18.1.31 | Working Capital | 407 | ||
| 18.1.32 | Environmental Management: Resettlement Costing and Rehabilitation and Closure Costs | 407 | ||
| 18.1.33 | Closure Framework and Objectives | 409 | ||
| 18.1.34 | Environmental and Social Forward Works Plan | 410 | ||
| 18.1.35 | Currency Split | 410 | ||
| 18.1.36 | Countries of Origin for Procurement Packages | 411 | ||
| 18.1.37 | Capital Cost Outflow Forecast | 415 | ||
| 18.2 | Operating Costs | 416 | ||
| 18.2.1 | Summary of Operating Costs | 416 | ||
| 18.2.2 | Exchange Rates | 418 | ||
| 18.2.3 | Escalation | 418 | ||
| 18.2.4 | Exclusions | 418 | ||
| 18.2.5 | Mining Operating Costs | 418 | ||
| 18.2.6 | Process Plant Operating Costs | 422 | ||
| 18.2.7 | TSF Operating Costs | 434 | ||
| 19 | Economic Analysis | 435 | ||
| 19.1 | Cautionary Statement | 435 | ||
| 19.2 | Overview | 435 | ||
| 19.3 | Sale of Gypsum By-Product | 436 | ||
| 19.4 | Rare Earth Price Assumptions | 437 | ||
| 19.5 | Malawian Fiscal Regime | 437 | ||
| 19.6 | Mineral Resource and Mineral Reserve Estimates | 440 | ||
| 19.7 | Mining and Processing Assumptions | 441 | ||
| 19.8 | Capital and Operating Costs | 443 | ||
| 19.9 | Discounted Cash Flow Valuation Analysis | 444 | ||
| 19.10 | Sensitivity Analysis | 445 | ||
| 19.11 | Free Cash Flow Forecasts | 448 | ||
| 19.12 | Conclusions | 451 | ||
| 20 | Adjacent Properties | 452 | ||
| 21 | Other Relevant Data and Information | 452 | ||
| 21.1 | Project Schedule | 452 | ||
| 21.1.1 | Schedule Basis – Source Information | 452 | ||
| 21.1.2 | Schedule Levels and Structure | 452 | ||
| 21.1.3 | Project Key Dates/Milestones | 452 | ||
| 21.1.4 | Long-Lead Equipment | 453 | ||
| 21.1.5 | Project Execution Schedule Summary | 454 | ||
| 21.1.6 | Schedule Assumptions | 455 | ||
| 21.1.7 | Rainfall | 455 | ||
| S-K 1300 Technical Report Summary on the Songwe Hill REE Project | Page 11 of 489 |
| |
| 21.2 | Risks | 455 | ||
| 21.2.1 | General Risks | 456 | ||
| 21.2.2 | Mineral Resource Risks | 458 | ||
| 21.2.3 | Mining Risks | 459 | ||
| 21.2.4 | Process Plant Risks | 460 | ||
| 21.2.5 | TSF Risks | 461 | ||
| 21.2.6 | Sustainable Development Risks | 462 | ||
| 21.3 | Opportunities | 466 | ||
| 21.3.1 | Caustic Bleed Stream Reduction Opportunity | 467 | ||
| 21.3.2 | Wind Energy Opportunity | 479 | ||
| 21.3.3 | Proposed Puławy Separation Project Opportunity | 470 | ||
| 21.4 | Human Resource Element | 472 | ||
| 21.4.1 | Introduction | 472 | ||
| 21.4.2 | Overall Mine Management Structure | 472 | ||
| 21.4.3 | Department Structure | 474 | ||
| 22 | Interpretation and Conclusions | 475 | ||
| 22.1 | Mineral Resource | 475 | ||
| 22.2 | Mineral Reserve | 477 | ||
| 22.3 | Environmental | 477 | ||
| 23 | Recommendations | 479 | ||
| 23.1 | Geology | 479 | ||
| 23.2 | mineral Resources | 479 | ||
| 23.3 | Environmental and Social Studies, Plans and Resettlement | 479 | ||
| 23.4 | Infrastructure | 480 | ||
| 23.4.1 | Project Site Infrastructure – Process Plant | 480 | ||
| 23.4.2 | Project Off-Site Infrastructure | 480 | ||
| 23.4.3 | TSF | 481 | ||
| 23.5 | Operating Costs | 481 | ||
| 23.6 | QP Opinion | 481 | ||
| 24 | References | 482 | ||
| 25 | Reliance on Information Provided by the Registrant | 489 | ||
| S-K 1300 Technical Report Summary on the Songwe Hill REE Project | Page 12 of 489 |
| |
| LIST OF TABLES | |
| Table 1.1: Songwe Hill, Exclusive Mineral Resources above 0.55 % TREO Grade, 30 June 2025 | 31 |
| Table 1.2: Songwe Hill, Inclusive Mineral Resources above 0.55 % TREO Grade, 30 June 2025 | 32 |
| Table 1.3: Summary of Slope Configurations | 33 |
| Table 1.4: Pit Optimisation Input Parameters | 34 |
| Table 1.5: Mining Inventory from Pit | 37 |
| Table 1.6: Mineral Reserve Summary as at 30 April 2025 | 39 |
| Table 1.7: Initial/Development CAPEX Summary | 43 |
| Table 1.8: Sustaining CAPEX Summary | 44 |
| Table 1.9: Five Years of Production OPEX Summary | 45 |
| Table 1.10: Summary of Mining and Processing Inputs and Results – Average over First Five Years | 52 |
| Table 1.11: Summary of Mining and Processing Inputs and Results – LOO | 52 |
| Table 1.12: Summary of Mining and Processing Inputs and Results – Total LOO | 53 |
| Table 1.13: Capital Costs | 53 |
| Table 1.14: Operating Costs – Average over First Five Years | 54 |
| Table 1.15: Operating Costs – Average over LOO | 54 |
| Table 1.16: Summary of Selected Financial Inputs and Corresponding Results – Post-Tax Valuation | 54 |
| Table 1.17: NPVs of Songwe Hill Project1 | 55 |
| Table 1.18: Songwe Hill, Exclusive Mineral Resources above 0.55 % TREO Grade, 30 June 2025 | 57 |
| Table 1.19: Songwe Hill, Inclusive Mineral Resources above 0.55 % TREO Grade, 30 June 2025 | 58 |
| Table 1.20: Mineral Reserve Summary as at 30 April 2025 | 58 |
| Table 2.1: Qualified Persons and Their Contributions | 63 |
| Table 2.2: QP Site Inspection Details – DRA SENET | 67 |
| Table 2.3: QP Site Inspection Details – MSA | 68 |
| Table 2.4: QP Site Inspection Details – Digby Wells | 68 |
| Table 2.5: QP Site Inspection Details – Bara | 69 |
| Table 2.6: QP Site Inspection Details – Epoch | 69 |
| Table 2.7: QP Site Inspection Details – Swinden | 69 |
| Table 3.1: History of Tenure of EPL 0284/10 and RTL0001/21 | 73 |
| Table 6.1: Average REO Distribution of Synchysite, Analysed by EMP, in Songwe Hill Carbonatites (Excluding Outliers) | 104 |
| Table 7.1: Average REO Distribution of Apatite, analysed by LA-ICP-MS, in Songwe Hill Carbonatites (Excluding Outliers) | 112 |
| Table 7.2: Summary of Assay Results for the Five Channel Sample Lines | 124 |
| Table 10.1: Recoveries from Concentrator Pilot Test Work | 153 |
| Table 10.2: Rare Earth Recoveries in the Hydrometallurgy Circuit | 154 |
| Table 10.3: Composite Pilot Feed Sample Characteristics | 161 |
| Table 10.4: Geochemical Testing Parameters | 169 |
| Table 11.1: Summary Statistics (De-Clustered) of the 2 m Composite Data | 175 |
| Table 11.2: Semi-Variogram Parameters – Carbonatite Domain, Songwe Hill | 178 |
| Table 11.3: Semi-Variogram Parameters – Non-Carbonatite Domain, Songwe Hill | 179 |
| Table 11.4: Indicator Semi-Variogram Parameters, Songwe Hill | 180 |
| Table 11.5: Block Model Prototype Parameters for Songwe Hill | 181 |
| Table 11.6: Search Parameters for the Carbonatite Domain, Songwe Hill – Ordinary Kriging | 182 |
| Table 11.7: Search Parameters for the Non-Carbonatite Domain, Songwe Hill – Ordinary Kriging | 183 |
| Table 11.8: Search Parameters for Songwe Hill – Indicator Model | 183 |
| Table 11.9: Pit Optimisation Input Parameters for Mineral Resource | 189 |
| Table 11.10: REO prices, in situ and Recovered Split used in Mineral Resource TREO Basket Price Calculation | 190 |
| Table 11.11: Songwe Hill, Exclusive Mineral Resources above 0.55 % TREO Grade, 30 June 2025 | 192 |
| S-K 1300 Technical Report Summary on the Songwe Hill REE Project | Page 13 of 489 |
| |
| Table 11.12: Songwe Hill, Exclusive Mineral Resources above 0.55 % TREO Grade within the Different Domains, 30 June 2025 | 193 |
| Table 11.13: Songwe Hill, Exclusive Measured and Indicated Mineral Resources Grade Tonnage, 30 June 2025 | 194 |
| Table 11.14: Songwe Hill, Exclusive Inferred Mineral Resources Grade Tonnage, 30 June 2025 | 195 |
| Table 11.15: Songwe Hill, Exclusive Mineral Resources, Individual REOs at 0.55 % (5,500 ppm) TREO Cut-Off Grade within the Different Domains, 30 June 2025 | 196 |
| Table 11.16: Songwe Hill, Inclusive Mineral Resources above 0.55 % TREO Grade, 30 June 2025 | 197 |
| Table 11.17: Songwe Hill, Inclusive Mineral Resources above 0.55 % TREO Grade within the Different Domains, 30 June 2025 | 198 |
| Table 11.18: Songwe Hill, Inclusive Measured and Indicated Mineral Resources Grade Tonnage, 30 June 2025 | 199 |
| Table 11.19: Songwe Hill, Inclusive Inferred Mineral Resources Grade Tonnage, 30 June 2025 | 200 |
| Table 11.20: Songwe Hill, Inclusive Mineral Resources, Individual REOs at 0.55 % (5,500 ppm) TREO Cut-Off Grade within the Different Domains, 30 June 2025 | 201 |
| Table 12.1: Block Model Statistics by Material Type | 203 |
| Table 12.2: Pit Optimisation Input Parameters | 206 |
| Table 12.3: TREO Prices used in Pit Optimisation for Mineral Reserve Estimate | 207 |
| Table 12.4: Material Contents of Pit Optimisation Shells | 210 |
| Table 12.5: Cut-Off Grade Scenarios Tested | 211 |
| Table 12.6: Results of the Cut-Off Grade Scenarios Tested | 211 |
| Table 12.7: Varying Cut-Off Grade Scenarios Tested | 211 |
| Table 12.8: Results of Two-Phased Pit Optimisation | 212 |
| Table 12.9: Legend for the Pit Shells | 213 |
| Table 12.10: Pit Design versus Specified Slope Angles | 217 |
| Table 12.11: Pit Design Versus Pit Optimisation Shell Comparison | 219 |
| Table 12.12: Mineral Reserve Summary as at 30 April 2025 | 220 |
| Table 12.13: Mineral Reserve Summary Showing Rare Earth Element Grades | 221 |
| Table 12.14: Sensitivity to Product Price | 222 |
| Table 12.15: Mineral Reserve Summary as at 31 December 2021 | 223 |
| Table 13.1: Geotechnical Parameters with Statistical Summary for All Domains | 229 |
| Table 13.2: Summary of UCS Results of All Rock Types | 230 |
| Table 13.3: Summary of Triaxial Compressive Strength Test Results for All Rock Types | 231 |
| Table 13.4: Shear Strength Properties of Rock Derived from TCS Test Results | 232 |
| Table 13.5: Statistical Summary of UTB Test Results | 233 |
| Table 13.6: Statistical Summary of BFA Test Results | 233 |
| Table 13.7: Discontinuity Shear Strength Parameters | 235 |
| Table 13.8: Summary of Discontinuity Sets for Songwe Hill | 237 |
| Table 13.9: Summary of Slope Configurations | 241 |
| Table 13.10: Drill and Blast Design | 246 |
| Table 13.11: Waste Rock and Ore Storage Facility Design Criteria | 252 |
| Table 13.12: Processing Tonnage and Grade | 256 |
| Table 13.13: Mining Inventory from Pit | 257 |
| Table 13.14: Mining Fleet Requirement for Year 3 | 260 |
| Table 13.15: Summary of Manpower Plan | 261 |
| S-K 1300 Technical Report Summary on the Songwe Hill REE Project | Page 14 of 489 |
| |
| Table 13.16: Summary of Manpower Categories by Employer | 262 |
| Table 14.1: Key Design Parameters | 263 |
| Table 15.1: Electrical Power Demand | 296 |
| Table 15.2: Diesel Generator Sets | 297 |
| Table 15.3: Solar PV Plant | 297 |
| Table 15.4: Installed Loads for Mining Infrastructure | 303 |
| Table 15.5: Haul Road Design Criteria | 304 |
| Table 15.6: Haul Road Layer Works | 305 |
| Table 15.7: Key TSF Design Parameters | 306 |
| Table 15.8: Tailings Streams | 310 |
| Table 15.9: Tailings Sample Components | 310 |
| Table 15.10: Material Parameters Adopted for the TSF Slope Stability Analyses | 311 |
| Table 15.11: Site Selection Aspects | 314 |
| Table 15.12: Recommended Design Parameters | 315 |
| Table 15.13: Key Parameters Associated with the TSF | 317 |
| Table 15.14: Staged Capacity of the TSF | 318 |
| Table 15.15: GISTM Flood Design Criteria | 323 |
| Table 15.16: Typical Planes and Payloads | 329 |
| Table 15.17: Number of Trucks | 330 |
| Table 17.1: Licences Required for the Project | 356 |
| Table 17.2: Alignment of the ESHIA with the IFC Performance Standards | 357 |
| Table 17.3: LOO Closure Scenario | 375 |
| Table 18.1: Exchange Rates | 382 |
| Table 18.2: Total CAPEX Summary | 383 |
| Table 18.3: Mining Infrastructure Capital Costs | 388 |
| Table 18.4: Summary of Direct Mining Capital Costs | 389 |
| Table 18.5: Summary of Indirect Capital Costs | 389 |
| Table 18.6: Capital Cost Summary | 389 |
| Table 18.7: Earthworks Quantities | 391 |
| Table 18.8: Civil Works Quantities | 393 |
| Table 18.9: Process Plant Steelwork Quantities | 395 |
| Table 18.10: First-Fill Cost Summary | 400 |
| Table 18.11: Project Electrical Power Demand | 401 |
| Table 18.12: CAPEX for the Songwe Hill TSF | 403 |
| Table 18.13: Plant Support and Operational Vehicles | 406 |
| Table 18.14: Closure Cost Summary | 408 |
| Table 18.15: Environmental and Social Forward Works Plan | 410 |
| Table 18.16: Currency Split | 410 |
| Table 18.17: Countries of Origin for Procurement Packages | 412 |
| Table 18.18: First Five Years of Production OPEX Summary | 416 |
| Table 18.19: Mining Contractor Rates for First Five-Year Mining Period | 420 |
| Table 18.20: Summary of Manpower Categories by Employer | 421 |
| Table 18.21: Mining Manpower OPEX | 422 |
| Table 18.22: Process Plant OPEX Summary | 422 |
| Table 18.23: Reagents and Consumables Supplied Costs | 424 |
| Table 18.24: Power Options Trade-Off | 430 |
| Table 18.25: Diesel Generator Sets | 430 |
| Table 18.26: Power Draw Summary | 430 |
| S-K 1300 Technical Report Summary on the Songwe Hill REE Project | Page 15 of 489 |
| |
| Table 18.27: Process Plant Labour Cost Summary | 433 |
| Table 18.28: Plant Maintenance Cost Factors | 433 |
| Table 18.29: Plant Maintenance, Parts and Supplies OPEX | 433 |
| Table 19.1: Composition of Gypsum By-Product | 436 |
| Table 19.2: Mineral Reserve Summary as at 30 April 2025 | 441 |
| Table 19.3: Summary of Mining and Processing Inputs and Results – Average over First Five Years | 442 |
| Table 19.4: Summary of Mining and Processing Inputs and Results – LOO | 442 |
| Table 19.5: Summary of Mining and Processing Inputs and Results – Total LOO | 443 |
| Table 19.6: Capital Costs | 443 |
| Table 19.7: Operating Costs – Average over First Five Years | 443 |
| Table 19.8: Operating Costs – Average over LOO | 444 |
| Table 19.9: Summary of Selected Financial Inputs and Corresponding Results – Post-Tax Valuation | 444 |
| Table 19.10: NPVs of Songwe Hill Project1 | 445 |
| Table 19.11: Sensitivity of NPV (Nominal) to Changes in Metal Prices (All Metals) | 447 |
| Table 19.12: Sensitivity of NPV (Nominal) to Changes in OPEX | 447 |
| Table 19.13: Sensitivity of NPV (Nominal) to Changes in CAPEX | 447 |
| Table 19.14: Sensitivity of NPV at 10 % (Nominal) to Two-Way Variation in OPEX and CAPEX | 448 |
| Table 19.15: Cash Flow Model – Songwe Hill Project | 449 |
| Table 21.1: Overall Project Key Dates | 452 |
| Table 21.2: Risk Scoring Definitions | 456 |
| Table 21.3: Risk Scoring Matrix | 456 |
| Table 21.4: General Risks | 456 |
| Table 21.5: Resource Risks | 458 |
| Table 21.6: Mining Risks | 459 |
| Table 21.7: Process Plant Risks | 460 |
| Table 21.8: TSF Risks | 461 |
| Table 21.9: Sustainable Development Risks | 462 |
| Table 21.10: Financial Analysis Risks – Fraser McGill Review | 465 |
| Table 21.11: Opportunities | 466 |
| Table 21.12: Indicative Annual Impacts of Technical Improvements | 468 |
| Table 21.13: Optimisation Work – Status, Requirements for Validation, Risks and Mitigation Measures | 469 |
| Table 21.14: Total Labour | 473 |
| Table 22.1: Songwe Hill, Exclusive Mineral Resources above 0.55 % TREO Grade, 30 June 2025 | 476 |
| Table 22.2: Songwe Hill, Inclusive Mineral Resources above 0.55 % TREO Grade, 30 June 2025 | 476 |
| Table 22.3: Mineral Reserve Summary as at 30 April 2025 | 477 |
| S-K 1300 Technical Report Summary on the Songwe Hill REE Project | Page 16 of 489 |
| |
| LIST OF FIGURES | |
| Figure 1.1: Location of Songwe Hill in Malawi | 28 |
| Figure 1.2: Pit Shell Layout Showing Design Sectors of Fresh Material | 33 |
| Figure 1.3: Plan View of Final Open Pit | 36 |
| Figure 1.4: Cross Section through Final Open Pit | 36 |
| Figure 1.5: Mining Production Profile by Year | 37 |
| Figure 1.6: Positions of Mined Material Storage Facilities | 38 |
| Figure 1.7: Concentrator Plant Flowsheet | 40 |
| Figure 1.8: Hydrometallurgical Plant Flowsheet | 42 |
| Figure 1.9: OPEX Distribution | 46 |
| Figure 1.10: Historical global consumption and forecasted demand for TREO by end-use category | 48 |
| Figure 1.11: Relative distribution of rare earth oxides in Songwe Hill Project product basket | 49 |
| Figure 1.12: Per-REO contribution to Songwe Hill Project basket value in 2030 | 50 |
| Figure 1.13: Forecasted Songwe Hill basket value from 2025 through 2040 | 50 |
| Figure 1.14: Forecasted value of Songwe Hill MREC from 2025 through 2040 | 51 |
| Figure 1.15: NPV at 10 % Nominal Sensitivity Analysis | 55 |
| Figure 1.16: Annual Cash Flow (Nominal) | 56 |
| Figure 1.17: Cumulative Annual Cash Flow (Nominal) | 56 |
| Figure 3.1: Location of Songwe Hill in Malawi | 71 |
| Figure 3.2: Location of RTL 0001/21 and Access Roads | 74 |
| Figure 4.1: Wind Rose for Songwe Hill | 77 |
| Figure 4.2: Monthly Temperature for Songwe Hill | 78 |
| Figure 4.3: Average Monthly Relative Humidity | 78 |
| Figure 4.4: Total Monthly Rainfall | 79 |
| Figure 6.1: Distribution of Chilwa Province Alkaline Intrusions in Southern Malawi and Mozambique | 84 |
| Figure 6.2: Simplified Local Geological Cross Section and Chronological/Stratigraphic Column | 86 |
| Figure 6.3: Outcrops of the Major Rock Types at Songwe Hill | 87 |
| Figure 6.4: Geology of Songwe Hill and Environs | 88 |
| Figure 6.5: Surface Geological Map of Songwe Hill | 89 |
| Figure 6.6: Principal Carbonatite Lithologies in the Songwe Hill Complex | 90 |
| Figure 6.7: Examples of Mn Veining and Apatite in Drill Cores | 92 |
| Figure 6.8: Example of Contact Between Fenite and C2 Calcite Carbonatite | 94 |
| Figure 6.9: Phonolite Dyke in Drill Core, Lightly Fenitised with Phenocrysts of K-Feldspar and Nepheline and a Xenolith of Coarse-Grained Nepheline Syenite | 95 |
| Figure 6.10: Phonolite Dyke with Syenite Xenoliths in Dark Carbonatite Breccia | 96 |
| Figure 6.11: Wall of Calcite Carbonatite with Syn-Intrusive Dykes and Locally Cross-Cutting and Fragmented Dykes | 96 |
| Figure 6.12: Igneous Foliation in Calcite Carbonatite | 97 |
| Figure 6.13: Geological Map with Faults (Long Dashed Lines) Interpreted from a Ground Magnetic Survey | 98 |
| Figure 6.14: Box and Whisker Plots of Lithology Versus Ca Grade at Songwe Hill | 99 |
| Figure 6.15: Scatterplot of Binned Ca Grade Versus TREO Grade at Songwe Hill | 100 |
| Figure 6.16: Carbonatite Volume Modelled at Songwe Hill | 100 |
| Figure 6.17: Cross Section of the Indicator Block Model, Drillhole Data and the Modelled Carbonatite Volume (Green Perimeter) | 101 |
| Figure 6.18: SEM Images of Synchysite in the Songwe Hill Carbonatite | 105 |
| Figure 6.19: SEM Images of Apatite in the Songwe Hill Carbonatite | 105 |
| Figure 6.20: Florencite-Rich Groundmass of Carbonatite Breccia | 105 |
| Figure 6.21: Chondrite-Normalised Late-Stage Apatite from Songwe Hill Carbonatites | 106 |
| S-K 1300 Technical Report Summary on the Songwe Hill REE Project | Page 17 of 489 |
| |
| Figure 6.22: General Model for an Alkali Silicate-Carbonate Intrusive Complex | 107 |
| Figure 7.1: Geological Map of Songwe Hill with Sample Localities of JICA (1988) and Mkango (2010) Samples | 111 |
| Figure 7.2: Geological Map of Songwe Hill with Assay Results for Mkango Samples | 113 |
| Figure 7.3: Modified Analytical Signal of Total Magnetic Intensity over Songwe Hill | 114 |
| Figure 7.4: Thorium Radiometric Survey over Songwe Hill | 115 |
| Figure 7.5: Ground Gravity Survey over Songwe Hill | 116 |
| Figure 7.6: NSAMT Survey Lines (Black) and IP Survey Lines (Blue) | 117 |
| Figure 7.7: Diagram of the Field Station Setup in the NSAMT Survey | 118 |
| Figure 7.8: Example of the Inversion Products of the NSAMT Survey | 119 |
| Figure 7.9: Example of an IP Resistivity Profile through Songwe Hill | 120 |
| Figure 7.10: Example of an IP Chargeability Profile through Songwe Hill | 121 |
| Figure 7.11: Geological Map with Location and TREO of the Five Channel Sample Lines | 122 |
| Figure 7.12: Example of Channel Sampling Programme on Songwe Hill | 123 |
| Figure 7.13: Location of Sites where the Bulk Sample was Taken | 125 |
| Figure 7.14: Bulk Sampling in Progress by JCB Tracked Excavator with Hydraulic Hammer Attachment | 125 |
| Figure 7.15: Geological Map Showing Drillhole Collars and Traces | 128 |
| Figure 7.16: DGPS Survey of a Drillhole Collar | 130 |
| Figure 7.17: Examples of Plinths Marking Drillhole Locations | 132 |
| Figure 8.1: Examples of Drillhole Core Marking before Splitting | 137 |
| Figure 8.2: Core Logging and Core Tray Storage Facilities | 138 |
| Figure 8.3: Performance of Selected Rare Earth Elements in 329 Blank Analyses | 145 |
| Figure 8.4: Accuracy of Selected Light Rare Earth Elements in 112 Samples of CRM AMIS0185 | 146 |
| Figure 8.5: Repeatability of Selected Light and Heavy Rare Earth Elements in 337 Duplicate Sample Pairs (ppm) | 147 |
| Figure 8.6: Repeatability of Selected Light and Heavy Rare Earth Elements Umpire versus Original Assay | 148 |
| Figure 10.1: Mineral Abundances (ALS, 2018) | 156 |
| Figure 10.2: Bulk Sample Locations including Mn:Mg Ratios | 158 |
| Figure 10.3: Variability Test Work Campaign – Combined Grade/Recovery Curves | 160 |
| Figure 10.4: Modified Bench-Scale Test versus Optimised KYSPYmet Test | 162 |
| Figure 10.5: Overall Survey Grade-Recovery Plot (ALS, 2021) | 163 |
| Figure 11.1: Log Cumulative Frequency Plot of the Sample TREO Grade Data | 173 |
| Figure 11.2: Isometric View of the DTM Created from the LiDAR Survey Data – View is Approximately to the North | 174 |
| Figure 11.3: Histograms and Log Probability Plots for TREO Grade | 177 |
| Figure 11.4: Sections through the Block Model and Drillhole Data Illustrating Correlation between Model and Data | 184 |
| Figure 11.5: Sectional Validation Plots for Ce2O3 Grade | 185 |
| Figure 11.6: Comparison between Drillhole and Model Data on a per Block Basis | 186 |
| Figure 11.7: Mineral Resource Classification, Songwe Hill – Plan View from Top | 187 |
| Figure 11.8: Mineral Resource Classification, Songwe Hill – North-East Section View | 188 |
| Figure 11.9: Section Looking North Showing Block Model Relative to Pit Shell Extents and Topography (Section 801775E) | 190 |
| Figure 12.1: Grade versus Tonnage Curve | 205 |
| Figure 12.2: Discounted Cash Flow by Pit Shell | 209 |
| S-K 1300 Technical Report Summary on the Songwe Hill REE Project | Page 18 of 489 |
| |
| Figure 12.3: Phase 1 and 2 Pit Shells EW Section | 213 |
| Figure 12.4: Phase 1 and 2 Pit Shells NS Section | 214 |
| Figure 12.5: Phase 1 and 2 Pit Shells Plan View 800 m Elevation | 214 |
| Figure 12.6: Phase 1 and 2 Plan View 700 m Elevation | 215 |
| Figure 12.7: Plan View of Final Open Pit | 216 |
| Figure 12.8: Cross Section Looking East of Final Open Pit | 216 |
| Figure 12.9: Cross Section (Looking East) Showing Pit Optimisation Shells and Pit Designs | 218 |
| Figure 12.10: Cross Section (Looking South) Showing Pit Optimisation Shells and Pit Designs | 218 |
| Figure 12.11: Plan on 800 RL Showing Pit Optimisation Shells and Pit Designs | 219 |
| Figure 13.1: Locations of Geotechnical Boreholes | 226 |
| Figure 13.2: Sectors Defined According to Elevation for Discontinuity Orientation Analysis | 236 |
| Figure 13.3: Dips Scatter Plot Showing Large Spread in Data | 237 |
| Figure 13.4: Dips Contour Plot Showing Dominant Joint Sets | 237 |
| Figure 13.5: Typical Open-Pit Slope Terminology | 238 |
| Figure 13.6: Pit Shell Layout Showing Design Sectors of Fresh Material | 239 |
| Figure 13.7: Diagram Showing Slope Geometry for Sector 1 | 242 |
| Figure 13.8: Diagram Showing Slope Geometry for Sector 2 | 243 |
| Figure 13.9: Diagram Showing Slope Geometry for Sectors 3 and 4 | 243 |
| Figure 13.10: Diagram Showing Slope Geometry for Sector 5 | 244 |
| Figure 13.11: Diagram Showing Slope Geometry for Sector 6 | 244 |
| Figure 13.12: Diagram Showing Slope Geometry for Sector 7 | 245 |
| Figure 13.13: Haul Routes and Material Destinations | 248 |
| Figure 13.14: Monthly Water Inflow | 250 |
| Figure 13.15: Flow Diagram up to Year 8 | 251 |
| Figure 13.16: Flow Diagram from Year 8 | 251 |
| Figure 13.17: Positions of Mined Material Storage Facilities | 254 |
| Figure 13.18: Production Profile by Year | 256 |
| Figure 13.19: Processing Profile by Year | 257 |
| Figure 13.20: Phase 1 and 2 Pit Designs shown in Plan View | 258 |
| Figure 13.21: Phase 1 and 2 Pit Designs shown in Section View Looking East | 259 |
| Figure 14.1: Concentrator Plant Flowsheet | 264 |
| Figure 14.2: Hydrometallurgical Plant Flowsheet | 265 |
| Figure 15.1: Plant Layout | 290 |
| Figure 15.2: Mining Infrastructure Site Layout | 300 |
| Figure 15.3: Main Access to the Project Site | 305 |
| Figure 15.4: PSD for Rare Earth Tailings | 311 |
| Figure 15.5: Close-Up of the TSF Site | 316 |
| Figure 15.6: TSF Development at Phase 1 in Year 4 of the LOO | 320 |
| Figure 15.7: TSF Development at Phase 5 in Year 20 of the LOO | 321 |
| Figure 15.8: Typical Appurtenances Required for EDF Storage and IDF Conveyance | 322 |
| Figure 15.9: Route through Mozambique | 326 |
| Figure 16.1: Rare earth elements include the lanthanide series plus yttrium and sometimes scandium | 331 |
| Figure 16.2: Global production of REEs is remarkably low compared to similarly abundant elements | 332 |
| S-K 1300 Technical Report Summary on the Songwe Hill REE Project | Page 19 of 489 |
| |
| Figure 16.3: Historical global TREO mine production by country | 333 |
| Figure 16.4: Overview of the global mine to magnet value chain in 2024, led by China at every step | 333 |
| Figure 16.5: Rare earth applications and end-uses fall into one of eight end-use categories | 334 |
| Figure 16.6: Permanent magnets and catalysts are the largest rare earth demand drivers | 335 |
| Figure 16.7: The supply-side will struggle to keep up with rising demand for magnet rare earths | 335 |
| Figure 16.8: Sacrificial over-production of cerium oxide to satisfy rapidly growing demand for didymium oxide | 336 |
| Figure 16.9: Strong future demand growth for permanent magnets will exacerbate the balance problem | 336 |
| Figure 16.10: Prices of magnet rare earths will rise to compensate for losses incurred on other rare earths | 337 |
| Figure 16.11: Historical global consumption and forecasted demand for TREO by end-use category | 338 |
| Figure 16.12: NdFeB is the strongest permanent magnet material commercially available today | 339 |
| Figure 16.13: Historical global consumption and forecasted demand for magnet rare earth oxides by end-use category | 340 |
| Figure 16.14: Forecasted share of global NdFeB demand driven by less price sensitive applications | 341 |
| Figure 16.15: Forecasted production – demand balance for NdPr oxide to 2040 (Base Case) | 342 |
| Figure 16.16: Forecasted magnet rare earth oxide prices to 2040 (Base Case – China FOB) | 343 |
| Figure 16.17: Relative distribution of rare earth oxides in Songwe Hill Project product basket | 343 |
| Figure 16.18: Per-REO contribution to Songwe Hill Project basket value in 2030 | 344 |
| Figure 16.19: Forecasted Songwe Hill basket value from 2025 through 2040 | 344 |
| Figure 16.20: Contribution of magnet rare earth oxides to the Songwe Hill basket value in each scenario | 345 |
| Figure 16.21: Forecasted value of Songwe Hill MREC from 2025 through 2040 | 346 |
| Figure 16.22: The price of NdPr oxide in China rallied 41 % following the U.S. establishment of a US$110/kg price floor | 350 |
| Figure 18.1: Scheduled Capital Cost | 390 |
| Figure 18.2: Capital Cost Outflow Forecast | 415 |
| Figure 18.3: OPEX Distribution | 417 |
| Figure 18.4: Plant OPEX Distribution | 423 |
| Figure 18.5: Energy Balance for the Three Different Energy Options | 429 |
| Figure 18.6: Cost of Energy and Initial CAPEX for the Three Different Energy Options | 429 |
| Figure 19.1: NPV at 10 % Nominal Sensitivity Analysis | 445 |
| Figure 19.2: Annual Cash Flow (Nominal) | 446 |
| Figure 19.3: Cumulative Annual Cash Flow (Nominal) | 446 |
| Figure 21.1: Project Schedule Summary | 454 |
| Figure 21.2:Energy Balance for Three Different Energy Options | 470 |
| Figure 21.3: Cost of Energy and Initial CAPEX for Three Different Energy Options | 469 |
| Figure 21.4: Overall Mine Management Structure | 472 |
| Figure 21.5: Total Labour Distribution | 474 |
| S-K 1300 Technical Report Summary on the Songwe Hill REE Project | Page 20 of 489 |
| |
LIST OF UNITS
| Unit | Description |
| % | per cent |
| % w/w | percentage weight per weight |
| μm | micrometre |
| μS | microsiemens |
| µSv.year-1 | microsievert per year |
| °C | degree Celsius |
| a | annum |
| cm | centimetre |
| d | day |
| g | gram |
| h | hour |
| ha | hectare |
| kg | kilogram |
| km | kilometre |
| km2 | square kilometre |
| kPa | kilopascals |
| kV | kilovolt |
| kVA | kilovolt ampere |
| kW | kilowatt |
| kWe | kilowatt energy |
| kWh | kilowatt hour |
| L | litre |
| M | million (1 × 10⁶) |
| m | metre |
| m3 | cubic metre |
| Ma | million years (106 years) |
| mamsl | metre above mean sea level |
| mbgl | metre below ground level |
| mg/L | milligram per litre |
| min | minute |
| S-K 1300 Technical Report Summary on the Songwe Hill REE Project | Page 21 of 489 |
| |
| Unit | Description |
| mm | millimetre |
| MPa | megapascal |
| Mt | million tonnes |
| MW | megawatt |
| ppm | parts per million |
| s | second |
| t | tonne |
| t/a | tonne per annum |
| t/h | tonne per hour |
| t/m3 | tonne per cubic metre |
| USD or US$ | United States dollar |
| V | volt |
| ZAR | South African rand |
It is noted that, throughout the report, table columns might not add up due to rounding.
| S-K 1300 Technical Report Summary on the Songwe Hill REE Project | Page 22 of 489 |
| |
LIST OF ABBREVIATIONS AND ACRONYMS
Abbreviation or Acronym |
Description |
| AACE | Association for the Advancement of Cost Engineering |
| ABA | acid-base accounting |
| Ai | abrasion index |
| ANZECC | Australian and New Zealand Environment and Conservation Council |
| BBWi | Bond ball work index |
| BFA | bench face angle |
| BOQ | bill of quantities |
| BRWi | Bond rod work index |
| C&I | control and instrumentation |
| CAGR | compound annual growth rate |
| CAPEX | capital cost |
| CCE | closure cost estimate |
| CCTV | closed-circuit television |
| CIM | Canadian Institute of Mining, Metallurgy and Petroleum |
| CP | Closure Plan |
| CRM | certified reference material |
| CWi | crushing work index |
| DFS | Definitive Feasibility Study |
| E&I | electrical and instrumentation |
| E, C&I | electrical, control and instrumentation |
| EC | electrical conductivity |
| ECSA | Engineering Council of South Africa |
| EL | Exploration Licence |
| EMA | Environment Management Act |
| EPCM | engineering, procurement and construction management |
| EPL | Exclusive Prospecting Licence |
| Escom | Electricity Supply Corporation of Malawi |
| ESHMP | Environmental, Social and Health Management Plan |
| ESHIA | Environmental, Social and Health Impact Assessment |
| ESMP | Environmental and Social Management Plan |
| FEL | front-end loader |
| FOS | factor of safety |
| G&A | general and administration |
| GIIP | Good International Industry Practice |
| S-K 1300 Technical Report Summary on the Songwe Hill REE Project | Page 23 of 489 |
| |
Abbreviation or Acronym |
Description |
| GISTM | Global Industry Standards on Tailings Management |
| GPS | Global Positioning System |
| GSDM | Geological Survey Department of Malawi |
| GSI | geological strength index |
| HAZOP | hazard and operability |
| HDPE | high-density polyethylene |
| HR | human resources |
| ICP | inductively coupled plasma |
| ICP-MS | inductively coupled plasma mass spectrometry |
| ICP-OES | inductively coupled plasma optical emission spectrometry |
| IEC | International Electrotechnical Commission |
| IFC | International Finance Corporation |
| I/O | input/output |
| IP | induced polarisation |
| IRA | inter-ramp angle |
| IRR | internal rate of return |
| ISO | International Organization for Standardization |
| IT | information technology |
| ITCZ | Intertropical Convergence Zone |
| IUCN | International Union for Conservation of Nature |
| JICA | Japan International Cooperation Agency |
| LAN | local area network |
| LC | Least Concern |
| LOO | life of operations |
| LRP | Livelihood Restoration Plan |
| LV | low voltage |
| MCC | motor control centre |
| MEL | mechanical equipment list |
| MIA | mining infrastructure area |
| Mkango | Mkango Resources Limited |
| MKAR | Mkango Rare Earths Limited (formerly Lancaster Exploration Limited), wholly-owned subsidiary of Mkango |
| MMAJ | Metal Mining Agency of Japan |
| MPL | maximum permissible level |
| MREC | mixed rare earth carbonate |
| MTO | material take-off |
| S-K 1300 Technical Report Summary on the Songwe Hill REE Project | Page 24 of 489 |
| |
Abbreviation or Acronym |
Description |
| MV | medium voltage |
| NAF | non-acid forming |
| NAG | net acid generation |
| NdFeB alloy | The NdFeB precursor materials from which sintered NdFeB magnets are manufactured. |
| NaOH | sodium hydroxide |
| NdFeB magnet | The final sintered or bonded magnet form (often coated to protect from corrosion) ready for use in a particular end use or application. |
| NdPr oxide | didymium oxide (combined form of neodymium (75 %) and praseodymium (25 %) oxide commonly used by NdFeB manufacturers instead of individual neodymium and/or praseodymium oxides) |
| NEAP | National Environmental Action Plan |
| NEP | National Environmental Policy |
| NGO | non-governmental organisation |
| NI 43-101 | Canadian Securities Administrators’ National Instrument 43-101 |
| NPV | net present value |
| OPEX | operating cost |
| OSA | overall slope angle |
| P&G | preliminary and general |
| P&ID | piping and instrumentation diagram |
| PAP | project-affected person |
| PAS | process automation system |
| PEA | Preliminary Economic Assessment |
| PGA | peak ground acceleration |
| PFS | Pre-Feasibility Study |
| PLC | programmable logic controller |
| PLS | pregnant leach solution |
| POF | probability of failure |
| Project | Songwe Hill Rare Earth Element Project |
| PSD | particle size distribution |
| QA | quality assurance |
| QC | quality control |
| QP | Qualified Person |
| RAP | Resettlement Action Plan |
| RCP | Rehabilitation and Closure Plan |
| REE | rare earth element |
| REO | rare earth oxide |
| S-K 1300 Technical Report Summary on the Songwe Hill REE Project | Page 25 of 489 |
| |
Abbreviation or Acronym |
Description |
| RMR | rock mass rating |
| ROM | run of mine |
| RQD | rock quality designation |
| RTL | Retention Licence |
| RWD | return water dam |
| S-K 1300 | SEC’s Subpart 229.1300 of Regulation S-K, Disclosure by Registrants Engaged in Mining Operations |
| SAIMM | Southern African Institute of Mining and Metallurgy |
| SCADA | supervisory control and data acquisition |
| SEC | United States Securities and Exchange Commission |
| SG | specific gravity |
| SHE | Safety, health and environment |
| SLD | single-line diagram |
| SMPP | structural, mechanical, plate work and piping |
| SWCD | storm water control dam |
| SWMP | Storm Water Management Plan |
| TDS | total dissolved solids |
| TR | Technical Report |
| TREO | total rare earth oxide |
| TRS | Technical Report Summary |
| TSF | tailings storage facility |
| TSX | Toronto Stock Exchange |
| UCM | uniaxial compressive strength with elastic moduli |
| UCS | unconfined compressive strength |
| UTB | indirect tensile strength |
| UTM | Universal Transverse Mercator |
| VSD | variable speed drive |
| VU | Vulnerable |
| WHO | World Health Organization |
| WRD | waste rock dump |
| XRF | X-ray fluorescence |
| S-K 1300 Technical Report Summary on the Songwe Hill REE Project | Page 26 of 489 |
| |
| 1 | Executive Summary |
| 1.1 | Introduction |
Mkango Rare Earths Limited (formerly Lancaster Exploration Limited) (MKAR) was incorporated under the laws of the British Virgin Islands on August 3, 2007 as a BVI business company, and is a wholly owned subsidiary of Mkango Resources Limited (Mkango). Mkango is a Canadian exploration and development company dual listed on the UK AIM (Alternative Investment Market) and Canadian TSX-V (TSX Venture Exchange) (www.mkango.ca). MKAR owns the Songwe Hill Rare Earth Element (REE) Project in Malawi (Songwe Hill or the Project). Mkango currently owns the Pulawy Separation Plant through a separate wholly owned subsidiary (Mkango Polska); however, after giving effect to a corporate restructuring expected to occur in the second quarter of 2026, through which Mkango Polska would be transferred to MKAR. MKAR is expected to own the Puławy Separation Plant Project in Poland (Puławy).
The Project includes an open pit, flotation concentrator plant, and a hydrometallurgical plant. It is expected to produce a purified mixed rare earth carbonate (MREC) concentrate, which will be shipped to Puławy for processing into separated rare earth oxides (REOs) for sale to pre-agreed offtakers.
In 2021, Mkango commissioned SENET, a DRA Global Group Company, to complete a definitive feasibility study (DFS) for the Songwe Hill REE Project. The DFS report is dated July 2022.
In 2025, Mkango retained SENET to prepare an independent Technical Report Summary (TRS) on the Songwe Hill Project. This TRS conforms to the United States Securities and Exchange Commission’s (SEC) Modernized Property Disclosure Requirements for Mining Registrants as described in Subpart 229.1300 of Regulation S-K, Disclosure by Registrants Engaged in Mining Operations (S-K 1300) and Item 601 (b)(96) Technical Report Summary. The purpose of this TRS is to provide an update to the 2022 DFS, and it was prepared in accordance with S-K 1300 in support of a planned initial public offering (IPO) on a US securities exchange. This is the initial TRS for Songwe Hill. The effective date of the report is TBC. Qualified persons, as defined by S-K 1300, from Swinden Geoscience Consultants Ltd (Swinden), The MSA Group (Pty) Ltd, (MSA), Bara Consulting (Pty) Ltd. (Bara), Digby Wells Environmental (Digby Wells), Epoch Resources (Pty) Ltd. (Epoch), and Adamas Intelligence Inc. (Adamas) contributed to this TRS. SENET is a third-party firm comprising minerals processing experts in their respective fields. In accordance with 17 CFR § 229.1302(b)(1), SENET acts as a QP and is responsible for all the sections it has completed.
A Canadian National Instrument 43-101 (NI 43-101) Technical Report (TR) for the Project, dated July 2022 (the 2022 TR), was previously prepared by SENET and is available on SEDAR+. The 2022 TR report was updated by SENET and will be available on SEDAR+ in early 2026. This 2026 TR supersedes the 2022 TR report. The S-K 1300 report (TRS) will also be filled on SEDAR+ in early 2026.
REEs have become critical to technologies fundamental to clean energy initiatives worldwide, as well as ubiquitous gadgetry and electronics of modern society. Compared to similarly abundant elements in nature, such as copper, lead, and tin, global annual production of REEs is notably low. REEs are used in small, but often necessary, amounts in hundreds of different technologies, materials, and chemicals worldwide for commercial, industrial, social, medical, and environmental applications. In just a few decades, REEs have become entrenched in modern technology and industry and have proven exceptionally challenging to duplicate or replace.
| S-K 1300 Technical Report Summary on the Songwe Hill REE Project | Page 27 of 489 |
| |
REEs are not remarkably rare in nature but rather are rarely concentrated into economically significant amounts for extraction and processing owing to certain physical and chemical characteristics that promote their broad dissipation in most rock types.
| 1.2 | Property Description |
Songwe Hill is located in south-eastern Malawi, between Lake Chilwa and the Mulanje Massif, and close to the eastern border of Malawi with Mozambique (see Figure 1.1). It lies within Retention Licence (RTL) 0001/21, which is one of 4 retention licences (RTL 0001/21, RTL 0002/21, RTL 0003/21 and RTL 0007/21) that MKAR refers to as the “Phalombe Licences” which are currently being transferred into a large scale mining licence.
RTL 0001/21 lies entirely within the Southern Region of Malawi, and Songwe Hill is within the Phalombe administrative district. It lies approximately 70 km in a straight line southeast from Zomba (the former capital of Malawi) and approximately 90 km in a straight line east-northeast of the commercial centre of Blantyre. Songwe Hill can be reached from these centres via national highways S144 and S145, respectively. The S145 passes through Migowi, which is located approximately 15 km from Songwe Hill. The Project is approximately 9 km from the village of Maoni, which is connected to Migowi via T415, an all-weather, double-lane graded and gravelled road with new, reinforced concrete bridges and culverts.

Figure 1.1: Location of Songwe Hill in Malawi
| S-K 1300 Technical Report Summary on the Songwe Hill REE Project | Page 28 of 489 |
| |
| 1.3 | Geology and Mineralisation |
Songwe Hill is interpreted as a carbonatite intrusion–breccia complex expressed as a steep-sided hill approximately 800 m in diameter. The carbonatites are best exposed along the north-eastern slope of Songwe Hill and in a somewhat smaller area along its north-western edge, Surface mapping and diamond core drilling indicate that the complex consists of a multi-phase intrusion characterised by early intrusion of nepheline syenite and phonolite cut by diverse carbonatites and breccias exhibiting a range of alteration from potassic fenitisation to low-temperature hydrothermal/carbohydrothermal overprinting. The entire complex is cut by phonolite dykes, which appear to represent either a continuous event or multiple pulses during and after carbonatite emplacement.
The principal lithologies that comprise the Songwe Hill vent complex are carbonatite, fenite, breccia and phonolite. Three carbonatite phases have been recognised, and all are variably mineralised. The fenites comprise dominantly K-feldspar-rich alteration products of phonolite and nepheline syenite, and broadly occur as an aureole around the carbonatite intrusion. The breccias range from clearly abraded pebble-sized fragments (pebble dykes) to angular blocks that are metres in diameter and include significant volumes of breccia in which the fragments appear to have undergone little or no movement. The breccias can be divided into two types: fenite-rich breccias and carbonatite-rich breccias and are interpreted to be related to high-level explosive processes during the formation of the vent complex. Phonolites are variably altered and occur mainly as dykes that both pre-date and post-date mineralisation and fenitisation.
There are also late calcic, Mn-Fe-rich veins and dykes that are locally mineralised, and minor occurrences of late calcite-barite-apatite-fluorite bearing veins, which are widely dispersed and locally enriched in REEs.
Geological and geochemical modelling of the intrusive-breccia complex suggests that the complex can be broadly described as a central, steep-sided carbonatite plug with complex intrusive margins, that is mantled and intimately associated with the breccias and haloed by fenite. The principal zone of REE mineralisation comprises mainly the carbonatite intrusions and carbonatite-rich breccias that are closely related spatially to the intrusion. The principal REE-bearing minerals are synchysite and apatite, with minor florencite.
The complex has been affected by late faulting, reflected in the geology and magnetics, which has locally produced foliation in the rocks. A number of faults, which help explain map patterns but generally have small displacements, have been tentatively identified.
| 1.4 | Status of Exploration |
The first Mineral Resource estimate prepared in accordance with the Canadian Institute of Mining, Metallurgy and Petroleum (CIM) Definition Standards for Mineral Resources and Mineral Reserves (CIM, 2014) incorporated in NI 43-101 was reported in 2012 based on geochemical analyses and density measurements of core samples obtained from 38 diamond drillholes completed by Mkango in 2011 and 2012. An additional 91 diamond drillholes were completed by Mkango in 2018. The areas drilled to date are in an elevated position on the northern slopes of Songwe Hill, which rises approximately 230 m above the surrounding plain. The 2018 drillhole programme aimed to increase the confidence in the Mineral Resource by infill drilling as well as to expand the Mineral Resource area.
| S-K 1300 Technical Report Summary on the Songwe Hill REE Project | Page 29 of 489 |
| |
Drilling was carried out on east-west oriented section lines spaced 30 m apart. The drillholes were inclined predominantly to the east and west with additional holes inclined to the north and south. This resulted in a network of drillholes with variable spacing, generally 30 m along sections in the better drilled areas in the south and east of the project and between 40 m and 50 m in the other areas, with the closest spaced drilling being in the upper 120 m of the deposit. Drilling to a maximum of approximately 350 m below surface has demonstrated the existence of mineralised carbonatite at this depth, and the deposit remains open at depth.
An updated Mineral Resource estimate with an effective date of 23 January 2019 was prepared in accordance with the CIM (2014) definitions.
No exploration activities have taken place at Songwe Hill since 2018.
The Mineral Resource estimate reported in this TRS supersedes the 2019 Mineral Resource estimate and is the initial Mineral Resource estimate prepared in accordance with S-K 1300.
| 1.5 | Mineral Resource Estimate |
The Mineral Resource estimate is based on REE, thorium, uranium, iron, manganese, aluminium, silica, potassium and density measurements obtained from the cores of 129 diamond drillholes, which were completed in three phases of drilling (2011, 2012 and 2018).
For the purposes of Mineral Resource definition, three lithological domains were identified in the Songwe Hill deposit: a carbonatite domain; a fenite domain; and a “mixed” domain consisting of breccia and/or finely intermixed carbonatite and fenite. The carbonatite domain tends to contain the highest concentration of REE mineralisation with the lowest concentration being in the fenite, which grades to barren in places. A 15 % calcium threshold was used to distinguish between carbonatite and non-carbonatite rocks.
An indicator approach was used to estimate the proportion of carbonatite dominant to fenite dominant rocks in each of the 20 mX by 20 mY by 5 mZ cells in the block model. Ordinary kriging was used to estimate the attributes into the block model separately for carbonatite and non-carbonatite sample composites. The final grade assigned to the block model was proportioned for the two lithological domains using the proportions estimated by the indicator model.
The Mineral Resource forms an irregular, roughly circular surface expression with a diameter of approximately 450 m. The maximum depth of the Inferred Mineral Resource is 390 m below surface, with the Measured and Indicated Mineral Resource occurring to a maximum depth of 200 m, paralleling the topographic surface of the hill and surrounding plain. The majority of the Measured and Indicated Mineral Resource occurs to a depth of approximately 160 m. Extrapolation in the Inferred area was limited to a maximum of 50 m from the drilling area.
| S-K 1300 Technical Report Summary on the Songwe Hill REE Project | Page 30 of 489 |
| |
Mineral Resources have been classified in accordance with the S-K 1300 definitions, which are consistent with the CIM (2014) definitions. Mineral Resources are reported on an Exclusive basis, which is the standard for S-K 1300, and may be reported on an Inclusive basis under other minerals reporting standards. Exclusive Mineral Resources are reported after the removal of the portion that was converted to Mineral Reserves, whereas Inclusive Mineral Resources include the portion that was converted to Mineral Reserves. Mkango’s disclosure of the Songwe Hill Mineral Resource has until now been on an Inclusive basis in accordance with NI 43-101. Both Exclusive and Inclusive Mineral Resources are reported in this TRS, with Exclusive Mineral Resources presented as per the S-K 1300 standards and Inclusive Mineral Resources presented to be consistent with those reported by Mkango under the NI 43-101 standards.
The Mineral Resource is classified into the Measured, Indicated and Inferred categories and is summarised in Table 1.1 for the Mineral Resource reported excluding the resources converted to Mineral Reserves, as per the S-K 1300 standards, and in Table 1.2 for the Mineral Resource reported including the resources converted to Mineral Reserves.
The Mineral Resource is reported at a base case total rare earth oxide (TREO) cut-off grade of 0.55 % from within an optimised pit shell, which the Qualified Person (QP) considers will satisfy reasonable prospects for economic extraction.
Table 1.1: Songwe Hill, Exclusive Mineral Resources above 0.55 % TREO Grade, 30 June 2025
| Category | Tonnes (Mt) |
TREO (%) |
TREO Tonnes (kt) |
| Measured | 0.7 | 0.98 | 7 |
| Indicated | 3.4 | 1.05 | 36 |
| Total Measured and Indicated | 4.1 | 1.04 | 43 |
| Inferred | 55.9 | 1.05 | 589 |
| NOTES: | |
| 1. | Mineral Resources have been classified in accordance with the S-K 1300 definitions, which are consistent with the CIM (2014) definitions. |
| 2. | All tabulated data has been rounded, and as a result minor computational errors may occur. |
| 3. | Mineral Resources, which are not Mineral Reserves, have no demonstrated economic viability. |
| 4. | The Mineral Resource estimate is reported on a 100% ownership basis. |
| 5. | Mineral Resources are reported from within an optimised pit shell. |
| 6. | For the purposes of assessing reasonable prospects for economic extraction and cut-off grade, metallurgical recoveries were applied to individual rare earth oxides. The average total rare earth oxide metallurgical recovery is 39.6 %. |
| 7. | Mineral Resources exclude the portion converted to Mineral Reserves. |
| 8. | Mineral Resources are reported on an in-situ basis without applying modifying factors. |
| 9. | A mean density of 2.73 t/m3 was applied for Measured, 2.67 t/m3 for Indicated and 2.77 t/m3 for Inferred Resources. |
| TREO = La2O3, CeO2, Pr6O11, Nd2O3, Sm2O3, Eu2O3, Gd2O3, Tb4O7, Dy2O3, Ho2O3, Er2O3, Tm2O3, Yb2O3, Lu2O3, and Y2O3 | |
Inclusive Mineral Resources are presented in order to be consistent with those reported by Mkango under the NI 43-101 standards and are not compliant with the S-K 1300 reporting standards.
| S-K 1300 Technical Report Summary on the Songwe Hill REE Project | Page 31 of 489 |
| |
Table 1.2: Songwe Hill, Inclusive Mineral Resources above 0.55 % TREO Grade, 30 June 2025
| Category | Tonnes (Mt) |
TREO (%) |
TREO Tonnes (kt) |
| Measured | 13.6 | 1.27 | 173 |
| Indicated | 24.4 | 1.08 | 264 |
| Total Measured and Indicated | 38.1 | 1.15 | 437 |
| Inferred | 55.9 | 1.05 | 589 |
| NOTES: | |
| 1. | Mineral Resources have been classified in accordance with the S-K 1300 definitions, which are consistent with the CIM (2014) definitions. |
| 2. | All tabulated data has been rounded, and as a result minor computational errors may occur. |
| 3. | Mineral Resources, which are not Mineral Reserves, have no demonstrated economic viability. |
| 4. | The Mineral Resource estimate is reported on a 100% ownership basis. |
| 5. | Mineral Resources are reported from within an optimised pit shell. |
| 6. | For the purposes of assessing reasonable prospects for economic extraction and cut-off grade, metallurgical recoveries were applied to individual rare earth oxides. The average total rare earth oxide metallurgical recovery is 39.6 %. |
| 7. | Mineral Resources include the portion converted to Mineral Reserves. |
| 8. | Mineral Resources are reported on an in-situ basis without applying modifying factors. |
| 9. | A mean density of 2.73 t/m3 was applied for Measured, 2.67 t/m3 for Indicated and 2.77 t/m3 for Inferred Resources. |
| TREO = La2O3, CeO2, Pr6O11, Nd2O3, Sm2O3, Eu2O3, Gd2O3, Tb4O7, Dy2O3, Ho2O3, Er2O3, Tm2O3, Yb2O3, Lu2O3, and Y2O3 | |
The MSA QP is of the opinion that with consideration of the recommendations summarised in Section 1.13 of this TRS, any issues relating to technical and economic factors likely to influence the prospect of economic extraction can be resolved with further work.
| 1.6 | Development And Operations |
| 1.6.1 | Mining Methods |
The mining method at Songwe Hill will be conventional open-pit mining, making use of relatively small-scale trucks and diesel-hydraulic excavators, selected to match the mining conditions and required production rates.
| 1.6.2 | Mining Geotechnical Study |
Bara Consulting (Pty) Ltd (Bara) subcontracted Middindi Consulting to carry out an open-pit slope design for the Songwe Hill Project at a DFS level of accuracy. The study addresses the geotechnical characteristics of the rock mass within the planned open-pit area, the methods used for the slope design, and the pit slope configurations obtained.
| S-K 1300 Technical Report Summary on the Songwe Hill REE Project | Page 32 of 489 |
| |
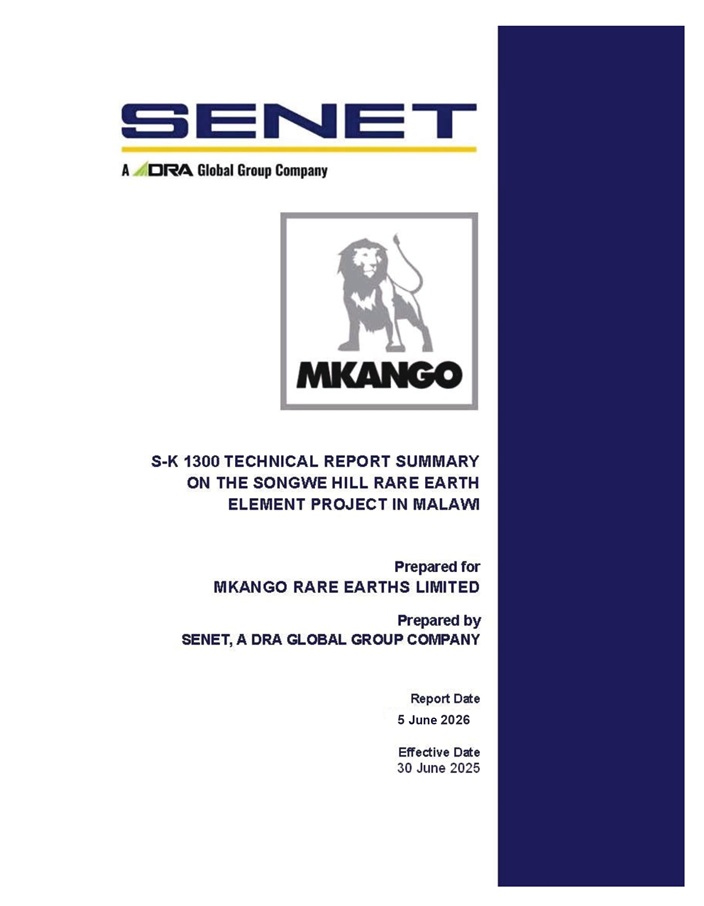
Figure 1.2 shows the sectors of the open pit for which different slope configurations were developed.
Figure 1.2: Pit Shell Layout Showing Design Sectors of Fresh Material
The final slope configurations recommended by the geotechnical study are given in Table 1.3.
Table 1.3: Summary of Slope Configurations
| Design Sector | Stack No. | Geotechnical Domain | No. of Benches | Bench Face Angle (°) | Max. Bench Height (m) | Min. Bench Width (m) | Geotechnical Bench Width (m) | Inter-Ramp Angle (°) | Overall Slope Angle (°) |
| 1 | 1 | Weathered, Trans-Fresh | 5 | 70 | 10 | 5 | 12 | 49 | 47 |
| 2 | Transitional | 4 | 5 | 12.5 | 49 | ||||
| 3 | Transitional | 3 | 5 | Pit floor | 49 | ||||
| 2 | 1 | Weathered | 2 | 70 | 10 | 5 | 10 | 49 | 44 |
| 2 | Trans-Fresh | 3 | 5.5 | 9 | 48 | ||||
| 3 | Trans-Fresh | 4 | 5.5 | 12 | 48 | ||||
| 4 | Transitional | 3 | 6 | 10 | 46 | ||||
| 5 | Transitional | 5 | 6 | Pit floor | 44 |
| S-K 1300 Technical Report Summary on the Songwe Hill REE Project | Page 33 of 489 |
| |
| Design Sector | Stack No. | Geotechnical Domain | No. of Benches | Bench Face Angle (°) | Max. Bench Height (m) | Min. Bench Width (m) | Geotechnical Bench Width (m) | Inter-Ramp Angle (°) | Overall Slope Angle (°) |
| 3 and 4 | 1 | Weathered | 2 | 70 | 10 | 5 | 10 | 49 | 40 |
| 2 | Transitional | 4 | 8 | 12.5 | 41 | ||||
| 3 | Trans-Fresh | 4 | 7.5 | 12 | 42 | ||||
| 4 | Transitional | 4 | 8 | 12 | 37 | ||||
| 5 | Poor Quality | 3 | 5 | 10 | 49 | ||||
| 6 | Trans-Fresh | 4 | 7.5 | 12 | 42 | ||||
| 7 | Trans-Fresh | 3 | 7.5 | 9 | 42 | ||||
| 8 | Transitional | 4 | 8 | 12.5 | 41 | ||||
| 9 | Transitional | 3 | 8 | Pit floor | 41 | ||||
| 5 | 1 | Weathered, Trans-Fresh | 6 | 70 | 10 | 5 | 15 | 45 | 42 |
| 2 | Transitional | 4 | 7 | 12.5 | 43 | ||||
| 3 | Transitional | 4 | 7 | Pit floor | 43 | ||||
| 6 | 1 | Weathered, Trans-Fresh | 6 | 70 | 10 | 5 | 15 | 45 | 43 |
| 2 | Transitional | 4 | 6 | 12.5 | 46 | ||||
| 3 | Transitional | 3 | 6 | Pit floor | 46 | ||||
| 7 | 1 | Weathered, Trans-Fresh | 5 | 70 | 10 | 8.5 | 12 | 39 | 39 |
| 2 | Transitional | 6 | 9 | Pit floor | 36 |
| 1.6.3 | Pit Optimisation |
A pit optimisation exercise was undertaken based on the input parameters in Table 1.4.
Table 1.4: Pit Optimisation Input Parameters
| Item | Value | Unit | Comments/Source |
| Operating Cost | |||
| Waste | |||
| Mining Cost – Free Dig | 3.50 | US$/t mined | Trollope Mining Services, 2025 |
| Mining Cost – Drill and Blast | 4.73 | US$/t mined | Trollope Mining Services, 2025 |
| Ore | |||
| Mining Cost – Free Dig | 2.92 | US$/t mined | Trollope Mining Services, 2025 |
| Mining Cost – Drill and Blast | 4.15 | US$/t mined | Trollope Mining Services, 2025 |
| Process Cost | 101.15 | US$/t milled | SENET |
| Technical | |||
| Slope Angles (Sector 1) | 49 | degrees | Geotechnical report |
| Slope Angles (Sector 2) | 44 | degrees | Geotechnical report |
| S-K 1300 Technical Report Summary on the Songwe Hill REE Project | Page 34 of 489 |
| |
| Item | Value | Unit | Comments/Source |
| Slope Angles (Sectors 3 and 4) | 40 | degrees | Geotechnical report |
| Slope Angles (Sector 5) | 43 | degrees | Geotechnical report |
| Slope Angles (Sector 6) | 46 | degrees | Geotechnical report |
| Slope Angles (Sector 7) | 36 | degrees | Geotechnical report |
| Mining Dilution | 3 | % | Bara |
| Mining Loss | 5 | % | Bara |
| Bench Height | 10 | m | Bara |
| Metallurgical Recovery | 40 | % | Mkango |
| Ore Production Rate | 83,333 | t/month | Per month – ORE only |
| Ore Production Rate | 1,000,000 | t/a | |
| Economic | |||
| Royalties | 5 | % | Covered in basket price calculation |
| TREO Price (Basket Price) | 40.86 | US$/kg | Basket price per kilogram of TREO recovered to carbonate |
| Discount Factor to Use | 7.3 | % | Mkango |
In order to maximise the net present value (NPV), while maintaining an acceptable life of operations (LOO), a number of scenarios were tested applying the following:
| ● | A cut-off grade varying from 0.55 % to 1.2 % TREO |
| ● | Varying cut-off grades over time |
Based on the results, the 0.55 % TREO_PCT cut-off grade produced the most favourable ultimate pit shell. A phased cut-off grade was selected with a cut-off grade of 1.2 % TREO_PCT applied in Years 1 to 5 and a cut-off grade of 0.55 % TREO_PCT applied thereafter. Any medium-grade material mined in the first five years will be stockpiled for processing later in the LOO.
The final selected pit shell contains 18.3 Mt of Type 1 ore at an average grade of 1.22 % TREO.
| 1.6.4 | Mine Design and Schedule |
The pit design was structured around the strategy of Phase 1 accessing high-grade Type 1 ore for the first five years and stockpiling any medium-grade Type 1 ore to feed as run of mine (ROM) at a later stage. The high-grade pit shell from the pit optimisation was used as a guide for the design of the first five-year pit.
The ultimate pit pushback Phase 2 was then designed to the ultimate pit limits, and the ultimate pit shell from the pit optimisation was used as a guide.
The ultimate pit design, illustrated in Figure 1.3 and Figure 1.4, is approximately 660 m north to south, 550 m east to west, and has a depth of 354 m from the pit rim on the south side (top of Songwe Hill) and 134 m on the north side (bottom of Songwe Hill).
| S-K 1300 Technical Report Summary on the Songwe Hill REE Project | Page 35 of 489 |
| |
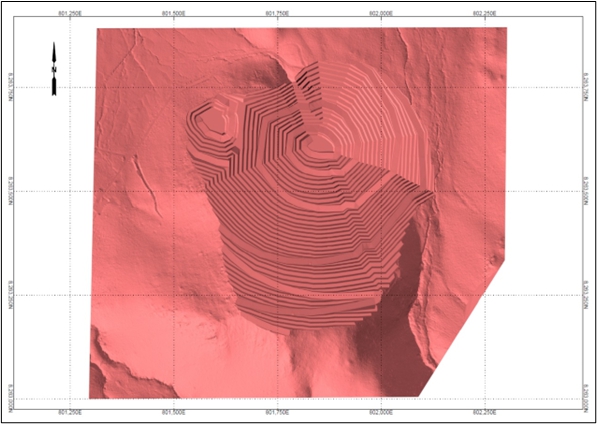
Figure 1.3: Plan View of Final Open Pit
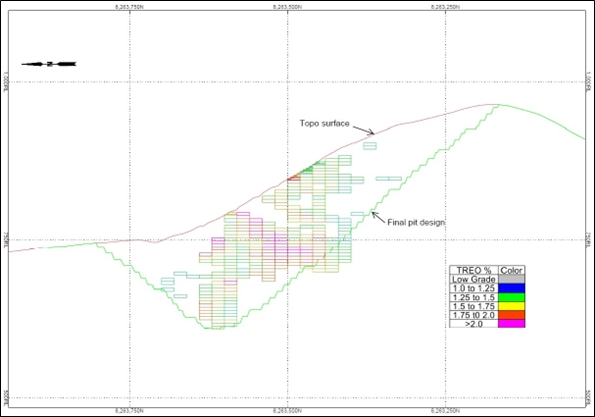
Figure 1.4: Cross Section through Final Open Pit
| S-K 1300 Technical Report Summary on the Songwe Hill REE Project | Page 36 of 489 |
| |
Modifying factors have been applied to the mineral resource to emulate practical mining conditions and estimate the mining inventory that will be delivered to the plant as ROM production. Modifying factors that have been applied are as follows:
| ● | Ore recovery of 95 %. |
| ● | External dilution of 3 % – This is waste at zero grade added to the ore volume to account for inaccuracies in mining. |
| ● | Internal dilution of 5 % at a grade of 0.68 TREO % – Internal dilution is made up of a combination of Inferred Resources, Type 2 material, and low-grade ore waste, all of which are treated as waste material in the mine design but are included in the mining blocks. |
The mining inventory resulting from the ultimate pit design is given in Table 1.5.
Table 1.5: Mining Inventory from Pit
| Description | Value |
| ROM Tonnes Type 1 Ore (high grade and medium grade) | 18,147,781 |
| ROM TREO Grade (%) | 1.16 |
| Contained TREO (t) | 210,984 |
| Waste Tonnes | 12,111,852 |
| Tonnes Type 1 Ore (below cut-off grade) | 3,909,565 |
| Tonnes Type 2 Material | 13,274,184 |
| Inferred Tonnes | 11,258,330 |
| Total Waste Tonnes | 40,553,931 |
| Strip Ratio | 2.23 |
A mining schedule was developed, targeting the design plant throughput of 1.0 Mt/a of ore. The mining schedule by year is illustrated in Figure 1.5.
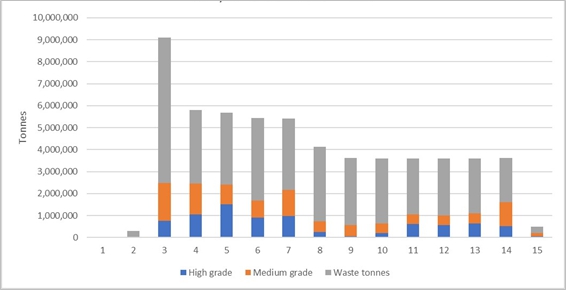
Figure 1.5: Mining Production Profile by Year
| S-K 1300 Technical Report Summary on the Songwe Hill REE Project | Page 37 of 489 |
| |
| 1.6.5 | Mining Operations |
The mining operation at Songwe Hill will be outsourced to a contract mining company. Ore and waste will be drilled and blasted, then excavated using a hydraulic shovel and loaded onto dump trucks for hauling out of the pit to the ROM stockpile or waste dumps.
The mining will be done using 90 t excavators loading into 40 t articulated dump trucks.
| 1.6.6 | Waste Dump and Stockpiles |
The mining of the REE resource at Songwe Hill will produce various grades of ore and waste rock.
The mined materials (excluding high-grade ore) that require storage include the following:
| ● | Waste rock |
| ● | Medium-grade ore |
| ● | Low-grade ore (Type 2 material) |
The high-grade ore will be mined and transported directly from the pit to the ROM pad and blending area.
The positions of the waste dump and stockpiles are shown in Figure 1.6.
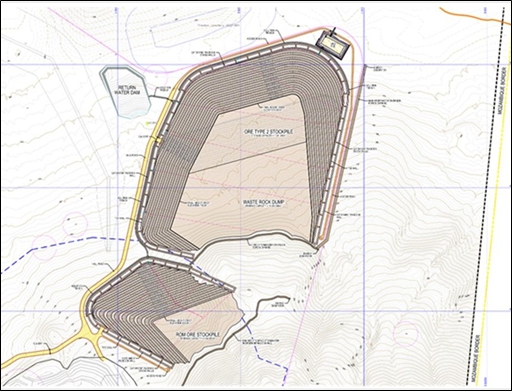
Figure 1.6: Positions of Mined Material Storage Facilities
| S-K 1300 Technical Report Summary on the Songwe Hill REE Project | Page 38 of 489 |
| |
| 1.7 | Mineral Reserve Estimate |
Table 1.6 shows a summary of the total Mineral Reserves.
Table 1.6: Mineral Reserve Summary as at 30 April 2025
| Category | Tonnage (Mt) | TREO (%) | TREO (t) |
| Proven Mineral Reserves | 8.160 | 1.28 | 104,183 |
| Probable Mineral Reserves | 9.988 | 1.07 | 106,801 |
| Total Mineral Reserves | 18.147 | 1.16 | 210,984 |
| NOTE: |
| Totals might not add up due to rounding. |
| Mineral Reserves are stated as tonnages and grades delivered to the processing plant and are inclusive of dilution and mining losses expected during mining. |
| The Mineral Reserve estimate is reported on a 100 % ownership basis. |
| The Mineral Reserve is stated at a cut-off grade of 0.6 % TREO. |
| Ore tonnages are stated at an average in-situ density of 2.76 t/m3. |
| A weighted average process recovery to carbonate of 40 % was used to calculate revenue from Mineral Reserves. |
| 1.8 | Recovery Methods |
| 1.8.1 | Concentrator |
Songwe Hill is an REE deposit in the south-eastern region of Malawi. It comprises mostly carbonaceous gangue minerals and rare earths associated with oxides. Minor amounts of sulphide minerals are also present. The purpose of the concentrator plant or “front end” is to produce an REO concentrate, which is to be treated in a subsequent hydrometallurgical plant.
Flotation of oxide minerals is typically more difficult to achieve than flotation of sulphide minerals, and a defining characteristic of this project has been to develop a flotation circuit and reagent suite that effectively float the REOs from the other oxidic gangue. The key in achieving flotation recovery lies in the combination of fine grinding, high-intensity conditioning, elevated temperature, and the correct reagent suite and dosages.
Continuous flotation test work drove the development of the process design, and the current flotation circuit has been proven to produce good recoveries and concentrate grades. SENET also conducted a trade-off study on the comminution circuit in order to develop a circuit in which a fine grind size can be achieved with optimal OPEX and CAPEX.
The crushing circuit consists of a primary jaw crusher and secondary and tertiary cone crushers. Primary and secondary screens are used to optimise the size of the crushers. The crushed product is milled in a ball mill in closed circuit with a primary cyclone cluster. The cyclone overflow is ground in stirred media mills and classified before being pumped to the flotation circuit.
| S-K 1300 Technical Report Summary on the Songwe Hill REE Project | Page 39 of 489 |
| |
The flotation circuit starts with sulphide pre-float rougher and cleaner cells to remove sulphide minerals ahead of the main REO flotation. Pre-float tails are conditioned and fed into REO roughers and scavengers. The rougher and scavenger concentrate is treated in cleaner cells, and the cleaner concentrate ultimately reports to the concentrate thickener. The cleaner tails are treated in cleaner scavenger cells, and the concentrate is recycled to the rougher scavenger feed. The rougher, scavenger and cleaner scavenger tails report to the tailings thickener and are pumped to a tailings storage facility (TSF).
Figure 1.7 shows the high-level flowsheet of the concentrator plant.
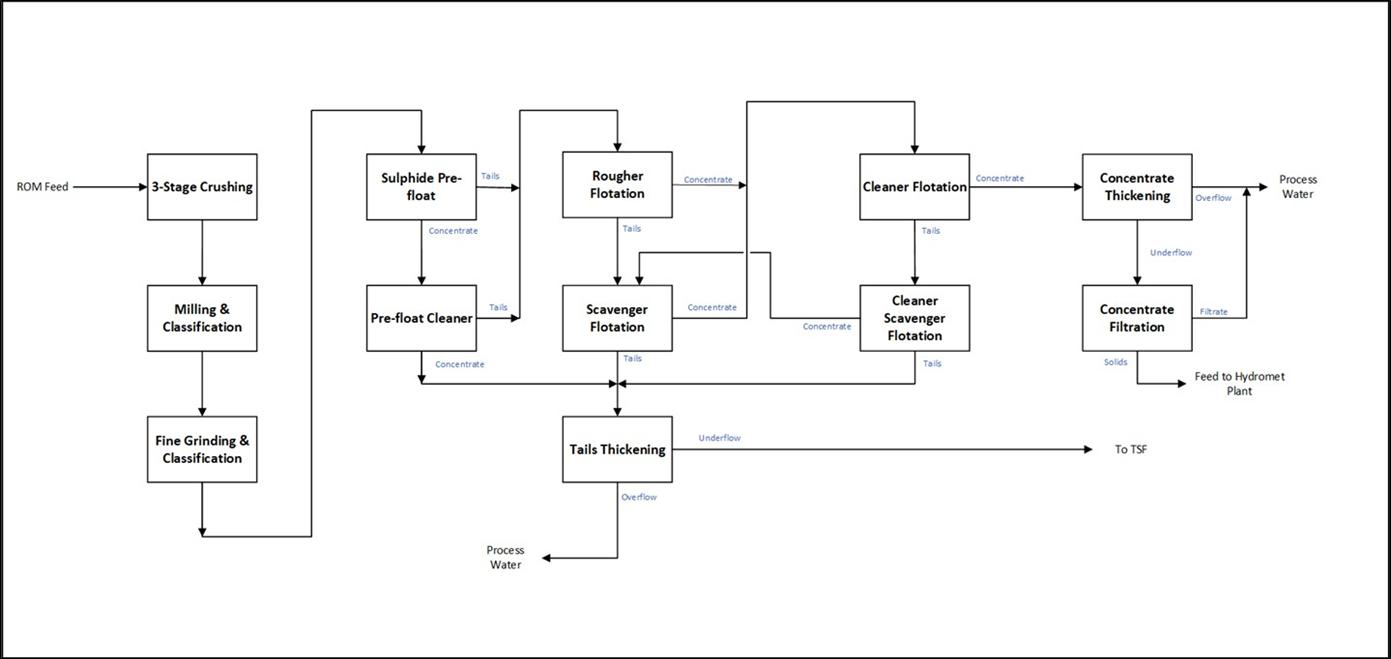
Figure 1.7: Concentrator Plant Flowsheet
| S-K 1300 Technical Report Summary on the Songwe Hill REE Project | Page 40 of 489 |
| |
| 1.8.2 | Process Water Distribution |
The sources of process water are the concentrate thickener overflow, tailings thickener overflow, the raw water top-up, and TSF return water. Process water is used in milling and the flotation circuits for dilution, launder spray water, flushing, hosing, and screen washing applications. Process water from the flotation concentrate thickener and flotation tails thickener is still at the flotation temperature – approximately 50 °C. This thickener overflow is not sent to the TSF because of the contained heat that will be lost. Instead, it is stored in a separate pond with an interchange heat exchanger to salvage heat from the incoming solution and transfer it to the process water stream being pumped to the milling and flotation circuit.
The following solution streams are sent to the TSF:
| ● | Moisture with the flotation tails slurry |
| ● | Moisture with the hydrometallurgical plant waste residue filter cakes |
| ● | Barren solution from rare earth carbonate precipitation (containing chlorides and ammonium) |
The TSF is lined and sized to accommodate the impurities present in the above-mentioned moisture streams based on the geochemical characterisation performed by SGS.
The TSF return stream to the process water pond has the ability to be wholly or partially fed through a reverse osmosis plant, which will prevent the build-up of deleterious elements in recirculating water streams from the plant. Impurities that build up in the process water stream with repeated circulation in the flotation circuit will also be removed in the process water reverse osmosis plant, as will any impurities present in the borehole water entering the system as top-up to accommodate moisture losses in the processing plant.
The SENET mass balance has included hydrological studies from the environmental and tailings consultants to determine the level to which elements such as chlorine and ammonium will build up in the TSF return water stream.
During the next phase of study, options will be evaluated to further reduce the recirculating chloride and ammonium quantities, with the possibility of regenerating reagents for reuse in the plant or for sale to external customers.
| 1.8.3 | Hydrometallurgical Plant |
The hydrometallurgical plant receives the flotation concentrate from the flotation plant and treats it with an up-front gangue leach to dissolve the acid-consuming gangue minerals with dilute acid to decrease the overall acid consumption and to reduce the impurity carry-over to the purification and recovery stages. Gangue leach liquor is purified to precipitate impurities, filtered, and dosed with calcium chloride and sulphuric acid to regenerate hydrochloric acid and produce solid gypsum for possible sale.
Gangue leach residue is contacted with concentrated sodium hydroxide (NaOH) solution at a high temperature in order to convert insoluble rare earth phosphates and other minerals into soluble rare earth hydroxides in the caustic conversion. The caustic conversion residue proceeds to cerium oxidation, where the slurry is sparged with air to oxidise cerium and render it insoluble in the subsequent rare earth leach. This is because cerium is an undesirable element in the final rare earth product. The caustic conversion solution is evaporated to reconcentrate it and then undergoes a causticisation process to regenerate sodium hydroxide for reuse in the process.
| S-K 1300 Technical Report Summary on the Songwe Hill REE Project | Page 41 of 489 |
| |
Cerium oxidation residue is thickened and filtered before being fed into a more severe rare earth leach with hydrochloric acid. The leach residue is thickened and filtered before being repulped in the hydrometallurgical tails neutralisation area and then combined with flotation and other hydrometallurgical tails streams to be sent to the TSF. Gypsum generated from the process as waste, is filtered, dried and sold to cement and allied industries. Rare earth leach liquor is purified of heavy metals, radionuclides and uranium, before being precipitated as an MREC product.
Figure 1.8 shows the high-level flowsheet of the hydrometallurgical plant.
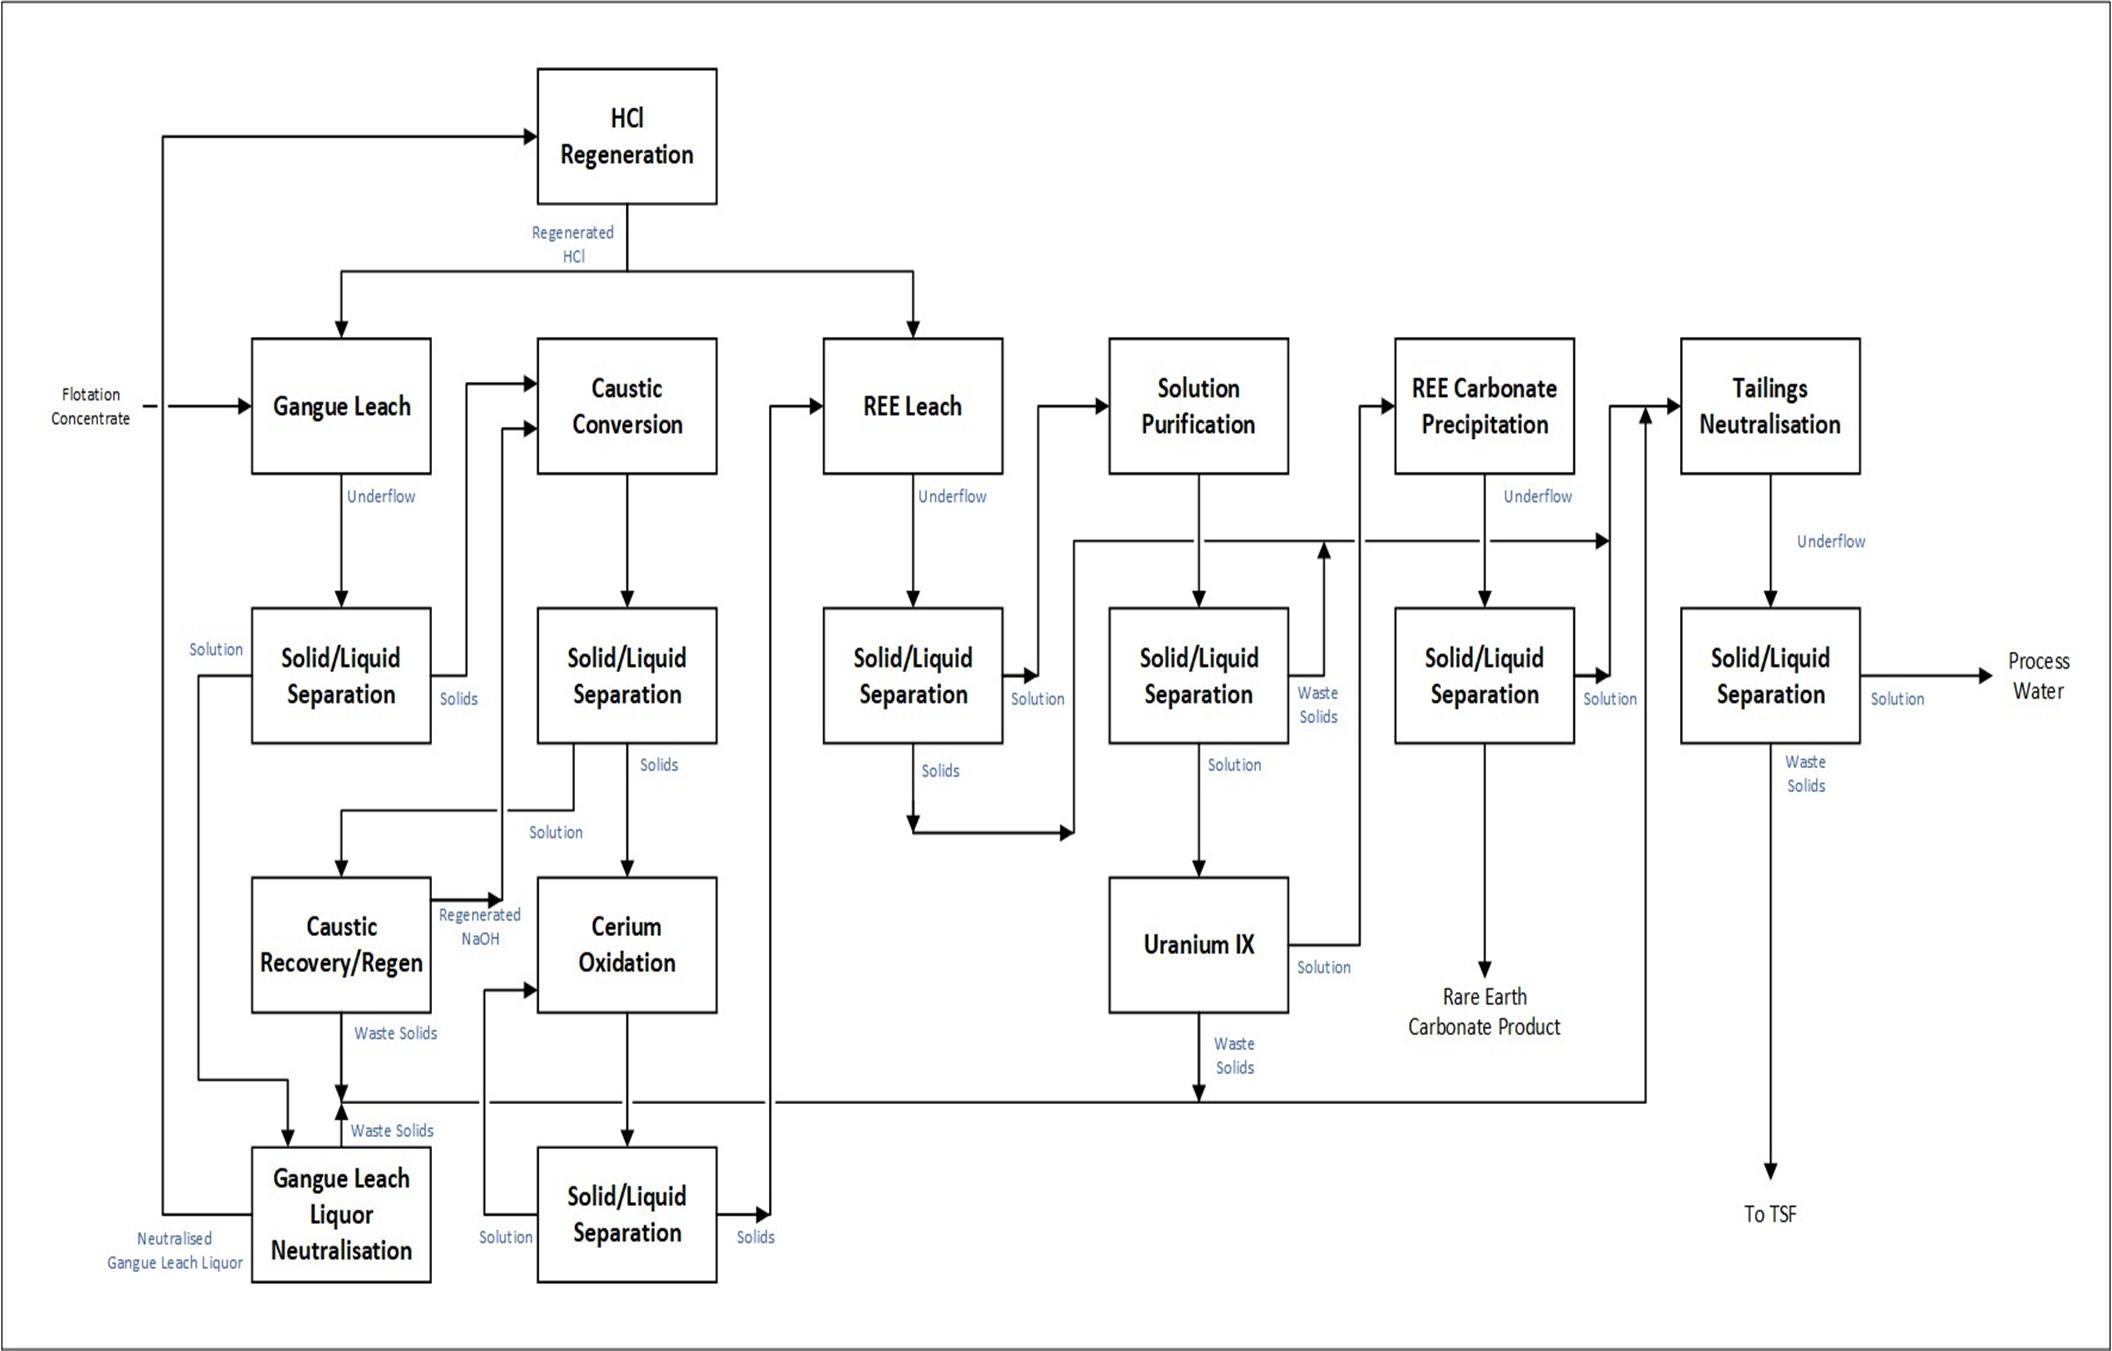
Figure 1.8: Hydrometallurgical Plant Flowsheet
| S-K 1300 Technical Report Summary on the Songwe Hill REE Project | Page 42 of 489 |
| |
| 1.9 | Capital and Operating Costs |
| 1.9.1 | Capital Costs |
The CAPEX estimate includes engineering, procurement, construction, start-up and cold commissioning for the mining, process plant, TSF and infrastructure. Provision has also been made for the Owner’s costs.
The estimate is within the required accuracy level of ± 10 %. The estimate covers the direct field costs of executing the project; the indirect costs associated with the design, construction and commissioning of the new facilities; and the Owner’s support costs for items such as management teams, operational staff, environmental costs, permitting, insurance and utilities such as water supply, photovoltaic (PV) solar power and emergency power generation.
The total initial/development CAPEX for the Songwe Hill REE Project is estimated to be US$325,518,913, which includes project execution, engineering, procurement and construction management (EPCM), and contingency costs. The initial/development CAPEX is summarised in Table 1.7.
Table 1.7: Initial/Development CAPEX Summary
| Description | CAPEX | Contingency | Total CAPEX |
| US$ | US$ | US$ | |
| Earthworks | 8,151,015 | 776,287 | 8,927,303 |
| Civil Works – Plant | 19,667,422 | 1,873,088 | 21,540,510 |
| Civil Works – Infrastructure | 2,068,686 | 197,018 | 2,265,704 |
| Infrastructure | 2,918,556 | 138,979 | 3,057,535 |
| Structural Steel | 6,345,323 | 423,022 | 6,768,345 |
| Plate Work | 2,658,354 | 177,224 | 2,835,578 |
| Tankage | 4,332,050 | 322,047 | 4,654,097 |
| Machinery and Equipment | 52,477,378 | 2,894,436 | 55,371,814 |
| Piping | 5,404,822 | 557,332 | 5,962,154 |
| Valves | 1,708,249 | 176,150 | 1,884,399 |
| Electricals | 12,266,339 | 676,561 | 12,942,899 |
| Instrumentation | 4,887,810 | 504,019 | 5,391,829 |
| Transport | 5,354,754 | 600,116 | 5,954,870 |
| Electrical and instrumentation (E&I) Installation | 7,513,682 | 715,589 | 8,229,270 |
| Structural, mechanical, plate work and piping (SMPP) Installation | 27,828,259 | 2,650,310 | 30,478,569 |
| TOTAL DIRECT FIELD COSTS | 163,395,391 | 12,869,485 | 176,264,875 |
| Commissioning Spares | 261,004 | 39,151 | 300,155 |
| Two-Year Operational Spares | 1,887,855 | 283,178 | 2,171,033 |
| S-K 1300 Technical Report Summary on the Songwe Hill REE Project | Page 43 of 489 |
| |
| Description | CAPEX | Contingency | Total CAPEX |
| US$ | US$ | US$ | |
| Insurance and Critical Spares | 2,207,202 | 331,080 | 2,567,541 |
| Vendor Services | 3,102,209 | 465,331 | 3,567,541 |
| First Fills | 644,483 | 96,672 | 741,155 |
| TOTAL INDIRECT FIELD COSTS | 8,102,753 | 1,215,413 | 9,318,166 |
| TOTAL FIELD COST | 171,498,144 | 14,084,898 | 185,583,042 |
| Project Management (EPCM) | 24,438,573 | 3,665,786 | 28,104,359 |
| Insurances and Guarantees | 3,290,594 | 0 | 3,290,594 |
| TOTAL EPCM COSTS | 27,729,167 | 3,665,786 | 31,394,953 |
| TOTAL PROJECT COST | 199,227,311 | 17,750,684 | 216,977,994 |
| Mobile Plant and Equipment | 3,899,263 | 584,889 | 4,484,152 |
| Generator Plant | 7,229,334 | 328,606 | 7,557,940 |
| PV Solar Plant | 13,545,135 | 1,459,305 | 15,004,440 |
| Construction Camp | 3,150,217 | 472,533 | 3,622,749 |
| TSF Phase 1 and Return Water Dam (RWD) | 43,814,395 | 4,381,439 | 48,195,834 |
| Mining Pre-Production | 14,428,214 | 2,164,232 | 16,592,446 |
| Other | 12,460,340 | 623,017 | 13,083,357 |
| TOTAL OTHER COST | 98,526,897 | 10,014,022 | 108,540,919 |
| TOTAL INITIAL COST | 297,754,208 | 27,764,705 | 325,518,913 |
The total sustaining CAPEX for the Songwe Hill REE Project is estimated to be US$91,455,525, which includes TSF, mining, Owner’s cost, closure cost and contingency costs. The sustaining CAPEX is summarised in Table 1.8.
Table 1.8: Sustaining CAPEX Summary
| Description | CAPEX | Contingency | Total CAPEX |
| US$ | US$ | US$ | |
| TSF Sustaining Capital – Phases 2 to 5 | 60,236,066 | 6,023,507 | 66,258,573 |
| Mining Sustaining Capital | 532,531 | 79,880 | 612,411 |
| Closure Cost | 16,675,138 | 1,026,618 | 17,701,756 |
| Owner’s Cost | 6,257,078 | 625,708 | 6,882,785 |
| TOTAL SUSTAINING COST | 83,699,813 | 7,755,712 | 91,455,525 |
| S-K 1300 Technical Report Summary on the Songwe Hill REE Project | Page 44 of 489 |
| |
| 1.9.2 | Operating Costs |
The purpose of this OPEX estimate is to provide operating costs, and the associated general and administration (G&A) costs, to an accuracy of ± 10 % that can be used for the economic analysis of the Songwe Hill REE Project.
The Project’s annual OPEX estimate for the first five years of production consists of the following:
| ● | Mining OPEX estimated by Bara |
| ● | Process plant OPEX estimated by SENET |
| ● | TSF OPEX estimated by Epoch |
The OPEX for the first five years of production for the Songwe Hill REE Project is summarised in Table 1.9, with the cost distribution shown in Figure 1.9.
Table 1.9: Five Years of Production OPEX Summary
| Description | Cost | Cost Distribution | |||
| US$ /a | US$/t ROM | US$/t REE | US$/t REO | % | |
| Mining | 32,308,320 | 32.31 | 6,357.03 | 5,426.23 | 24.5 |
| General and Administration | 11,099,892 | 11.10 | 2,184.03 | 1,864.24 | 8.4 |
| Reagents and Consumables | 64,155,703 | 64.16 | 12,623.36 | 10,775.05 | 48.7 |
| Power | 17,198,278 | 17.20 | 3,383.96 | 2,888.48 | 13.1 |
| Maintenance/Spares | 3,157,232 | 3.16 | 621.22 | 530.26 | 2.4 |
| Personnel | 854,788 | 0.85 | 168.19 | 143.56 | 0.6 |
| Site Laboratory | 1,054,104 | 1.05 | 207.41 | 177.04 | 0.8 |
| Product Transport | 1,231,960 | 1.23 | 242.40 | 206.91 | 0.9 |
| TSF | 650,000 | 0.65 | 127.89 | 109.17 | 0.5 |
| TOTAL | 131,710,278 | 131.71 | 25,915.48 | 22,120.94 | 100 |
| S-K 1300 Technical Report Summary on the Songwe Hill REE Project | Page 45 of 489 |
| |
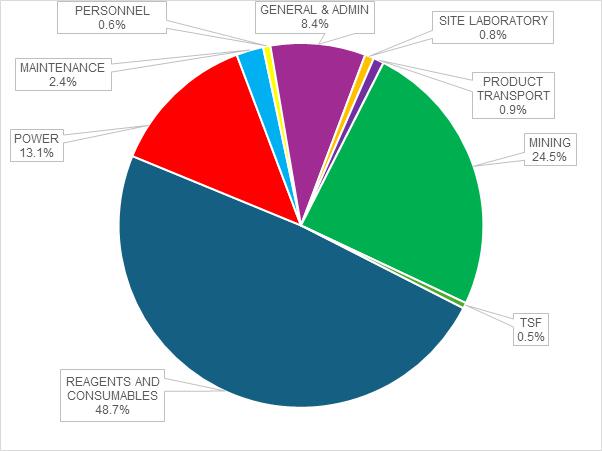
Figure 1.9: OPEX Distribution
| 1.10 | Market Studies and Contracts |
| 1.10.1 | Rare earth market outlook |
The rare earth market and forecast information has been compiled by Adamas Intelligence Inc. (Adamas), an independent research and advisory firm contracted by MKAR to forecast long-term supply, demand and prices for REEs as well as emerging trends in the market.
Compared to similarly abundant elements in nature, such as copper, lead, and tin, global annual production of rare earth elements is notably low.
Nevertheless, rare earth elements have become critical enablers of technologies at the heart of clean energy initiatives worldwide, as well as ubiquitous gadgetry and electronics that have pervaded modern society.
Rare earth elements are used in small, but often necessary, amounts in hundreds of different technologies, materials, and chemicals worldwide for commercial, industrial, social, medical, and environmental applications.
In just a period of decades, rare earth elements have seeped deeply into the fabric of modern technology and industry and have proven exceptionally challenging to duplicate or replace.
| S-K 1300 Technical Report Summary on the Songwe Hill REE Project | Page 46 of 489 |
| |
Despite the misleading moniker, rare earth elements are not remarkably rare in nature, but rather are rarely concentrated into economically significant amounts for extraction and processing owing to certain physical and chemical characteristics that promote their broad dissipation in most rock types.
Rare earth elements are used in hundreds of unique end-uses and applications that collectively fall into one of eight end-use categories: 1.) Battery Alloys, 2.) Catalysts, 3.) Ceramics, Pigments and Glazes, 4.) Glass Polishing Powders and Additives, 5.) Metallurgy and Alloys, 6.) Permanent Magnets, 7.) Phosphors, and 8.) Other End-Uses and Applications.
By volume, permanent magnets and catalysts were collectively responsible for 70 % of global TREO consumption in 2024. However, by value, permanent magnets alone were again responsible for over 95 % of the total value of global TREO consumption last year and this share continues to expand further as demand for (and prices of) neodymium, praseodymium, didymium, dysprosium and terbium continue to outperform.
Not only does demand for neodymium, praseodymium, didymium, dysprosium and terbium collectively make up the majority of global value today, but in the years ahead demand for these four rare earth elements will continue to grow faster than demand for all other rare earth elements, challenging the ability of the supply-side to keep up.
| 1.10.2 | Forecasted TREO Demand by End-Use Category |
After rising 9.4 % last year, Adamas forecasts that global TREO demand will increase at a compound annual growth rate (CAGR) of 6.1 % going forward, from 234,000 tonnes in 2024 to 607,000 tonnes in 2040, driven primarily by the permanent magnet sector (see Figure 1.10).
In the years ahead, global TREO demand for permanent magnets is projected to rise at a market leading CAGR of 8.5 %, driven by double-digit demand growth for applications involving electric mobility, robotics, advanced air mobility and more (see Figure 1.10).
Conversely, over the forecast period, global TREO demand for all other end-use categories, except for phosphors, are projected to grow at market lagging CAGRs of 0 % to 6 %, while TREO demand for phosphors is projected to fall at a CAGR of -5.7 % (see Figure 1.10).
In the years ahead, the rapid TREO demand growth expected for permanent magnets will lead the end-use category to continuously absorb market share from incumbent categories.
By 2035, Adamas projects that permanent magnets will drive 66 % of global TREO demand by volume and over 95 % of the market’s value each year.
| S-K 1300 Technical Report Summary on the Songwe Hill REE Project | Page 47 of 489 |
| |

Figure 1.10: Historical global consumption and forecasted demand for TREO by end-use category
After an estimated 14.4 % increase in 2024, Adamas forecasts that global TREO demand for permanent magnets will rise at a CAGR of 8.5 % going forward, from 121,000 tonnes in 2024 to 447,000 tonnes in 2040, boosted by strong demand growth from electric vehicles, robotics, advanced air mobility and other applications of NdFeB magnets.
Specifically, from 2024 through 2040 Adamas forecasts that global TREO demand for passenger EV traction motors, commercial EV traction motors and “other e-mobility” applications will collectively increase at a CAGR of 8.9 %, together representing the single largest demand driver by 2040.
Similarly, from 2024 through 2040 Adamas forecasts that global TREO demand for industrial robots, consumer service robots and professional service robots will collectively increase at a CAGR of 25.4 %, poised to collectively overtake EV motors in the decade to follow.
Moreover, from 2024 through 2040 Adamas projects that global TREO demand for applications involving advanced air mobility (AAM), including consumer drones, commercial drones, electric vertical take-off and landing (eVTOL) aircraft, and more, will increase at a CAGR of 16.1 % to become one of the largest end use categories by the end of the forecast period.
Additionally, from 2024 through 2040 Adamas projects that global TREO demand for direct drive and hybrid direct drive wind power generators for onshore and offshore applications will rise at a CAGR of 8.2 % as the competitive economics of wind power generation (and low maintenance of hybrid and direct drive generators) continue to spur growing adoption.
Lastly, from 2024 through 2040 Adamas forecasts that global TREO demand for all other end-uses and applications of NdFeB permanent magnets will increase at CAGRs of 3.5 % to 7.3 %, leading some sectors to forgo market share to electric vehicles, robotics and other high-growth applications.
| S-K 1300 Technical Report Summary on the Songwe Hill REE Project | Page 48 of 489 |
| |
| 1.10.3 | Rare Earth Price Forecasts |
Adamas analysed the historical relationship between the rare earth chemical concentrate and REO prices in China to forecast the value of the mixed rare earth carbonate (MREC) produced at Mkango’s Songwe Hill Project in Malawi. Adamas forecasted annual average prices for each rare earth oxide to 2040 under multiple scenarios.
In all scenarios examined, Adamas projects that critical magnet rare earth oxides (i.e. neodymium, praseodymium, dysprosium and terbium) will collectively drive over 93 % of the Songwe Hill Project basket value on average each year from 2025 through 2040.
Figure 1.11 below shows the relative distribution of rare earth oxides contained in MREC produced from the Songwe Hill project. By volume, the four critical magnet rare earth oxides (neodymium, praseodymium, dysprosium and terbium) make up 34.0 % of the TREO contained in the MREC.
| Oxide | Relative % | 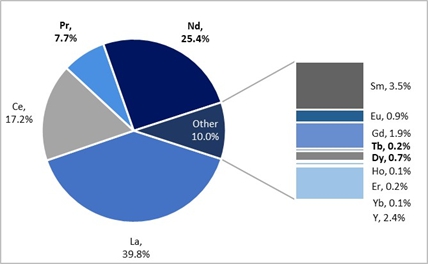 |
| La | 39.8 % | |
| Ce | 17.2 % | |
| Pr | 7.7 % | |
| Nd | 25.4 % | |
| Sm | 3.5 % | |
| Eu | 0.9 % | |
| Gd | 1.9 % | |
| Tb | 0.2 % | |
| Dy | 0.7 % | |
| Ho | 0.1 % | |
| Er | 0.2 % | |
| Tm | 0.0 % | |
| Yb | 0.1 % | |
| Lu | 0.0 % | |
| Y | 2.4 % | |
| TREO | 100.0 % |
Figure 1.11: Relative distribution of rare earth oxides in Songwe Hill Project product basket
Figure 1.12 below shows the forecasted per-REO contribution to the Songwe Hill MREC in 2030 based on Adamas’ Base Case scenario. By value, the four critical magnet rare earth oxides (neodymium, praseodymium, dysprosium and terbium) are projected to drive 92.8 % of the project’s basket value in 2030, a proportion that will go largely unchanged over the forecast period.
| S-K 1300 Technical Report Summary on the Songwe Hill REE Project | Page 49 of 489 |
| |
| Oxide | Relative % | 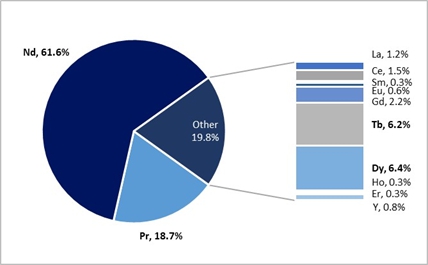 |
| La | 1.2 % | |
| Ce | 1.5 % | |
| Pr | 18.7 % | |
| Nd | 61.6 % | |
| Sm | 0.3 % | |
| Eu | 0.6 % | |
| Gd | 2.2 % | |
| Tb | 6.2 % | |
| Dy | 6.4 % | |
| Ho | 0.3 % | |
| Er | 0.3 % | |
| Tm | 0.0 % | |
| Yb | 0.0 % | |
| Lu | 0.0 % | |
| Y | 0.8 % | |
| TREO | 100.0 % |
Figure 1.12: Per-REO contribution to Songwe Hill Project basket value in 2030
Taking Adamas’ Base Case price forecasts into account, along with the relative distribution of rare earth oxides in Songwe Hill production (see Figure 1.11), the project basket value (i.e. value of rare earth oxides contained in one kilogram of separated TREO produced from the Project) was projected for each year from 2025 through 2040, as shown in Figure 1.13 below.
In Adamas’ Base Case and Upside price forecast scenarios, the Songwe Hill project basket value will increase overall from 2025 through 2040 at a CAGR of 5.2 % and 6.0 % respectively.
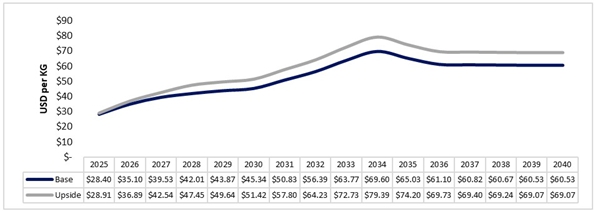
| * | Forecasted prices in Real 2025 dollars |
Figure 1.13: Forecasted Songwe Hill basket value from 2025 through 2040
Inferring from the price of comparable MREC concentrates sold in China along with the specific composition and purity of Songwe Hill MREC, Adamas believes MKAR could expect to receive a price for its MREC equal to 75 % of the rare earth oxide value it contains.
| S-K 1300 Technical Report Summary on the Songwe Hill REE Project | Page 50 of 489 |
| |
In its Base Case price forecast scenario, Adamas projects that the value of Songwe Hill MREC will amount to US$11.72 per kilogram in 2025 and will increase to US$28.71 per kilogram in 2034 then decline gradually to US$24.97 per kilogram by 2040, led by comparable movements in magnet rare earth prices.
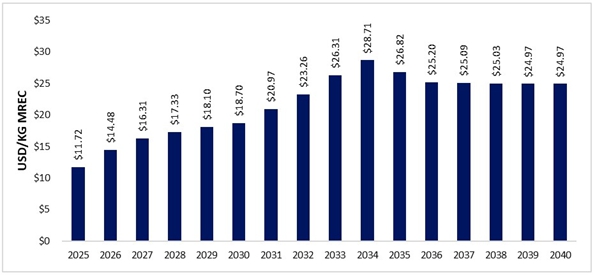
* Prices in USD per kilogram of MREC; MREC contains 55.0 weight % TREO
* Value based on forecasted China export (FOB) prices
* Forecast in Real 2025 dollars
Figure 1.14: Forecasted value of Songwe Hill MREC from 2025 through 2040
| 1.11 | Economic Analysis |
A discounted cash flow (DCF) model prepared by MKAR was reviewed by SENET and a third party and incorporates the LOO plan figures, economic assumptions as to the US inflation rates, and the REO and carbonate prices based on the Adamas forecast. The escalation/de-escalation technique has been employed to ensure that the quantum and timing of any taxes payable are calculated correctly. The financial evaluation has been undertaken on an after-tax, unleveraged basis.
A range of discount rates were used to determine the NPV; the NPVs are set at 30 June 2025.
A sensitivity analysis shows the impact on the NPV and internal rate of return (IRR) to changes in the metal prices, CAPEX, and OPEX.
Mkango’s proposed Puławy separation plant in Poland, developed with Grupa Azoty Puławy, will process the Songwe Hill MREC into separated oxides. For the financial modelling, it is assumed that Songwe Hill’s carbonate will be sold to the proposed Puławy separation plant at 85 % of the contained REO value (a 15 % discount to the basket value), reflecting internal transfer pricing and ensuring balanced margins between the mine and refinery operations.
The acid regeneration process in the hydrometallurgical plant flowsheet will produce calcium sulphate (gypsum) as a by-product. 77,000 t/a of calcium sulphate (dihydrate) residue will be produced. Based on the chemical analyses conducted by the Australian Nuclear Science and Technology Organisation (ANSTO), the gypsum grade as CaSO4·2H2O exceeds the grade of +90 %, which is a very high-quality grade. This grade is suitable for cement manufacturing. In August 2025, Mkango obtained a delivered-to-Blantyre quote from Kemcore for 25,000 t of gypsum dihydrate at US$210/t. Applying a 28 % discount yields an assumed selling price of US$150/t for MKAR’s by-product, which is applied in the economic analysis of the project.
| S-K 1300 Technical Report Summary on the Songwe Hill REE Project | Page 51 of 489 |
| |
The mining and processing inputs to the financial model are summarised in Table 1.10 to Table 1.12.
Table 1.10: Summary of Mining and Processing Inputs and Results – Average over First Five Years
| Item | Unit | Value |
| Mining | ||
| Average yearly ore mined | kt | 2,186 |
| Average TREO grade mined | % | 1.19 |
| Average yearly waste mined | kt | 3,667 |
| Average strip ratio (waste to ore) | 1.68 | |
| Processing | ||
| Average yearly flotation plant feed | kt | 1,000.8 |
| Average head TREO grade | % | 1.50 |
| Flotation TREO concentrate grade | % | 15.05 |
| Average TREO recovery to concentrate | % | 74.10 |
| Average yearly flotation concentrate feed to hydrometallurgical plant | kt | 74.06 |
| Average NdPr oxide hydrometallurgical recovery to carbonate | % | 85.26 |
| Average Ce oxide hydrometallurgical recovery to carbonate | % | 20.88 |
| Average yearly TREOs in carbonate product | kt | 5,954 |
| Average carbonate TREO grade | % | 55 |
| Average yearly carbonate production | t/a | 10,826 |
| NOTE: The first five years refer to the 60 months from the start of processing in January 2030. Mining excludes the first five months of mined and stockpiled ore prior to the start of processing (819,437 t above 1.00 % TREO). | ||
Table 1.11: Summary of Mining and Processing Inputs and Results – LOO
| Item | Unit | Value |
| LOO | Years | 18 |
| Mining | ||
| Average yearly ore mined | kt | 1,481.5 |
| Average TREO grade mined | % | 1.16 |
| S-K 1300 Technical Report Summary on the Songwe Hill REE Project | Page 52 of 489 |
| |
| Item | Unit | Value |
| Average yearly waste mined | kt | 3,310.5 |
| Average strip ratio (waste to ore) | 2.2 | |
| Processing | ||
| Average yearly flotation plant feed | kt | 1,000.80 |
| Average head TREO grade | % | 1.16 |
| Flotation TREO concentrate grade | % | 11.64 |
| Average TREO recovery to concentrate | % | 74.10 |
| Average yearly flotation concentrate feed to hydrometallurgical plant | kt | 74.06 |
| Average NdPr oxide hydrometallurgical recovery to carbonate | % | 85.26 |
| Average Ce oxide hydrometallurgical recovery to carbonate | % | 20.88 |
| Average yearly TREOs in carbonate product | t | 4,633.56 |
| Average carbonate TREO grade | % | 55.00 |
| Average yearly carbonate production (dry basis) | t | 8,424.65 |
Table 1.12: Summary of Mining and Processing Inputs and Results – Total LOO
| Item | Unit | Value |
| Mining | ||
| Total LOO ore production | kt | 18,147.8 |
| Waste mined | kt | 40,553.9 |
| Strip ratio (waste to ore) | 2.2 | |
| Total LOO plant feed | kt | 18,127.0 |
| Average yearly plant feed | kt | 982.0 |
| Processing | ||
| Tonnes to hydrometallurgical plant | kt | 1,341.4 |
| Contained REOs in carbonate product | kt | 83.4 |
| Total carbonate production (dry basis) | t | 151,644 |
| 1.11.1 | Capital and Operating Costs |
The CAPEX and OPEX inputs to the financial model are summarised in Table 1.13 to Table 1.15.
Table 1.13: Capital Costs
| Item | Unit | Value |
| Total real development capital | US$ million | 297.8 |
| Contingency | US$ million | 27.8 |
| Total Real Development Capital Including Contingency | US$ million | 325.5 |
| Sustaining capital and reclamation | US$ million | 91.5 |
| Total Real CAPEX | US$ million | 417.0 |
| S-K 1300 Technical Report Summary on the Songwe Hill REE Project | Page 53 of 489 |
| |
Table 1.14: Operating Costs – Average over First Five Years
| Item | Unit | Value |
| Mining | US$/kg TREO | 5.4 |
| Beneficiation – Milling and Flotation | US$/kg TREO | 9.1 |
| Hydrometallurgical Plant | US$/kg TREO | 5.2 |
| G&A and Other | US$/kg TREO | 2.5 |
| Total OPEX | US$/kg TREO | 22.3 |
Table 1.15: Operating Costs – Average over LOO
| Item | Unit | Value |
| Mining | US$/kg TREO | 4.4 |
| Beneficiation – Milling and Flotation | US$/kg TREO | 11.6 |
| Hydrometallurgical Plant | US$/kg TREO | 6.8 |
| G&A and Other | US$/kg TREO | 3.2 |
| Total OPEX | US$/kg TREO | 26.1 |
| 1.11.2 | Discounted Cash Flow Valuation Analysis |
Based on the preceding assumptions, the DCF valuation analysis for the base case gave the following results:
| ● | NPV at 10 % (nominal) (7.3 % real) of US$339 million as at 30 June 2025 |
| ● | IRR of 24.32 % (nominal) (21.28 % real) |
Table 1.16 and Table 1.17 summarise selected financial inputs and the corresponding results. All costs are quoted in real July 2025 United States dollars.
Table 1.16: Summary of Selected Financial Inputs and Corresponding Results – Post-Tax Valuation
| Item | Unit | Value |
| Post-tax project cash flow (nominal) (including royalty) | US$ million | 1,554.0 |
| Payback period from project start | Years | 5.9 |
| Payback period from start of production | Years | 3.4 |
| Post-tax NPV at 10 % (nominal) discount rate | US$ million | 339.5 |
| Post-tax IRR (nominal) | % | 24.32 |
| S-K 1300 Technical Report Summary on the Songwe Hill REE Project | Page 54 of 489 |
| |
Table 1.17: NPVs of Songwe Hill Project1
| Financial Evaluation |
Nominal
Discount Rate (%) |
Real Discount Rate (%) |
Adamas
Base Case Post-Tax NPV (US$ million) |
Adamas Upside Case Post-Tax NPV (US$ million) |
| 8.0 | 5.37 | 461.2 | 644.8 | |
| Base Case | 10.0 | 7.32 | 339.5 | 488.5 |
| 12.0 | 9.27 | 247.3 | 369.8 | |
| Nominal IRR | 24.32 % | 29.30 % | ||
| Real IRR | 21.28 % | 26.14 % | ||
| 1 As at 30 June 2025 | ||||
| 1.11.3 | Sensitivity Analysis |
The sensitivity chart (see Figure 1.15) shows the nominal NPV at a 10 % variation for the base case due to changes in revenue, CAPEX and OPEX, holding all other inputs constant. The project is most sensitive to metal prices and more sensitive to OPEX than to CAPEX. The revenue sensitivity assumes that all rare earth metal prices change by the same percentage and that the tolling rate does not change with rare earth prices.
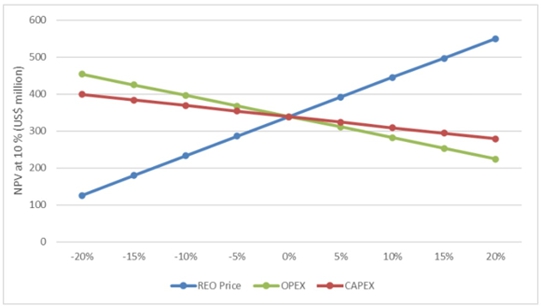
Figure 1.15: NPV at 10 % Nominal Sensitivity Analysis
| S-K 1300 Technical Report Summary on the Songwe Hill REE Project | Page 55 of 489 |
| |
Figure 1.16 shows the nominal annual cash flows over the life of the project.

Figure 1.16: Annual Cash Flow (Nominal)
The maximum negative cash flow of US$211 million (nominal) occurs in 2028 as shown in Figure 1.16. The cumulative annual cash flow (nominal) is shown in Figure 1.17.
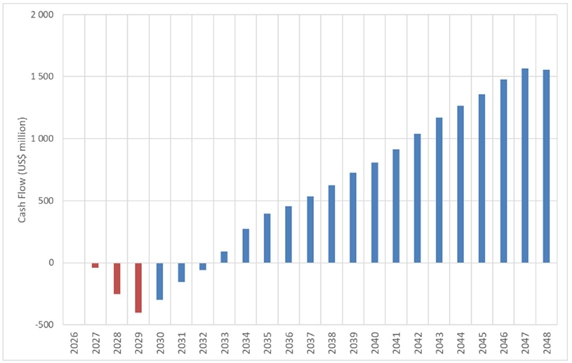
Figure 1.17: Cumulative Annual Cash Flow (Nominal)
| S-K 1300 Technical Report Summary on the Songwe Hill REE Project | Page 56 of 489 |
| |
| 1.12 | Conclusions |
Since Mkango and MKAR have become involved in the Songwe Hill Project, considerable effort has been made and expenditure has been incurred to certify what is now a significant rare earth resource and reserve at Songwe Hill. This TRS confirms the extensive amount of exploration, tests and study work carried out on the project. It is believed that the level of accuracy used herein is sufficient to consider this TRS to be definitive with its demonstration of a viable rare earth resource at Songwe Hill that will exploit the current reserve over an 18-year LOO.
Mineral Resources have been classified in accordance with the S-K 1300 definitions, which are consistent with the CIM (2014) definitions. Mineral Resources may be reported on an Exclusive basis, which is the standard for S-K 1300, or on an Inclusive basis under other minerals reporting standards. Exclusive Mineral Resources are reported after the removal of the portion that was converted to Mineral Reserves, whereas Inclusive Mineral Resources include the portion that was converted to Mineral Reserves. Mkango’s disclosure of the Songwe Hill Mineral Resource has until now been on an Inclusive basis in accordance with NI 43-101. Both Exclusive and Inclusive Mineral Resources are reported in this TRS, with Exclusive Mineral Resources presented as per the S-K 1300 standards and Inclusive Mineral Resources presented to be consistent with those reported by Mkango under the NI 43-101 standards.
The Mineral Resource is classified into the Measured, Indicated and Inferred categories as summarised in Table 1.18 for the Mineral Resource reported excluding the resources converted to Mineral Reserves, as per the S-K 1300 standards, and in Table 1.19 for the Mineral Resource reported including the resources converted to Mineral Reserves.
The Mineral Resource is reported at a base case TREO cut-off grade of 0.55 % from within an optimised pit shell, which the QP considers will satisfy reasonable prospects for economic extraction.
Table 1.18: Songwe Hill, Exclusive Mineral Resources above 0.55 % TREO Grade, 30 June 2025
| Category | Tonnes (Mt) |
TREO (%) |
TREO
Tonnes (kt) |
| Measured | 0.7 | 0.98 | 7 |
| Indicated | 3.4 | 1.05 | 36 |
| Total Measured and Indicated | 4.1 | 1.04 | 43 |
| Inferred | 55.9 | 1.05 | 589 |
| NOTES: | |
| 1. | Mineral Resources have been classified in accordance with the S-K 1300 definitions, which are consistent with the CIM (2014) definitions. |
| 2. | All tabulated data has been rounded, and as a result minor computational errors may occur. |
| 3. | Mineral Resources, which are not Mineral Reserves, have no demonstrated economic viability. |
| 4. | The Mineral Resource estimate is reported on a 100 % ownership basis. |
| 5. | Mineral Resources are reported from within an optimised pit shell. |
| 6. | For the purposes of assessing reasonable prospects for economic extraction and cut-off grade, metallurgical recoveries were applied to individual rare earth oxides. The average total rare earth oxide metallurgical recovery is 39.6 %. |
| 7. | Mineral Resources exclude the portion converted to Mineral Reserves. |
| 8. | Mineral Resources are reported on an in-situ basis without applying modifying factors. |
| 9. | A mean density of 2.73 t/m3 was applied for Measured, 2.67 t/m3 for Indicated and 2.77 t/m3 for Inferred Resources. |
| TREO = La2O3, CeO2, Pr6O11, Nd2O3, Sm2O3, Eu2O3, Gd2O3, Tb4O7, Dy2O3, Ho2O3, Er2O3, Tm2O3, Yb2O3, Lu2O3, and Y2O3 | |
| S-K 1300 Technical Report Summary on the Songwe Hill REE Project | Page 57 of 489 |
| |
Inclusive Mineral Resources are presented in order to be consistent with those reported by Mkango under the NI 43-101 standards and are not compliant with the S-K 1300 reporting standards.
Table 1.19: Songwe Hill, Inclusive Mineral Resources above 0.55 % TREO Grade, 30 June 2025
| Category | Tonnes (Mt) |
TREO (%) |
TREO
Tonnes (kt) |
| Measured | 13.6 | 1.27 | 173 |
| Indicated | 24.4 | 1.08 | 264 |
| Total Measured and Indicated | 38.1 | 1.15 | 437 |
| Inferred | 55.9 | 1.05 | 589 |
| NOTES: | |
| 1. | Mineral Resources have been classified in accordance with the S-K 1300 definitions, which are consistent with the CIM (2014) definitions. |
| 2. | All tabulated data has been rounded, and as a result minor computational errors may occur. |
| 3. | Mineral Resources, which are not Mineral Reserves, have no demonstrated economic viability. |
| 4. | The Mineral Resource estimate is reported on a 100 % ownership basis. |
| 5. | Mineral Resources are reported from within an optimised pit shell. |
| 6. | For the purposes of assessing reasonable prospects for economic extraction and cut-off grade, metallurgical recoveries were applied to individual rare earth oxides. The average total rare earth oxide metallurgical recovery is 39.6 %. |
| 7. | Mineral Resources include the portion converted to Mineral Reserves. |
| 8. | Mineral Resources are reported on an in-situ basis without applying modifying factors. |
| 9. | A mean density of 2.73 t/m3 was applied for Measured, 2.67 t/m3 for Indicated and 2.77 t/m3 for Inferred Resources. |
| TREO = La2O3, CeO2, Pr6O11, Nd2O3, Sm2O3, Eu2O3, Gd2O3, Tb4O7, Dy2O3, Ho2O3, Er2O3, Tm2O3, Yb2O3, Lu2O3, and Y2O3 | |
The MSA QP is of the opinion that with consideration of the recommendations summarised in Section 1.13 of this TRS, any issues relating to technical and economic factors likely to influence the prospect of economic extraction can be resolved with further work.
Table 1.20 shows a summary of the total Mineral Reserve Estimate.
Table 1.20: Mineral Reserve Summary as at 30 April 2025
| Category | Tonnage (Mt) | TREO (%) | TREO (t) |
| Proven Mineral Reserves | 8.160 | 1.28 | 104,183 |
| Probable Mineral Reserves | 9.988 | 1.07 | 106,801 |
| Total Mineral Reserves | 18.147 | 1.16 | 210,984 |
| NOTE: |
| Totals might not add up due to rounding. |
| Mineral Reserves are stated as tonnages and grades delivered to the processing plant and are inclusive of dilution and mining losses expected during mining. |
| The Mineral Reserve estimate is reported on a 100 % ownership basis. |
| The Mineral Reserve is stated at a cut-off grade of 0.6 % TREO, which was supported by metal prices stated in Table 12.3. |
| Ore tonnages are stated at an average in-situ density of 2.76 t/m3. |
| A weighted average process recovery to carbonate of 40 % was used to calculate revenue from Mineral Reserves. |
| S-K 1300 Technical Report Summary on the Songwe Hill REE Project | Page 58 of 489 |
| |
This TRS has demonstrated that, based on the operating and pricing outlook assumed in the 2022 TR, the Songwe Hill REE deposits can be economically mined using the open-pit method and processed using flotation and hydrometallurgy processes at an annual rate of approximately 1 Mt/a with a view to producing an average of 5,954 t of TREO in MREC per year for the first five years and 4,081 t of TREO in MREC per year in Years 6 to 18.
The TRS is based on selling the MREC rather than the separate products. For the financial analysis, it is forecasted that MKAR will sell the MREC to its proposed Puławy separation plant in Poland. As a result, a 15 % discount was applied to the forecasted value of the rare earths contained in the MREC (discount equivalent to approximately US$9.26/kg (real 2025 US dollars) of TREO in the MREC for the first five years of production to reflect the discount that would be applied for the MREC product versus the value of the underlying separate REOs). It is also assumed that 77,000 t/a of gypsum by-product from the hydrometallurgical plant will be sold at a rate of US$150/t (real 2025 US dollars).
This report indicates a US$339 million post-tax NPV, using a 10 % nominal discount rate, and a 24.32 % post-tax IRR for 100 % of the Songwe Hill production.
| 1.13 | Recommendations |
SENET recommends the execution of a front-end engineering design (FEED) study prior to project execution stage.
Through a well-defined and executed FEED phase, the following can be achieved:
| ● | Reduced technical, schedule and cost risks |
| ● | Faster plant/process start-up, commissioning and handover |
| ● | Reduced EHS and compliance risks |
| ● | Improved risk identification and mitigation |
| ● | Finalised orders of long-lead items |
| ● | Receipt of vendor drawings and data, taking the detailed design to the next level of accuracy |
The following early works activities should be completed before the site construction activities start in order to minimise potential delays:
| ● | Complete additional geotechnical studies as per the Zutari recommendation. |
| ● | Commission sufficient water boreholes in the wellfield to supply water to the accommodation camp, site offices and facilities as well as the water required for construction purposes. |
| ● | Construct the accommodation camp and facilities prior to construction start date. |
| ● | Identify aggregate source. |
| ● | Complete the Resettlement Action Plan (RAP) and specifically the relocation of households prior to construction start date. |
| S-K 1300 Technical Report Summary on the Songwe Hill REE Project | Page 59 of 489 |
| |
The following are recommendations made by Digby Wells relating to the environmental and social aspects of the Project for MKAR to integrate throughout the Project:
| ● | Ensure continuous engagement and two-way dialogue with communities in the vicinity of the project and other key stakeholders, including government and administrative authorities, traditional authorities, group village heads, local chiefs, and community-based organisations, as well as international and local non-governmental organisations. |
| ● | Ensure management of waste by engineering and constructing waste facilities in compliance with good international industry practice. Infrastructure has been sited and designed to mitigate potential negative impacts from dust, radiation, noise and water pollution. Design measures to manage contaminants and waste include clean and dirty water diversion berms, trenches, dams, high-density polyethylene (HDPE) lining of the TSF, and other technological measures that together contribute to the reduction of potential negative impacts. Monitoring of these measures through the Environmental and Social Management Plan (ESMP) must be undertaken throughout the project lifecycle to ensure that they are fit for purpose and appropriately manage any potential negative environmental and social risk. |
| ● | Design a wellfield in the alluvial material around the project for water provisioning for the project. Surface water runoff and precipitation during the wet season will also be captured, stored and used to contribute to the mine’s water demands. This alongside the project’s aim to achieve high recycling rates will alleviate the potential impacts on groundwater abstraction. |
| ● | Ensure that the resettlement activities as a result of the physical and economic displacement of communities required by the project will follow the International Finance Corporation (IFC) Performance Standard 5 (PS5) through the development of an RAP and concurrent stakeholder engagement. |
| ● | Ensure that the relocation of cultural heritage resources and graveyards will follow the IFC PS8. |
The radiation protection programme assessed and presented radiological baseline and safety assessment findings consistent with the International Atomic Energy Agency (IAEA) Safety Standards, the IFC PSs, as well as the available Malawi Atomic Energy Regulations of 2012 promulgated by the Atomic Energy Regulatory Authority (AERA) in terms of the Atomic Energy Bill (Act No. 16 of 2011).
The following TSF recommendations are proposed:
| ● | Prior to the commencement of the detailed design, a geotechnical engineer should be appointed to retrieve appropriate samples from test pits on site for the triaxial test work of the in-situ material. |
| ● | For consideration and evaluation during the detailed design of the TSF, |
| o | The possible further optimisation of the TSF drainage system should be assessed. |
| o | The validity of the basin geotextile should be assessed. |
| o | A more comprehensive detailed dam break analysis should be undertaken to more accurately define the potential inundation extent of the TSF. |
| S-K 1300 Technical Report Summary on the Songwe Hill REE Project | Page 60 of 489 |
| |
It is recommended that opportunities to reduce reagent consumptions and negotiate prices with reliable reagent suppliers or distributors with long-term contracts be investigated in order to optimise the OPEX and mitigate price fluctuations.
It is also recommended that a detailed energy yield analysis and uncertainty assessment be conducted to further optimise the energy requirements.
Furthermore, it is recommended that the PV solar and backup generation plant design be reassessed for optimisation as the technology in this field is constantly changing and improving.
| S-K 1300 Technical Report Summary on the Songwe Hill REE Project | Page 61 of 489 |
| |
| 2 | Introduction |
Mkango Rare Earths Limited (formerly Lancaster Exploration Limited) (MKAR) was incorporated under the laws of the British Virgin Islands on August 3, 2007 as a BVI businessc ompany, and is a wholly owned subsidiary of Mkango Resources Limited (Mkango). Mkango is a Canadian exploration and development company dual listed on the UK AIM (Alternative Investment Market) and Canadian TSX-V (TSX Venture Exchange) (www.mkango.ca). Mkango owns the Songwe Hill Rare Earth Element (REE) Project in Malawi (Songwe Hill or the Project). Mkango currently owns the Pulawy Separation Plant through a separate wholly owned subsidiary (Mkango Polska); however, after giving effect to a corporate restructuring expected to occur in the second quarter of 2026, through which Mkango Polska would be transferred to MKAR, MKAR is expected to own the Puławy Separation Plant Project in Poland (Puławy).
The Project includes an open pit, flotation concentrator plant, and a hydrometallurgical plant. It is expected to produce a purified mixed rare earth carbonate (MREC) concentrate, which will be shipped to Puławy for processing into separated rare earth oxides (REOs) for sale to pre-agreed offtakers.
In 2021, Mkango commissioned SENET, a DRA Global Group Company, to complete a definitive feasibility study (DFS) for the Songwe Hill REE Project. The DFS report, dated July 2022, was used as the basis for a Canadian National Instrument 43-101 (NI 43-101) Technical Report, also dated 2022 (the 2022 TR), which is available on SEDAR+.
In 2025, Mkango retained SENET to prepare an independent Technical Report Summary (TRS) on the Songwe Hill Project. This TRS conforms to the United States Securities and Exchange Commission’s (SEC) Modernized Property Disclosure Requirements for Mining Registrants as described in Subpart 229.1300 of Regulation S-K, Disclosure by Registrants Engaged in Mining Operations (S-K 1300) and Item 601 (b)(96) Technical Report Summary. The purpose of this TRS is to provide an update to the 2022 DFS, and it was prepared in accordance with S-K 1300 in support of a planned initial public offering (IPO) on a US securities exchange. This is the initial TRS for Songwe Hill. The effective date of the report is TBC.
| 2.1 | Qualified Persons and Their Contributions |
Qualified persons (QPs), as defined in 17 CFR § 229.1302 (Item 1302)1 Qualified person, technical report summary, and technical studies, from Swinden Geoscience Consultants Ltd. (Swinden), The MSA Group (Pty) Ltd (MSA), Bara Consulting (Pty) Ltd (Bara), Digby Wells Environmental (Digby Wells), Epoch Resources (Pty) Ltd (Epoch), Dahrouge Geological Consulting USA, responsible and acting as the independent QP for Adamas Intelligence Inc. (Adamas), and MKAR contributed to this TRS. SENET is a third-party firm comprising minerals processing experts in their respective fields. In accordance with 17 CFR § 229.1302(b)(1), SENET acts as a QP and is responsible for all the sections it has completed. All the QPs and their respective employers are independent of each of Mkango and MKAR.
| 1 | Title 17 – Commodity and Securities Exchanges, Chapter II – Securities and Exchange Commission, Part 229 –Standard Instructions for Filing Forms Under Securities Act of 1933, Securities Exchange Act of 1934 and Energy Policy and Conservation Act of 1975 – Regulation S-K |
| S-K 1300 Technical Report Summary on the Songwe Hill REE Project | Page 62 of 489 |
| |
Table 2.1 lists the companies employing the QPs for this TRS and their contributions.
Table 2.1: Qualified Persons and Their Contributions
| Section No. | Section Title | SENET | Swinden | MSA | Bara | Digby Wells | Epoch | Adamas | MKAR |
| 1 | Executive Summary | ||||||||
| 1.1 | Introduction | X | |||||||
| 1.2 | Property Description | X | |||||||
| 1.3 | Geology and Mineralisation | X | |||||||
| 1.4 | Status of Exploration | X | |||||||
| 1.5 | Mineral Resource Estimate | X | |||||||
| 1.6 | Development and Operations | X | |||||||
| 1.7 | Mineral Reserve Estimate | X | |||||||
| 1.8 | Recovery Methods | X | |||||||
| 1.9 | Capital and Operating Costs | X | X | ||||||
| 1.10 | Market Studies and Contracts | X | |||||||
| 1.11 | Economic Analysis | X | |||||||
| 1.11.1 | Capital and Operating Costs | X | |||||||
| 1.11.2 | Discounted Cash Flow Valuation Analysis | X | |||||||
| 1.11.3 | Sensitivity Analysis | X | |||||||
| 1.12 | Conclusions | X | X | ||||||
| 1.13 | Recommendations | X | X | X | X | X | |||
| 2 | Introduction | X | |||||||
| 2.1 | Qualified Persons and Their Contributions | X | |||||||
| 2.2 | Qualified Persons’ Personal Inspection of the Property | X | X | X | X | X | X | X | |
| 3 | Property Description | X | X | ||||||
| 4 | Accessibility, Climate, Local Resources, Infrastructure and Physiography | X | X | ||||||
| 5 | History | X | X | ||||||
| 6 | Geological Setting, Mineralisation, and Deposit | X | |||||||
| 7 | Exploration | X | |||||||
| 8 | Sample Preparation, Analyses, and Security | X | |||||||
| 9 | Data Verification | X | |||||||
| 10 | Mineral Processing and Metallurgical Testing | X | |||||||
| 11 | Mineral Resource Estimates | X | |||||||
| 12 | Mineral Reserve Estimates | X |
| S-K 1300 Technical Report Summary on the Songwe Hill REE Project | Page 63 of 489 |
| |
| Section No. | Section Title | SENET | Swinden | MSA | Bara | Digby Wells | Epoch | Adamas | MKAR |
| 13 | Mining Methods | X | |||||||
| 14 | Processing and Recovery Methods | X | |||||||
| 15 | Infrastructure | ||||||||
| 15.1 | Project On-Site Infrastructure – Process Plant | X | |||||||
| 15.2 | Project On-Site Infrastructure – Mining | X | |||||||
| 15.3 | Project Off-Site Infrastructure | X | |||||||
| 15.4 | Tailings Storage Facility | X | |||||||
| 15.5 | Logistics | X | |||||||
| 15.6 | QP Opinion | X | |||||||
| 16 | Market Studies | X | |||||||
| 17 | Environmental Studies, Permitting, and Plans, Negotiations, or Agreements with Local Individuals or Groups | X | |||||||
| 18 | Capital and Operating Costs | ||||||||
| 18.1 | Capital Costs | X | |||||||
| 18.1.1 | Responsibilities | X | |||||||
| 18.1.2 | Escalation | X | |||||||
| 18.1.3 | Exclusions | X | |||||||
| 18.1.4 | Exchange Rates | X | |||||||
| 18.1.5 | Scope of the Estimate | X | |||||||
| 18.1.6 | Summary of Total CAPEX | X | |||||||
| 18.1.7 | Basis of Estimate, Assumptions and Exclusions | X | |||||||
| 18.1.8 | Mining Capital Costs | X | |||||||
| 18.1.9 | Process Plant and Infrastructure Capital Costs | X | |||||||
| 18.1.10 | Main Contracts | X | |||||||
| 18.1.11 | Supply-Only Contracts | X | |||||||
| 18.1.12 | Supply and Install Contracts | X | |||||||
| 18.1.13 | Engineering, Procurement and Construction Management (EPCM) | X | |||||||
| 18.1.14 | First Fills | X | |||||||
| 18.1.15 | Contingency | X | |||||||
| 18.1.16 | Vendor Services | X | |||||||
| 18.1.17 | Freight | X | |||||||
| 18.1.18 | Power Plant | X |
| S-K 1300 Technical Report Summary on the Songwe Hill REE Project | Page 64 of 489 |
| |
| Section No. | Section Title | SENET | Swinden | MSA | Bara | Digby Wells | Epoch | Adamas | MKAR |
| 18.1.19 | Fuel Supply Depot | X | |||||||
| 18.1.20 | Spares | X | |||||||
| 18.1.21 | Insurances | X | |||||||
| 18.1.22 | TSF Costs | X | |||||||
| 18.1.23 | Other Supporting Infrastructure and Equipment Costs | X | |||||||
| 18.1.24 | Raw Water Management and Supply | X | |||||||
| 18.1.25 | Pit Dewatering | X | |||||||
| 18.1.26 | Plant Access and Haul Roads | X | |||||||
| 18.1.27 | Plant Support and Operational Vehicles | X | |||||||
| 18.1.28 | Owner’s Pre-Production Costs | X | X | ||||||
| 18.1.29 | Pre-Production Labour | X | |||||||
| 18.1.30 | Other Pre-Production Costs | X | |||||||
| 18.1.31 | Working Capital | X | X | ||||||
| 18.1.32 | Environmental Management: Resettlement Costing and Rehabilitation and Closure Costs | X | |||||||
| 18.1.33 | Closure Framework and Objectives | X | |||||||
| 18.1.34 | Environmental and Social Forward Works Plan | X | |||||||
| 18.1.35 | Currency Split | X | |||||||
| 18.1.36 | Countries of Origin for Procurement Packages | X | |||||||
| 18.1.37 | Capital Cost Outflow Forecast | X | |||||||
| 18.2 | Operating Costs | X | |||||||
| 18.2.1 | Summary of Operating Costs | X | |||||||
| 18.2.2 | Exchange Rates | X | |||||||
| 18.2.3 | Escalation | X | |||||||
| 18.2.4 | Exclusions | X | |||||||
| 18.2.5 | Mining Operating Costs | X | |||||||
| 18.2.6 | Process Plant Operating Costs | X | |||||||
| 18.2.7 | TSF Operating Costs | X | |||||||
| 19 | Economic Analysis | X | |||||||
| 20 | Adjacent Properties | X | |||||||
| 21 | Other Relevant Data and Information | ||||||||
| 21.1 | Project Schedule | X | |||||||
| 21.2 | Risks | X |
| S-K 1300 Technical Report Summary on the Songwe Hill REE Project | Page 65 of 489 |
| |
| Section No. | Section Title | SENET | Swinden | MSA | Bara | Digby Wells | Epoch | Adamas | MKAR |
| 21.2.1 | General Risks | X | |||||||
| 21.2.2 | Resource Risks | X | |||||||
| 21.2.3 | Mining Risks | X | |||||||
| 21.2.4 | Process Plant Risks | X | |||||||
| 21.2.5 | TSF Risks | X | |||||||
| 21.2.6 | Sustainable Development Risks | X | |||||||
| 21.3 | Opportunities | X | |||||||
| 21.3.3 | Proposed Puławy Separation Project Opportunity | X | X | ||||||
| 21.4 | Human Resource Element | ||||||||
| 21.4.1 | Introduction | X | |||||||
| 21.4.2 | Overall Mine Management Structure | X | X | ||||||
| 21.4.3 | Department Structure | X | |||||||
| 22 | Interpretation and Conclusions | ||||||||
| 22.1 | Mineral Resource | X | |||||||
| 22.2 | Mineral Reserve | X | |||||||
| 22.3 | Environmental | X | |||||||
| 23 | Recommendations | ||||||||
| 23.1 | Geology | X | |||||||
| 23.2 | Mineral Resources | X | |||||||
| 23.3 | Environmental and Social Studies, plans and resettlement | X | |||||||
| 23.4 | Infrastructure | ||||||||
| 23.4.1 | Project Site Infrastructure – Process Plant | X | |||||||
| 23.4.2 | Project Off-Site Infrastructure | X | |||||||
| 23.4.3 | TSF | X | |||||||
| 23.5 | Operating Costs | X | |||||||
| 23.6 | QP Opinion | X | |||||||
| 24 | References | X | |||||||
| 25 | Reliance on Information Provided by the Registrant | X |
SENET was responsible for the overall compilation of the TRS, which is based on the 2022 TR and incorporates updated capital and operating cost information.
Most of the information in this TRS was sourced from the 2022 TR.
Further details on references are provided in Section 24.
| S-K 1300 Technical Report Summary on the Songwe Hill REE Project | Page 66 of 489 |
| |
This technical report summary (TRS) entitled ” Technical Report Summary on the Songwe Hill REE Project” is current as at February 6, 2026 and has been prepared by:
Table 2.2: Qualified Persons and Responsible Report Sections
| Qualified Person or Consulting Firm | Responsible for the following report sections | Signature | Date |
| DRA SENET (Pty) Ltd Philemon Bundo |
1.1,1.2, 1.8,1.9, 1.11, 1.11.1, 1.11.2, 1.11.3, 1.12, 1.13, 2, 2.1, 2.2, 3, 4, 5, 10, 14, 15.1, 15.3, 15.5, 15.6, 18.1, 18.1.1, 18.1.2, 18.1.3, 18.1.4, 18.1.5, 18.1.6, 18.1.7, 18.1.9, 18.1.10, 18.1.11, 18.1.12, 18.1.13, 18.1.14, 18.1.15, 18.1.16, 18.1.17, 18.1.18, 18.1.19, 18.1.20, 18.1.21, 18.1.23, 18.1.24, 18.1.25, 18.1.26, 18.1.27, 18.1.28, 18.1.29, 18.1.30, 18.1.31, 18.1.35, 18.1.36, 18.1.37, 18.2, 18.2.1, 18.2.2, 18.2.3, 18.2.4, 18.2.6, 19, 20, 21.1, 21.2, 21.2.1, 21.2.4, 21.3, 21.3.3, 21.4.1, 21.4.2, 21.4.3, 23.4.1, 23.4.2, 23.5, 23.6, 24, 25 |
/s/ Philemon Bundo | 06-Feb-2026 |
| Swinden Geoscience Consultants Ltd Scott Swinden |
1.3, 1.4, 2.2, 6, 7, 8, 23.1 | /s/ Scott Swinden | 06- Feb-2026 |
| MSA Group (Pty) Ltd Jeremy Witley |
1.5, 1.12, 1.13, 2.2, 9, 11, 21.2.2, 22.1, 23.2 | /s/ Jeremy Witley | 06- Feb-2026 |
| Bara Consulting (Pty) Ltd Clive Brown |
1.6, 1.7, 1.13, 2.2, 12, 13, 15.2, 18.1.8, 18.2.5, 21.2.3, 21.4.2, 22.2 | /s/ Clive Brown | 06- Feb-2026 |
| Digby Wells Environmental Graham Trusler |
1.9, 1.13, 2.2, 17, 18.1.32, 18.1.33, 18.1.34, 21.2.6, 22.3, 23.3 | /s/ Graham Trusler | 07-Feb-2026 |
| Epoch Resources (Pty) Ltd Guy Wiid |
1.13, 2.2, 15.4, 18.1.22, 18.2.7, 21.2.5, 23.4.3 | /s/ Guy Wiid | 06-Feb-2026 |
| Dahrouge Geological Consulting USA Ltd for Adamas Intelligence Inc Trevor Mills |
1.10, 2.2, 16 | /s/ Trevor Mills | 06-Feb-2026 |
| S-K 1300 Technical Report Summary on the Songwe Hill REE Project | Page 67 of 489 |
| |
| 2.2 | Qualified Persons’ Personal Inspection of the Property |
A summary of the site visits to the Project by the QPs is provided in Table 2.2 to Table 2.8.
Table 2.3: QP Site Inspection Details – DRA SENET
| Expertise | Date of Visit | Detail of Site Inspection |
| SENET | 20 to 28 September 2018 | The site visit included a drive and walk over the full property to see all the surface areas to be affected by the mine infrastructure. |
| SENET | 5 to 10 May 2021 |
The site visit included a drive and walk over the full property to see all the surface areas to be affected by the mine infrastructure.
The geotechnical test pit activities were also observed.
|
| SENET | 27 to 30 May 2022 | The site visit included a drive and walk over the full property to see all the surface areas to be affected by the mine infrastructure. |
Table 2.4: QP Site Inspection Details – MSA
| Expertise | Date of Visit | Detail of Site Inspection |
| Jeremy Witley – QP | 25 to 28 July 2018 |
The site visit included the following:
● Review of on-site exploration processes
● Inspection of the drilling sites
● Core review including the following:
o Verification of logging of several drillhole cores.
o Comparisons between laboratory assays and observed mineralised intercepts.
|
| Jeremy Witley – QP | 24 to 26 September 2018 |
This was a follow-up site visit to the July site visit in order to inspect Phase 3 drilling exploration work conducted after the July site visit.
The work completed included the following:
● Core review with the Geology QP – Scott Swinden
● Inspection of the drilling sites
● Core review included the following:
o Verification of logging of several drillhole cores.
o Comparisons between laboratory assays, observed mineralised intercepts, and handheld X-ray fluorescence (XRF) readings by the QP.
|
| S-K 1300 Technical Report Summary on the Songwe Hill REE Project | Page 68 of 489 |
| |
Table 2.5: QP Site Inspection Details – Digby Wells
| Expertise | Date of Visit | Detail of Site Inspection |
| Graham Trusler – QP | 11 to 13 June 2018 |
The site visit included the following:
● Drive and walk over the full property to see all the surface areas to be affected by the mine infrastructure.
● Visit to various surface waterbodies in the region for assessment as supply options.
|
| Barbara Wessels – Environmental Practitioner | March to April 2022 |
The site visit included the following:
● Environmental, Social and Health Impact Assessment (ESHIA) disclosure stakeholder engagement (community to national government).
● Visit to the Project footprint for overall environmental and social site observations.
|
| Jessica Pryor – Environmental and Social Practitioner | 27 to 30 May 2022 |
The site visit included the following:
● Sessions and site recognisance with Project Lenders to clarify ESHIA queries and confirm project alignment with international standards.
● Focus on water availability (well field), and Mkango-funded social projects such as the school and local water sources as well as other relevant environmental and social aspects.
|
Table 2.6: QP Site Inspection Details – Bara
| Expertise | Date of Visit | Detail of Site Inspection |
| Clive Brown – QP Mine Design, Mine Planning and Mineral Reserves | 5 to 10 May 2021 |
The site visit included the following:
● Observations of the site for the open-pit mine, waste dumps, haul roads and associated infrastructure.
● Observation of the drill core and discussions on site with the geological team.
● Discussions on site with the wider project team relating to the location and nature of all mining infrastructure.
|
Table 2.7: QP Site Inspection Details – Epoch
| Expertise | Date of Visit | Detail of Site Inspection |
| Guy Wiid – QP | NA | The QP did not visit the Project site. The site was visited by the Epoch personnel listed below, who were actively engaged on the project at the time. These individuals provided their observations and findings to the QP. |
| George Papageorgiou | 18 to 20 May 2014 | The general project visit included discussions on site relating to future project scope of works and general observations of the area. |
| S-K 1300 Technical Report Summary on the Songwe Hill REE Project | Page 69 of 489 |
| |
| Expertise | Date of Visit | Detail of Site Inspection |
| George Papageorgiou | 11 to 13 June 2018 | The TSF site selection visit included observations of the potential sites for topography, vegetation, watercourses and surrounding social and environmental impacts for placement of a TSF. |
| Sylvia Przytula | 11 to 12 May 2021 |
The TSF site inspection visit included the following:
● Observations of the selected site location for topography, vegetation, watercourses and surrounding social and environmental impacts for placement of a TSF.
● Discussions on site with the wider project team relating to the location of TSF relative to mining infrastructure and environmentally and socially sensitive areas.
|
Table 2.8: QP Site Inspection Details – Swinden
| Expertise | Date of Visit | Detail of Site Inspection |
| Scott Swinden – QP | 30 May to 11 June 2018 |
● Viewed early and late stages of Phase 3 drilling including core recovery and transport, rock quality designation (RQD), and core logging.
● Conducted selective logging of new core, and re-logged selected drill core from previous campaigns.
● Visited outcrops in the area to confirm regional geology.
● Reviewed and discussed geological models for the deposit with company geologists.
|
| Scott Swinden – QP | 20 to 28 September 2018. |
● This was a follow-up site visit to the June site visit.
● Work completed included the following:
o Core review
o Inspection of the drilling sites
● Core review included the following:
o Verification of logging of several drillhole cores.
o Comparison between laboratory assays, observed mineralised intercepts and handheld XRF readings by the QP.
|
| S-K 1300 Technical Report Summary on the Songwe Hill REE Project | Page 70 of 489 |
| |
| 3 | Property Description |
| 3.1 | Location |
Songwe Hill is located in south-eastern Malawi, between Lake Chilwa and the Mulanje Massif, and close to the eastern border of Malawi with Mozambique (see Figure 3.1). It lies within Retention Licence (RTL) 0001/21, which is one of 4 retention licences (RTL 0001/21, RTL 0002/21, RTL 0003/21 and RTL 0007/21) that MKAR refers to as the “Phalombe Licences”, which are currently being transferred into a large scale mining license.

Source: Modified from UN Map of Malawi (2012)
Figure 3.1: Location of Songwe Hill in Malawi
RTL 0001/21 lies entirely within the Southern Region of Malawi, and Songwe Hill is within the Phalombe administrative district. It lies approximately 70 km in a straight line southeast from Zomba (the former capital of Malawi) and approximately 90 km in a straight line east-northeast of the commercial centre of Blantyre. Songwe Hill can be reached from these centres via national highways S144 and S145, respectively. The S145 passes through Migowi, which is located approximately 15 km from Songwe Hill. The Project is approximately 9 km from the village of Maoni, which is connected to Migowi via T415, an all-weather, double-lane graded and gravelled road with new, reinforced concrete bridges and culverts.
| S-K 1300 Technical Report Summary on the Songwe Hill REE Project | Page 71 of 489 |
| |
| 3.2 | Mineral Tenure, Permitting, Rights and Agreements |
| 3.2.1 | Retention Licences in Malawi |
The search for, the mining of, and the disposal of minerals in Malawi is currently governed by the Mines and Minerals Act, 2023 (Act No. 25 of 2023). However, the activities conducted prior to 2023 were governed by the Mines and Minerals Act, 2019 (Act No. 8 of 2019; the “2019 Act”).
It is the stated objective of Malawi’s mining policy to maximise the economic benefits to the nation and empower local communities by exploiting the nation’s mineral resources whilst managing environmental impacts. The Government encourages investors to explore, delineate, evaluate, and where viable, exploit the country’s mineral resources.
The rights to carry out a programme of prospecting operations for specified minerals over an area are conveyed by way of an exploration licence (EL), which replaces the pre-2019 Exclusive Prospecting Licence (EPL). On application for an EL, a detailed programme of exploration and expected expenditures is presented by the applicant together with a proposal for the training and employment of Malawian citizens.
When exploration has been completed and a mineral deposit of commercial significance can be demonstrated, the holder of an EL may apply for a Retention Licence (RTL) if the deposit cannot be justifiably mined at the time. The area of each RTL must not exceed 25 km2, must fall entirely within a valid EL held by the applicant, and on successful mining licence application ceases to be part of that EL. An RTL may be granted for a non-extendable term of five years. Land that was not part of an RTL at the time the licence was granted shall not be added to the RTL at a later date.
The holder of an EL or RTL has the exclusive right to apply for a Mining Licence.
| 3.2.2 | Retention Licence RTL 0001/21 |
Retention Licence RTL 0001/21 (the “Licence Area”) covers an area of 25 km2 and is one of 4 RTLs with a total area of ~100 km2. The block falls within the former EPL 0284/10 that had an area of 849.1 km2 and was originally granted to MKAR on 21 January 2010 with a three-year term. The EPL was renewed successively for two-year periods until 20 January 2015, 19 January 2017, 21 January 2019, and 21 January 2021 by the Minister of Natural Resources, Energy and Mining under the 2019 Act. The EPL was then converted to an EL on 19 January 2021 to comply with the 2019 Act. A block of 4 RTLs was applied for and granted on 1 June 2021 (see Table 3.1), and the Songwe Hill REE Project falls within one of these licences, RTL 0001/21.
| S-K 1300 Technical Report Summary on the Songwe Hill REE Project | Page 72 of 489 |
| |
MKAR is transferring four of the 11 Retention Licences (RTL0001/21, RTL0002/21, RTL0003/21 and RTL0007/21), issued on 1 June 2021 into a large scale mining licence the other 7 RTLs will lapse. Confirmation has been received from the office of the Director General of the Malawi Mining and Minerals Regulatory Authority that the 4 retention licences above will remain valid and in good standing until the large scale mining licence approval process has been completed and the large scale mining licence is formally issued. A legal opinion from Gustave and Company, dated 5 June 2026, confirms that MKAR is the lawful holder of 100 % interest in all eleven licences, that they are unencumbered, valid, and in good standing, and that no outstanding fees, filings, or encumbrances exist.
MKAR is in the process of applying for the Mining Licence for the Songwe Hill Rare Earths Project. The Company has already received a signed-off ESHIA certificate and Mining Development Agreement from the Government of Malawi.
The RTL grants MKAR the right to retain part of its previous exploration area for the following mineral(s) of primary interest: all 17 REEs including yttrium, additionally strontium, niobium, iron ore, manganese, gold, silver, copper, bauxite, fluorite, phosphate, uranium, thorium, monazite, nepheline syenite, zircon, tantalum, clay, kaolinite and all associated minerals.
The boundaries of the RTL are determined by reference to the Universal Transverse Mercator (UTM) Grid using the ARC1950 Datum in Zone 36 (Southern Hemisphere). The location of the RTL is shown in Figure 3.2.
Table 3.1: History of Tenure of EPL 0284/10 and RTL0001/21
| Application | Granted | Validity |
| Original EPL | 21 Jan. 2010 | 20 Jan. 2013 |
| 1st Renewal | 9 Jan. 2013 | 20 Jan. 2015 |
| 2nd Renewal | 5 Jan. 2015 | 19 Jan. 2017 |
| 3rd Renewal | 13 Oct. 2017 | 19 Jan. 2019 |
| 4th Renewal | 28 Nov. 2018 | 21 Jan. 2021 |
| Conversion to Exploration Licence | 19 Jan. 2019 | 19 Jan. 2021 |
| Award of Retention Licence | 1 Jun. 2021 | 1 Jun. 2026 |
| S-K 1300 Technical Report Summary on the Songwe Hill REE Project | Page 73 of 489 |
| |
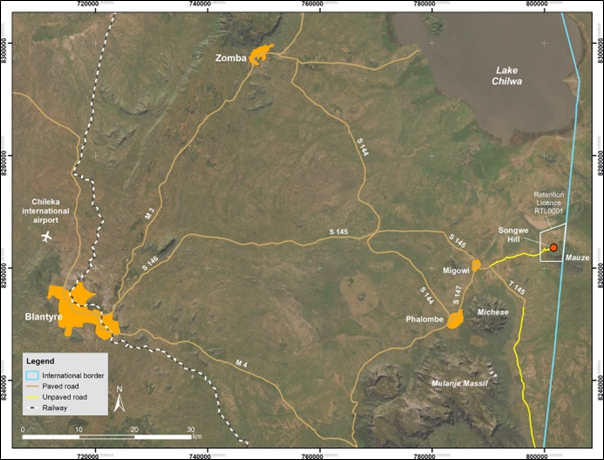
Source: Mkango (2021)
NOTES: The Songwe Hill carbonatite abuts against Mauze Hill on its north-western flank and is entirely within the Republic of Malawi. UTM Zone 36S and WGS84 Datum.
Figure 3.2: Location of RTL 0001/21 and Access Roads
| 3.2.3 | General Provisions |
Except for the general rights of the local communities to graze livestock or to cultivate the land, which rights may not interfere with the prospecting operations, there are no restrictions on surface access to the area pertaining to the Licence Area. Where a mineral tenement holder is denied access to any area that is the subject of such tenement by a lawful occupier or owner of that land, the holder, after a reasonable effort to negotiate access, may provide the Mining and Mineral Regulatory Authority with written details of the land access problem and request a land access order pursuant to Section 221 of the Act.
Under the existing legislation, the holder of an RTL cannot renew the licence, and the Government of Malawi has no rights or options to acquire any interest in the Licence Area.
The Government would be entitled to cancel or suspend RTL 0001/21 if MKAR fails to
| ● | Conduct its activities in accordance with its approved plan, the conditions of its licence, the 2023 Mines and Minerals Act and applicable law, in a professional manner consistent with good practice in the mining industry. |
| S-K 1300 Technical Report Summary on the Songwe Hill REE Project | Page 74 of 489 |
| |
| ● | Expend annually the minimum amount specified in its licence to implement its approved plan. |
| ● | Prepare, implement and update the community engagement plan required under Section 289 of the Act. |
| ● | Notify the Authority when there is a change in the control of the company that holds the licence, such as a sale of a majority ownership interest or a majority of its shares, as required under Section 63 of the Act. |
| ● | Provide any attachment required or agreed under Section 45 of the Act. |
| ● | Pay the prescribed annual ground rent required under Section 255 of the Act. |
| ● | Submit the annual report required under Section 141 of the Act. |
As far as is known, there has been no commercial exploitation of minerals within the Licence Area; therefore, there are no existing mine workings, tailing ponds or waste dumps. There are no known legal encumbrances to the Songwe Hill RTL and no environmental liabilities, apart from the obligations of MKAR outlined in the Terms and Conditions of the RTL.
All necessary permits, approvals, consent, endorsements and permissions have been obtained in order to permit MKAR to conduct exploration work of the type contemplated by the RTL, including geochemical sampling, geophysical surveying, diamond drilling, core sampling, and geotechnical ground investigations in the Licence Area.
There are no known significant factors or risks that may affect access, title, or the right or ability to perform work on the property as contemplated by the RTL.
| 3.2.4 | Overlapping Licences |
There are no overlapping licences of any kind governed by the Act, or other factors or risks known to the authors that might affect the right or ability to perform work in the Licence Area.
| 3.3 | Environmental Liabilities |
Currently, the environmental liabilities on the site are minimal as only exploration has taken place, and it is a greenfield project. Should the Project not proceed to construction, the site will need to be closed and rehabilitated. Current liabilities include
| ● | Demolition, or handover to the community, of the exploration office, kitchen and toilet facilities |
| ● | Demolition of the concrete platforms constructed for the tented exploration accommodation |
| ● | Removal of the core shed and containers to store the core |
| ● | Rehabilitation of the access and drilling roads on Songwe Hill |
The weather station installed on site by Mkango has been donated to the Department of Climate Change and Meteorological Services, but MKAR will continue to maintain and calibrate the station on behalf of the Department.
| S-K 1300 Technical Report Summary on the Songwe Hill REE Project | Page 75 of 489 |
| |
| 4 | Accessibility, Climate, Local Resources, Infrastructure and Physiography |
| 4.1 | Accessibility |
Songwe Hill is located in south-eastern Malawi, between Lake Chilwa and the Mulanje Massif and close to the eastern border of Malawi with Mozambique. The Project is approximately 15 km from the town of Migowi, and approximately 7 km from Phalombe, which has a district population of approximately 430,000. All-weather roads connect Migowi and Phalombe to Zomba and Blantyre, both of which are approximately 90 km by road from Migowi. Local gravel roads provide access from Migowi to the base of Songwe Hill. The total travel time to the Project area from Zomba or Blantyre is approximately 2 h.
Songwe Hill lies within the Southern Region of Malawi, in the Phalombe administrative district. Mpoto Lagoon is approximately 1.3 km from the edge of the Project infrastructure and Lake Chilwa is approximately 22 km from the Project site. It is located approximately 70 km in a straight line southeast of Zomba. Phalombe is one of 12 districts in the Southern Region of Malawi and is the largest nearby town, approximately 25 km from Songwe Hill. The Project area is bordered by unformed gravel roads which traverse towards paved roads which will be used during the construction and operational stages for the movement of development-generated traffic.
| 4.2 | Climate and Meteorological Overview |
Malawi is located between two climatic mega-zones, equatorial Africa and southern Africa. The climate is largely dictated by the oscillations of the Intertropical Convergence Zone (ITCZ), i.e. the converging of, and interaction between, the zonal Congo air mass and the meridional south-eastern trade winds and monsoonal north-eastern winds. The wet season stretches from November to April, and records 95 % of the annual precipitation. The dry season is subdivided into the cool dry season from May to August and hot dry season in September and October.
Malawi’s climate is moderated by a high percentage of surface water and by the fact that it possesses an altitudinal range from 500 metres above mean sea level (mamsl) (Lake Malawi and Liwonde) to peaks over 3,000 mamsl high (Mount Mulanje). In August 2014, a weather station was installed on site. The on-site data collected is used to understand the meteorology of the Project area as presented below. It is not expected that the rainy season will affect the process plant and mining operations.
| 4.2.1 | Wind Speed and Direction |
Data from the on-site meteorological station from August 2014 to April 2021 shows the predominant wind direction as south-southwest and south, with the frequencies of occurrence of 14.9 % and 12.6 %. Secondary contributions are observed from the southwest, northeast and north-northeast (see Figure 4.1), with frequencies of occurrence of 7.9 %, 6.8 % and 6.1 %, respectively. Calm conditions (wind speeds < 0.5 m/s) occurred for 0.9 % of the time. The average wind speed during the period was 2.17 m/s. Based on the data from the on-site meteorological station, the south-southwest winds dominate the overall regime for the area.
| S-K 1300 Technical Report Summary on the Songwe Hill REE Project | Page 76 of 489 |
| |
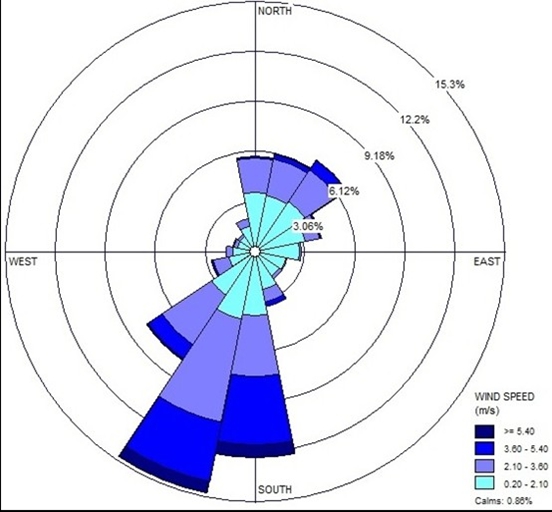
Figure 4.1: Wind Rose for Songwe Hill
Wind speeds of greater than 5.4 m/s, which can generate fugitive dust from open areas such as the waste rock dump (WRD) and the tailings storage facility (TSF), occurred for 1.8 % of the time. Diurnal variability in the wind fields was also assessed. During the night, wind field conditions from the south prevailed for 18 % of the time, from the south-southwest for 16.9 % of the time, and from the east-northeast for 8.1 % of the time. Wind speeds greater than 5.4 m/s occurred for 2.8 % of the time. The morning is dominated by wind fields from the north-northeast (11.6 %), northeast (10.4 %), and south-southwest (9.8 %). Wind speeds greater than 5.4 m/s occurred for 0.7 % of the time.
| 4.2.2 | Temperature |
As seen in Figure 4.2, the monthly mean temperature during 2014 to 2021 (site data) was between 20.3 °C and 29.0 °C. The annual average ranged between 25.3 °C and 27.7 °C. The monthly maximum temperatures ranged from a low of 30.6 °C in June to a high of 46.1 °C in October.
| S-K 1300 Technical Report Summary on the Songwe Hill REE Project | Page 77 of 489 |
| |
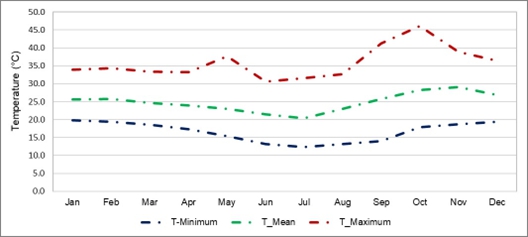
Source: Songwe Hill Meteorological Station (2014-2021)
Figure 4.2: Monthly Temperature for Songwe Hill
| 4.2.3 | Relative Humidity |
The average monthly relative humidity (see Figure 4.3) ranges from 46.7 % in October to 76.7 % in January.
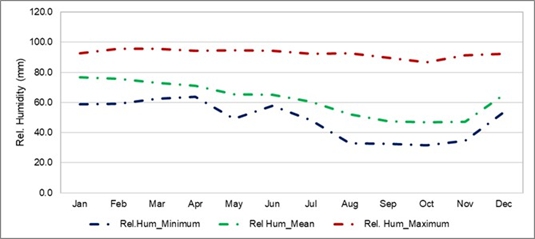
Source: Songwe Hill Meteorological Station (2014-2021)
Figure 4.3: Average Monthly Relative Humidity
| 4.2.4 | Precipitation |
The rainy season is from November to April, with the mean monthly rainfall peak in January, with 289.7 mm of rain measured. Much of the Project area receives little to no rainfall from May to October (see Figure 4.4). Heavy rainfall occurs in January and February with the potential to cause flooding. The annual total rainfall measured from 2014 to 2021 varied between 946.7 mm and 1,292.5 mm.
| S-K 1300 Technical Report Summary on the Songwe Hill REE Project | Page 78 of 489 |
| |
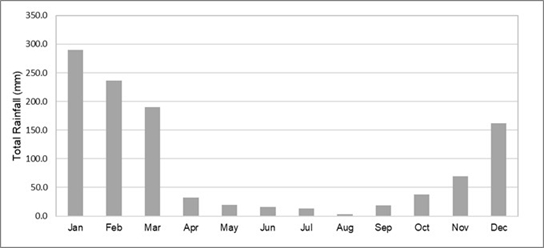
Source: Songwe Hill Meteorological Station (2014–2021)
Figure 4.4: Total Monthly Rainfall
| 4.3 | Physiography |
To the north of Songwe Hill, the physiography comprises an alluvial plain immediately south of Lake Chilwa, which passes southwards into a more elevated region characterised by numerous hills and mountains. Some mountains are marked by steep cliffs and areas of bare rock, while other hills are completely wooded, varying from dense tropical forest to a more open forest comprising the Vachellia species.
The vegetation changes significantly between the rainy and dry seasons. Following the rainy season, the higher ground is covered by a dense growth of elephant grass, which can reach 3 m in height in open areas. In the dry season, the grass cover withers and is commonly burnt to expose bare ground and rock. The lower lying areas, apart from a zone adjacent to Lake Chilwa, are prone to flooding in the rainy season and support occasional villages, with the land intensively farmed for tobacco, maize, cassava, and sweet potatoes.
The Songwe Hill carbonatite-fenite complex forms a moderate- to steep-sided conical hill with a diameter of approximately 800 m and a summit elevation of 990 m. On the south-eastern side, Songwe Hill abuts against the higher Mauze Mountain, which rises to an elevation of 1,592 m. The wetlands in the Project area are associated within the larger Lake Chilwa catchment, with ephemeral streams and seasonal, temporary and permanent wetlands draining into the Mpoto Lagoon. Large portions of the wetlands have been heavily impacted and cleared for agricultural activities.
The Project area falls under the tropical and subtropical grasslands, savannahs, and shrublands terrestrial biome and belongs to the Southern Miombo Ecoregion. Floristically, this ecoregion forms part of a wide belt of the Miombo woodland. There are no biodiversity hotspots, key biodiversity areas, or protected areas within the Project area.
| S-K 1300 Technical Report Summary on the Songwe Hill REE Project | Page 79 of 489 |
| |
| 4.4 | Local Resources and Infrastructure |
The dominant tribe is the Lomwe tribe, with Lomwe being the dominant language spoken among the inhabitants. Most households use three separate structures including the primary sleeping area, kitchen and pit latrine. There are a few instances of households having four structures with the fourth being used as a business unit. The inhabitants live in extreme poverty, relying on subsistence agricultural and fishing in the Project area. Access to education is limited, there are 11 primary schools in the Project area and the closest secondary or tertiary schools are in the towns of Migowi and Phalombe. A new secondary school and health clinic have been constructed by the Malawian government in the Namalima village. A health clinic has also been constructed by the government at Changa School.
Access to potable water is reasonable in the Project area. Communities rely on water from boreholes, six of which (fitted with handpumps) were drilled by Mkango and an additional five boreholes have been maintained by MKAR. The majority of households (80 %) have a pit latrine. Phalombe lies in a basin where cholera, malaria, and drought often occur. Surface water is mainly used for irrigation and livestock watering.
| S-K 1300 Technical Report Summary on the Songwe Hill REE Project | Page 80 of 489 |
| |
| 5 | History |
| 5.1 | Ownership History |
There are no public records documenting the history of mineral tenure in the Project area. The Geological Survey Department of Malawi (GSDM) has no record of any exploration being carried out in the Project area prior to the late 1980s.
| 5.2 | Historical Exploration |
Historical work referenced below to Dixey et al. (1937), Garson (1962, 1965), Garson and Walshaw (1969), and Hunting Geology and Geophysics Limited (1985) was regional in nature and included work outside the boundaries of the current Phalombe Licences. Work referenced to Lewis (1953) and the Japan International Cooperation Agency and Metal Mining Agency of Japan (1989) was conducted within the boundaries of the current Phalombe Licences.
| 5.2.1 | Pre-1981 Programmes |
The geological sequence in the southern Chilwa Province was originally defined and referred to as “The Chilwa Series” by Dixey et al. (1937) in a monograph that is notably important for identifying and describing carbonatites in Africa for the first time. Dixey et al. (1937) recognised eleven occurrences of carbonatite in Malawi, which at that time more than doubled the global total of known carbonatites. Two localities in the Phalombe District, Songwe Hill and Tundulu, were investigated by Dixey et al. (1937), who described the Songwe Hill occurrence as a volcanic vent comprising limestone, feldspar rock and agglomerate. The authors produced a simple sketch map, along with photographs of hand specimens of agglomerate and feldspathic breccia, and concluded that the limestone found at Songwe Hill and other localities in the Chilwa Province was of magmatic origin and comparable to the carbonatites of the Fen complex in Norway.
The Songwe Hill Ring Structure was the subject of a brief unpublished report for the Nyasaland Mining Corporation Ltd in 1953 (Lewis, 1953).
Significant new work on the carbonatites of Malawi was conducted in the early 1950s. Of particular interest is Garson’s work with the Nyasaland Geological Survey. Building on earlier descriptions of specific occurrences in the area (Garson, 1962), he provided a comprehensive account of the carbonatites of Malawi including a detailed description of Songwe Hill (Garson, 1965) with a geological map indicating a volcanic vent filled with feldspathic breccia and agglomerate and cut by arcuate sheets of carbonatite. He showed that rocks of the Precambrian basement were fenitised in the vicinity of the vent and interpreted the calcite-silicate rocks on the eastern margin to be the product of the reaction between carbonatite and nepheline syenite. Garson (1965) also noted that the agglomeritic rocks at Songwe Hill resembled feldspathic fenites of the Nkalonje vent and the Tundulu carbonatite complex, both in the Phalombe District. He provided mineralogical descriptions of the latter occurrences and noted the presence of accessory minerals including apatite, pyrochlore, synchysite, bastnäsite and fluorite.
In a later publication, Garson and Walshaw (1969) outlined the geology of the Mulanje area, including a description of the “Songwe Hill Carbonatite Vent”. The authors noted the presence of REE-bearing minerals at Tundulu but did not describe them.
| S-K 1300 Technical Report Summary on the Songwe Hill REE Project | Page 81 of 489 |
| |
| 5.2.2 | Post-1981 Programmes |
| 5.2.2.1 | Geophysical Surveys |
Airborne geophysical surveys covering the whole of Malawi were carried out in 1984 by Hunting Geology and Geophysics Ltd (Hunting) under contract to the United Nations (Project MLW/ 80/030) (Hunting Geology and Geophysics Limited, 1985). The data was obtained, dependent on the terrain, from fixed wing and helicopter surveys flown with a flight line spacing of 1,000 m at mean sensor elevations of 120 m and 50 m, respectively. Using the data collected by Hunting, the GSDM published a series of aeromagnetic, gravity, and radiometric maps with scales of 1:250,000, 1:100,000 and 1:50,000.
The GSDM compiled 1:100,000 map sheets of the interpreted anomaly coverage from electromagnetic (EM) survey data acquired in 1984 and 1985 by Hunting. The data was obtained using a Geonics EM33-3 helicopter-based EM system with a nominal sensor elevation of 30 m and a flight line spacing of 1,000 m. The anomalies were selected from the analogue profiles in the field and interpreted using either vertical thin dyke or uniform half-space models, as appropriate.
In the Phalombe District, the resolution of the geophysical maps is lower than that in most of Malawi due to the extreme relief caused by mountains rising steeply from the surrounding plain, forcing flight specifications to be altered.
| 5.2.2.2 | Japan International Cooperation Agency and Metal Mining Agency of Japan (1986 to 1988) |
In response to a request from the Government of the Republic of Malawi, the Government of Japan conducted a mineral exploration programme in the Chilwa Alkaline Province from 1986 to 1988. The work was overseen by the Japan International Cooperation Agency (JICA) and operated by the Metal Mining Agency of Japan (MMAJ) working together with the GSDM. JICA and MMAJ completed a detailed investigation of the potential for REE mineralisation in southern Malawi including the Songwe Hill deposit. Following the first phase of the programme, which comprised geological and geochemical surveys, JICA and MMAJ concluded that Songwe Hill, as well as other occurrences within and adjacent to the present Phalombe Licences, had a “high potentiality” for a “carbonatite deposit”.
The programme was divided into three phases corresponding to the work carried out from 1986 to 1988, and the results have been compiled in the “JICA and MMAJ Report on the Cooperative Mineral Exploration in the Chilwa Alkaline Area, Republic of Malawi, Phases I, II and III, Consolidated Report, 1989”.
The first phase involved a route survey (geological field survey) of 13 km, the collection of 89 geochemical samples, the completion of a single whole-rock chemical analysis, and a single thin section for mineralogical purposes. The sampling programme largely focused on carbonatite and related rocks with analyses for REE comprising lanthanum, cerium, neodymium, samarium, europium, terbium, dysprosium, ytterbium and yttrium as well as strontium, niobium and thorium. The grade range in the samples was 0.3–2.9 % TREO at an average of 1.2 % TREO. The reports contain no information on the method of REE analysis or any quality assurance and quality control (QA/QC) protocols that may have been implemented.
| S-K 1300 Technical Report Summary on the Songwe Hill REE Project | Page 82 of 489 |
| |
Following the positive Phase 1 results, the work programme proceeded to Phases 2 and 3 in 1987 and 1988, respectively. Phases 2 and 3 were more comprehensive and included the drawing of a detailed geological map over an area of 3.2 km2, a route survey of a further 9 km, excavation of 600 m of trenches, collection and assay of 151 surface geochemical samples, preparation of 13 thin sections and 20 polished sections, 14 X-ray diffraction (XRD) analyses, one electron probe microanalysis, and two drilling programmes.
The geological map distinguishes carbonatite and agglomerate/feldspathic breccia and in this respect does not differ from Garson’s 1965 map. However, it does show a more complex distribution of the carbonatite and notably indicates the presence of two large, continuous areas of carbonatite on the northern slope and a somewhat smaller occurrence on the lower north-eastern side of the hill.
The 1987 Phase 2 drilling programme comprised 11 diamond drillholes totalling 558 m and defined a number of mineralised zones. The average core recovery, excluding the unconsolidated soils, was 94 %.
The subsequent Phase 3 drilling programme in 1988 was aimed at better defining the extent and grade of the mineralised zone intersected in Phase 2 on the northern side of Songwe Hill. Two rigs were used to drill eight holes totalling 401.2 m with a maximum vertical drillhole depth of 55 m. The drilling followed the same procedures as in Phase 2, and the average core recovery (excluding soils) was 95 % during Phase 3.
There is no information on the sampling methods used in the JICA and MMAJ drilling programmes, other than that the drillhole core was halved prior to chemical analyses of 191 core samples. A total of 109 core samples with an average length of 2.3 m were analysed from the first phase of drilling, while the samples from the second phase had an average length of 4.6 m. The reports do not detail the analytical methods or any QA/QC protocols that JICA and MMAJ may have adopted for the sample preparation or chemical analyses. It has not proved possible to identify the locations of any of these drillhole collars in the field.
The Phase 2 and 3 drillhole core samples in 5 m lengths were assayed for seven REEs, namely lanthanum, cerium, neodymium, samarium, europium, terbium and yttrium as well as strontium, niobium and phosphorous. The geological logs of the drillhole cores indicate broad intersections of carbonatite in a number of drillholes, including JMS 14 (46 m at 1.3 % REO), JMS 16 (50 m at 1.5 % REO) and JMS 18 (50 m at 3.1 % REO) and were used to assess the three-dimensional distribution of the individual carbonatite bodies to a vertical drillhole depth of 50 m. The holes were drilled with a nominal length of 50 m, but the collars were positioned at various elevations near the top of Songwe Hill and northwards down the slope with the result that only the outer shell of the deposit was drill-tested.
The principal REE-bearing minerals identified by JICA and MMAJ, using thin section, polished section, X-ray fluorescence (XRF) and electron probe microanalysis, included synchysite, bastnäsite, parisite, strontianite, monazite, pyrochlore and apatite.
JICA and MMAJ
noted (Phase 3 Report, page 53, 1989) that “samples from Songwe Hill sector are more enriched in medium REE than those from
Tundulu, Kangankunde and Chilwa Island sectors [in Malawi]”. JICA and MMAJ defined the medium REE as samarium, europium and
terbium.
| S-K 1300 Technical Report Summary on the Songwe Hill REE Project | Page 83 of 489 |
| |
| 6 | Geological Setting, Mineralisation, and Deposit |
| 6.1 | Geological Setting |
| 6.1.1 | Regional Geology |
The Songwe Hill Project is located within the Chilwa Alkaline Province, which is centred in southern Malawi and extends into adjacent areas of Mozambique (see Figure 6.1).
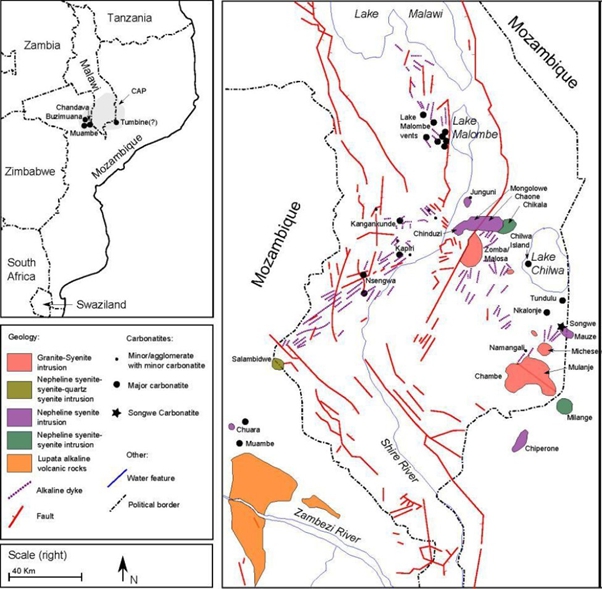
Source: Broom-Fendley (2017) modified after Woolley (2001)
Figure 6.1: Distribution of Chilwa Province Alkaline Intrusions in Southern Malawi and Mozambique
Rocks in southern Malawi range in age from Precambrian to Cretaceous and are in many areas covered by Tertiary to Recent lacustrine sediments. A comprehensive description of all rock units can be found in Garson and Walshaw (1969). The oldest rocks in the area are assigned to a Precambrian Basement Complex that consists of charnockitic granulites and gneiss. The gneiss around the Songwe Hill area is typically paragneiss but orthogneiss is found elsewhere in the region. The Basement Complex was intruded during the Jurassic by a dolerite dyke swarm of the Stormberg Series. The latter are genetically linked to the basaltic lavas of the Karoo Supergroup which occur throughout southern Africa.
| S-K 1300 Technical Report Summary on the Songwe Hill REE Project | Page 84 of 489 |
| |
The geological units of significance with respect to REE mineralisation in the Songwe Hill area are intrusions and lavas of the Jurassic/Cretaceous Chilwa Alkaline Province. The Chilwa Alkaline Province comprises large alkaline intrusions ranging from Mulanje, which is a massif that covers approximately 640 km2 and rises some 3,000 m above the Phalombe Plain (750 m), to the Michese intrusion with a diameter of 8 km, to the smaller Machemba intrusions and minor plugs and dykes measuring only a few tens of metres in length. These intrusive centres, mainly early Jurassic in age, comprise a variety of alkaline silica-saturated and silica undersaturated lithologies locally associated with carbonatites and are unrelated to the modern rift system. A general account of the tectonic setting has been given by Woolley and Garson (1970).
Although the Chilwa Alkaline Province is dominantly intrusive at the present level of exposure, there are local minor remnants of extrusive rocks. A comparison with alkaline provinces along the East African Rift to the north suggests that volcanic rocks at Chilwa Island may have originally been very extensive. The Chilwa Alkaline Province is remarkable for the diversity of rock types which include granites, quartz syenites, syenites and trachytes, nepheline syenites and phonolites, ijolites and nephelinites, and a plethora of dykes and carbonatites with associated fenites. Three principal lithological associations have been identified based on field relationships (Woolley, 1987), geochemistry (Woolley and Jones, 1987), and K-Ar age dating (Eby et al., 1995):
| ● | Nephelinitic lavas and nepheline syenite coeval with carbonatite (133 million years old (Ma)) |
| ● | Nepheline syenite and syenite (126 Ma) |
| ● | Syenite and peralkaline granite (123 Ma) |
Carbonatites are widely present throughout the Chilwa Alkaline Province. There are 17 documented carbonatites in southern Malawi and adjacent Mozambique at the junction of the north-south-trending fault system of the East African Rift and east-west-trending fault system of the Zambezi Rift (Garson, 1965, 1966). In addition to the large carbonatitic intrusion at Songwe Hill, there are three other substantial carbonatite complexes within the province: Chilwa Island, Kangankunde and Tundulu. Numerous smaller carbonatites occur throughout the province and include dykes, sheets, small plugs and a carbonatitic volcanic vent at Nkalonje. Igneous silicate rocks comprise only a few small dykes and sheets of nephelinite, ijolite, trachyte and alnöite at the Chilwa Island carbonatite centre whilst there are no igneous silicate rocks associated with the Kangankunde carbonatites. However, there are significant intrusions of nepheline syenite, ijolite and feldspathoid-bearing carbonate-silicate rocks associated with the carbonatite at Tundulu. The four large carbonatite complexes have metasomatic aureoles characterised by the presence of fenites, which extend up to 2 km from the margins of the carbonatite. The fenites are mostly sodium-rich and comprised essentially of sodic pyroxenes and amphiboles. In addition, there are domains of potassic fenite which are intimately associated with the carbonatite, consisting mainly of K-feldspar reflecting a potassium rather than sodium metasomatism.
| S-K 1300 Technical Report Summary on the Songwe Hill REE Project | Page 85 of 489 |
| |
The largest intrusions of the Chilwa Alkaline Province in Malawi, notably Mulanje and Zomba, comprise peralkaline granite and quartz syenite similar to the large intrusion of Michese, which occurs immediately north of Mulanje. Some of the nepheline syenite and syenite intrusions have a considerable size. For instance, the four overlapping nepheline syenites north of Zomba extend nearly 40 km in an east-west line. Most of the igneous centres include swarms of dykes, and there are several volcanic vents including the six that make up the Malombe vents in the north of the Chilwa Alkaline Province (see Figure 6.1). In the Phalombe licence area, the vent in the Nkalonje complex is filled with breccia and agglomerate while the Namangale occurrence contains feldspathic and phonolitic breccias. The Songwe Hill centre comprises both carbonatite and phonolite intrusions, and their brecciated equivalents.
Intrusions in the northern part of the Chilwa Alkaline Province span ages from about 98 Ma to 137 Ma, making it the oldest igneous province associated with the eastern branch of the East African Rift. This relatively old age, in terms of the general rift volcanism, explains the typically intrusive nature of the province and paucity of extrusive rocks. Reviews of the general geology are provided by Woolley and Garson (1970) and Woolley (1991), while Woolley (2001) presents brief accounts of all the individual carbonatite occurrences.
| 6.1.2 | Geology of the Songwe Hill Carbonatite Complex |
Songwe Hill is interpreted as a carbonatite intrusion–breccia complex expressed as a steep-sided hill with a diameter of approximately 800 m. The general geology of the complex was described by Broom-Fendley et al. (2017). Information from surface mapping and drill core indicates that the complex consists of a multi-phase intrusion characterised by early intrusion of nepheline syenite (the Mauze nepheline syenite) and phonolite cut by diverse carbonatites and breccias exhibiting a range of alteration from potassic fenitisation to low-temperature hydrothermal/carbohydrothermal overprinting (see Figure 6.2 and Figure 6.3). The entire complex is cut by phonolite dykes, which appear to represent either a continuous event or multiple pulses during and after carbonatite emplacement.
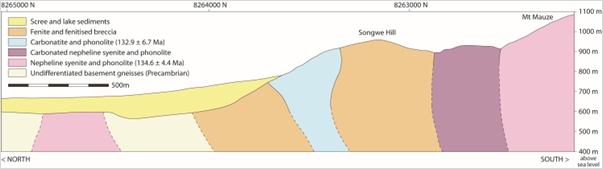
Source: Dr Paul Armitage (2025)
Figure 6.2:
Simplified Local Geological Cross Section and
Chronological/Stratigraphic Column
Traces of lithological contacts are based on geological mapping and drilling (solid lines) and geophysical interpretation (stippled lines). Ages of Mauze nepheline syenite and Songwe carbonatite are as described in Broom-Fendley et al. (2017). Grid marks at the top of the figure are UTM Zone 36S northings.
| S-K 1300 Technical Report Summary on the Songwe Hill REE Project | Page 86 of 489 |
| |
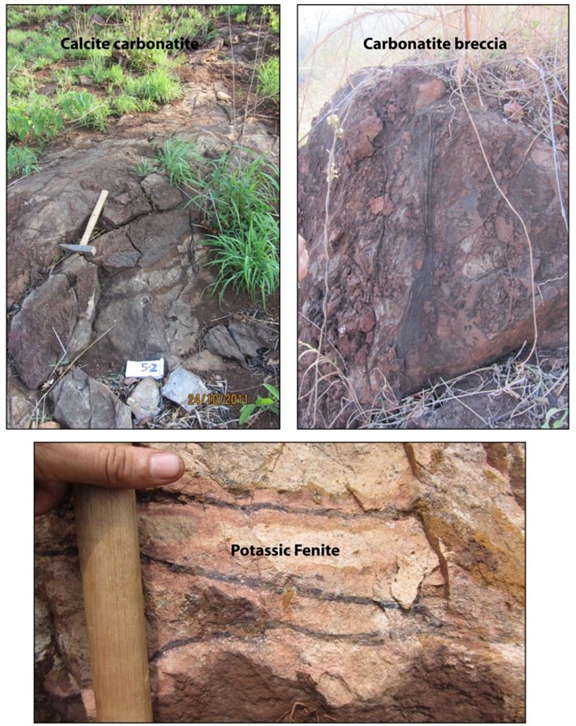
Source: Photographs by Mkango Resources Ltd (2012)
Figure 6.3: Outcrops of the Major Rock Types at Songwe Hill
The intrusive/breccia complex abuts the western slope of the large Mauze nepheline syenite intrusion, but the contacts on the northern sides of the vent are hidden beneath recent surficial deposits (see Figure 6.4). It is possible that the carbonatite complex is in contact with Precambrian gneisses in this area because Chenga Hill, which is located less than 200 m west of the probable western margin of the Songwe Hill intrusion, includes fenitised gneisses and breccias. A nearby remnant of Precambrian gneiss north and northwest of the complex is also fenitised, although a screen of nepheline syenite intervenes between the gneiss and the intrusion. The fenitisation is interpreted to be the result of carbonatite intrusion, although it is also possible that the Mauze nepheline syenite had some role in the fenitisation process. The occurrence of carbonate-silicate rocks along the eastern margin of Songwe Hill was interpreted by Garson (1965) to be the product of metamorphism of the nepheline syenite by the Songwe Hill carbonatite.
| S-K 1300 Technical Report Summary on the Songwe Hill REE Project | Page 87 of 489 |
| |
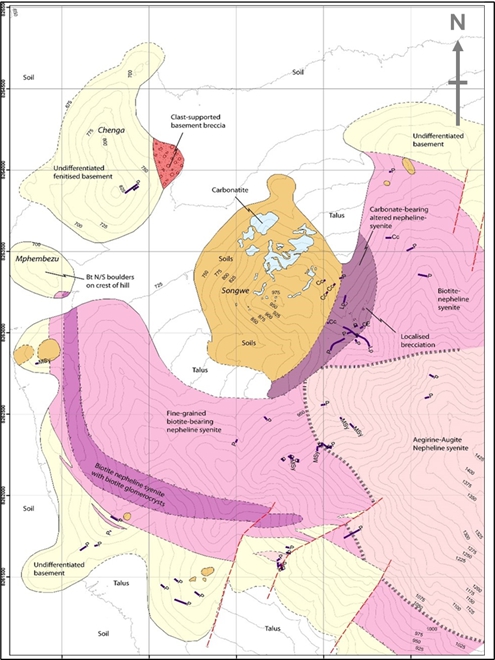
Source: Map by Dr Sam Broom-Fendley (2018, unpublished)
NOTE: Colours refer to rock units and are labelled.
Figure 6.4: Geology of Songwe Hill and Environs
Broom-Fendley et al. (2017) reported U-Pb (zircon) ages of 132.9 Ma ± 6.7 Ma and 135.6 Ma +2.5 Ma −3.8 Ma for Songwe Hill carbonatite and of 134.6 Ma ± 4.4 Ma for Mauze syenite. The two lithologies are therefore indistinguishable in age, and although field evidence indicates that the Mauze silicate intrusions are older than the carbonatites, they are considered to be part of a single, broadly continuous magmatic event.
| S-K 1300 Technical Report Summary on the Songwe Hill REE Project | Page 88 of 489 |
| |
| 6.1.2.1 | Carbonatite |
The carbonatites are best exposed along the northwest facing slopes of Songwe Hill (see Figure 6.5). Broom-Fendley et al. (2017) identified three recognisable carbonatite phases in the Songwe Hill complex: coarse-grained calcite carbonatite (C1), fine-grained calcite carbonatite (C2), and iron-enriched ferroan calcite carbonatite (C3) (see Figure 6.6).
All carbonatite lithologies at Songwe Hill are mineralised with REE but the tenor of the mineralisation is variable. Broom-Fendley et al. (2017) summarised analytical data from the 2011 and 2012 drilling campaigns indicating that, on average, the ferroan (C3) carbonatites and Mn-Fe veins are more intensely mineralised than the grey calcic carbonatites (C1 and C2).
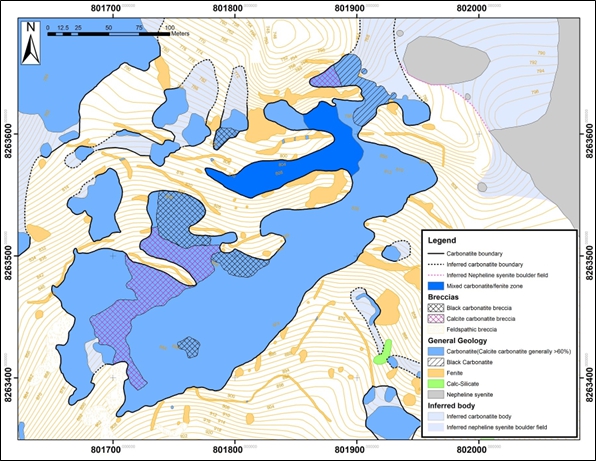
Source: Mkango Resources Ltd internal map (2012)
NOTE: UTM Zone 36S and WGS84 Datum, contour lines at 2 m intervals
Figure 6.5: Surface Geological Map of Songwe Hill
| S-K 1300 Technical Report Summary on the Songwe Hill REE Project | Page 89 of 489 |
| |
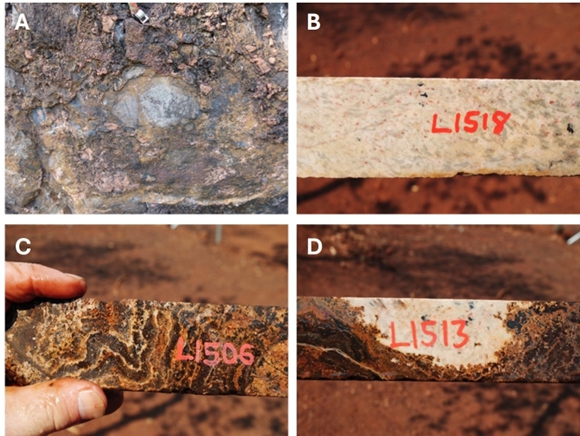
Source: Photographs by Dr Scott Swinden (2018)
A – A fragment of coarse C1 calcite carbonatite in fenite breccia
B – White fine-grained C2 calcite carbonatite
C – Laminated and veined black to orange C3 carbonatite
D – Enclave of C2 carbonatite surrounded by C3 carbonatite
Figure 6.6: Principal Carbonatite Lithologies in the Songwe Hill Complex
| 6.1.2.1.1 | Coarse-Grained Calcite Carbonatite (C1) |
C1 carbonatite is the least common carbonatite phase at Songwe Hill. It is only seen as rare, rounded clasts in other carbonatite types in outcrop and has rarely if ever been observed in drillhole core. Broom-Fendley et al. (2017) described it as comprising mainly anhedral, medium-grained calcite with minor ankerite, relatively coarse-grained apatite and zircon, and accessory pyrite, pyrochlore and K-feldspar. C1 carbonatites contain euhedral to subhedral zoned zircon which are interpreted as magmatic. Broom-Fendley et al. (2017) suggested that C1 carbonatites may represent a cumulate originating in a deeper level of the intrusion.
| 6.1.2.1.2 | Fine-Grained Calcite Carbonatite (C2) |
C2 carbonatite constitutes by far the most abundant carbonatite at Songwe Hill. It forms irregular, massive bodies and occurs as clasts and/or matrix in breccias. It is a dominantly white, calcite-rich carbonatite but includes a range of compositions that include more iron-rich compositions. C2 carbonatite is mineralogically and chemically similar to C1 carbonatite and may closely approach the primary carbonatite liquid composition. Petrographic studies have shown that C2 carbonatite consists predominantly of Fe- and Mn-rich calcite, with varying proportions of Mn-bearing ankerite apatite. Broom-Fendley et al. (2017) identified xenocrystic pyrite, zircon and K-feldspar and localised synchysite (Ce), barite and strontianite.
| S-K 1300 Technical Report Summary on the Songwe Hill REE Project | Page 90 of 489 |
| |
C2 Carbonatite is typically fine-grained and light grey to pinkish white in colour. Sulphides, mainly pyrite, are abundant and occur as disseminations, patches and veins. Fluorite is present as locally abundant patches or blebs and can impart a purple hue to the rock. Mineralisation is fine-grained and widely dispersed in these rocks and is not typically seen in hand specimen or outcrop. Narrow ferro-carbonatite veins are common along with occasional late-stage calcite veining.
| 6.1.2.1.3 | Ferroan Calcite Carbonatite (C3) |
C3 carbonatite is more heterogeneous than C2, typically dark brown or black to orange and red in colour, and intensely veined by black Fe- and Mn-rich veins. It typically displays laminated veining textures indicating that it has been extensively altered. It occurs as veins, breccia clasts and/or matrix, and large irregular masses. C3 carbonatites typically weather dark grey to black and texturally are dominated by laminated vein textures containing alternating ferroan calcite and apatite. It contains Fe- and Mn-rich calcite, and Fe- and Mn-oxides, apatite and minor amounts of alkali (K) feldspar and zircon.
There are systematic but relatively minor compositional differences between C2 and C3 carbonatites. C3 carbonatites are enriched in iron, manganese and phosphorous and depleted in calcium and potassium relative to C2 carbonatites (Broom-Fendley et al., 2017) and generally contain higher concentrations of REE.
Mineralisation can often be recognised in the dark Mn-Fe-rich carbonatite by the pervasive streaks of orange pink to white rare earth fluorocarbonate minerals and apatite.
A variety of the C3 carbonatites, locally termed “black carbonatite”, outcrops in the north-eastern part of the deposit and contains the consistently highest REE grades of any lithology in the deposit. It can be traced at surface for approximately 50 m in an east-west direction and to a depth of approximately 60 m beneath the surface of the hill. The black carbonatite is texturally complex, heterogeneous on the local scale, ranging in colour from black to light grey with a highly variable fabric comprising various late-stage cross-cutting Fe-carbonatite veins. The higher TREO content in the black carbonatite does not reflect differences in REE mineralogy compared to the calcite carbonatite but a greater abundance of the REE-bearing minerals.
| 6.1.2.1.4 | Late Veins |
Black Mn-Fe veins (see Figure 6.7A and B) are abundant throughout the complex and cross-cut all lithologies, although they are most abundant in the fenites, fenite breccias and the C3 carbonatites. Veins typically range in size from less than 1 cm to several metres and occur as the matrix to late-stage breccias comprising a mixture of Fe-bearing carbonatites (calcite and ankerite) and Fe- and Mn-oxides. The veins exhibit a wide range of Mn-Fe ratios and are typically mineralised with synchysite (Ce) and apatite, particularly when relatively Mn-rich. Locally, veins of almost pure Fe-oxide are found; these are typically unmineralised.
| S-K 1300 Technical Report Summary on the Songwe Hill REE Project | Page 91 of 489 |
| |
The Mn-Fe veins are typically highly calcic and contribute significantly to the grade of REE in rocks where they are abundant. In breccias, where the REE are already present in carbonatite breccia fragments or matrix, they result in an upgrading of the concentration of REE. In fenites, where there is little REE in the rock, they can locally result in narrow higher-grade intersections.
The Songwe Hill complex is also cut by a wide variety of late apatite-fluorite veins seen locally in both outcrop and drill core. These veins are widely dispersed and contain fluorite, apatite, calcite and barite and elevated concentrations of REE (Broom-Fendley et al., 2017) (see Figure 6.7C).
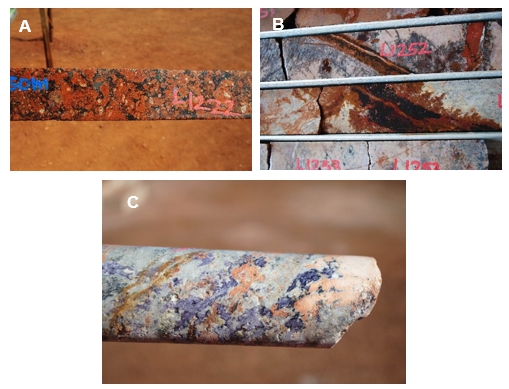
Source: Photographs by Dr Scott Swinden (2018)
A – Black Mn-Fe veining as the matrix to a fenite breccia
B – Black Mn-Fe veins cutting C2 carbonatite
C – Fluorite-apatite veins containing REE fluorocarbonate (light brown)
Figure 6.7: Examples of Mn Veining and Apatite in Drill Cores
| S-K 1300 Technical Report Summary on the Songwe Hill REE Project | Page 92 of 489 |
| |
| 6.1.2.2 | Fenite |
Potassium fenite surrounds the mineralised carbonatite body at surface and is present in virtually all drillholes where it is typically intimately intermixed with the carbonatite. The fenites are characteristically light red in colour (see Figure 6.3 and Figure 6.8) and composed essentially of alkali (K) feldspar with minor aegirine and accessory apatite, zircon and iron oxides. The fenites display a wide range of alteration intensity, from lightly discoloured phonolites and syenites in which much of the original mineralogy and textures are preserved, to completely altered rocks composed essentially of K-feldspar in which no original textures are preserved.
No vertical zonation of fenitisation has been observed in the drillhole core at Songwe Hill, and potassic fenites extend from surface to deeper levels. However, the fenites that occur on Chenga Hill, north of Songwe Hill, are sodic in nature. Garson (1965) described them as containing aegirine, aegirine-augite, a blue sodic amphibole and albite. This is consistent with the fenitisation pattern at other carbonatite complexes in Malawi, where potassic fenites are intimately associated with carbonatite while sodic fenites occur at some distance from the carbonatite margin.
The fenite on Songwe Hill occurs both as in-situ mass forming large irregular bodies that mantle the carbonatite intrusion, and as blocks and small fragments in breccias (see Figure 6.7A). On the upper reaches of the hill, fenite appears to mantle the carbonatite and black Fe- and Mn-rich carbonate veins, which are believed to originate in the carbonatite, locally intrude the fenite. The Songwe Hill complex is interpreted to represent a complex carbonatite-silicate intrusive, and many of the fenite blocks are interpreted to be dismembered, originally phonolite, blocks, some of which may have been emplaced along late, intrusion-related faults.
Fenite is variably mineralised, and the degree of mineralisation is a function of the degree of carbonatisation and/or intensity of late-stage veining of the fenite. Along the north-western and eastern side of Songwe Hill, the fenite is relatively uncarbonatised, geochemically characterised by consistently low CaO (~ 7 wt%) and high SiO2 and K2O concentrations (averages of 17 wt% and 7 wt%, respectively), and can be traced in drillholes from surface to depth with values of consistently less than 0.5 % TREO.
Well-defined lithological and geochemical contacts are observed between the fenite and carbonatite at the north-western side of Songwe Hill (see Figure 6.8). Further south, the fenite becomes more intimately associated with the carbonatite and is variably carbonatised and cross-cut by multiple generations of late-stage Mn-Fe-rich carbonatite veins. In these areas, the fenite contains lower concentrations of SiO2 and K2O but higher concentrations of CaO and consequently REE concentrations may exceed 1 % TREO.
| S-K 1300 Technical Report Summary on the Songwe Hill REE Project | Page 93 of 489 |
| |
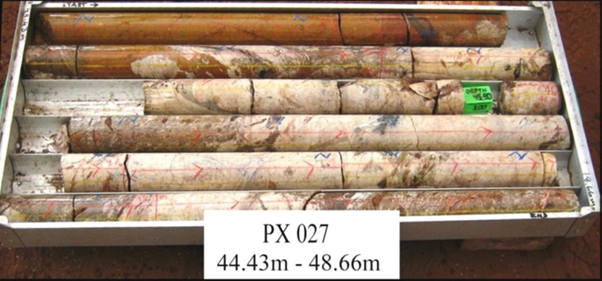
Source: Photograph with annotation by Mkango Resources Ltd (2012)
Figure 6.8: Example of Contact Between Fenite and C2 Calcite Carbonatite
| 6.1.2.3 | Breccia |
The Songwe Hill complex includes breccias that range from clearly abraded pebble-sized fragments (pebble dykes) to metre-sized angular blocks as well as significant volumes of breccias in which the fragments appear to have undergone little or no movement. The breccias are variably mineralised and the degree of mineralisation is a function of the proportion of carbonatite. The breccias can essentially be divided into two types: C2 carbonatite-rich breccias and C3 feldspar-rich breccias.
| 6.1.2.3.1 | C2 Carbonatite-Rich Breccia |
Carbonatite-rich breccias contain an abundance of light grey, fine-grained calcite carbonatite clasts, with subordinate fenite clasts in a similarly fine-grained carbonate-rich matrix (see Figure 6.3). The calcite carbonatite breccias are light grey to orange-red in colour depending on the proportions of calcite carbonatite and fenite fragments. Typically, carbonatite breccias contain abundant angular to sub-angular calcite carbonatite fragments in a fine-grained grey carbonatitic to feldspathic matrix. Similar to the main calcite carbonatite lithology, fluorite and sulphides are abundant and occur as disseminations, patches and veins.
Gradational relationships can be observed from one variety of breccia into another, indicating a complex process of intrusion, fragmentation and continuous movement of a carbonatite-breccia mixture. The breccias, regardless of type, are invariably cross-cut by numerous late-stage black Fe- and Mn-rich carbonate veins.
| 6.1.2.3.2 | C3 Feldspar-Rich Breccia |
C3 carbonatite breccias consist of a mixture of fenite and carbonatite fragments with varying shapes from rounded to angular and typically have spotted, striped and patchy late-stage textures. The feldspar-rich breccias consist mainly of light red alkali-feldspar-rich (orthoclase or sanidine; Garson, 1965) fenite clasts and fragments, partially fenitised phonolite and nepheline syenite and minor clasts of calcite carbonatite (see Figure 6.7A). The matrix is fine-grained, carbonatitic in nature and composed of abundant Fe- and Mn-oxides, Fe-rich carbonates and alkali feldspar with occasional pyrochlore. In some cases, the matrix can have a relatively high silica content reflecting the comminution of fenite during formation of the breccias.
| S-K 1300 Technical Report Summary on the Songwe Hill REE Project | Page 94 of 489 |
| |
The level of rare earth mineralisation in the breccias is more variable than in the carbonatites and directly related to the proportion of carbonatite to fenite fragments and the amount of carbonatitic matrix.
| 6.1.2.4 | Silicate Dykes |
Late-stage silicate dykes have been identified in abundance in drillhole core and at surface. The dykes are mainly phonolitic in composition, aphanitic or porphyritic in texture, and exhibit a wide degree of alteration ranging from minimal modification to extensive alteration and fenitisation (see Figure 6.9). Subrounded to subangular xenoliths of relatively unaltered nepheline syenite are very common in the dykes (see Figure 6.10). Syn-intrusion and post-intrusion faulting of the dykes are evident across Songwe Hill although displacements appear to be relatively small. In general, however, dykes occur in a wide spectrum of deformation: from virtually undeformed and internally pristine, through extensively disrupted but still recognisable dykes, to dispersed fragments (see Figure 6.11). The ubiquitous clasts that characterise the “mixed rock” are now considered to be fragments of early syn-carbonatite phonolite dykes torn up by the continually intruding or pulsing carbonatite magma (see top right photograph in Figure 6.3).
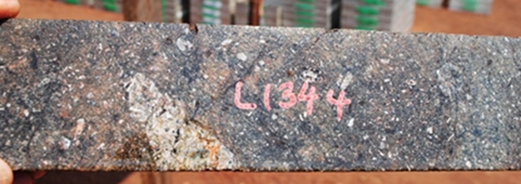
Source: Photograph by Dr Scott Swinden (2018)
Figure 6.9: Phonolite Dyke in Drill Core, Lightly Fenitised with Phenocrysts of K-Feldspar and Nepheline and a Xenolith of Coarse-Grained Nepheline Syenite
| S-K 1300 Technical Report Summary on the Songwe Hill REE Project | Page 95 of 489 |
| |
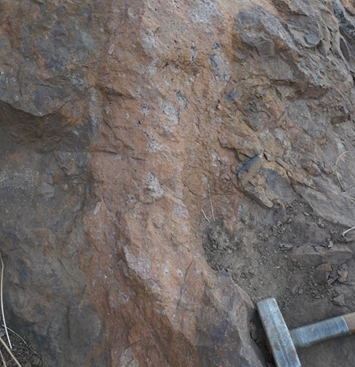
Source: Photograph by Dr Paul Armitage (2018)
Note reddish colour typical of fenitised dykes.
Figure 6.10: Phonolite Dyke with Syenite Xenoliths in Dark Carbonatite Breccia
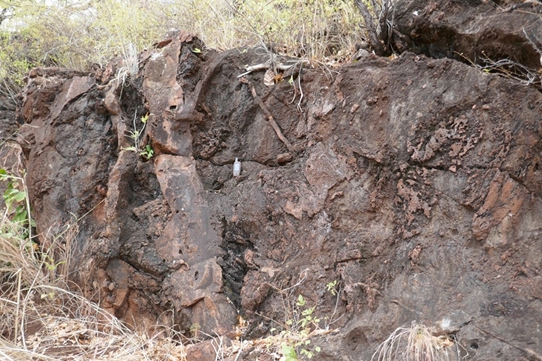
Source: Photograph by Dr Paul Armitage (2018)
Figure 6.11: Wall of Calcite Carbonatite with Syn-Intrusive Dykes and Locally Cross-Cutting and Fragmented Dykes
| S-K 1300 Technical Report Summary on the Songwe Hill REE Project | Page 96 of 489 |
| |
| 6.1.2.5 | Structural Geology |
The Songwe Hill complex is irregular in shape. Some of this irregularity reflects the intrusive nature of the carbonatite. However, there is evidence for structural deformation in some parts of the complex. There is a consistent igneous foliation in the carbonatite that typically strikes NNE-SSW, dipping steeply to vertically (see Figure 6.12). There are sharp lithological breaks that appear to correspond with faults as well as breaks in the ground magnetics that also seem to correspond to the position of faults. Figure 6.13 illustrates several faults interpreted from ground magnetics. The fault traces should be regarded as approximations, as the resolution of the magnetic image is low at the scale of the geological map. However, the interpreted faults do appear to explain some of the patterns in the map, particularly the “fingers” and “neck” in the carbonatite and an apparent offset of a breccia body. The faulting is not unexpected, given the active tectonic environment, and although it appears to disrupt the geology on outcrop scale, it is not believed that structural disruption has occurred on a large scale.
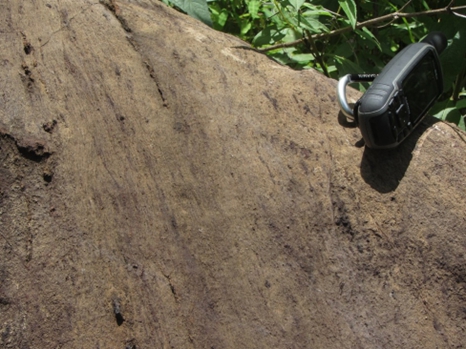
Source: Photograph by Dr Paul Armitage (2018)
Note entrainment and alignment of small phonolite fragments in the foliation.
Figure 6.12: Igneous Foliation in Calcite Carbonatite
| S-K 1300 Technical Report Summary on the Songwe Hill REE Project | Page 97 of 489 |
| |
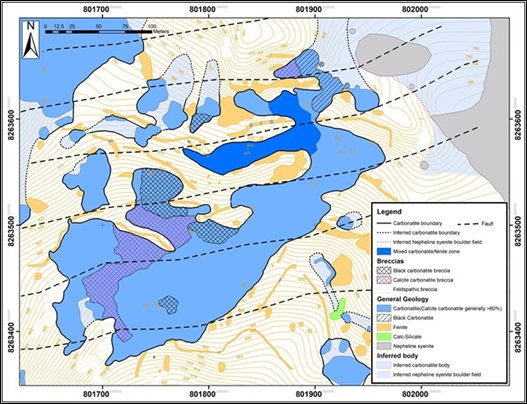
Source: Mkango Resources Ltd internal map (2019)
Figure 6.13: Geological Map with Faults (Long Dashed Lines) Interpreted from a Ground Magnetic Survey
| 6.1.3 | Geological/Geochemical Modelling of the Songwe Hill Complex |
| 6.1.3.1 | Rationale |
Early geological models for the Songwe Hill complex envisaged a vertically dipping intrusive carbonatite plug, the dimensions of which were defined by mapped contacts at surface and projected downward. In very simplified terms, the plug was modelled as a central plug, enveloped by fenite and breccia. However, this simple model had some significant drawbacks. Few if any drillholes penetrated the contacts of the carbonatite intrusive so the contacts were virtually unconstrained in the subsurface. The drilling also demonstrated that the internal structure of the complex was intricate, and that fenites and breccias occurred throughout the area that was modelled as carbonatite intrusive. Finally, the model did not easily account for late-stage alteration and veining that cuts not only the carbonatites and breccias but also the fenites, and which locally carries economically interesting grades. The lithological and geochemical variation occurs on such fine scales that core logging becomes a complex exercise and the correlation of lithologies between holes (which were relatively wide-spaced) became problematic.
Because all holes were sampled and assayed from top to bottom, the geochemical information provides a potentially powerful tool to model the lithological variation if clear correlations can be demonstrated between the geochemistry and the lithology. Accordingly, a modelling exercise was undertaken in which geochemical indicators were tested as discriminants of carbonatites and non-carbonatite lithologies.
| S-K 1300 Technical Report Summary on the Songwe Hill REE Project | Page 98 of 489 |
| |
The objective of this exercise was to produce a model based on geochemical coding that is reflective of the main mineralisation, and that is objective, repeatable, and provides a consistent and meaningful illustration of the distribution of REE mineralisation in the context of the geological setting.
| 6.1.3.2 | Modelling Methodology |
The modelling was carried out using Leapfrog software. The principal geochemical discriminators of the lithological variation were found to be Al, Si, K, and Ca. Ca was used as the final indicator, because it gave a good separation with the same accuracy and resolution as if all four discriminators were used.
The use of the 15 % Ca threshold is validated by the box and whisker plot in Figure 6.14, which shows that, apart from dark matrix carbonatite breccia, the samples described as carbonatite contain above 15 % Ca and those described as other rock types largely contain less than 15 % Ca. The scatter plot shows that samples with more than 15 % Ca also tend to have the highest TREO grade (see Figure 6.15). The points with low Ca and high TREO values are likely to be manganese-iron veins that can have an elevated TREO grade. The linear portion observed in the lower portion of the scatterplot is likely a result of the TREO grade increasing in mixed units with increasing carbonatite content.
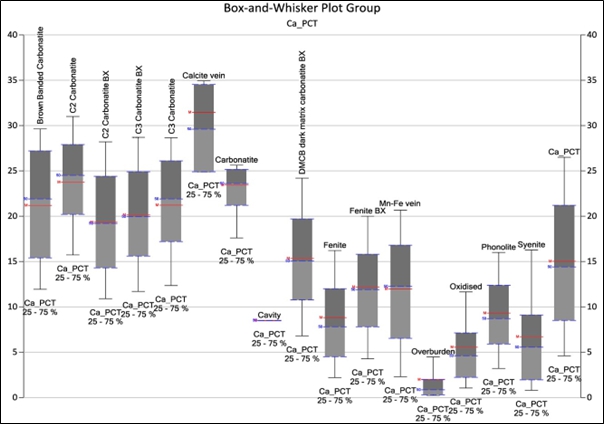
Source: The MSA Group (2020)
Figure 6.14: Box and Whisker Plots of Lithology Versus Ca Grade at Songwe Hill
| S-K 1300 Technical Report Summary on the Songwe Hill REE Project | Page 99 of 489 |
| |
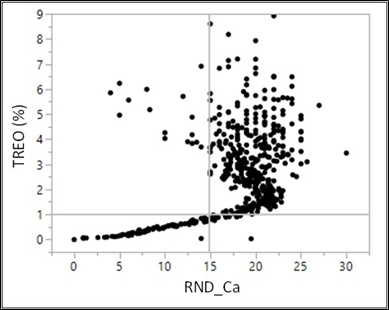
Source: The MSA Group (2020)
Figure 6.15: Scatterplot of Binned Ca Grade Versus TREO Grade at Songwe Hill
| 6.1.3.3 | Modelling Results |
The raw drillhole data, coded as carbonatite or non-carbonatite by separation of a 15 % Ca threshold, was modelled using Leapfrog Geo in order to create a carbonatite volume that constrains the higher-grade mineralisation (see Figure 6.16).
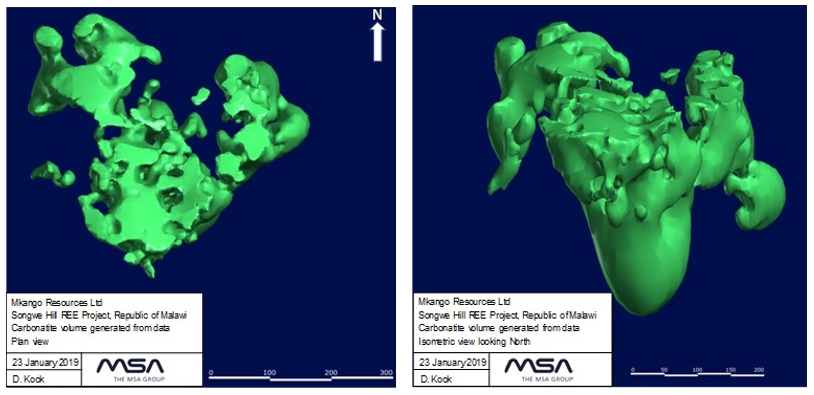
Figure 6.16: Carbonatite Volume Modelled at Songwe Hill
| S-K 1300 Technical Report Summary on the Songwe Hill REE Project | Page 100 of 489 |
| |
The model gave a reasonable estimate of the shape and extent of the carbonatite. On querying the drillhole data within the model, it was found that 75 % of the data was carbonatite coded and the other 25 % was non-carbonatite coded material. This created a mixed REE statistical distribution and was therefore not considered a valid framework within which to discriminate higher- from lower-REE grade zones. The model is considered a useful tool to describe the shape of the carbonatite and was used to validate the indicator approach that was finally chosen to estimate the carbonatite proportion in each cell of the block model.
An indicator approach was taken whereby the samples coded as carbonatite were assigned an indicator value of 1 and non-carbonatite samples were assigned an indicator value of 0. The indicators were estimated into a block model using ordinary kriging. Each cell in the block model contains a proportion (probability) of carbonatite and non-carbonatite, i.e. if a block has an indicator estimate of 1 then the entire block is made up of carbonatite. The indicator model generally fitted well with the Leapfrog Geo generated carbonatite volume (see Figure 6.17), and the proportional approach to assigning the domain to each block was used for estimation.
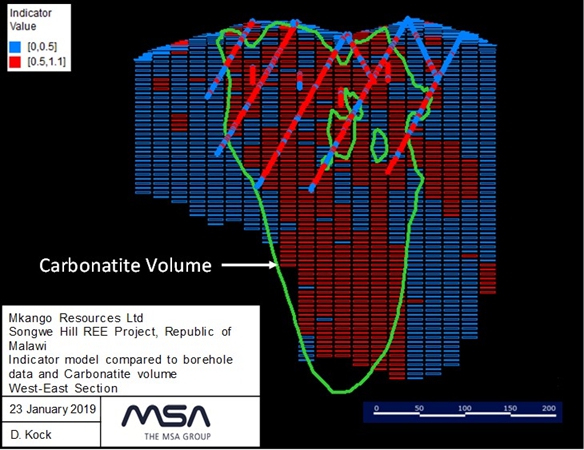
Figure 6.17: Cross Section of the Indicator Block Model, Drillhole Data and the Modelled Carbonatite Volume (Green Perimeter)
| S-K 1300 Technical Report Summary on the Songwe Hill REE Project | Page 101 of 489 |
| |
| 6.1.3.4 | Geometry of the Complex |
The geological model constructed from the geochemistry provides a good framework within which to interpret the geology of the deposit. This is a rather chaotic geological environment that is not easily interpreted from lithological observations of drillhole core and outcrop alone.
The model confirms previous interpretations of the Songwe Hill complex as comprising, in simplified terms, a central carbonatite intrusion, enveloped by carbonatite-rich breccias and altered lithologies, and passing outwards into a halo of fenitised phonolite and nepheline syenite. The model clearly outlines the carbonatite core to the deposit and shows the many outlying carbonatite bodies and the generally irregular distribution of carbonatite outside the main body. The central core carbonatite is modelled as a steep intrusion with steeply dipping but irregular contacts, surrounded by mixed lithologies that logging shows are mainly a combination of breccias and carbonatite-altered fenites. The mixed lithologies pass outward into silicate rocks, dominantly fenite but including less altered phonolite and nepheline syenite.
In general, the thick sections of carbonatite logged in the core correspond well with carbonatites identified geochemically by their Ca content. The identification of a central core of carbonatite to the intrusive complex seems to be well supported by the data, and the grades are consistent throughout this lithology. The geometry of the central carbonatite body is well constrained by the geochemical/geochemical modelling and ties in well with the mapped outcrops at Songwe Hill. The carbonatites are consistently mineralised with REE, arising mainly from REE minerals as an essential accessory in the carbonatite, locally supplemented by REE in cross-cutting carbonatite and Mn-Fe veins. Grades are relatively consistent in carbonatites in the core of the deposit and across most geological sections.
The mixed lithologies are the most complicated lithologies to deal with and are likely to be the most variable in terms of tracing lithologies and grades between drillholes. The mixed lithologies include various types of breccias and carbonate-altered rocks that reflect the complex nature of the intrusive environment. They may include carbonatite magma contaminated by blocks of country rock that have detached and sunk into the magma, intrusion breccias, where carbonatite has surrounded and stoped earlier fenitised rocks, and explosion breccias where hydrothermal overpressuring has brecciated the rocks and allowed a matrix of carbonatite to be introduced. They also may include dominantly fenite that has been veined and altered by later carbonate-rich veins/dykes. All of these are likely to be irregular in shape and size, and difficult to define geometrically. The mixed lithologies are usually, but not always, mineralised with REE, and the grades are more variable than in the carbonatites. REE grades in these rocks depend on the proportion of carbonatite in the breccias as well as the intensity and tenor of the veins cutting the rocks. These grades are likely to vary considerably on a small scale and to be difficult to correlate between drillholes.
The silicate lithologies (fenite and phonolite/syenite) are clearly identified by their low Ca contents. There is little practical benefit in attempting to separate the fenites from unaltered rocks as they are typically unmineralised and do not contribute to the Mineral Resource. Locally, isolated pockets of fenites return economically interesting grades – this is invariably the result of late Mn-Fe veining that is not readily traced between drillholes.
| 6.2 | Mineralisation |
Mineralisation in the Songwe Hill complex occurs in all three geological domains, but the highest grades and most consistent mineralisation are found in the carbonatites. The mixed lithologies locally carry a high enough grade over significant widths to be included in the Mineral Resource but are not consistently mineralised throughout their full extent. Fenites only locally contain economically interesting concentrations of REE, and seldom over economic widths.
| S-K 1300 Technical Report Summary on the Songwe Hill REE Project | Page 102 of 489 |
| |
| 6.2.1 | Mineralogy |
Mineralogical studies carried out on Songwe Hill samples were reported in detail by The MSA Group (2015) and are summarised here, supplemented by recently published data. Mineralogical studies using a scanning electron microscope (SEM), electron microprobe (EMP) and laser ablation, inductively coupled plasma, mass spectrometry (LA-ICP-MS) showed that the REE mineral assemblage at Songwe Hill, regardless of lithology, is dominated by fluorocarbonates, principally synchysite with minor parisite, apatite and occasional florencite. Average REO concentrations in synchysites from several drillholes are presented in Table 6.1. The synchysite crystals are homogeneous, typically occurring as randomly oriented laths or tabular crystals and/or fibro-radial to plumose aggregates (see Figure 6.18). Crystal size varies, but laths typically range in length from 10 μm to 60 μm, and crystal aggregates can reach up to 400 μm.
Synchysite is invariably associated with strontianite and/or baryte either as inclusions and/or intergrowths, and together they form distinctive vein-like aggregates or segregations (see Figure 6.18). In addition to these two phases, synchysite is locally associated with calcite, fluorite, alkali (K) feldspar, pyrochlore and titanite. The mineral association of synchysite with strontianite and baryte in the Songwe Hill carbonatites and their textural relationships was described by Broom-Fendley et al. (2016a) and interpreted on the basis of paragenesis with various states of apatite as representing hydrothermal redistribution of the REE during early hydrothermal activity at 250 °C to 300 °C.
Fluorapatite in the Songwe Hill carbonatites has a complex history and paragenesis. Broom-Fendley et al. (2016a) showed that there are five recognisable stages of apatite crystallisation: two early stages representative of crystallisation from a carbonatite magma, and three stages that are texturally atypical of magmatic apatite and progressively enriched in the heavy rare earth oxides (HREOs). The HREO enrichment factor of Songwe Hill apatite, defined here as the sum of all HREO from Eu2O3 to Lu2O3 and Y2O3/TREO, ranges from 40 % to 85 % compared to 2 % to 11 % in apatite from other carbonatites (Hornig-Kjarsgaard, 1998). It is rare for apatite in carbonatite deposits to display heavy rare earth enrichment.
Fluorapatite in the Songwe Hill carbonatite lithologies is often visibly recrystallised and occurs as stringers and groundmass anhedral crystals, or as large bands (see Figure 6.19A) and veins which frequently contain entrained groundmass material, typically carbonate. In samples from the black carbonatite, apatite invariably forms large bands and veins (see Figure 6.19B) and is closely associated with the Fe-carbonate.
Florencite is particularly abundant in the groundmass of the carbonatite breccias forming narrow acicular crystals (< 20 μm in width) and is associated with various Fe- and Mn-bearing oxides (see Figure 6.20). Occasionally, florencite is also found as small anhedral crystals along the edges of entrained carbonate crystals in apatite veins and most likely formed as a replacement/alteration product of apatite.
Figure 6.21 compares representative analyses of the Songwe Hill late-stage apatite to typical light rare earth element (LREE) enriched unaltered magmatic carbonatite from other carbonatite complexes, Oka in Canada and Jacupiranga in Brazil (Hornig-Kjarsgaard, 1998), clearly illustrating the anomalous enrichment of heavy rare earth element (HREE)+Y in the Songwe Hill apatites. Broom-Fendley et al. (2016a, 2016b, 2017) presented evidence that the HREE enrichment in apatite at Songwe Hill resulted from late-stage hydrothermal activity and, in the latter stages of activity, is associated with minor xenotime (Y) and HREE-enriched fluorite. In this model, subsolidus, carbonatite-derived fluids remobilised and fractionated the REE. The rapid crystallisation of apatite resulted in destabilisation of the HREE and their incorporation in the apatite structure. More soluble LREE stayed in solution and subsequently precipitated as synchysite (Ce).
| S-K 1300 Technical Report Summary on the Songwe Hill REE Project | Page 103 of 489 |
| |
Table 6.1: Average REO Distribution of Synchysite, Analysed by EMP, in Songwe Hill Carbonatites (Excluding Outliers)
| Drillhole | La2O3 wt% |
Ce2O3 wt% |
Pr2O3 wt% |
Nd2O3 wt% |
Sm2O3 wt% |
Eu2O3 wt% |
Gd2O3 wt% |
Dy2O3 wt% |
Y2O3 wt% |
REO1 wt% |
| PX001 | ||||||||||
| Median | 14.50 | 23.39 | 2.16 | 7.45 | 1.04 | 0.26 | 0.63 | 0.21 | 0.54 | 50.18 |
| Average | 14.39 | 23.11 | 2.13 | 7.38 | 1.03 | 0.25 | 0.60 | 0.22 | 0.55 | 49.66 |
| PX003 | ||||||||||
| Median | 15.84 | 26.52 | 2.39 | 7.45 | 0.58 | 0.04 | 0.00 | 0.06 | 0.24 | 53.12 |
| Average | 16.13 | 26.78 | 2.40 | 7.17 | 0.55 | 0.05 | 0.01 | 0.07 | 0.27 | 53.43 |
| PX005 | ||||||||||
| Median | 11.42 | 24.70 | 2.72 | 9.42 | 0.99 | 0.10 | 0.17 | 0.14 | 0.50 | 50.16 |
| Average | 10.98 | 24.19 | 2.55 | 8.94 | 0.98 | 0.12 | 0.20 | 0.14 | 0.61 | 48.71 |
| PX011 | ||||||||||
| Median | 13.65 | 24.43 | 2.38 | 6.63 | 0.65 | 0.11 | 0.16 | 0.21 | 0.84 | 49.06 |
| Average | 13.73 | 23.99 | 2.31 | 6.57 | 0.64 | 0.11 | 0.17 | 0.24 | 0.92 | 48.68 |
| Drillhole | La2O3 % |
Ce2O3 % |
Pr2O3 % |
Nd2O3 % |
Sm2O3 % |
Eu2O3 % |
Gd2O3 % |
Dy2O3 % |
Y2O3 % |
REO1 % |
| PX001 | ||||||||||
| Median | 28.92 | 46.44 | 4.32 | 15.10 | 2.11 | 0.51 | 1.23 | 0.43 | 1.07 | 100.0 |
| Average | 28.97 | 46.53 | 4.29 | 14.86 | 2.08 | 0.50 | 1.21 | 0.44 | 1.12 | 100.0 |
| PX003 | ||||||||||
| Median | 29.88 | 49.65 | 4.58 | 13.81 | 1.09 | 0.08 | 0.00 | 0.11 | 0.45 | 100.0 |
| Average | 30.23 | 50.12 | 4.50 | 13.39 | 1.02 | 0.09 | 0.01 | 0.13 | 0.51 | 100.0 |
| PX005 | ||||||||||
| Median | 22.75 | 49.21 | 5.36 | 18.65 | 1.93 | 0.24 | 0.38 | 0.28 | 1.17 | 100.0 |
| Average | 22.45 | 49.80 | 5.21 | 18.33 | 2.00 | 0.25 | 0.41 | 0.29 | 1.26 | 100.0 |
| PX011 | ||||||||||
| Median | 28.66 | 49.09 | 4.78 | 13.55 | 1.30 | 0.23 | 0.32 | 0.45 | 1.78 | 100.0 |
| Average | 28.20 | 49.30 | 4.75 | 13.50 | 1.31 | 0.23 | 0.33 | 0.48 | 1.87 | 100.0 |
| REO1 = La2O3, Ce2O3, Pr2O3, Nd2O3, Sm2O3, Eu2O3, Gd2O3, Dy2O3 and Y2O3 | ||||||||||
| Source: Tables by the Natural History Museum, London, and Dr Aoife Brady in The MSA Group (2015). | ||||||||||
| S-K 1300 Technical Report Summary on the Songwe Hill REE Project | Page 104 of 489 |
| |
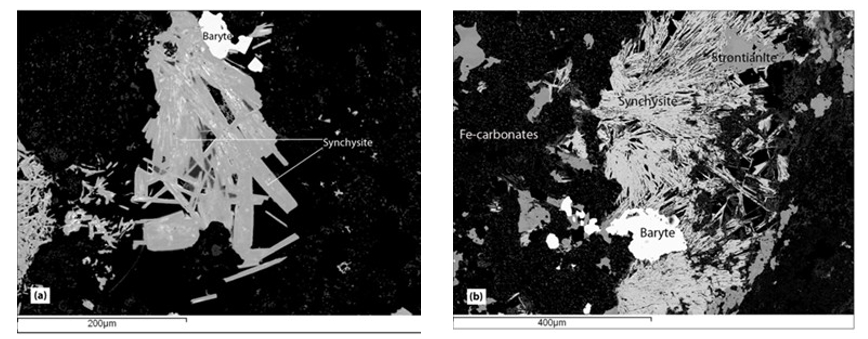
Source: Images from the Natural History Museum, London, and Dr Aoife Brady in The MSA Group (2015).
Figure 6.18: SEM Images of Synchysite in the Songwe Hill Carbonatite
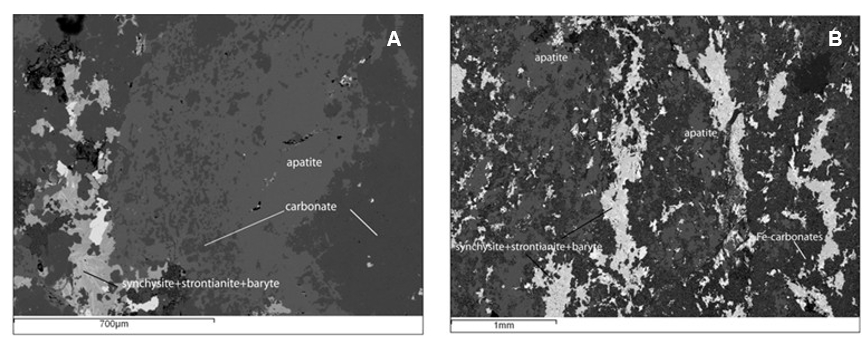
Source: Images from the Natural History Museum, London, and Dr Aoife Brady in The MSA Group (2015).
Figure 6.19: SEM Images of Apatite in the Songwe Hill Carbonatite
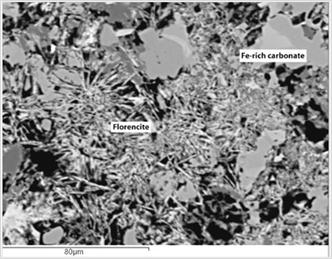
Source: Images from the Natural History Museum, London, and Dr Aoife Brady in The MSA Group (2015).
Figure 6.20: Florencite-Rich Groundmass of Carbonatite Breccia
| S-K 1300 Technical Report Summary on the Songwe Hill REE Project | Page 105 of 489 |
| |
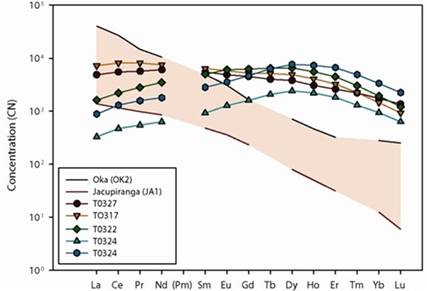
Source: Chart by Dr Sam Broom-Fendley in The MSA Group (2015).
NOTE: Typical LREE-enriched unaltered magmatic carbonatite from the Oka and Jacupiranga carbonatites are shown in the coloured field.
Figure 6.21: Chondrite-Normalised Late-Stage Apatite from Songwe Hill Carbonatites
| 6.2.2 | Genetic Model for REE Mineralisation |
The Songwe Hill complex records a short-lived but complicated history of intrusion, hydrothermal activity, and REE mineralisation. The igneous history of the complex began with intrusion of the Mauze nepheline syenites and phonolites. This is characteristic of complex silicate/carbonatite intrusions where the silicates typically intrude first, followed by the carbonatite. The intrusion of the carbonatite plug closely followed intrusion of the Mauze nepheline syenites – sufficiently close that the U/Pb isotopic ages of the two are identical within analytical uncertainty. The carbonatite plug closely resembled the composition of the C2 calcite carbonatites and had probably undergone at least some fractionation in the subsurface, evidenced by the cumulate C1 carbonatites that occur as fragments. During intrusion, fluid exsolution from the C2 carbonatite metasomatised the surrounding silicate rocks producing fenites, and these fenites were then incorporated in the carbonatite by stoping or in explosion breccias related to continued fluid overpressuring of the magma chamber. Phonolite dykes intruded the carbonatite in a single continuous event or multiple pulses, evidenced by the highly variable degree of fragmentation and entrainment of the dykes, which were fenitised by exsolving fluids from the C2 carbonatite. The latest dykes remain virtually intact and at least internally unfenitised.
| S-K 1300 Technical Report Summary on the Songwe Hill REE Project | Page 106 of 489 |
| |
As the carbonatite system evolved, an extensive and intense hydro (carbo)thermal system developed which resulted in widespread redistribution of mobile elements in the system. The mineral association of REE-rich fluorocarbonates and apatite with strontianite, baryte, ankerite and fluorite at Songwe Hill strongly suggests that the REE mineralisation formed by re-equilibration and recrystallisation of primary (early-crystallised) minerals (e.g. calcite) in the various carbonatite lithologies. The alteration resulted in the remobilisation of the REE into fluorocarbonates in the C2 carbonatite, and more intense alteration produced veined and laminated black to orange Mn-Fe-rich C3 carbonatites (C3). In the later stages of alteration, the REE were somewhat partitioned with an HREE-rich fraction entering apatite, while the LREE-rich fraction continued to enter fluorocarbonates. The higher intensity of alteration recorded by the C3 carbonatites is reflected in their overall higher REE contents. The fluid system, besides producing pervasively altered rocks, also produced Mn-Fe calcic veins which persisted until late in the evolution of the system and invaded all lithologies, although the intensity was greatest in the core of the system (i.e. close to the carbonatite plug). The alteration veins are locally seen cutting and modifying the C2 carbonatites. Late-stage Mn-Fe veins are enriched in REE, similar to the C3 carbonatites, and where they cut relatively unmineralised lithologies, they locally bring the grades up to economically interesting values.
| 6.3 | Deposit |
The target deposit type at Songwe Hill is a high-level, REE-enriched carbonatite intrusive complex. Carbonatites are traditionally defined as intrusive and extrusive igneous rocks that contain in excess of 50 % modal carbonate minerals (Woolley and Kempe, 1989). Mitchell (2005) defines carbonatites as “containing greater than an arbitrary 30 % by volume of primary igneous carbonate regardless of silica content”. Carbonatites can be named according to their carbonate mineralogy (e.g. calcite carbonatite, dolomite carbonatite and ankerite carbonatite), and chemically they can be divided into the three main varieties: calcio-, magnesio- and ferro-carbonatite. Figure 6.22 is a generalised and widely accepted schematic illustration of the intrusion of a carbonatite complex.
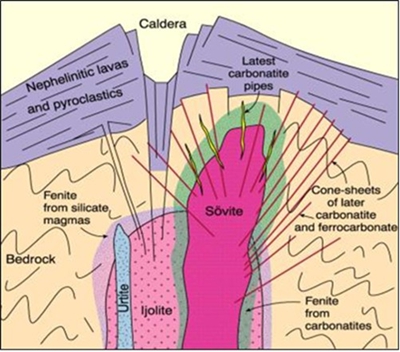
Source: Le Bas (1987)
Figure 6.22: General Model for an Alkali Silicate-Carbonate Intrusive Complex
| S-K 1300 Technical Report Summary on the Songwe Hill REE Project | Page 107 of 489 |
| |
Carbonatites usually occur as plugs or pipe-like bodies within zoned alkalic intrusive complexes, or as dykes, sills, breccias, and veins, and are almost exclusively associated with continental rift-related tectonic settings. They are characterised by an aureole of metasomatically altered country rocks which are usually referred to as fenites. Carbonatite magmas are typically low-viscosity and volatile-rich, and when intruded at a high crustal level, produce widespread intrusion- and explosion-breccias incorporating country rocks, carbonatites and associated fenites. Carbonatites are typically associated with silicate rocks of which the seven key carbonatite-silicate rock associations are, in decreasing order of abundance, 1) nephelinite-ijolite, 2) phonolite-feldspathoidal syenite, 3) trachyte-syenite, 4) melilitite-melilitolite, 5) lamprophyre, 6) kimberlite, and 7) basanite-alkali gabbro (Woolley & Kjarsgaard, 2008). The carbonatite deposit at Songwe Hill is spatially associated with the large nepheline syenite intrusion of Mauze, and the Songwe Hill carbonatite is intimately associated with intrusive phonolites and their fenitised equivalents. It is therefore interpreted to belong to the phonolite-feldspathoidal syenite association.
Carbonatites can be generated by
| ● | A low degree of partial melting in the mantle (Wallace & Green, 1988) |
| ● | Extreme crystal fractionation (Watkinson & Wyllie, 1971) |
| ● | Liquid immiscibility (Kjarsgaard & Hamilton, 1989) from carbonated silicate magma |
It is possible that all three mechanisms may play a part in carbonate magma evolution. Low degrees of partial melting in the mantle produce a magma that is anomalously enriched in the incompatible elements such as the REE. Carbonatites typically consist of multiple phases of intrusions and characteristically evolve, by crystal fractionation within the intrusion, from early magmatic calcite-rich carbonatite to magnesium-rich dolomite carbonatites and finally with decreasing temperature to late-stage iron-rich carbonatite phases. As a result of their petrogenesis, carbonatites tend to be anomalously enriched in the highly incompatible REE and high field strength elements (HFSE), and such enrichment can lead to economic concentrations of REE (Chakhmouradian & Zaitsev, 2012).
The REE profile of carbonatite-associated mineralisation is typically LREE-dominated. Concentrations of REE tend to increase with fractionation from calcio- to magnesio- to ferro- carbonatites, and the REE distribution and profile in carbonatites is typically modified by late-stage hydrothermal activity (Mariano, 1989; Giere, 1996; Wall & Mariano, 1996; Doroshkevich et al., 2009). Carbonatite deposits may also contain economic or anomalous concentrations of magnetite, apatite, baryte, sulphides and vermiculite and are characterised by elevated concentrations of some or all phosphorous, niobium, tantalum, uranium, thorium, copper, iron, titanium, vanadium, barium, fluorine, zirconium, and other rare or incompatible elements.
| S-K 1300 Technical Report Summary on the Songwe Hill REE Project | Page 108 of 489 |
| |
REE-enriched carbonatite hosted deposits may be divided into three types: magmatic, hydrothermal, and residual/supergene (Mariano, 1989). Rare earth mineral deposits produced by primary crystallisation from carbonatite magma are very rare, and at the present time, the Mountain Pass deposit in the US is the only well documented example (Castor, 2008). Late-stage rare earth mineralisation produced by magmatic hydrothermal fluids is much more common, resulting in the precipitation of rare earth minerals, such as bastnäsite-(Ce), parisite-(Ce), synchysite-(Ce) and monazite-(Ce) in fractures or voids in the host carbonatite rock, often associated with enriched mobile elements such as strontium (strontianite) and barium (baryte). Alternatively, hydrothermal mineralisation may be present as disseminated, fine grained, polycrystalline aggregates of rare earth minerals overprinting or replacing earlier-formed minerals. Examples of hydrothermal deposits include Bayan Obo in China (Chao et al., 1992; Smith & Henderson, 2000) and Karonge/Gakara in Burundi (Lehmann et al., 1994).
Laterites, overlying deeply weathered carbonatites and alkaline rocks, are also an important source of REE enrichment, and examples of supergene mineralisation include the Mount Weld deposit in Western Australia. However, the rare earth deposit at Songwe Hill is not a laterite and is best described as a magmatic/hydrothermal REE deposit.
The target at Songwe Hill is a large body of intrusive calcic carbonatite with related breccias and fenites that appears to represent a high-level intrusion with an extensive history of metasomatism and high-level fluid exsolution. The REE mineralisation is lithologically controlled, and the highest concentrations and greatest volumes of mineralisation occur specifically within the carbonatites.
The carbonatites are believed to have been REE-enriched when they were intruded, and the REE are interpreted to have been redistributed and enhanced by late-stage hydrothermal and carbohydrothermal activity and now principally reside in synchysite (with minor florencite) and apatite.
Associated breccias are also variably mineralised locally to potentially economic grades, and the level of REE concentrations is a function of the relative abundance of carbonatite fragments and REE-enriched hydrothermal veins.
Adjacent fenites are also variably mineralised, although typically at lower volumes and concentrations than carbonatites, and the intensity of mineralisation is related to the degree of overprinting carbonate alteration and veining, suggesting that these rocks have also been mineralised by late-stage hydrothermal activity.
It is the Qualified Person’s opinion that geological work at Songwe Hill, including local and regional geological mapping, drill core logging, and geological modelling, has been professionally carried out. The work is sufficient to adequately characterise the deposit from a geological perspective and to understand the regional context of the mineralisation. The geological modelling provides a good scientific basis for interpreting the deposit geometry and mineralogy, and there are no fatal flaws that would affect the characterisation of the deposit.
| S-K 1300 Technical Report Summary on the Songwe Hill REE Project | Page 109 of 489 |
| |
| 7 | Exploration |
Mkango has been exploring and evaluating the Songwe Hill deposit since January 2010. Following confirmation of the enriched zones, previously investigated by the Japan International Cooperation Agency and Metal Mining Agency of Japan (JICA and MMAJ, 1989), exploration focused on identifying the nature and extent of the REE-mineralised carbonatites and related rocks. Mkango’s exploration activities consisted of litho-geochemical sampling, soil sampling, channel sampling, geological mapping, ground magnetic, density and radiometric surveys, and petrographic/mineralogical analyses and culminated in diamond drilling campaigns in 2011, 2012 and 2018, the results of which are described in The MSA Group (2015, 2020), and taking of a bulk sample in 2018. Geological observations and interpretations and procedures related to exploration methodology were implemented and overseen by the Mkango geological team in Malawi.
| 7.1 | Litho-Geochemical Sampling |
Fieldwork undertaken by Mkango at Songwe Hill during March 2010 and May 2010 consisted primarily of litho-geochemical sampling to confirm the nature and extent of the mineralisation identified by JICA and MMAJ. Outcrops were systematically scanned with a Thermo-Scientific Niton® XLp handheld X-ray fluorescence analyser calibrated for the semi-quantitative analysis of REE. This work indicated that all lithologies at Songwe Hill contain anomalous amounts of REE and that there are variations between the different lithologies. In general, the contents of the total REE in the fenites were found to be lower than the carbonatites.
Two principal types of carbonatite were identified: a relatively homogeneous, medium grey rock, which appeared flow banded in places and a much blacker type, which was characteristically heterogeneous. The black carbonatite appeared to form zones of various widths that cut or replace the grey homogeneous carbonatite. A total of 88 grab samples were taken from the outcrop (62 carbonatite, 14 fenite, 11 Fe-rich and related rocks) and assayed for a full suite of rare earth and related elements. The sample locations are shown in Figure 7.1, and the assay results for the various rock types are presented in Table 7.1 and Figure 7.2. The samples were representative of the outcrop distribution of the mineralisation; however, they are not considered to be of sufficient quality for use in a Mineral Resource estimate. Care was taken to take samples from visually fresh rock, although there may have been minor modification of the concentration of REE in some samples by near-surface effects.
The new results generally compared well with the data from JICA and MMAJ and confirmed broad zones of carbonatite at surface. The 62 carbonatite grab samples produced TREO concentrations between 0.4 % and 5.3 % TREO with an average of 1.5 % TREO. The proportion of HREO, defined as the sum of oxides of Eu, Gd, Tb, Dy, Ho, Er, Tm, Yb, Lu and Y, for these samples averaged 8 % of TREO. The average TREO concentration of samples exceeding 1 % TREO is 1.84 % TREO.
The results of this work confirmed the REE enrichment initially identified by JICA and MMAJ and suggested that the mineralised carbonatites are more widespread than originally identified. This led to a broadening of the exploration focus to include most of the north-facing slopes of Songwe Hill.
| S-K 1300 Technical Report Summary on the Songwe Hill REE Project | Page 110 of 489 |
| |
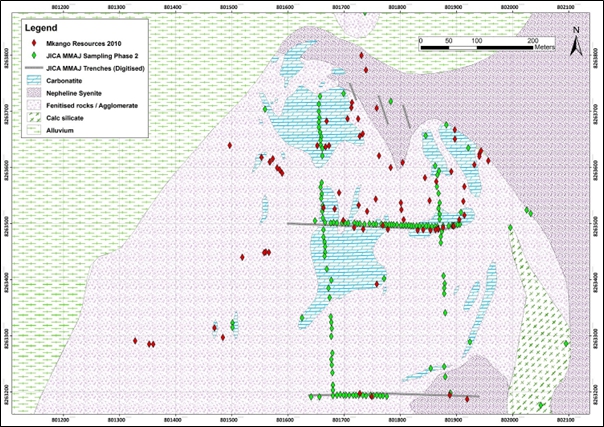
Source: Mkango Resources Ltd after JICA/MMAJ (1989).
NOTE: UTM Zone 36S and WGS84 Datum
Figure 7.1: Geological Map of Songwe Hill with Sample Localities of JICA (1988) and Mkango (2010) Samples
| S-K 1300 Technical Report Summary on the Songwe Hill REE Project | Page 111 of 489 |
| |
Table 7.1: Average REO Distribution of Apatite, analysed by LA-ICP-MS, in Songwe Hill Carbonatites (Excluding Outliers)
| Drillhole | Rock Type | La2O3 | Ce2O3 | Pr2O3 | Nd2O3 | Sm2O3 | Eu2O3 | Gd2O3 | Tb2O3 | Dy2O3 | Y2O3 | Other1 | TREO2 |
| ppm | ppm | ppm | ppm | ppm | ppm | ppm | ppm | ppm | ppm | ppm | % | ||
| H0101 | Carbonatite | 8,704 | 13,232 | 1,126 | 3,218 | 343 | 85 | 238 | 23 | 102 | 385 | 66 | 2.75 |
| H0102 | Carbonatite | 2,100 | 4,661 | 569 | 1,866 | 269 | 75 | 183 | 24 | 116 | 547 | 104 | 1.05 |
| H0103 | Carbonatite | 10,135 | 15,691 | 1,310 | 3,626 | 326 | 77 | 228 | 20 | 88 | 370 | 76 | 3.19 |
| H0117 | Carbonatite | 2,721 | 6,277 | 715 | 2,600 | 364 | 95 | 225 | 24 | 103 | 428 | 112 | 1.37 |
| H0118 | Carbonatite | 10,979 | 16,043 | 1,369 | 3,999 | 448 | 108 | 309 | 30 | 142 | 749 | 155 | 3.43 |
| H0119 | Carbonatite | 4,481 | 9,309 | 1,013 | 3,696 | 592 | 160 | 380 | 41 | 171 | 635 | 128 | 2.06 |
| H0125 | Carbonatite | 2,064 | 4,754 | 517 | 1,842 | 261 | 68 | 166 | 22 | 118 | 655 | 130 | 1.06 |
| H0126 | Carbonatite | 2,933 | 6,663 | 766 | 2,775 | 416 | 117 | 292 | 34 | 135 | 466 | 91 | 1.47 |
| H0127 | Carbonatite | 11,343 | 16,511 | 1,369 | 3,731 | 458 | 122 | 326 | 39 | 180 | 720 | 131 | 3.49 |
| H0917 | Carbonatite | 5,396 | 10,047 | 1,062 | 3,964 | 686 | 167 | 395 | 47 | 200 | 711 | 131 | 2.28 |
| H0003 | Fenite | 1,408 | 3,244 | 314 | 1,259 | 264 | 68 | 146 | 13 | 46 | 183 | 41 | 0.70 |
| H0004 | Fenite | 1,021 | 1,792 | 185 | 749 | 152 | 38 | 75 | 6 | 22 | 112 | 26 | 0.42 |
| H0901 | Fenite | 903 | 1,265 | 228 | 1,056 | 220 | 62 | 137 | 15 | 63 | 271 | 57 | 0.43 |
| H0902 | Fenite | 1,325 | 1,405 | 298 | 1,178 | 182 | 48 | 105 | 12 | 56 | 262 | 57 | 0.49 |
| H0134 | Fenite | 745 | 1,522 | 199 | 802 | 200 | 61 | 156 | 19 | 88 | 395 | 68 | 0.43 |
| H0909 | Fe-rich rock | 2,018 | 4,625 | 524 | 2,110 | 281 | 63 | 130 | 11 | 35 | 121 | 23 | 0.99 |
| H0911 | Fe-rich rock | 1,279 | 2,916 | 339 | 1,411 | 213 | 52 | 118 | 13 | 49 | 179 | 30 | 0.66 |
| H0913 | Fe-rich rock | 3,202 | 7,834 | 940 | 3,790 | 488 | 103 | 211 | 15 | 51 | 174 | 26 | 1.68 |
| H0109 | Fe-rich rock | 5,501 | 8,115 | 741 | 1,912 | 216 | 66 | 203 | 27 | 119 | 538 | 95 | 1.75 |
| H0002 | Fe-rich rock | 555 | 2,764 | 496 | 3,090 | 1,070 | 299 | 641 | 67 | 228 | 598 | 102 | 0.99 |
| Other1 = Ho2O3, Er2O3, Tm2O3, Yb2O3 and Lu2O3 | |||||||||||||
| TREO2 = total rare earth oxides including yttrium | |||||||||||||
| Source: Mkango Resources Ltd (2012) |
| S-K 1300 Technical Report Summary on the Songwe Hill REE Project | Page 112 of 489 |
| |
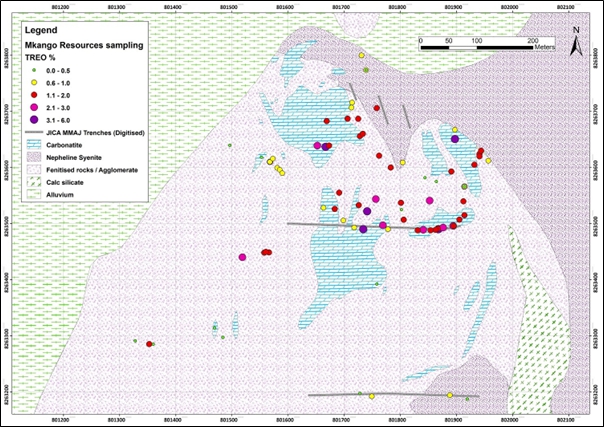
Source: Mkango Resources Ltd after JICA/MMAJ (1989)
NOTE: UTM Zone 36S and WGS84 Datum
Figure 7.2: Geological Map of Songwe Hill with Assay Results for Mkango Samples
| 7.2 | Ground Geophysical Programme |
In October 2010 and January 2011, Remote Exploration Services (Pty) Ltd (RES) from South Africa conducted magnetic, radiometric and gravity surveys over Songwe Hill. The objective of the geophysical programme was to determine the geophysical characteristics of the geological units as an aid to mapping the extent of the carbonatite over Songwe Hill (Remote Exploration Services Ltd, 2010). A digital terrain model (DTM) was prepared as part of the geophysical programme. All data was processed by RES.
Following the flotation test results of the Songwe Hill samples in September 2019, it was decided that an induced polarisation (IP) geophysical survey might assist in identifying iron oxide/hydroxide-rich zones in the Songwe resource area that had proven to be deleterious in the flotation process. An extra benefit to this main objective was identifying possible extensions of the orebody (both laterally and at depth) outside the present resource/drilling zone. It was felt that the IP survey data would be best understood in a wider and deeper context, so a natural source audio-frequency magnetotelluric (NSAMT) survey was drawn up to collect geophysical data for the wider setting of Songwe Hill to complement the limited geological mapping. Both the NSAMT and IP geophysical methods were carried out by geophysicists from Terratec Geophysical Services (Terratec) under the HiTech AlkCarb project funded by the European Union’s Horizon 2020 Research and Innovation programme.
| S-K 1300 Technical Report Summary on the Songwe Hill REE Project | Page 113 of 489 |
| |
| 7.2.1 | Magnetic Survey |
The ground-magnetic survey was conducted using GEM Overhauser Magnetometers. Magnetic data was collected in “Walk Mode” at 1 s intervals along 1 km long lines spaced 50 m apart, while a fixed GEM base magnetometer enabled each day’s magnetic data to be corrected for diurnal variations by recording magnetic field readings at 10 s intervals. Field data spatial positioning was accomplished with the use of a Garmin handheld global positioning system (GPS). The magnetic data defines the vent aureole as a zone of demagnetisation around the mapped fenite and depicts the vent as magnetically zoned. An interpreted NE-trending major fault cross-cutting the centre of the vent could be the cause for this magnetic zoning. The data showed no clear correlation between magnetic anomalies and the mapped carbonatite outcrops. The magnetic survey also identified several faults/lineaments which could have played an important role in carbonatite emplacement as well as radioelement mobility (see Figure 7.3).
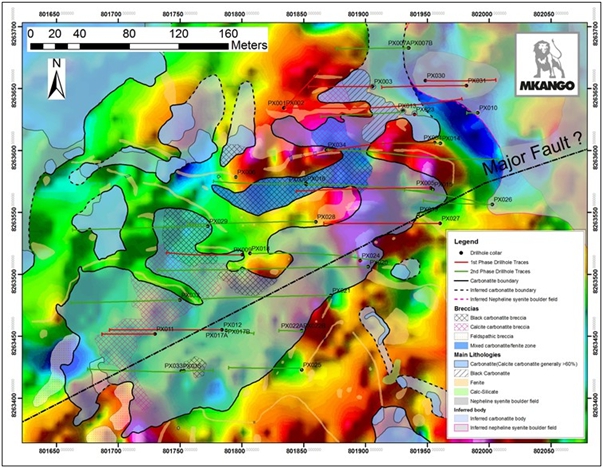
Source: Mkango Resources Ltd internal geological map (2011) on total magnetic intensity map by Remote Exploration Services Ltd (2011)
NOTE: Analytical signal showing magnetic zone and structures; geological map, drillhole collars and traces are superimposed. UTM Zone 36S and WGS84 Datum.
Figure 7.3: Modified Analytical Signal of Total Magnetic Intensity over Songwe Hill
| S-K 1300 Technical Report Summary on the Songwe Hill REE Project | Page 114 of 489 |
| |
| 7.2.2 | Radiometric Survey |
A calibrated four-channel spectrometer was used for the radiometric survey. Total count of potassium (K), thorium (Th) and uranium (U) and differentiated counts of these three elements were recorded for 60 s at 50 m station intervals along 1 km long lines spaced 50 m apart. An additional infill survey was conducted over part of the survey area with a known carbonatite occurrence. The radiometric survey data showed the existence of significant thorium and potassium anomalies and demonstrated a good correlation between the Th response and the mapped carbonatite (see Figure 7.4).
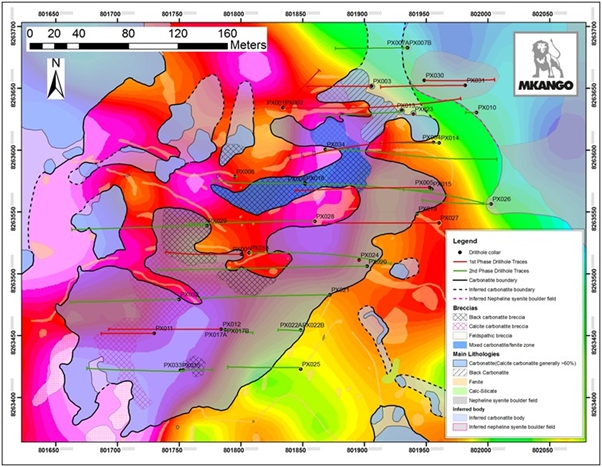
Source: Mkango Resources Ltd internal geological map (2011) on Remote Exploration Services Ltd thorium map (2011)
NOTE: Thorium radiometric survey; geological map, drill collars and drillhole traces are superimposed. UTM Zone 36S and WGS84 Datum.
Figure 7.4: Thorium Radiometric Survey over Songwe Hill
| S-K 1300 Technical Report Summary on the Songwe Hill REE Project | Page 115 of 489 |
| |
| 7.2.3 | Gravity Survey |
The ground gravity survey was conducted using a Scintrex CG3 micro-gravimeter, capable of taking readings with an accuracy of ± 0.001 mGal. Gravimetric measurements were made at 50 m station intervals along 1 km long lines spaced 50 m apart. Readings were stacked for 60 s and averaged at each station so as to minimise random noise and were also kept within a standard deviation of ± 0.050 mGal. Base readings were taken at the “gravity base” at the beginning and end of each survey day in order to correct field measurements for instrument drift. Elevation and positional control were accomplished initially with the use of a Trimble differential global positioning system (DGPS) unit. This had to be abandoned due to a technical fault within the DGPS system and a Garmin 60CSX handheld GPS unit was adopted for the remainder of the survey. The hill was resurveyed in January 2011 (Remote Exploration Services Ltd, 2011) in order to better constrain the DTM, and the gravity survey data was reinterpreted based on the revised DTM. Interpretation of the gravity data, based on in-field observations undertaken on hand specimen grab samples, assumed a high-density contrast between the carbonatites and the surrounding rocks.
Due to inherent errors in the gravity data emanating from imprecise elevation measurements using a handheld GPS, as well as the coarse nature of the data, it is likely that an accurate assessment of the density distribution within the vent has not been achieved. A central gravity high was identified (see Figure 7.5), which later proved to correlate with the relatively magnesium-rich carbonatite in the drill core.
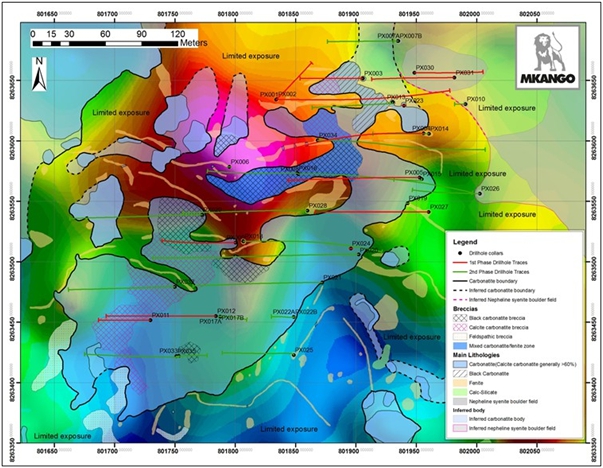
Source: Mkango Resources Ltd internal geological map (2011) on gravity map by RES (2011)
NOTE: Ground gravity survey over Songwe Hill showing a central gravity high; geological map, drill collars and drillhole traces are superimposed. UTM Zone 36S and WGS84 Datum.
Figure 7.5: Ground Gravity Survey over Songwe Hill
| S-K 1300 Technical Report Summary on the Songwe Hill REE Project | Page 116 of 489 |
| |
| 7.2.4 | NSAMT Survey |
The NSAMT survey was carried out in the period 29 November to 9 December 2019 by Terratec geophysicists with the aid of MKAR geologists and local helpers. Data was acquired on two lines, one oriented west-east and the other north-south, each 3 km long (see Figure 7.6). The lines intersect on Songwe Hill at the point approximately central to a zone where the 3D geological model, based on geochemical analyses of drill core samples, indicates the possible main “pipe” of the Songwe Hill carbonatite.
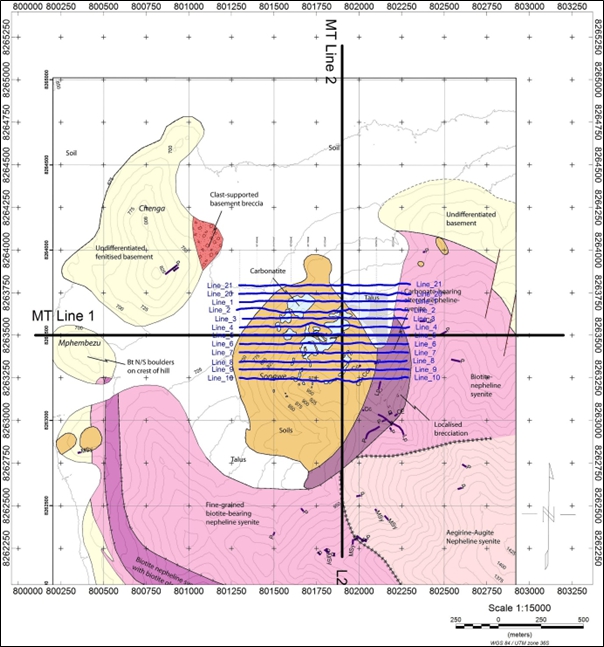
NOTE: Geological map of Songwe Hill and surrounding hills (by Dr Sam Broom-Fendley 2018, unpublished). UTM Zone 36S and WGS84 Datum.
Figure 7.6: NSAMT Survey Lines (Black) and IP Survey Lines (Blue)
| S-K 1300 Technical Report Summary on the Songwe Hill REE Project | Page 117 of 489 |
| |
At every 50 m station along the lines Ex and Ey (non-polarisable electrode) and Hx and Hy (induction coil), measurements were made using a Zonge GDP 32 II 24-bit Receiver and two ANT-6 magnetic field sensors. Ex and Ey dipole spacing was 50 m (see Figure 7.7). The electrodes were buried to a depth of approximately 5 cm, in holes with a diameter of approximately 5 cm. These holes were watered 1 d before occupation unless rain had moistened the ground sufficiently. The different electrical and magnetic measurements are grouped into Te = Ey/Hx components (perpendicular to the survey line) and Tm = Ex/Hy components (parallel to the line).
The positions were recorded with a Trimble Geo7X DGPS receiver and recorded in UTM Zone 36S in the WGS84 Datum. Zonge proprietary software was used to read the time series data, calculate averages, edit and invert the data. The inversion products are the following: Te component (Ey and Hx) 2D inversion, Tm component (Ex and Hy) 2D inversion, and the vector component (Te and Tm data) 2D inversion.
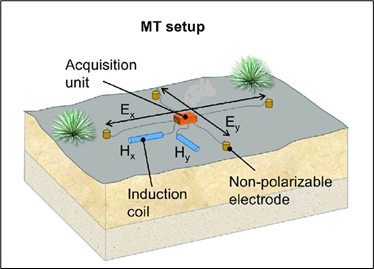
Figure 7.7: Diagram of the Field Station Setup in the NSAMT Survey
The NSAMT survey has revealed a possible continuation of the carbonatite to depth, probable geological boundaries that cannot be observed at surface, and the approximate depth of recent cover between the exposed hills (see Figure 7.8). The survey also reflects the observable and mapped geology, specifically the carbonatite-fenite complex of Songwe Hill, the syenite complex of Mauze, and the basement gneisses.
| S-K 1300 Technical Report Summary on the Songwe Hill REE Project | Page 118 of 489 |
| |
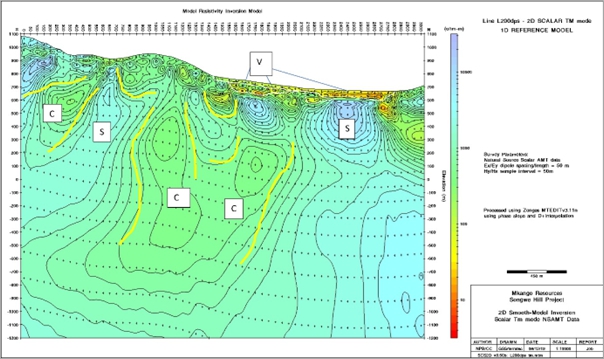
NOTE: North-south survey line with geological interpretation: C = Carbonatite, S = Syenite, V = Valley Fill (Sediments)
Figure 7.8: Example of the Inversion Products of the NSAMT Survey
| 7.2.5 | IP Survey |
A dipole-dipole electrical resistivity tomography (ERT)/time domain induced polarisation (TDIP) survey – together referred to as an IP survey – was carried out by Terratec geophysicists with the aid of MKAR geologists and local helpers in the period 5 to 27 January 2020.
The ERT and TDIP methods were selected to detect the resistivity and chargeability distribution in depth sections, derived from a 3D volume, to support the detailed geological interpretation. In this survey, measurements were taken along 12 lines (see Figure 7.6) between 1,015 m and 1,125 m in length and at a 50 m separation. The survey zone was designed to cover the entire drilled area of Songwe Hill but extended far beyond it to the west and east. It was also extended slightly to the north with two lines (Lines 20 and 21) additional to the originally planned ten lines (Lines 1 to 10). The spatial relationship between the IP and NSAMT survey lines is shown in Figure 7.6.
The system consists of a 400 m long cable for the receiver positions (Rx) and two transmitter electrodes (Tx). The transmitter electrodes were located at −50 m and −25 m, relative to the reference position at Rx 0 m, behind the receiver line.
The transmitter dipole had a fixed length of 25 m and an offset distance of 25 m from the receiver line. The receiver dipoles had lengths of 50 m evenly distributed over the 400 m long cable. Additional shorter dipoles were measured close to the transmitter dipole to detect near-surface structures at high resolution. Also, multiples of the 50 m dipoles (100 m and 200 m) were measured on the far side of the receiver cable, away from the transmitter dipole, to improve signal quality for deeper structures. The connection to the ground was established with stainless steel electrodes.
| S-K 1300 Technical Report Summary on the Songwe Hill REE Project | Page 119 of 489 |
| |
The transmitter was an IRIS instruments TIPIX 3000 3 kW Transmitter (3,600 V). The data receiver was a GDD instruments GDDX16 16-channel IP full-wave receiver allowing for advanced post-processing for noise reduction, if necessary. The transmitter/receiver settings were as follows: time domain cycle = 2 s, delay time = 240 ms, width of partial window = 80 ms.
The receiver cable with 13 receiver electrodes and 2 injection electrodes was laid along the ground. Injection was carried out with an external transmitter (TIPIX 3000). To improve the contact resistivity at each injection point, 3 electrodes were arranged in a triangle with a side length of approximately 40 cm, and the injection ground points were saturated with salt water. The receiver electrodes were prepared with unsalted fresh water. After completion of a reading, both the receiver and the transmitter cable systems were moved 25 m to the next stations along the line. At each station, the position of the reference point (Rx = 0 m) was taken with a Trimble Geo7X DGPS receiver and recorded in UTM Zone 36S in the WGS84 Datum. Field data was processed in software packages Prosys II, ZondRes2D, and Geosoft.
The IP survey has provided a detailed geophysical picture of Songwe Hill itself to a depth of several tens of metres (see Figure 7.9 and Figure 7.10). In addition to the research value of the geophysical data and interpretation, the geophysics has revealed new drill targets; this is elaborated on in Section 21.3 (Opportunities). Furthermore, of particular economic significance, the geophysics has aided the identification of weathered iron-rich zones that have proven to be deleterious in flotation tests. Such zones are known from the drilling, but their extent could only be guessed before the IP survey.
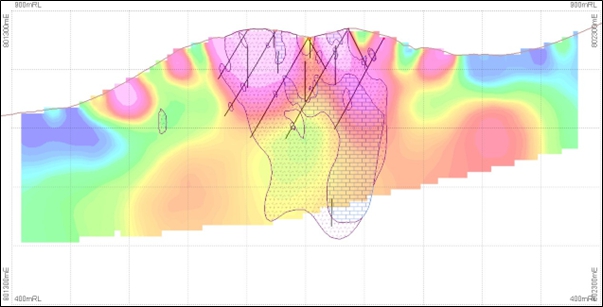
NOTE: Geological model on a 100 m grid; brick pattern = carbonatite, chevron pattern = mixed carbonatite and fenite. Resistivity scale from blue (low) to purple (high). Drill traces in 20 m envelope (10 m toward and 10 m away from the west-east plane of view).
Figure 7.9: Example of an IP Resistivity Profile through Songwe Hill
| S-K 1300 Technical Report Summary on the Songwe Hill REE Project | Page 120 of 489 |
| |
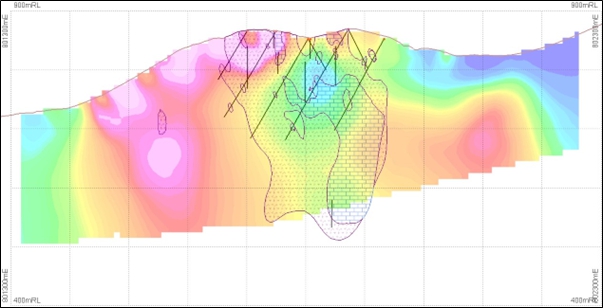
NOTE: Geological model on a 100 m grid; brick pattern = carbonatite, chevron pattern = mixed carbonatite and fenite. Chargeability scale from blue (low) to purple (high). Drill traces in 20 m envelope (10 m toward and 10 m away from the west-east plane of view).
Figure 7.10: Example of an IP Chargeability Profile through Songwe Hill
| 7.3 | Geological Mapping |
Detailed geological mapping of Songwe Hill was carried out during March 2010 in conjunction with the surface litho-geochemical sampling programme, and between May and July 2011 with refinements and revisions in October and November 2011. All outcrops on the north-facing slopes of Songwe Hill were systematically recorded, and their locations determined with a handheld GPS (Garmin 60CSX). Mapping was aimed at providing better detail on the distribution of carbonatite, fenite and breccia across Songwe Hill and to delineate the zones of rare earth mineralisation (see Figure 6.3). The mapping programme demonstrated that carbonatite outcrops over a significantly larger area than had previously been recognised by JICA and MMAJ. Mapping further achieved a more precise delineation of the distribution of breccia and fenite. The mapping broadened the surface area of known rare earth mineralisation significantly beyond the areas identified in previous exploration and identified new areas of rare earth enriched carbonatite on the western slope of the hill.
| 7.4 | Surface Channel Sampling |
A channel sampling programme was undertaken during November and December 2011 following the Stage 1 drilling campaign. The objective was to guide the geological model and provide continuous surface sampling along the drillhole section lines in order to assist in constraining the Mineral Resource estimate. Outcrops were exposed by cleaning off overburden and soil as continuously as possible along five lines with an east-west orientation that followed the approximate surface projections of existing and planned drillholes. In detail, the location of the channel sampling lines was dictated by the availability of outcrop along each E-W line. Where outcrop could not be exposed directly on the line, sampling was offset to the outcrop nearest to the line, irrespective of lithology (see Figure 7.11). To the extent possible, continuous channel samples were cut along each of these lines.
| S-K 1300 Technical Report Summary on the Songwe Hill REE Project | Page 121 of 489 |
| |
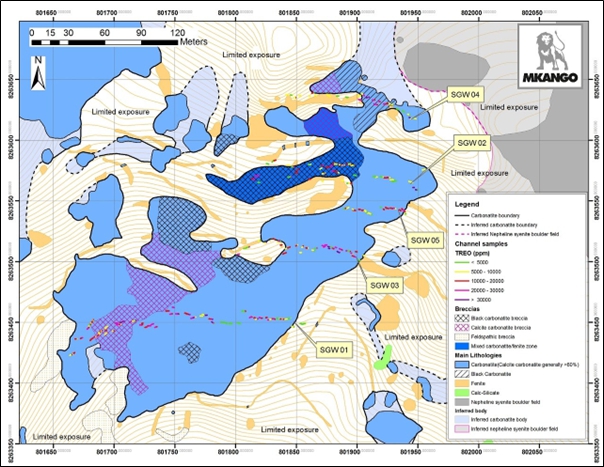
Source: Mkango Resources Ltd internal map (2012).
NOTE: UTM Zone 36S and WGS84 Datum
Figure 7.11: Geological Map with Location and TREO of the Five Channel Sample Lines
Channels were cut in the exposed outcrop using a Stihl TS 700 saw fitted with a diamond saw blade (see Figure 7.12) and connected to a Stihl 10 L pressurised water tank. All channels were cut to widths of between approximately 4 cm and 5 cm and a depth of between approximately 10 cm and 12 cm. A single channel was defined by the start and end of a continuous cut. There were many breaks in the cutting due to the uneven topography and distribution of outcrop and overburden. As a result, although the channels follow the planned surface lines as closely as possible, they are not continuous and locally deviate from the line.
| S-K 1300 Technical Report Summary on the Songwe Hill REE Project | Page 122 of 489 |
| |
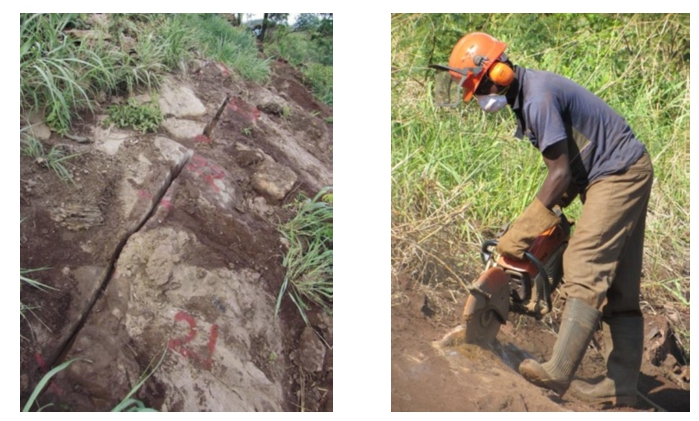
Source: Photographs by Dr Paul Armitage (2011)
Figure 7.12: Example of Channel Sampling Programme on Songwe Hill
On completion of cutting, the channels and an area approximately 50 cm to either side of the channels were cleaned of sludge using water and a stiff brush if necessary. When the rock surface had dried after cleaning, metre marks were painted across the channels, together with unique sample numbers (sample ticket book number) adjacent to the metre marks, on the left side of the channel, viewed in the direction of sequential sampling.
Samples were broken and chipped out of the channels using a tapered masonry chisel and a club hammer. As slabs and chips of rock were liberated, they were placed immediately into pre-prepared sampling bags containing sample tickets and marked with sample numbers on the outside. Before sampling each metre, the geologist checked that the sample number of the bag corresponded to the number spray-painted alongside the channel. Channels were sampled at 1 m intervals, and if there was a change of lithology within the sampling interval, then each lithology was sampled separately, using a channel length with a minimum of 20 cm and a maximum of 130 cm.
On completion of sampling, all channels were photographed, viewed in the direction of sequential sample numbering, and clearly showing the sample numbers.
The channel sampling logging and sampling technique employed during the channel sampling programme followed strict internal QA/QC procedures. Each channel sample line was geologically logged and sampled observing the same procedures used during the drilling programmes. Sample preparation and analytical work were carried out by Intertek-Genalysis Laboratory Services (Genalysis) in Johannesburg, South Africa, and Perth, Australia, respectively, employing inductively coupled plasma mass spectrometry (ICP-MS) analytical procedures and following strict internal QA/QC procedures, including the insertion of duplicates, blanks and certified standards. Detailed information on logging, sampling and geochemical analysis is presented in The MSA Group (2020).
| S-K 1300 Technical Report Summary on the Songwe Hill REE Project | Page 123 of 489 |
| |
A summary of the results of the channel sampling programme is presented in Table 7.2. Given the irregular surface and potential near-surface modification of the TREO grade, the channel samples were not considered of sufficient reliability for use in Mineral Resource estimation. However, the results are broadly consistent with the geological mapping, litho-geochemical sampling and portable XRF sampling results and further confirm the continuity of rare earth mineralisation at surface in carbonatite, carbonatite breccia, and fenite on Songwe Hill.
Table 7.2: Summary of Assay Results for the Five Channel Sample Lines
| E-W Line (Approximate Length) |
Aggregated Length of Channel Samples |
Aggregated Length of Carbonatite1 in Channel Samples |
Weighted Average TREO2 in Carbonatite1 |
Aggregated Length of Fenite in Channel Samples |
Weighted Average TREO2 in Fenite |
| m | m | m | % TREO2 | m | % TREO |
| SGW-01 (200 m) | 152 | 119 | 1.75 | 33 | 0.73 |
| SGW-02 (150 m) | 106 | 79 | 1.44 | 27 | 1.20 |
| SGW-03 (110 m) | 66 | 53 | 1.70 | 14 | 0.67 |
| SGW-04 (120 m) | 63 | 33 | 2.83 | 31 | 0.94 |
| SGW-05 (55 m) | 37 | 31 | 1.37 | 6 | 1.28 |
| 1 Includes both carbonatite and carbonatite breccia | |||||
| 2 TREO = total rare earth oxides including yttrium | |||||
| Source: Mkango Resources Ltd (2012) | |||||
| 7.5 | Bulk Sampling |
A bulk sample was collected from outcrops to provide better information on the consistency of REE grades in the deposit and to provide material for metallurgical testing. Twenty-two locations (BS001-BS022) were identified where the carbonatite and “mixed rock” were well exposed and with minimal surface weathering, with exposure sufficiently prominent and next to roads/pads to allow access by a JCB tracked excavator equipped with a hammer (see Figure 7.13 and Figure 7.14). Approximately 2.7 t of rock were hammered out and collected at each location to make up a total of approximately 60 t. Only blocks of fresh rock were collected; any pieces with weathering rind or cavity walls were rejected. Blocks of rock were gathered in rice bags, labelled by sampling location, and manually loaded onto a Land Cruiser, driven to camp and placed into bags containing approximately 1 t each for transport on a low loader to Blantyre for air freight to Perth, Australia.
Smaller representative rock chips were collected at each location for assay.
| S-K 1300 Technical Report Summary on the Songwe Hill REE Project | Page 124 of 489 |
| |
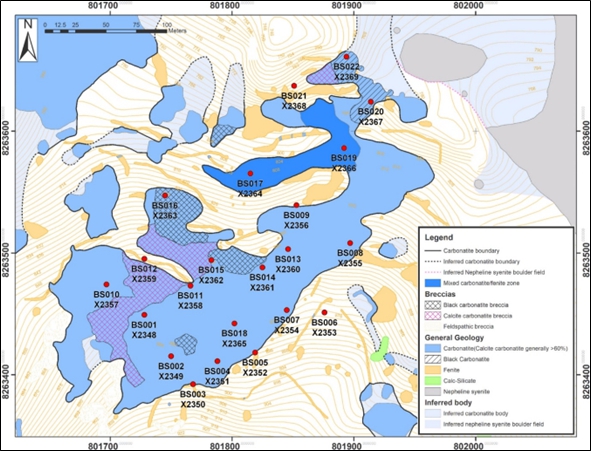
Source: Mkango Resources Ltd internal map (2019).
NOTE: Prefix BS- indicates field location ID, prefix X- indicates laboratory ID. UTM Zone 36S and WGS84 Datum
Figure 7.13: Location of Sites where the Bulk Sample was Taken
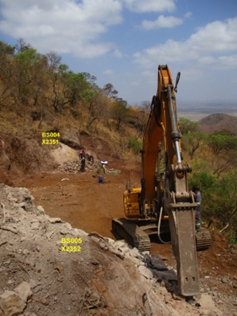
Source: Photograph by Bill Levene (2018)
Figure 7.14: Bulk Sampling in Progress by JCB Tracked Excavator with Hydraulic Hammer Attachment
| S-K 1300 Technical Report Summary on the Songwe Hill REE Project | Page 125 of 489 |
| |
| 7.6 | Research Programmes |
Post-graduate studies on the middle and heavy REE (HREE) mineralisation at Songwe Hill have been completed at Camborne School Mines (CSM), University of Exeter, UK in conjunction with the British Geological Survey (BGS). This research investigated HREE concentration levels in alkaline and carbonatite complexes, which are typically light rare earth dominated.
This research was focused on two principal questions:
| ● | Under what conditions are the HREE preferentially removed from a carbonatite and deposited in hydrothermal veins? |
| ● | How does the REE distribution evolve through the carbonatite intrusion phases and into late-stage hydrothermal remobilisation? |
This work was carried out at the mineralogical laboratories at CSM using cathodoluminescence, electron microscopy and an electron microprobe, and at the BGS utilising LA-ICP-MS and a fluid inclusion heating and cooling stage.
The study has been completed, and the results have been published. It has resulted in a better understanding of the geological and age relationships of the vent complex (Broom-Fendley et al., 2017), and the mineralogy and fluid history of the intrusion (Broom-Fendley et al., 2016a, b).
Mkango has encouraged and participated in research at Songwe Hill by serving as a project partner in the HiTech AlkCarb Project, funded under the European Union’s Horizon 2020 Research and Innovation programme, to develop new geomodels and sustainable exploration methods for alkaline igneous rocks and carbonatites. This project brought the expertise of a wide variety of specialists to bear on problems related to the understanding and effective exploration of critical metal deposits, through examination of a number of “natural laboratories”, including the Chilwa Alkaline Province, and specifically the Songwe Hill deposit. The project members visited the Songwe Hill site in October 2016.
Another research team, including some of the HiTech AlkCarb members, visited the site in May 2023 in connection with the REEDRILL Project, which seeks to undertake deep drilling in an alkaline-carbonatite complex in order to understand how fluid-rock interaction influences REE mineralisation, groundwater and deep life (microbes living deep below the surface). Songwe Hill was selected by the REEDRILL team, and an application was submitted in January 2025 for funding from the International Continental Scientific Drilling Program (ICDP). The ICDP’s assessment of the application is in progress.
| 7.7 | Drilling |
| 7.7.1 | Historical Diamond Drilling (1988) |
Historical drilling from the JICA and MMAJ programme is described in JICA and MMAJ (1989). The historical drilling does not have adequate geodetic or procedural information to be incorporated in the evaluation of the Songwe Hill deposit and does not form part of the database for the current Mineral Resource estimate.
| S-K 1300 Technical Report Summary on the Songwe Hill REE Project | Page 126 of 489 |
| |
| 7.7.2 | Phase 1 (2011), Phase 2 (2012) and Phase 3 (2018) Diamond Drilling |
Mkango undertook three diamond drilling campaigns at Songwe Hill: two totalling 38 drillholes during 2011 (Stage 1) and 2012 (Stage 2), and a third totalling 91 holes (Phase 3) in 2018. The drilling programmes were undertaken following strict, industry-standard protocols, which were part of a comprehensive set of standard operating procedures (SOPs). The implementation of all the protocols was independently monitored by The MSA Group (MSA).
| 7.7.2.1 | Phases 1 and 2 |
The objectives of the Phase 1 and 2 drilling were to evaluate the REE potential of the Songwe Hill deposit and develop a Mineral Resource estimate. These two phases of drilling resulted in the initial Mineral Resource estimate for Songwe Hill, which was reported in an NI 43-101 Technical Report in 2015 (The MSA Group, 2015) and summarised below.
The Phase 1 drilling programme, from April 2011 to June 2011, was conducted to confirm the extent and grade of the mineralisation that had previously been identified during the JICA and MMAJ drilling campaigns and to test whether the mineralisation extends beyond the boundaries of the previously established mineralised areas.
The programme totalled 13 drillholes, comprising 2 vertical holes and 11 inclined holes drilled on 90° and 270° azimuths at inclinations of −60° and −70°, and 1 hole (PX002) drilled at 045° azimuth at −70° inclination. Drillhole depths ranged from a minimum of 86 m to a maximum of 302.2 m. A total of 1,987.38 m was drilled, and 2,118 samples were collected for geochemical analyses.
The Phase 2 diamond core drilling programme was carried out between January 2012 and May 2012, and focused on infill drilling and expanding the area of known mineralisation identified during Phase 1, particularly at depth.
The programme totalled 25 holes, comprising 4 vertical holes and 21 inclined holes drilled on 90° and 270° azimuths at inclinations of −60°, −65°, −70° or −80°. Drillhole depths ranged from a minimum of 21 m to a maximum of 363 m. A total of 4,864.90 m was drilled, and 5,116 samples were collected for assays.
As a result of the first two phases of drilling, Mineral Resource and Mineral Reserve estimates were reported in the 2015 NI 43-101 Technical Report (The MSA Group, 2015). The Inferred Mineral Resource at a 1 % cut-off for TREO was quoted as 18.59 Mt grading 1.38 % TREO. The estimated Mineral Reserve was quoted as Probable Mineral Reserves of 8,482,603 Mt, grading 1.60 % TREO. These estimates are superseded by the Mineral Resource estimate reported in the 2022 DFS, and MKAR is not treating this prior estimate as the current Mineral Resources or Mineral Reserves.
| 7.7.2.2 | Phase 3 |
The Phase 3 diamond drilling programme at Songwe Hill was carried out between June and September 2018. The objectives were to revise and upgrade the existing Indicated and Inferred Mineral Resource estimates, test extensions to the mineralisation outside the previously defined resource area, and provide geotechnical information to contribute to the mining plan. The prime objective was to provide a revised Mineral Resource estimate for the Project.
| S-K 1300 Technical Report Summary on the Songwe Hill REE Project | Page 127 of 489 |
| |
The Stage 3 drilling programme was conducted by Cartwright Drilling Inc. of Goose Bay, Canada, using two skid-mounted proprietary CDI-500 drill rigs capable of drilling to a depth of 700 m. The rigs accessed the drill pads via purpose-built roads on Songwe Hill and were moved into place using two JCB tracked excavators. The drilling utilised HQ/NQ core barrels. The locations of the holes and their surface traces are illustrated in Figure 7.15.
The programme totalled 91 drillholes. All except one are inclined holes. Most (84 holes) were drilled at −60°. Of the remaining holes, one was drilled at −65°, two at −70°, one at 75°, two at 80°, five at 50° and one vertically. A total of 54 holes were drilled at an azimuth of 270°, 16 at an azimuth of 180°, 18 at an azimuth of 090°, and 3 at an azimuth of 000°. Drillhole depths ranged from a minimum of 42.7 m to a maximum of 219.6 m. A total of 10,897.33 m was drilled, and 5,725 samples (not including certified reference materials or duplicates) were collected for geochemical analyses.
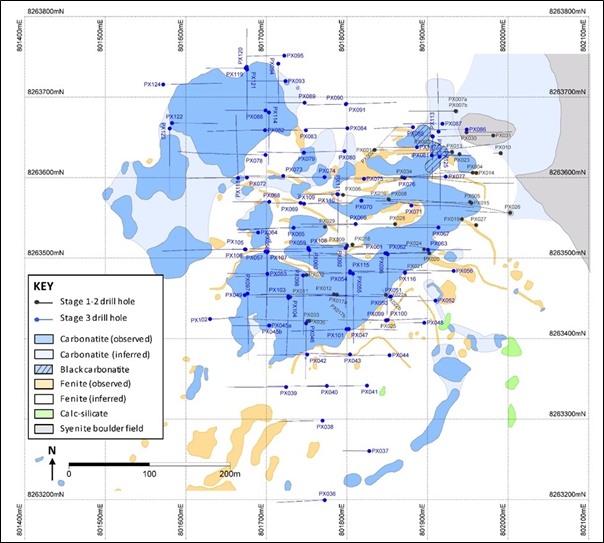
Source: Mkango Resources Ltd (2018)
Figure 7.15: Geological Map Showing Drillhole Collars and Traces
| S-K 1300 Technical Report Summary on the Songwe Hill REE Project | Page 128 of 489 |
| |
| 7.7.3 | Core Recovery |
In all the phases of drilling, core recovery was determined prior to logging and sampling, and standard core recovery forms, prepared by MSA, were completed for each hole by the geologist at the drilling site. Core recovery was typically very good, usually > 90 % within the carbonatite, carbonatite breccia and fenite lithologies. However, in zones that contained significant void space/cavities, recoveries were locally very poor (< 50 %), and in a few cases, little material (< 10 %) was returned to the surface. The cavities/void spaces are the likely result of the karst-type dissolution of matrix carbonate in the host carbonatite.
Large cavity/void areas were not included in the assay intervals but were tabulated as voids.
| 7.7.4 | Collar Surveys |
The 2011 Phase 1 drillhole collars were surveyed by Digital Surveying based in South Africa. The 2012 Stage 2 channel sample lines and drillhole collars were surveyed by a licensed land surveyor, Land Management Consultants, of Blantyre, Malawi using a real-time kinematic (RTK) DGPS with sub-centimetre accuracy. The Stage 1 drillhole collars were also re-surveyed by Land Management Consultants for verification purposes, and all collar locations are reported using the Land Management Consultants survey data.
The Phase 3 drill collars were surveyed by Terratec using a Trimble R2 DGPS with RTX correction signal (see Figure 7.16). No base station was required because the RTX signal allows coordinates to be derived to an accuracy of 2 cm in X and Y and 4 cm in Z.
All Phase 3 collars were surveyed in the period 18 to 20 September 2018. On each of the three days, a checkpoint inside the weather station enclosure in camp was surveyed in the morning (prior to work) and in the afternoon (after work). An attempt was made to access government survey beacons, but the two beacons within reasonable distance of Songwe Hill were found to have been destroyed.
Eleven drill collars surveyed in 2012 were re-surveyed in 2018, and the surveys were compared. The coordinates obtained in 2018 and those obtained in 2012 by Land Management Consultants agreed well in X and Y; however, the previously surveyed elevations were on average 1.734 m higher than the 2018 geoid elevations. It was decided that the 2018 data should be brought in line with the 2012 data, as the 2012 survey elevations agreed well with the LiDAR (light detection and ranging) survey of Songwe Hill completed in 2016.
| S-K 1300 Technical Report Summary on the Songwe Hill REE Project | Page 129 of 489 |
| |
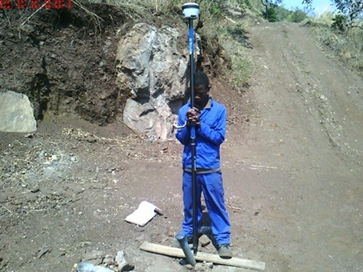
Source: Photograph by Terratec Geophysical Services (2018)
NOTE: A plank was placed across the collar pit to ensure that the intersection between ground level and the top side of the casing in the drillhole could be measured.
Figure 7.16: DGPS Survey of a Drillhole Collar
| 7.7.5 | Downhole Surveys |
| 7.7.5.1 | Phase 1 |
The 2011 Phase 1 drillholes were surveyed by Digital Surveying based in South Africa using a Reflex GYRO tool with station readings every 5 m. The surveys were carried out using a winch inside plastic casing placed down the hole to ensure hole integrity.
| 7.7.5.2 | Phase 2 |
During the Phase 2 programme, 14 holes (PX007a, PX008, PX014, PX015, PX016, PX018, PX020, PX021, PX026, PX028, PX029, PX032, PX034, and PX035) were surveyed using a Reflex GYRO tool, with station readings every 5 m. The Reflex GYRO tool has an integrated azimuth pointing system (APS) that indicates the true north azimuth, a GPS position, and the degree of inclination. The APS is not affected by magnetic interference, and thus during the Stage 2 programme, the surveys were carried out inside the drill rods. The Reflex GYRO was set up and controlled by the site geologist using the Toughbook field PC supplied with the system. Several parameters, including temperature, were continuously recorded in the on-board memory throughout the survey to track the path of the drillhole. Once the survey was finished and the instrument brought to the surface, the data was transferred from the Reflex GYRO’s onboard memory to the Toughbook.
The remaining 10 holes of the Phase 2 programme were surveyed using a Reflex EZ-AQ instrument with station readings every 5 m. The EZ-AQ surveys were carried out using a hand winch inside plastic casing placed down the hole to ensure hole integrity. The EZ-AQ instrument, which is sensitive to magnetic interference, measured the inclination and direction of the drillhole, together with magnetic and gravity field components. A handheld device was used to communicate with the instrument, which allowed the site geologist to view the orientation of the drillhole path immediately. The survey data was transferred from the EZ-AQ instrument via an infrared data link. Both the Reflex GYRO and the EZ-AQ tools worked effectively.
| S-K 1300 Technical Report Summary on the Songwe Hill REE Project | Page 130 of 489 |
| |
In general, very minor dip deflections were recorded in both the Stage 1 and Stage 2 drillholes. The azimuth deviation was typically less than 5° for all holes, but for a number of deep holes deviation could range up to 10° over 300 m.
| 7.7.5.3 | Phase 3 |
The Phase 3 drillholes were surveyed using a Reflex GYRO probe (Serial No. 508) to establish the inclination and azimuth for each hole. The probe is set up and controlled using a field PC supplied with the system. Twelve parameters are continuously recorded in the probe’s memory throughout the survey to track the path of the drillhole. The power is provided by a rechargeable internal battery pack, and all the data is stored on the 512 MB onboard memory of the probe. The Reflex GYRO probe provides accurate directional data (azimuth and dip) at any interval, its accuracy is not affected by magnetic interference, and it can be used inside all types of drill rods or in magnetically disturbed ground. Once the probe has been brought to the surface, the data can be transferred from the probe’s onboard memory to the field PC via Bluetooth.
All the drillholes were surveyed using a known start direction. These azimuth values were supplied by Mkango. For QA/QC purposes, all the holes were surveyed in both upward and downward directions to provide two sets of data. For further processing, the upward direction dataset was used. Most of the data was recorded at 5 m station spacing, but for shorter holes (20 m to 50 m), the spacing was decreased and could be as small as 2 m depending on the depth of the holes.
The Phase 3 holes exhibited very minor deflections. Dip deviation was generally less than 5° for all holes. The azimuth deviation was typically less than 3.5° for all holes, except for hole PX070, which showed a final deviation of 13.3°.
| 7.7.6 | Drillhole Programme Management |
Access to drilling sites on Songwe Hill was via a network of roads constructed for that purpose. Water for drilling was supplied from two boreholes: one within the Songwe Hill exploration camp perimeter, and one outside, close to the driveway into the camp. Water was pumped from the boreholes into a 30,000 L aqua dam at the base of Songwe Hill and then pumped through heavy-duty pipes to 30,000 L aqua dams approximately halfway up and at the top of the hill and then gravity fed to the drill rigs. For Phase 3, water was pumped from two aqua dams in the camp to two separate sets of five 5,000 L plastic tanks: one at the top of the hill next to PX036, and one about a third of the way down the hill near PX044; the upper set of tanks was moved to the PX072 pad later in the programme when drilling was taking place below the PX072 elevation.
All the drillhole positions were sited by a geologist from Mkango’s exploration team with a handheld Garmin GPS unit using UTM Zone 36S projection and WGS84 Datum. The planned collar positions were marked with wooden pegs, and the azimuth was outlined using spray paint. Prior to drilling, the alignment of the rig was checked by the site geologist to ensure correct rig setup. The inclination was measured on the derrick using a Brunton compass. The azimuths were checked by the geologist using a compass clinometer corrected for local magnetic declination. After the completion of each drilling programme, all the hole collars were re-surveyed using DGPS equipment (refer to Section 7.7.4).
| S-K 1300 Technical Report Summary on the Songwe Hill REE Project | Page 131 of 489 |
| |
Drilling was monitored on a continuous basis by Mkango geologists to ensure maximum recovery. Cores were obtained using wire-line methods and were washed by a member of the drill crew prior to placement in a steel core tray. Core trays were labelled in advance with the drillhole name and box number and placed near the drill rig. Drillhole cores were consistently packed left to right, pointing downhole, in each tray. Plastic depth marker blocks were inserted at the end of every run, and the actual drill depth, according to the number of rods in the ground, and the length of the recovered core were recorded on the depth blocks. Detailed core recovery measurements were completed by the site geologist before the trays were transferred to the exploration camp.
Filled core trays were removed from the drill site twice a day under the supervision of the site geologist. Trays were covered with blankets and then secured by straps with ratchets in Mkango’s pick-up truck and transported to the exploration camp site.
Following completion of the Phase 1 and 2 drillholes, all the collars were capped and marked with a concrete slab with the relevant information recorded on a metal plate.
Following completion of the Phase 3 drillholes, all the collars were capped with a concrete plinth and labelled with an embossed galvanised steel plate. The top of the plastic casing was cut, capped, and covered in concrete. A short length of dummy plastic casing was set in the ground away from the plinth as a distractive measure to prevent further theft of plastic casing from the drillholes (see Figure 7.17).
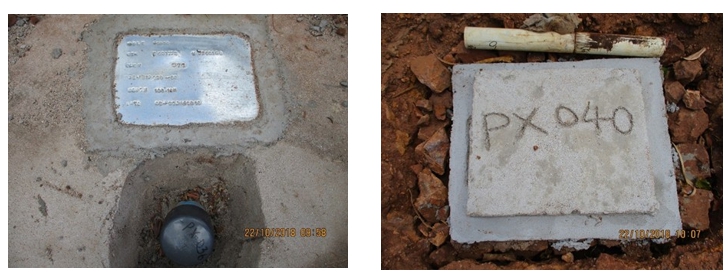
Source: Mkango Resources Ltd (2018)
Figure 7.17: Examples of Plinths Marking Drillhole Locations
| 7.7.7 | Results of the Drilling Programmes |
| 7.7.7.1 | Objectives |
| 7.7.7.1.1 | Phases 1 and 2 |
The Phase 1 drilling programme was successful in confirming the presence of REE mineralisation first outlined by the JICA and MMAJ work. Eleven of the thirteen holes intersected significant zones of rare earth mineralisation. Having confirmed the presence of the mineralisation, the Phase 1 drilling was expanded to areas not previously tested and demonstrated the extension of rare earth mineralisation both laterally and vertically.
| S-K 1300 Technical Report Summary on the Songwe Hill REE Project | Page 132 of 489 |
| |
The Phase 2 drilling focused on expanding the area of known mineralisation, infilling between existing holes, and testing the mineralisation at depth. All the drillholes intersected REE mineralisation and the maximum depth at which REE mineralisation was encountered was 350 m below the surface of the hill.
| 7.7.7.1.2 | Phase 3 |
Approximately 60 % of the Phase 3 drillholes were infill holes aimed at better defining the geology and geometry of the mineralised body, to permit better understanding of the geological characteristics and setting of the mineralisation, and to refine the geological model as a prelude to redefining the Mineral Resource. As a result of the Phase 3 drilling, the Mineral Resource has now been drilled at a maximum collar spacing of 50 m in the east-west direction and between 30 m and 40 m in the north-south direction (approximately 30 m in the infill drilling zone and 40 m in the step-out areas). All infill holes intersected significant widths of mineralised carbonatite and breccia. Modelling of the lithologies based on geochemistry reported in The MSA Group (2020) confirms that the core of the deposit is a more or less uniformly mineralised carbonatite intrusive with steep sides. Within the carbonatite and mantling it on all sides and above are various breccias containing variable amounts of carbonatite that are variably mineralised.
Approximately 30 % of the Phase 3 drillholes were step-out holes, aimed at expanding the known Mineral Resource by identifying or better delineating mineralisation that is outside the volume of the previously defined Mineral Resource. Most of these holes contained mineralised intersections although not all reached their targeted depth. These holes have resulted in the expansion of the estimated Mineral Resources by identifying new areas of mineralised carbonatite beyond the limits of the previous drilling.
Sixteen of the holes were drilled to provide geotechnical information within the Mineral Resource. In these holes, oriented cores were recovered.
| 7.7.7.2 | Mineralised Lithologies |
The drilling demonstrated that the mineralised body at Songwe Hill is geologically complex. The drilling also revealed that the core of the system is a carbonatite plug of highly irregular geometry that is more or less uniformly mineralised. The carbonatite intrudes and is intruded by more or less coeval phonolitic intrusions that are typically variably fenitised and brecciated. The fenitised rocks and associated breccias are intimately associated with the carbonatite and, at a large scale, form a halo around the carbonatite intrusion. The explosive and fluid-rich nature of the intrusion is demonstrated by the widespread occurrence of carbonatite and fenite breccias. The following three lithological domains were used to guide the documentation of the lithologies in the drillhole core:
| ● | Carbonatite |
| ● | Fenite |
| ● | Mixed lithologies |
| S-K 1300 Technical Report Summary on the Songwe Hill REE Project | Page 133 of 489 |
| |
| 7.7.7.2.1 | Carbonatite |
Carbonatite is the dominant lithology, ranges from grey to black in colour, and typically hosts REE mineralisation. Assay data shows that the carbonatite is widely and uniformly mineralised. Mineralogical observations suggest that the mineralisation is dominantly hosted by synchysite and apatite. The latter is generally anomalously rich in heavy rare earths compared to apatites in many other carbonatite complexes. This feature is interpreted to be the result of sub-solidus hydrothermal redistribution of the REE during the final stages of the evolution of the carbonatite body.
| 7.7.7.2.2 | Fenite |
Fenite is present throughout the carbonatite body and is intimately intermixed with the carbonatite. The fenites comprise dominantly potassium feldspar and are interpreted to have formed through metasomatism related to the intrusion of the carbonatite. The protolith to most of the fenites seems to be phonolitic intrusions, which were intruded both before, during and after carbonatite intrusion. At least some of the fenites are interpreted to be blocks stoped into the carbonatite magma, while others seem to be fault-bounded and may be structurally emplaced in their present position. The fenites are variably carbonatised and locally enriched in REE. Mineralisation in the fenite appears to be related to the degree of carbonatisation and the intensity of carbonatite and Mn-Fe veining. Relatively pure fenites typically do not contain significant REE concentrations, while increasingly carbonatised fenites carry anomalous quantities of REE.
| 7.7.7.2.3 | Mixed Lithologies |
The mixed lithologies are intimately associated with both carbonatites and fenites. They include breccias with carbonatite and fenite components, as well as finely intermixed carbonatite and fenite that cannot be separated into distinct units and correlated at the scale of mapping. The mixed lithologies are typically mineralised and are a significant contributor to the REE Mineral Resource. The concentration of REE is a function of the amount of carbonatite in the unit and the intensity of Mn-Fe veining.
| S-K 1300 Technical Report Summary on the Songwe Hill REE Project | Page 134 of 489 |
| |
| 7.7.7.3 | Orientation and Spatial Distribution of Mineralisation |
The Phase 3 drilling has resulted in a better understanding of the geometry and orientation of mineralisation at Songwe Hill. The mineralised body is a carbonatite plug, which is part of a larger system of intrusion and brecciation incorporating variable amounts of the surrounding lithologies. The mineralisation appears to be the result of hydrothermal processes that acted within the carbonatite, as well as in the related lithologies (fenite, breccia), and produced a relatively uniformly mineralised body. As such, the mineralisation does not have a well-defined strike or geometric shape although the drilling suggests that, in plan view, it is elongated in a NE-SW direction, and this is consistent with the presence of a persistent NE-SW striking, steeply dipping foliation observed in some of the carbonatite outcrops. The outline of the carbonatite plug is well defined by the drilling although there are isolated distal occurrences of carbonatite that cannot be connected to the main body at the present level of detail. It seems likely that there are additional carbonatite dykes and pods that remain untested by drilling beyond the NW and SW extent of the current drill sections (see Figure 7.15) as well as at depth. Structural observations in the drillhole core suggest that contacts and other fabrics are very steep, and this supports the interpretation that the overall contacts of the body may be sub-vertical, and the carbonatite body may, therefore, extend to considerable depths below the surface. The apparently isolated northwest body is an exception, in that contacts are observed in several places to be moderately to gently dipping. However, the overall geometry is not well enough constrained to allow a determination of the extent to which intersections represent true width.
| 7.7.8 | Hydrogeology |
Digby Wells carried out the hydrogeology studies and is discussed in Section 13.2.1.
| 7.7.9 | Geotechnical |
Geotechnical data was obtained from geotechnical logging of the borehole core and from laboratory testing of selected rock samples from the boreholes as discussed in Section 13.2.
| S-K 1300 Technical Report Summary on the Songwe Hill REE Project | Page 135 of 489 |
| |
| 8 | Sample Preparation, Analyses, and Security |
Channel sampling and core drilling programmes were carried out in accordance with written SOPs developed by MSA and reviewed during site visits. All core cutting, sampling, bagging and dispatch procedures were undertaken at the Songwe Hill exploration camp by Mkango personnel.
SOPs for geological and geotechnical logging, core splitting and sampling were compiled by MSA and reviewed with Mkango’s Chief Geologist to ensure that the various activities were carried out in a consistent, transparent, auditable and appropriate manner in accordance with industry standards.
| 8.1 | Sample Preparation |
| 8.1.1 | Core Handling |
Drillhole cores were placed by the drill crew in pre-labelled steel core trays, together with plastic depth blocks indicating the start and end of each run. A downhole orientation line was then marked immediately on the core with a china marker by the site geologist.
Geotechnical logging was carried out at the drill site by a geologist who measured the core from each run to determine the accuracy of the drillers’ recoveries. The core was marked incrementally every metre with a red china marker perpendicular to the core axis.
Oriented core for geotechnical studies was recovered from 16 drillholes:
| ● | A Reflex III orientation tool was placed in the hole prior to removal of the core from the core barrel. |
| ● | Upon removal of the core, a geologist carefully marked the core according to its placement in the orientation tool. |
| ● | The downhole orientation line was drawn on the core using the mark made by the orientation tool. |
Core trays were transported twice daily under the supervision of the site geologist to the core logging and sampling facility at the exploration camp. The core trays were laid out at the camp, and the tray labels and the metre markings were checked for accuracy by a geologist.
| 8.1.2 | Core Logging |
Geological logging of the core was carried out using customised logging sheets designed by Mkango geologists and approved by MSA. In Phases 1 and 2, the cores were logged on paper forms, and the logs were subsequently captured in project-specific Microsoft (MS) Excel spreadsheets. All original paper drill logs are kept on file. In Phase 3, the cores were logged directly on digital forms on a tablet computer, and the logs were subsequently exported to MS Excel spreadsheets. Digital drill logs are kept on file as part of the Project database.
Semi-quantitative geochemical analyses were undertaken by the logging geologist using a handheld Thermo-Scientific Niton® XLp Analyzer in Phases 1 and 2, and an XL5 Analyzer in Phase 3. This was used as a guide to areas of mineralisation that are not always easily identified visually.
| S-K 1300 Technical Report Summary on the Songwe Hill REE Project | Page 136 of 489 |
| |
The magnetic susceptibility and gamma radiation (average reading over 30 s) for each metre of core were measured using a handheld magnetic susceptibility meter (SM30) and a RadEye personal radiation detector (PRD).
After core observations and measurements were completed, and prior to splitting, the core was photographed dry and wet (see Figure 8.1) on a tray stand in a fixed position, using a digital camera on a tripod also in a fixed position. The drillhole number and interval of each core tray were clearly marked, and each tray was photographed separately.
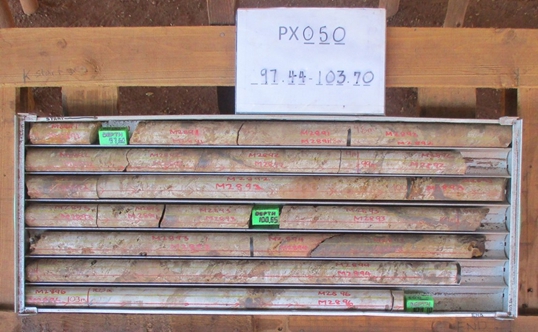
Source: Mkango Resources Ltd (2018)
Figure 8.1: Examples of Drillhole Core Marking before Splitting
| 8.1.3 | Core Sampling |
The entire length of each drillhole was sampled for chemical analyses. In Phases 1 and 2, cores were generally sampled in 1 m intervals. In Phase 3, cores were generally sampled in 2 m intervals. Where a change of lithology occurred within the sampling interval, then each lithology was sampled separately, using a minimum and maximum core length of 20 cm and 130 cm, respectively. A black line marked the start and end of each sample interval.
The sampling interval and a unique, sequential sample number (from a sample ticket book) were clearly marked by the logging geologist above the red orientation line and below the core cutting line. The core cutting line (yellow china marker) was marked on the core below and parallel to the red core orientation line. Sample numbers were marked with blue permanent marker on each individual piece of core.
The sample ticket number for each interval was recorded in the sampling sheet prior to sampling. The drillhole number and the sampled interval were also recorded on the stub of the sample ticket book.
| S-K 1300 Technical Report Summary on the Songwe Hill REE Project | Page 137 of 489 |
| |
The cores were cut in half using a commercial core cutter with a 2.2 mm wide diamond cutting blade. If any part of the core was friable or difficult to handle, it was taped with masking tape prior to cutting. Once sawn, both halves of the core were returned to the core tray. After each sample, the saw blade was cleaned with water. The upper half of the core was used for sampling, and the lower half of the core was retained in the core tray for future reference or additional test work. Sample numbers and metre marks were transcribed with a china marker onto the cut core faces prior to storage.
Each sample was double bagged with two sample number tags in extra-strength plastic sample bags. The sample was first placed in a pre-labelled sample bag and securely sealed with a cable tie. This bag was then placed in a second plastic bag, along with the corresponding sample number tag, and closed with a stapler. A second sample number tag was embedded in the stapled opening of the bag.
Sealed bags of samples were placed in a container which was always locked when not in use. The bags were laid out in sample number sequence and certified reference material (CRM), duplicate and blank samples were inserted. The samples were then assembled in approximately 25 kg batches. The assembled samples for each bag were photographed, placed in the rice bags, and the bag was sealed with tape.
Cores that have been logged, cut and sampled are stored in locked and secure, company-owned, storage containers at the Songwe Hill exploration camp (see Figure 8.2).
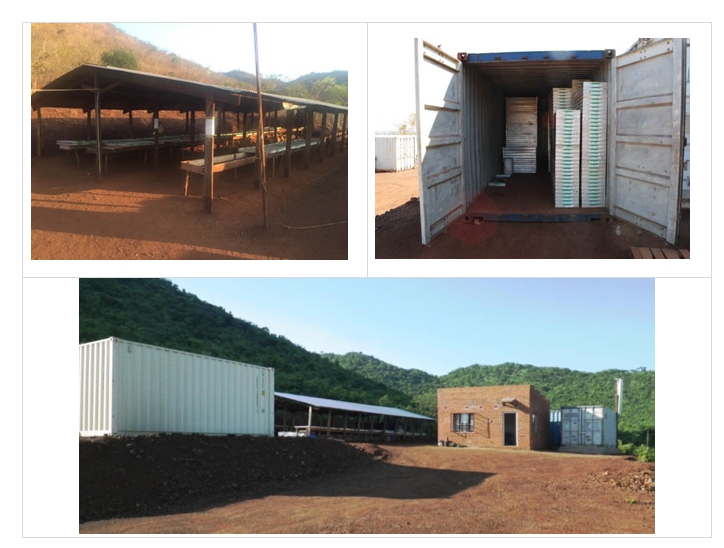
Source: Photographs by Mkango Resources Ltd (2012) and Dr Scott Swinden (2018)
Figure 8.2: Core Logging and Core Tray Storage Facilities
| S-K 1300 Technical Report Summary on the Songwe Hill REE Project | Page 138 of 489 |
| |
| 8.1.4 | Density Measurements |
Rock density measurements using the Archimedes principle (weight in air versus weight in water) were taken for every sample of core, after splitting and sampling. Each sample was approximately 15 cm to 20 cm long. The density device comprised a 3 kg electronic scale, below which a water container was placed. Attached to the scale was a core sample holder used to immerse the core in water in the container. The density method proceeded as follows:
| ● | The scale was always reset to 0.00 g before each reading. |
| ● | A dry length of core was placed in the core holder, and the mass of the core in air was recorded. |
| ● | During Phase 3, permeable dry core was dipped in hot wax so that it was fully coated with a thin wax layer, and the waxed core was placed in the scale to record the mass of the core plus the wax. |
| ● | The container was filled with water to submerge the sample, and the mass of the core (plus the wax in the Phase 3 permeable samples) was determined in water. |
The following formula was used to calculate the density (specific gravity = SG):
| SG = | Mass in Air | = W |
| Mass in Air – Mass in Water | = V |
During Phase 3, a correction of 0.9*mass of wax was applied to waxed samples to account for the presence of the wax coating during measurement. All the information was recorded on density measurement sheets for the core.
The sampling database was maintained at the camp site and systematically backed up and incorporated in the Project database.
The average density for the carbonatite and non-carbonatite rocks is 2.76 g/cm3 and 2.64 g/cm3, respectively.
| 8.2 | Sample Analyses |
| 8.2.1 | Primary Laboratory |
Intertek-Genalysis Laboratory Services in Perth, Australia (Genalysis Australia), was the primary laboratory for the sample preparation and analysis of drillhole core and channel samples. Genalysis is an independent laboratory that performs geochemical analyses on a commercial basis. Genalysis has no relationship with Mkango or MKAR other than the provision of analytical services for a fee.
Genalysis is accredited by The National Association of Testing Authorities Australia (NATA) to operate in accordance with ISO/IEC 17025, which includes the management requirements of ISO 9001. The Perth facility is accredited in the field of chemical testing for the tests shown in the scope of accreditation issued by NATA (date of accreditation: 20 September 1991).
| S-K 1300 Technical Report Summary on the Songwe Hill REE Project | Page 139 of 489 |
| |
During Phases 1 and 2, the samples were prepared at Genalysis in Johannesburg prior to chemical analyses in Perth; during Phase 3, samples were prepared at Genalysis Australia. The Phase 1 and 2 procedures were the same as the procedures followed during the Phase 3 analysis, which are described below.
| ● | The samples were weighed and checked, and the job was registered on the laboratory information management system (LIMS). Any discrepancies between the samples received and the sample submission sheets were conveyed to Mkango and resolved immediately. |
| ● | After weighing the samples, if required, the material was dried in a drying oven at 110 °C for 8 h. |
| ● | The samples were crushed in a jaw crusher to ~ 10 mm. If a sample was > 3 kg, it was split through a riffle splitter to provide a 1.5 kg sub-sample. If the material was < 3 kg, then the entire sample was used. |
| ● | The samples were milled and pulverised in a swing mill to 85 % passing 75 µm. |
| ● | A portion of 150 g was split from the pulp material and submitted for assay. |
The samples were analysed in Perth, using digestion method FP6 and ICP-MS and inductively coupled plasma optical emission spectrometry (ICP-OES). The FP6 fusion digest ensures complete dissolution of the sample including the refractory mineral component. Each sample was weighed at 0.25 g, mixed with an alkaline flux (Na2O2), and placed in a nickel crucible. This was fused in a muffle with precautions to retain sulphur, and the fusion product was dissolved in hydrogen chloride (HCl). Once digestion was accomplished, the sample was diluted appropriately and analysed with an ICP-MS, ideally suited to the analysis of trace elements in the parts-per-million or parts-per-billion range.
For major element analysis, once digestion was accomplished, the sample was diluted appropriately and read on the ICP-OES. Calibration was effected using standard solutions of known concentration.
Corrections were made, where applicable, for emission line overlaps and scattered light, and the overall dilution and catch weights used in the digestion process. Internal standards were used to correct for drift, viscosity effects, and plasma fluctuations.
The analytical results were emailed to Mkango and MKAR in an MS Excel comma-separated values (.csv) file format, followed by the issuing of signed assay certificates in PDF format.
| 8.2.2 | Verification (Umpire) Laboratory |
Activation Laboratories Ltd (Actlabs) in Ancaster, Ontario, Canada, was selected as the umpire laboratory. Actlabs is an independent laboratory that performs geochemical analyses on a commercial basis. Actlabs has no relationship with Mkango or MKAR other than the provision of analytical services for a fee.
Pulps split from the original samples were provided to Actlabs directly from Genalysis. Actlabs employed lithium metaborate/tetraborate fusion as a digestion method with subsequent analysis by ICP and ICP-MS (Code 8-REE Assay Package Major Elements Fusion ICP (WRA)/Trace Elements Fusion ICP-MS (WRA4B2/OE)). A mass balance was required as an additional quality control technique to ensure elemental totals of the oxides between 98 % and 101 %. If samples contained > 0.3 % Nb2O5, then the ICP-MS technique was replaced by fusion XRF for Nb2O5 because ICP-MS results tend to be very low as a result of the Nb falling out of solution.
| S-K 1300 Technical Report Summary on the Songwe Hill REE Project | Page 140 of 489 |
| |
Actlabs’ quality system is accredited to international quality standards through ISO/IEC 17025 which includes ISO 9001 and ISO/TS 9002, with CAN-P-1758 (Forensics), CAN-P-1579 (Mineral Analysis) and CAN-P-1585 (Environmental) for specific registered tests by the Standards Council of Canada (SCC). Actlabs is also accredited by the National Environmental Laboratory Accreditation Conference (NELAC) Program and Health Canada.
The analytical results were emailed to Mkango in MS Excel format, followed by the issuing of signed assay certificates in PDF format.
| 8.3 | Sample Security and Dispatch |
Strict security protocols were employed for the handling of samples. All the samples were prepared and transported in such a manner that a secure and auditable chain of custody from the field to the laboratory was ensured.
Once an entire hole was sampled, the bagged and securely closed samples were placed in woven PVC bags, approximately 25 kg per bag. The drillhole number and corresponding sample numbers were recorded on the exterior of each bag. The bags were then stored inside locked and secured, company-owned, storage containers at the exploration camp until dispatch.
During Phases 1 and 2, samples were dispatched from the camp to Zomba for shipping to Johannesburg. Detailed procedures were documented in the 2015 NI 43-101 Technical Report (The MSA Group, 2015) and are summarised as follows:
| ● | All the samples submitted for analysis were accompanied by standard sample submission documents carrying sample details and analytical instructions. |
| ● | Woven bags containing the samples were transported by road using a contract commercial carrier to the company office in Zomba. Samples were physically accompanied from the exploration camp to Zomba by a senior geologist from Mkango’s exploration team. |
| ● | Upon receipt at Mkango’s office in Zomba, samples were inspected, weighed, and sealed by a senior geologist of the Malawian Geological Survey Department. A certificate of inspection, which was signed by the Director of the Malawian Geological Survey or his representative, was prepared and issued. The certificate of inspection contained the name of the rocks, exploration licence number, total number and weight of the samples inspected, estimated sample value, port of exit, and the name and address of the consignee. |
| ● | Samples were then delivered by a senior Mkango geologist to SDV Malawi Ltd (SDV) in Blantyre for shipment by commercial carrier South African Airlines (SAA) to Genalysis in Johannesburg. Samples were weighed by SDV and compared with the weights supplied by Mkango. In most cases, sample transport was timed so that samples proceeded directly from camp to Zomba and then to the carrier. In rare instances, where SDV was unable to receive the samples the same day, the bags were stored in a secure, locked room at Mkango’s offices in Zomba until they could be delivered to SDV. |
| ● | SDV was responsible for the shipment and tracking of the samples from Malawi to Genalysis in Johannesburg. All the shipping paperwork was sent to Mkango personnel, and once shipment was confirmed by SDV, notification along with sample submission sheets were emailed to Genalysis. |
| S-K 1300 Technical Report Summary on the Songwe Hill REE Project | Page 141 of 489 |
| |
| ● | When the sample batches were received by Genalysis, the sample numbers were checked and recorded, and a job number was assigned on the LIMS. Sample receipt verification was then emailed to Mkango staff, including the Chief Geologist. Following sample preparation, the samples were couriered by Genalysis to their analytical facilities in Perth. |
During Phase 3, samples were dispatched whole to Perth for sample preparation according to the following protocols:
| ● | All the samples submitted for analysis were accompanied by standard sample submission documents carrying sample details and analytical instructions. |
| ● | Approximately every two weeks, samples were expedited to the Bolloré Transport and Logistics Malawi Ltd (BTLM) company offices in Blantyre via a contracted truck. Each shipment was accompanied by a senior geologist, who supervised the transport and unloading of the samples in Blantyre. BTLM, supervised by a Mkango geologist, loaded the samples on pallets and wrapped them securely in plastic wrap for shipment to the laboratory in Perth. |
| ● | Upon receipt at the BTLM warehouse in Blantyre, samples were inspected, weighed and sealed by a senior geologist of the Malawian Geological Survey Department. A certificate of inspection, which was signed by the Director of the Malawian Geological Survey or his representative, was prepared and issued. The certificate of inspection contains the name of the rocks, exploration licence number, total weight of the samples inspected, estimated sample value, port of exit, and the name and address of the consignee. |
| ● | BTLM was responsible for the shipment and tracking of the samples from Malawi to Genalysis in Perth. All the shipping paperwork was sent to Mkango personnel, and once shipment was confirmed by BTLM, notification along with sample submission sheets were emailed to Genalysis. |
| ● | When the sample batches were received by Genalysis, the sample numbers were checked and recorded, and a job number was assigned on the LIMS. Sample receipt verification was then emailed to Mkango staff, including the Chief Geologist. |
| 8.4 | Quality Assurance and Quality Control |
Appropriate QA/QC monitoring is a critical aspect of the sampling and assaying process in any exploration programme. Monitoring the quality of laboratory analyses is fundamental to ensuring the highest degree of confidence in the analytical data and providing the necessary confidence to make informed decisions when interpreting all the available information. Quality assurance (QA) may be defined as information collected to demonstrate that the data used further in the Project is valid. Quality control (QC) comprises procedures designed to maintain a desired level of quality in the assay database. Effectively applied, QC leads to the identification and corrections of errors or to changes in the procedures that improve the overall data quality. Appropriate documentation of QC measures and regular scrutiny of QC data are important as a safeguard for Project data and form the basis for the QA programme implemented during exploration.
| S-K 1300 Technical Report Summary on the Songwe Hill REE Project | Page 142 of 489 |
| |
In order to ensure that quality standards are met and maintained, planning and implementation of a range of external QC measures are required. Such measures are essential for minimising uncertainty and improving the integrity of the assay database, and are aimed at providing the following:
| ● | An integrity check on the reliability of the data |
| ● | Quantification of accuracy and precision |
| ● | Confidence in the sample and assay database |
| ● | The necessary documentation to support database validation |
Mkango adopted an industry-standard QA/QC programme and inserted CRM and blanks, each at a frequency of 1 in 20 (5 %), into the batches prior to submission to Genalysis. These control samples were inserted as part of a continuous sample number sequence, and the QA/QC samples were not obviously different from routine samples after the pulverisation process.
In order to create the required 5 % duplicate samples, two protocols were followed. For approximately two in three sample duplicates, Genalysis was requested in the sample submission sheet to split the pulp of predetermined samples and insert the material into empty and pre-numbered bags, supplied by Mkango, together with the other samples. For approximately one in three sample duplicates, the core was quartered, and the two quarters were treated as field duplicates. This allowed for monitoring of the sample geological variation as well as the sample preparation procedure and the precision of the analyses.
An additional 3 % of the total samples was couriered by Genalysis to the umpire laboratory Actlabs. Hence, the overall number of control samples constituted approximately 21 % of the samples analysed, which is in line with best practice procedures to ensure the integrity of the data and is independent from the internal QA/QC methods applied by the laboratory.
Gaps in the sample sequence were left for CRMs, blanks and duplicates in the course of the sampling and bagging process conducted at the Songwe Hill camp. The CRMs and blanks were only packed after the main sampling process was completed to minimise the possibility that sample numbers would be inadvertently swapped between the routine and control samples.
The results of the QA/QC programme for Phases 1 and 2 are detailed in the 2015 NI 43-101 Technical Report on Songwe Hill (The MSA Group, 2015) and demonstrated that the data quality was acceptable for Mineral Resource estimation. Short summaries of the Phase 1, Phase 2 and Phase 3 QA/QC are given below.
| 8.4.1 | Phase 1 and Phase 2 Blank Samples |
The blank sample material used during the Phase 1 drilling programme was REE-barren Magaliesberg quartzite chips. During the Phase 2 campaign, AMIS0305 from African Mineral Standards (AMIS) and Magaliesberg quartzite were used. The blanks were inserted into the sample stream with a normal, sequential sample number. Slightly elevated REE concentrations in four blank samples from four separate batches were queried with Genalysis, which re-analysed the samples with acceptable results. No further action was taken or required, and the results of the blank analyses are interpreted to indicate that there was no contamination or systematic analytical issues during the period of sample submission and analyses.
| S-K 1300 Technical Report Summary on the Songwe Hill REE Project | Page 143 of 489 |
| |
| 8.4.2 | Phase 1 and Phase 2 Certified Reference Material |
For independent assessment of the accuracy of laboratory analyses, CRMs were inserted using a frequency of 5 % (1 in 20). CRMs comprised AMIS0185 and SARM 40 during the Phase 1 programme and AMIS0185 and Geostats GRE-04 during the Phase 2 campaign. The performance of the CRMs during the two phases was acceptable, and occasional values outside the recommended range have no material effect on the overall data quality. The REEs Tb, Dy, Gd and Y showed a systematic under-reporting for AMIS0185, which is not considered critical due to their very low concentration levels in this light rare earth standard.
| 8.4.3 | Phase 1 and Phase 2 Duplicates |
Duplicate samples were not used during the Phase 1 drilling programme. However, they were inserted during the channel sampling and Phase 2 drilling programmes at a rate of 1 in every 20 samples (5 % frequency) to assess the precision of the analyses. Duplicates were placed as an empty numbered bag into the sample stream. Samples were split at the laboratory following pulverisation, and the pulp of the sub-sample was inserted in the empty sample bag. The instructions on the sample submission sheet to Genalysis specified which samples were to be split for duplicates.
The duplicates indicate a very high level of precision except for three duplicate pairs where the problem was traced to a sample number issue at the laboratory. Genalysis re-analysed these samples with acceptable results, and no further action was taken or deemed necessary.
| 8.4.4 | Phase 1 and Phase 2 Umpire Laboratory samples |
In order to check the quality of the analyses from the primary laboratory, a duplicate of the pulps was sent by Genalysis to Actlabs. Umpire samples were sent at a frequency of approximately 5 % (1 in 20). The results of these analyses were plotted graphically against the original analysis. In two cases, the umpire results differed substantially from the primary data. This problem was subsequently rectified through re-analysis and attributed to a sample mix-up. The vast majority of the samples show a discrepancy between the two laboratories of less than 10 %, and less than 1 % of the 405 sample pairs exceeded 20 %.
| 8.4.5 | Phase 3 Blank Samples |
To monitor any contamination of the samples, a blank sample containing negligible REE concentrations was included in every 20 samples. The blank sample material was REE-barren Magaliesberg quartzite. The blanks were inserted into the sample stream with a normal, sequential sample number.
| S-K 1300 Technical Report Summary on the Songwe Hill REE Project | Page 144 of 489 |
| |
Significantly elevated REE concentrations were observed in a number of blank samples from four separate batches. These were queried with Genalysis, and 85 samples from a hole with highly anomalous blanks were re-pulverised and re-analysed. The results were identical to the original analyses, suggesting that any contamination was not sufficient to affect the assays of the core samples. No further action was taken or required, and the results of the blank analyses were interpreted to indicate that any contamination that may have occurred was not significant enough to affect the analysis of the samples. Examples of the four elements are shown in Figure 8.3.
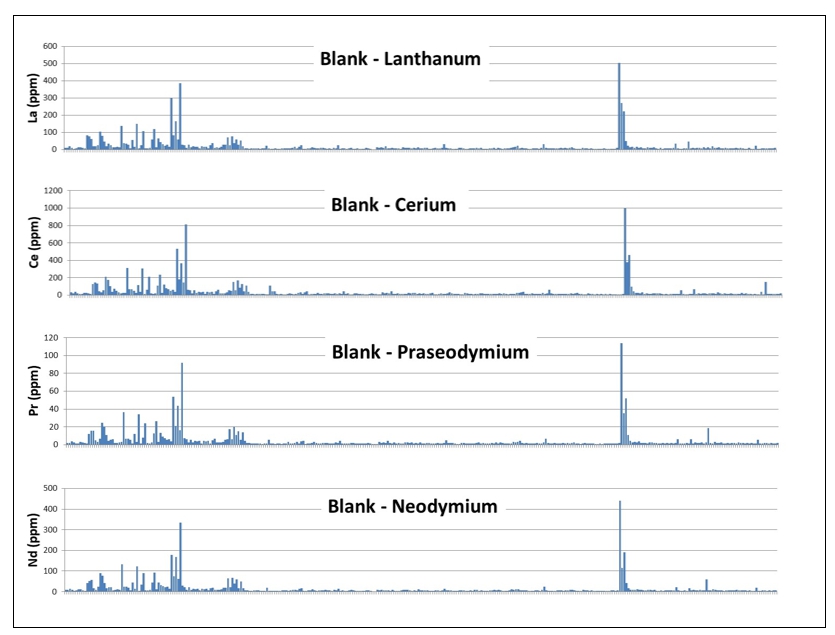
Source: Charts by Dr Scott Swinden (2018)
Figure 8.3: Performance of Selected Rare Earth Elements in 329 Blank Analyses
| S-K 1300 Technical Report Summary on the Songwe Hill REE Project | Page 145 of 489 |
| |
| 8.4.6 | Phase 3 Certified Reference Materials |
For independent assessment of the accuracy of laboratory analyses, CRMs were inserted at a frequency of 1 in 20 (5 % frequency). Each CRM was assigned a sample number within the normal sample sequence. CRMs comprised AMIS0185, AMIS0275 and AMIS0356. The performance of the CRMs was acceptable, and occasional values slightly outside the recommended range had no material effect on the overall data quality. Examples of four elements are shown in Figure 8.4 for one of the CRMs used.
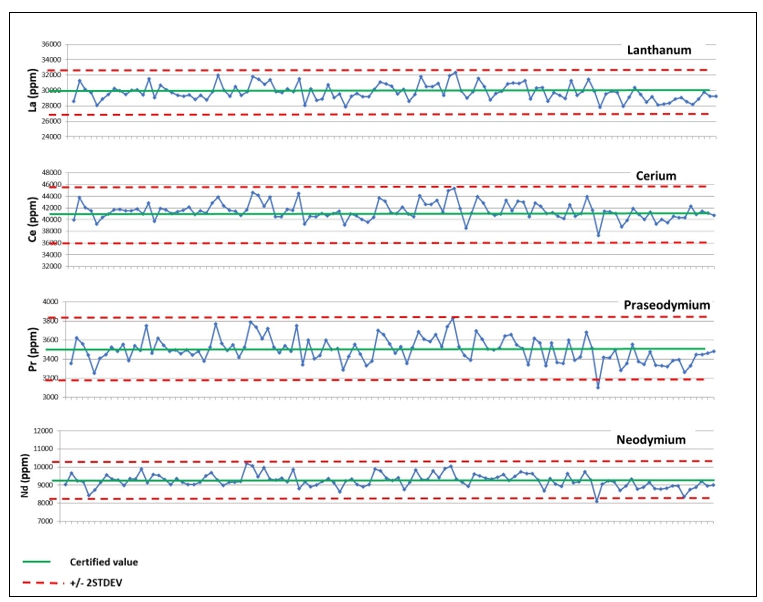
Source: Charts by Dr Scott Swinden (2018)
Figure 8.4: Accuracy of Selected Light Rare Earth Elements in 112 Samples of CRM AMIS0185
| S-K 1300 Technical Report Summary on the Songwe Hill REE Project | Page 146 of 489 |
| |
| 8.4.7 | Phase 3 Duplicate Samples |
The duplicates indicated a very high level of precision except for one duplicate pair in an early batch of analyses. Examples of the four elements are shown in Figure 8.5.
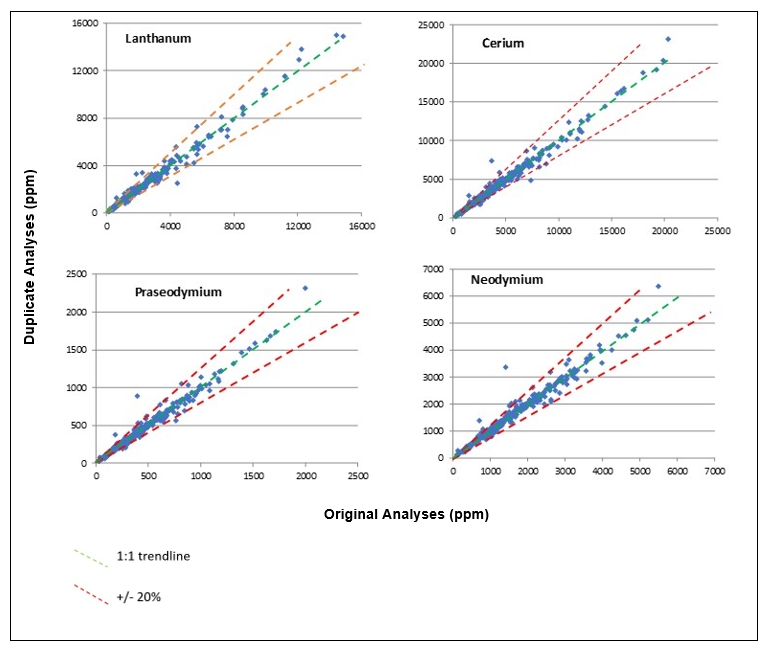
Source: Charts by Dr Scott Swinden (2018)
Figure 8.5: Repeatability of Selected Light and Heavy Rare Earth Elements in 337 Duplicate Sample Pairs (ppm)
| S-K 1300 Technical Report Summary on the Songwe Hill REE Project | Page 147 of 489 |
| |
| 8.4.8 | Phase 3 Umpire Sample Assays |
Check samples were sent to Actlabs to conduct analyses on 219 samples. The analyses of the umpire duplicate pairs were plotted graphically. The vast majority of the samples showed a discrepancy between the two laboratories of less than 10 %. Examples of the four elements are shown in Figure 8.6.
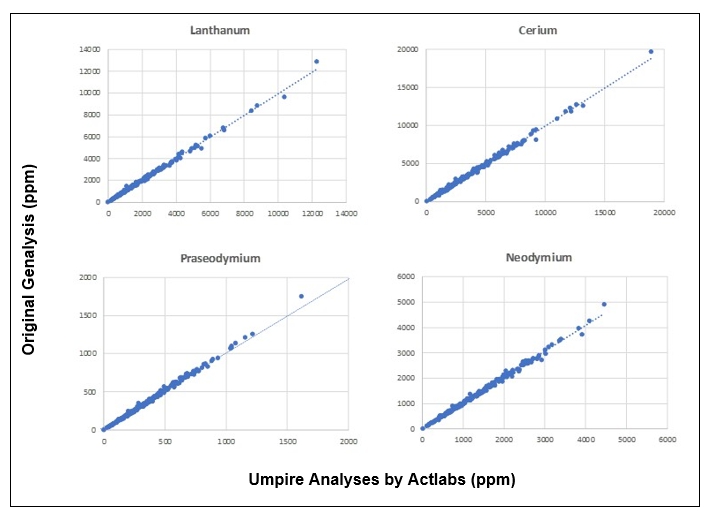
Source: Charts by Dr Scott Swinden (2018)
Figure 8.6: Repeatability of Selected Light and Heavy Rare Earth Elements Umpire versus Original Assay
| 8.5 | Adequacy of Sample Preparation, Security and Analytical Procedures |
All aspects of core handling, marking, logging, cutting, bagging, labelling and sample submission to the Genalysis preparation facilities in Johannesburg were covered by well-designed protocols to ensure that all the routine activities were conducted with maximum consistency and followed industry standards.
| S-K 1300 Technical Report Summary on the Songwe Hill REE Project | Page 148 of 489 |
| |
Mkango followed an auditable chain of custody, which ensured security and integrity of the results. The Swinden QP was satisfied that there was little or no opportunity for an outside agent to tamper with the sample material, and that the sampling and analytical procedures and number of QA/QC samples inserted into the sample stream were appropriate. The CRMs and blanks showed acceptable performance for the elements analysed over the period of the sampling campaign. The duplicate samples reported acceptable precision for all the relevant concentration levels.
The analytical results from the primary and the umpire laboratories showed a very good correlation and therefore confirm the element concentrations determined by the primary laboratory.
The QC procedures were effective in demonstrating the quality of the analytical results, and any issues that were identified were quickly dealt with and resolved.
Based on these results, it is the QP’s opinion that the sampling and assay data from the drilling and channel sampling programmes is acceptable for use in a Mineral Resource estimate.
| S-K 1300 Technical Report Summary on the Songwe Hill REE Project | Page 149 of 489 |
| |
| 9 | Data Verification |
The data verification processes that were completed for Songwe Hill are as follows:
| ● | The site was visited by the MSA QP from 25 to 28 July 2018 and from 24 to 26 September 2018. |
| ● | The data from more than 10 % of the assay certificates from the laboratory was checked against the database output. No errors were found. |
| ● | The drilling locations were observed at the site. |
| ● | The logging was examined in a selection of the Phase 3 drillholes and verified against observations made on the cores. In general, the logging was found to be reasonable. A recommendation was made to re-examine the logging with respect to the geochemistry in situations where the lithology is uncertain. |
| ● | The mineralisation in the cores for a selection of the Phase 3 holes was examined, and comparisons between the core observations and the sample assays were made. Clear relationships were noted between the assays and observations of the rock type and alteration. |
| ● | Check readings on the Phase 3 cores were taken by the QP using a handheld XRF. Although the results of this exercise are not definitive, the results served to verify the magnitude of the assayed grades. |
| ● | The assays completed by the primary laboratory (Genalysis Australia) were verified by re-assaying approximately 3 % of the pulp rejects at the umpire laboratory (Actlabs). The assays received from the two laboratories compared within reasonable limits. |
In the opinion of the QP, the data verification processes demonstrate that the database is adequate for the purpose of Mineral Resource estimation. There were no limitations imposed on the QP to conduct data verification.
| S-K 1300 Technical Report Summary on the Songwe Hill REE Project | Page 150 of 489 |
| |
| 10 | Mineral Processing and Metallurgical Testing |
Test work started on the Songwe Hill Project in 2010. Large amounts of test work have been completed over various test work campaigns, ensuring that the orebody and optimal processing routes are well understood. Surface grab samples, drill core samples from drilling campaigns, and bulk samples were collected from 2010 to 2020 and used to determine the optimal beneficiation and recovery processes for the Songwe Hill ore. Mineralogical analyses have indicated that the ore largely comprises carbonaceous gangue minerals, containing synchysite, apatite and florencite as main rare earth bearing minerals. The understanding of the ore has been of cardinal importance in developing optimised flowsheets for the beneficiation and recovery of rare earths.
The majority of the test work was conducted by ALS Perth Australia (ISO/IEC 17025 certified), SGS Perth (ISO/IEC 17025 certified) and ANSTO Perth (ISO/IEC 17025 certified). None of these entities have any interest in Mkango or MKAR.
This section gives a review of the test work done to date, as well as the major aims and findings that influenced decisions in the process design. There has been no additional test work conducted since 2020 to influence the process design.
| 10.1 | Early Test Work (2010 to 2018) |
Extensive test work was completed prior to the commencement of the 2022 DFS as disclosed in the Pre-Feasibility Study (PFS) report (The MSA Group, 2015) and other announcements.
| 10.1.1 | Mineral Processing and Metallurgical Testing Overview |
The Songwe Hill Project has undergone extensive mineral processing and metallurgical testing since 2010 to optimise the recovery of REEs.
| ● | Test work began in 2010 and continued until 2020, focusing on understanding the orebody and processing routes. |
| ● | Key minerals identified include synchysite, apatite, and florencite, with carbonaceous gangue minerals present. |
The various test work undertaken is listed below:
| ● | Early Test Work and PFS |
| ● | Test Work for DFS |
| ● | Mineralogical Analysis by ALS |
| ● | Flotation Testing by KYSPYmet |
| ● | Bulk Sampling and Variability Testing |
| ● | Ore Variability Test Work by ALS |
| ● | Grinding Solutions Comparison |
| ● | Pilot-Plant Test Work Overview |
| ● | Hydrometallurgical Test Work by ANSTO |
| ● | Rare Earth Leach and Solution Purification |
| ● | Rare Earth Carbonate Precipitation |
| ● | Solid-Liquid Separation and Tailings Testing |
| ● | Classification of Type 2 Material |
| S-K 1300 Technical Report Summary on the Songwe Hill REE Project | Page 151 of 489 |
| |
| ● | Geochemical Testing Overview |
| 10.1.2 | Early Test Work and PFS |
The initial test work laid the foundation for the Project’s development:
| ● | Extensive test work was completed from 2010 to 2018 before the DFS. |
| ● | Results were disclosed in the PFS report by The MSA Group in 2015. |
| 10.1.3 | Test Work for DFS |
Further optimisation and validation of the process design were conducted after the PFS. Additional test work was performed by Mkango to refine the process design. The results of this work are detailed in subsequent sections.
| 10.1.4 | Mineralogical Analysis by ALS |
ALS conducted mineralogical tests to support flotation flowsheet development:
| ● | In May 2018, ALS analysed a ROM ore sample labelled “Comp4” with a P80 of 53 μm. |
| ● | The sample was divided into four size fractions for analysis. |
| ● | Key findings included mineral abundances: florencite (0.73 wt%), synchysite (3.05 wt%), and apatite (5.05 wt%). |
| ● | Optimal liberation of rare earth minerals was found in the −20 μm size fraction, achieving approximately 80 % liberation. |
| 10.1.5 | Flotation Testing by KYSPYmet |
Flotation tests were conducted to establish effective upgrading parameters for rare earth minerals:
| ● | Various ore composites were generated for testing from the Measured Resource area. |
| ● | Tests established favourable flotation parameters, including grind size and reagent suites. |
| ● | Fine grinding and elevated temperature conditioning were effective for upgrading Type 1 mineralisation. |
| 10.1.6 | Bulk Sampling and Variability Testing |
Bulk sampling provided insights into the consistency of REE grades in the deposit:
| ● | 22 bulk samples totalling 60 t were collected from well-exposed outcrops. |
| ● | Flotation tests on composites indicated that iron oxides negatively affected flotation performance. |
| ● | Material types were classified into Type 1 and Type 2 based on Mn:Mg and Fe:Mg ratios. |
| 10.1.7 | Ore Variability Test Work by ALS |
ALS performed variability tests on samples to assess flotation performance:
| ● | 27 samples were analysed for TREO, Mn, Mg, and Fe concentrations. |
| S-K 1300 Technical Report Summary on the Songwe Hill REE Project | Page 152 of 489 |
| |
| ● | Most samples were classified as Type 1 ore, with only 7 as Type 2. |
| ● | Bench-scale flotation tests showed Type 1 samples achieved better grades and recoveries. |
The 27 variability samples exceed the minimum 21 samples required based on mineral resource of 21.03 Mt at 1.00% TREO cut-off grade of 23 January 2019.
Variability samples were generated from drill core samples in and around the area that is currently targeted by the mine plan. Samples were analysed for TREO, Mn, Mg and Fe concentrations.
The variability samples were all subjected to bench-scale flotation tests. The flotation circuit comprised a circuit representative of the current flotation design, starting with a sulphide pre-float and sulphide pre-float cleaner, followed by REO rougher flotation, REO cleaner flotation, and REO cleaner scavenger flotation to produce a final concentrate in the form of REO cleaner concentrate and REO cleaner scavenger concentrate. Samples were taken from the REO rougher cells and each of the REO cleaner cells, as well as the REO cleaner scavenger cell. Each intermediate sample was analysed for rare earth grade and recovery to construct sample grade/recovery curves. Sample grade and recovery data was used in conjunction with sample head compositions to evaluate the sample flotation performance as a function of sample compositions and elemental ratios.
| 10.1.8 | Grinding Solutions Comparison |
Comparison of grinding technologies was conducted to optimise energy consumption:
| ● | The IsaMill and stirred media detritor (SMD) were tested for fine grinding efficiency. |
| ● | The SMD consumed significantly less power (7.77 kWh/t) compared to the IsaMill (20.96 kWh/t). |
| 10.1.9 | Pilot-Plant Test Work Overview |
Pilot-plant operations were established to validate the flotation and hydrometallurgical processes:
| ● | The pilot plant was constructed by ALS in Perth and operated for approximately 5 d. |
| ● | A target recovery of > 70 % and grade of 15 % were achieved, with a 74.1 % recovery and a 15 % grade noted during piloting. |
The recoveries of various REOs from the concentrator pilot test work as conducted by ALS are indicated in Table 10.1.
Table 10.1: Recoveries from Concentrator Pilot Test Work
| Parameter | Unit | Value |
| La2O3 | % | 75.78 |
| Ce2O3 | % | 76.44 |
| Pr2O3 | % | 74.78 |
| Nd2O3 | % | 74.76 |
| Sm2O3 | % | 70.61 |
| Eu2O3 | % | 68.59 |
| Gd2O3 | % | 64.32 |
| Tb2O3 | % | 60.35 |
| Dy2O3 | % | 53.86 |
| Y2O3 | % | 47.88 |
| Ho2O3 | % | 47.40 |
| Er2O3 | % | 41.81 |
| Tm2O3 | % | 42.63 |
| Yb2O3 | % | 36.73 |
| Lu2O3 | % | 28.33 |
| S-K 1300 Technical Report Summary on the Songwe Hill REE Project | Page 153 of 489 |
| |
| 10.1.10 | Hydrometallurgical Test Work by ANSTO |
ANSTO conducted extensive hydrometallurgical test work to optimise rare earth extraction:
| ● | Bench-scale tests established optimal parameters for rare earth extraction and impurity rejection. |
| ● | Gangue leach performed optimally at pH 4 and elevated temperatures, with minimal REE dissolution (< 0.5 %). |
| 10.1.11 | Rare Earth Leach and Solution Purification |
The rare earth leach process was refined to enhance recovery and purity:
| ● | The leach was conducted at pH 2, with significant effects noted due to the type of sodium hydroxide used. |
| ● | Ion-exchange processes were developed to remove uranium and other impurities from the leach liquor. |
| 10.1.12 | Rare Earth Carbonate Precipitation |
Precipitation tests for rare earth carbonate products were successfully completed.
Over 99 % of rare earths were precipitated using ammonium bicarbonate, achieving an average of 46.6 % w/w TRE+Y in the filter cake.
The rare earth recoveries in the hydrometallurgy circuit are indicated in Table 10.2.
Table 10.2: Rare Earth Recoveries in the Hydrometallurgy Circuit
| Parameter | Unit | Value |
| La | % | 86.2 |
| Ce | % | 21.5 |
| Pr | % | 88.8 |
| Nd | % | 87.5 |
| Sm | % | 84.7 |
| Eu | % | 84.0 |
| Gd | % | 82.0 |
| Tb | % | 77.6 |
| Dy | % | 70.7 |
| Ho | % | 64.8 |
| Er | % | 57.4 |
| Tm | % | 52.6 |
| Yb | % | 50.4 |
| Lu | % | 52.7 |
| Y | % | 57.1 |
| S-K 1300 Technical Report Summary on the Songwe Hill REE Project | Page 154 of 489 |
| |
| 10.1.13 | Solid-Liquid Separation and Tailings Testing |
Solid-liquid separation tests were performed to optimise tailings management:
| ● | Metso-Outotec conducted thickening and filtration tests on flotation concentrates. |
| ● | Geotechnical and geochemical characterisations of tailings were performed to assist in the TSF design. |
| 10.1.14 | Classification of Type 2 Material |
The Type 2 material was tested for hazardous properties and found to be non-hazardous:
| ● | Type 2 material was sent to SGS in Perth for testing by KYSPYmet. |
| ● | Testing focused on acid generating capacity and radioactivity. |
| ● | The results indicated no hazardous leaching or geochemical behaviour. |
| ● | Type 2 material classified as non-hazardous, allowing for stockpiling without special provisions. |
| ● | Type 1 ore was also tested and classified similarly. |
| 10.1.15 | Geochemical Testing Overview |
A variety of samples were tested to assess their geochemical properties:
| ● | Testing commenced in April 2022 at SGS. |
| ● | Samples included gangue neutralisation precipitate, causticisation residue, and rare earth leach residue. |
| ● | Other samples tested were rare earth carbonate precipitation barren liquor, combined hydrometallurgical purification residue, and combined hydrometallurgical tails. |
| ● | Both Type 1 material and Type 2 material samples were included in the testing. |
| ● | Comprehensive results are documented in the SGS Tailings Geochemical Characterisation Report (SGS, 2022). |
| 10.2 | Test Work used for the 2022 DFS |
Subsequent to the PFS, further test work was conducted by Mkango to optimise and prove the process design. This test work is described in the sections below.
| 10.2.1 | ALS |
| 10.2.1.1 | Mineralogy |
In May 2018, ALS Minerals Division (ALS) reported on a series of mineralogical tests done on the run of mine (ROM) material at the request of KYSPYmet, a consultant approached by Mkango to assist with the flotation flowsheet development.
The ROM ore sample received by ALS was labelled “Comp4” (Composite 4) and was supplied at a P80 of 53 μm, and it was divided into the following four size fractions:
| ● | +53 μm |
| ● | 53 μm to 38 μm |
| ● | 38 μm to 20 μm |
| S-K 1300 Technical Report Summary on the Songwe Hill REE Project | Page 155 of 489 |
| |
| ● | −20 μm |
The test work aimed to determine the following:
| ● | Minerals and their concentrations in the ROM ore sample |
| ● | Grain size distribution data |
| ● | Elemental distributions |
| ● | Liberation information |
| ● | Particle images |
The test work indicated that there was no significant difference in mineral abundances between the size fractions. The mineral distributions are shown in Figure 10.1. The results given by ALS correlate well with prior analyses done by Mintek in 2012.
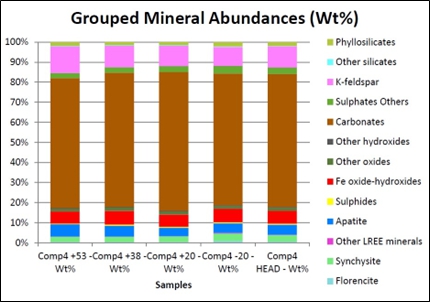
Figure 10.1: Mineral Abundances (ALS, 2018)
The significant rare earth bearing minerals and their abundance in the ROM sample were identified to be florencite (0.73 wt%), synchysite (3.05 wt%), and apatite (5.05 wt%). Other light rare earth bearing minerals were identified but were only present in 0.19 wt% of the bulk sample.
Rare earth mineral liberation was found to be the best for the −20 μm size fraction, reaching approximately 80 % liberation versus 23 % to 62 % liberation in the 38 μm to 20 μm size fraction. The degree to which liberation decreases in particle sizes larger than 20 μm indicated that optimal flotation and hydrometallurgical recovery of rare earths would only occur if particles were finely ground before processing.
| S-K 1300 Technical Report Summary on the Songwe Hill REE Project | Page 156 of 489 |
| |
| 10.2.1.2 | KYSPYmet Flotation (2018 to 2020) |
From the initial drilling campaign in the area of the Measured resource, various ore composites were generated for flotation testing and the development of a flotation regime for successfully upgrading the rare earth minerals.
KYSPYmet performed many tests on the composite samples. The tests were used to establish the favourable flotation parameters such as grind size, pulp density, pH, temperature, conditioning time and reagent suites, in addition to determining the optimal arrangement of pre-float/rougher/cleaner/scavenger flotation stages.
A combination of fine grinding and conditioning with collectors at elevated temperatures was shown to be effective in upgrading the primary ore type, Type 1 mineralisation, as discussed below.
| 10.2.1.3 | Geochemical, XRD and Flotation (2019 to 2020) |
Bulk sampling on site was concluded in October 2018 and produced 22 bulk samples totalling 60 t, taken from the Measured and Indicated resource areas. The samples were labelled BS001 to BS022.
The bulk samples were collected from outcrops to provide better information on the consistency of REE grades in the deposit and to provide material for metallurgical testing. The locations (BS01 to BS22) were identified where the carbonatite and “mixed rock” were well exposed and with minimal surface weathering, with exposure sufficiently prominent and next to roads/pads to allow access by a JCB tracked excavator. Approximately 2.7 t of rock was hammered out and collected at each location to make up a total of approximately 60 t. Only blocks of fresh rock were collected; any pieces with weathering rind or cavity walls were rejected.
Prior to the generation of the bulk samples, KYSPYmet had successfully developed a flotation regime for the Composite 4 and Composite 5 samples, both created from the drill core samples. The flotation concentrate achieved TREO grades of ~20 wt%. KYSPYmet completed initial test work on Composite 6, which was also generated from drill core samples, and the initial results from Composite 6 were poor. KYSPYmet proposed that this was due to the presence of iron oxides, such as hematite and magnetite, consuming the collector.
Further composites were made up from 20 of the 22 bulk samples sent from Malawi, categorised into grades (< 1 % TREO, 1 % to 1.5 % TREO, 1.5 % to 2 % TREO, > 2 % TREO) for the purposes of initial variability test work. Two low-grade samples were excluded because they were significantly below the likely cut-off grade of 1 % TREO (BS05 0.5 % TREO and BS07 0.64 % TREO).
The same issue experienced with Composite 6 was encountered in some of the other composite samples where the flotation performance for the 1.5 % to 2 % TREO and > 2 % TREO composites was significantly impacted potentially by iron oxides.
It was found that ore types could be generally grouped as ore with higher or lower Mn:Mg and Fe:Mg ratios. The ore was classified as Type 1 and Type 2 material. Type 1 ore had a lower Mn:Mg and Fe:Mg ratio and performed better in flotation testing. Type 2 material contained less magnesium and was more difficult to upgrade in flotation. Composites 4 and 5 correlated well with what was deemed to be Type 1 ore whereas Composite 6 correlated with the Type 2 material mineralogical profile.
| S-K 1300 Technical Report Summary on the Songwe Hill REE Project | Page 157 of 489 |
| |
Magnesium was incorporated into the block model, and sections and plans were generated to see if there was a coherent and continuous distribution of the Type 1 ore using the Mn:Mg ratio. This indicated a clear zone of such mineralisation along the western portion of the Songwe Hill deposit and overlying the lower Mn:Mg mineralisation in the south, illustrated in Figure 10.2.
The bulk samples are shown on the block model in Figure 10.2. The samples for the pilot scale test work largely correspond to the Type 1 ore zones, taking the TREO grade (> 1 %) and the Mn:Mg ratio into account, and are indicated as green points in Figure 10.2.
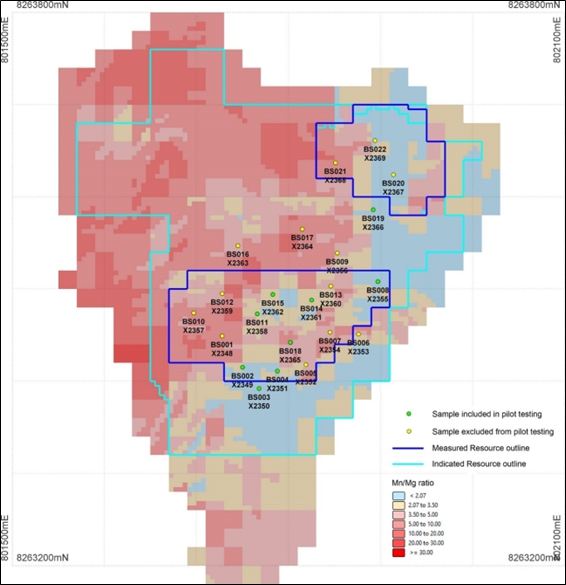
Source: Dr Paul Armitage, Mkango Resources
Figure 10.2: Bulk Sample Locations including Mn:Mg Ratios
| S-K 1300 Technical Report Summary on the Songwe Hill REE Project | Page 158 of 489 |
| |
| 10.2.1.4 | Ore Variability Test Work (ALS, 2022) |
ALS performed ore variability test work on 27 samples in addition to the composite sample that was used as feed for the pilot plant. Variability samples were generated from drill core samples in and around the area that is currently targeted by the mine plan. Samples were analysed for TREO, Mn, Mg and Fe concentrations. The majority of the samples were characterised as Type 1 ore samples, with only 7 samples out of 27 being characterised as Type 2 or “almost” Type 2 (within 20 %).
The variability samples were all subjected to bench-scale flotation tests. The flotation circuit comprised a circuit representative of the current flotation design, starting with a sulphide pre-float and sulphide pre-float cleaner, followed by REO rougher flotation, REO cleaner flotation, and REO cleaner scavenger flotation to produce a final concentrate in the form of REO cleaner concentrate and REO cleaner scavenger concentrate. Samples were taken from the REO rougher cells and each of the REO cleaner cells, as well as the REO cleaner scavenger cell. Each intermediate sample was analysed for rare earth grade and recovery to construct sample grade/recovery curves. Sample grade and recovery data was used in conjunction with sample head compositions in order to evaluate the sample flotation performance as a function of sample compositions and elemental ratios.
Figure 10.3 shows the combined grade/recovery curves for all the ore variability samples. It is evident that the Type 2 material performs poorly but the Type 1 ore samples that fall close to the Mn:Mg threshold ratio of 3.5 achieve a wide range of grades and recoveries. This indicates that there could be as yet undiscovered factors influencing performance, not only the Mn:Mg ratio.
| S-K 1300 Technical Report Summary on the Songwe Hill REE Project | Page 159 of 489 |
| |
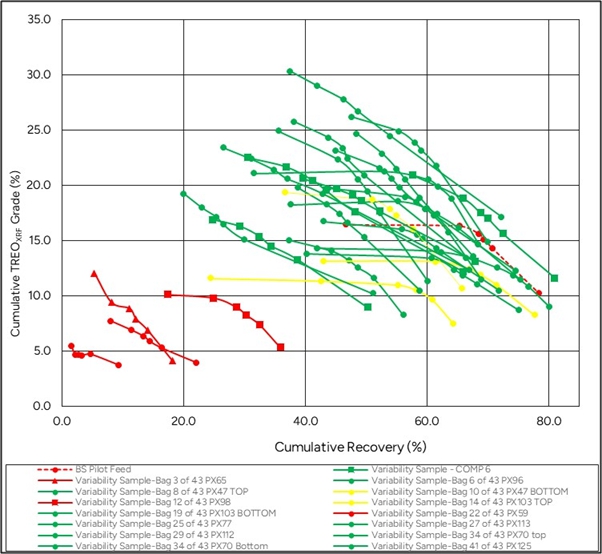
NOTE: Type 1 ore is green, and Type 2 material is red and yellow, with yellow close to the Type 1 ore threshold.
Figure 10.3: Variability Test Work Campaign – Combined Grade/Recovery Curves
Figure 10.3 shows that a 70 % TREO recovery and 15 % w/w grade in the flotation concentrate were achieved by the composite pilot plant feed sample and several other variability samples during the bench-scale tests that followed a pilot plant equivalent process flow. There could be several reasons for the variability in performance. The variability samples were all subjected to bench-scale flotation tests and not optimised. Flotation performances could improve significantly if the flotation regime was optimised for a more varied sample, for example,
| ● | Drill core samples classified as Type 1 could also have intersected areas identified as Type 2, which would have negatively impacted the overall flotation performance of that sample. |
| ● | The large-scale plant feed would be more homogenously blended, and the flotation regime could be optimised with relative ease to achieve the target flotation performance. |
| S-K 1300 Technical Report Summary on the Songwe Hill REE Project | Page 160 of 489 |
| |
| 10.2.2 | Grinding Solutions (2019) – IsaMill versus SMD Signature Plots |
Grinding Solutions performed sample preparation, crushing and rod milling to produce fine grinding feed material.
The material was milled in a horizontal fine grinding mill (IsaMill) and also in a vertical SMD. Both tests were conducted in an open-circuit arrangement to better compare performance. The feed material was milled to the target product size P90 of 20 μm.
The results showed that the SMD consumed significantly less power than the IsaMill to produce all the product size classes.
The power requirements for the IsaMill were 20.96 kWh/t and the SMD were 7.77 kWh/t.
| 10.2.3 | Keramos (2020) |
Keramos Metallurgical Services conducted test work in their CeramoStar ultra-fine grinding (UFG) metallurgical laboratory on ROM material with a P80 of 52.4 μm. Keramos performed batch testing in their small-scale SMD, which yielded results that correlated very well with earlier results produced by Grinding Solutions. For a target P80 of 20 μm, the specific grinding energy was 7.59 kWh/t.
| 10.2.4 | ALS Comminution and Flotation Piloting |
| 10.2.4.1 | Comminution |
ALS conducted test work to determine the following for each of the 22 bulk samples:
| ● | Unconfined Compressive Strength (UCS) |
| ● | Crushing Work Index (CWi) |
| ● | Abrasion Index (Ai) |
| ● | Bond Rod Work Index (BRWi) |
| ● | Bond Ball Work Index (BBWi) |
Table 10.3 shows the test work results for the composite sample used for flotation and hydrometallurgical piloting.
Table 10.3: Composite Pilot Feed Sample Characteristics
| Description | UCS (MPa) |
CWi (kWh/t) | Ai | BRWi | BBWi | |||
| Average | Standard Deviation |
Bulk
Density (t/m3) |
kWh/t | Bulk
Density (t/m3) |
kWh/t | |||
| Average of all samples | 45.56 | 12.42 | 3.64 | 0.0218 | 1.86 | 17.38 | 1.92 | 13.49 |
| 10.2.4.2 | Bench-Scale Flotation Test Work |
KYSPYmet supplied ALS with an optimised flotation flowsheet including reagent regimes, and conditioning and flotation conditions. Samples of the reagents were also provided to ALS for use in piloting.
| S-K 1300 Technical Report Summary on the Songwe Hill REE Project | Page 161 of 489 |
| |
ALS performed several bench-scale tests to confirm the process parameters and adjust certain conditions if deemed appropriate. A modified flowsheet was developed for the flotation pilot plant, decreasing the number of flotation cells and reagent dosing points, but retaining the conditioning and elevated temperature downstream of the sulphide pre-float. A comparison of the ALS bench-scale results and the KYSPYmet results is shown in Figure 10.4, and it is evident that the results are similar.
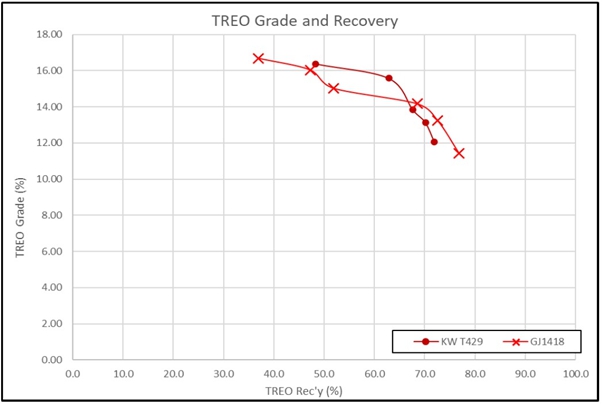
Figure 10.4: Modified Bench-Scale Test versus Optimised KYSPYmet Test
It was demonstrated that ALS could replicate and improve the optimised flotation performance developed by KYSPYmet’s bench-scale test work campaigns.
| 10.2.4.3 | Pilot Plant Test Work |
The pilot plant was constructed by ALS in Perth and initially aimed to stabilise grinding and regrinding circuits in order to consistently provide target feed size material to the flotation circuit. The float feed particle size achieved showed a good consistency around the target P80 of 20 μm.
The process comprised a sulphide pre-float, REO rougher flotation, REO scavenger flotation, REO cleaner flotation, and REO cleaner scavenger flotation.
The pilot plant was run for approximately 5 d, the first 2 d of which served as process stabilisation and tweaking of reagent dosages to obtain the optimal steady-state operation. After that, three surveys were performed to collect the performance data on the pilot plant for reporting.
| S-K 1300 Technical Report Summary on the Songwe Hill REE Project | Page 162 of 489 |
| |
During continuous piloting runs, the reagent addition was adjusted as required to achieve optimal grade and recovery, based on observations from the pilot plant.
Overall, the flotation piloting was successful in achieving and exceeding target recovery and grade for the composite sample fed into the flotation plant. There were process fluctuations of higher or lower than the target recovery and grade, but the overall mass balance indicates that the target of > 70 % recovery and 15 % grade is realistically achievable, with the 74.1 % recovery and 15 % grade achieved in piloting exceeding the bench-scale test work. The overall Survey 1 to Survey 3 grades and recoveries are shown in Figure 10.5. There is a slight difference between measured and estimated grade/recovery values, as in certain cases the measured data had to be adjusted to achieve a better overall balance. For Surveys 1 and 3, this was deemed to be insignificant, but slightly larger adjustments were required for Survey 2.
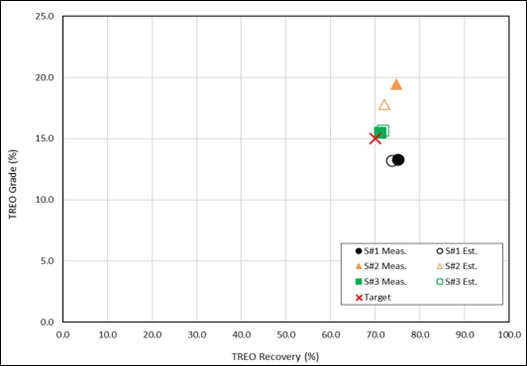
Figure 10.5: Overall Survey Grade-Recovery Plot (ALS, 2021)
| 10.2.4.4 | Site Water Testing |
In addition to comminution and flotation piloting, ALS tested the site water quality and the effect of site water on flotation performance. It was found that the use of site water impacted on the flotation, but the impact can be mitigated by modified process parameters.
| 10.2.5 | ANSTO Hydrometallurgical Test Work |
| 10.2.5.1 | Bench-Scale, Pre-Pilot and Piloting |
Since mid-2019, the Australian Nuclear Science and Technology Organisation (ANSTO) has conducted test work on the flotation concentrate produced by KYSPYmet while developing a flotation flowsheet. This section contains a brief description of the process that ANSTO refined and ultimately piloted. Numerous tests were done over a two-year span, optimising conditions for each unit operation in the hydrometallurgical plant.
| S-K 1300 Technical Report Summary on the Songwe Hill REE Project | Page 163 of 489 |
| |
Bench-scale test work was conducted to establish the optimal process parameters, focusing largely on the optimal extraction of rare earths and effective rejection of impurities that might impact rare earth recovery. Bench-scale test work was often conducted with synthetic liquors. After the bench-scale test work, step-through tests were conducted on consecutive processing operations using material from the previous test in the next, and so forth. This further refined the conditions and target reagent consumptions, rare earth extractions, and impurity levels.
Following the step-through tests, the pilot plant design criteria were generated to upscale the process to continuous piloting. In many cases, bench-scale test work, step-through test work and piloting overlapped, as various unit operations were tested in parallel.
| 10.2.5.2 | Gangue Leach |
Gangue leach was found to perform optimally at an elevated temperature and a pH of 4. This led to maximum impurity removal and mass loss whilst retaining rare earths in the residue and minimising acid consumption. Gangue leach and hydrochloric acid regeneration are integrally connected, and conditions were optimised to produce an HCl stream of 10 wt% to 12 wt%.
The extraction of elements associated with gangue minerals is a good indicator for the success of the gangue leach. At the pH, temperature and residence time used in gangue leach, the dissolution of REEs has been shown to be almost zero. The extraction of REEs during the pilot run was shown to remain below 0.5 %, and the overall mass loss was approximately 37 %.
| 10.2.5.3 | Gangue Leach Liquor Neutralisation |
Gangue leach liquor is high in calcium and chloride, along with other impurities. The gangue leach liquor stream is sent to HCl regeneration, but impurity build-up in the recycle loop would be detrimental to the leaching performance. Therefore, gangue leach liquor is dosed with hydrated lime slurry, increasing the pH and decreasing the solubility of impurity metal salts, which precipitate and are filtered out. Lime addition in the pilot plant was controlled to maintain the pH of the slurry at 10.
During the piloting run, the neutralised and filtered gangue leach liquor was shown to have assays for Fe, Mg and Mn of below 5 mg/L and below 6 g/L for Sr. Lime consumption appeared to level off at approximately 17 kg Ca(OH)2/m3 of feed solution.
| 10.2.5.4 | Hydrochloric Acid Regeneration |
The optimal regeneration of hydrochloric acid is imperative to the performance of the gangue and rare earth leaches and to the operating cost (OPEX) of the Project. Acid regeneration must be operated such that acid is not lost to the gypsum filter cake but is also of high enough concentration and purity to be used in the leaches. Sulphuric acid is added stoichiometrically to ensure sufficient acid production for the gangue and rare earth leaches. Calcium chloride is added to minimise the residual calcium and sulphate in solution by precipitating the maximum amount of gypsum.
The pilot plant data showed that a combined liquor (filtrate and wash) acid concentration of 14 wt% HCl to 16 wt% HCl could be achieved. This is a good result, albeit a slight deviation from the target. This shows that regenerating acid is effective, and a higher concentration than the design concentration could potentially be produced which could be decreased by dilution, the preferred alternative to evaporation for an acid solution of too low concentration. Residual calcium in the regenerated acid stabilised at below 5 g/L and was trending downward by the end of the piloting run.
| S-K 1300 Technical Report Summary on the Songwe Hill REE Project | Page 164 of 489 |
| |
| 10.2.5.5 | Caustic Conversion |
Gangue leach residue is contacted with concentrated NaOH solution at a high temperature in order to convert rare earth fluorides and phosphates to hydroxides that are amenable to leaching with hydrochloric acid in the downstream rare earth leach. Hot caustic solution resulting from the caustic conversion is diluted with hot water to prevent the precipitation of sodium salts before filtration as entrained sodium salts in the conversion cake are deleterious to cerium oxidation and rare earth leach. Precipitation of sodium salts after conversion also removes sodium from the NaOH regeneration circuit, leading to increased fresh NaOH requirement. The performance of the caustic conversion and dilution stage is measured by the rare earth extraction in the rare earth leach.
With synthetically regenerated acid in the rare earth leach, extractions of neodymium appeared stable at approximately 90 %, but with the switch to acid regenerated from the gangue leach pilot liquor, the recoveries decreased. This is an area for optimisation, as ANSTO has reported that the mechanism for decreased extraction is not well understood. The decrease in neodymium extraction also coincided with the recycling of regenerated NaOH to the caustic conversion process, which may also be responsible for the decrease in Nd recovery in the rare earth leach, as it is suggested that less pure NaOH might not offer optimal conversion of the rare earth minerals in caustic conversion.
| 10.2.5.6 | Caustic Conversion Repulp Wash |
To aid in the water balance and maximise washing of the caustic conversion residue, the conversion residue is repulped with overflow solution and filtrate from the final repulp wash in a countercurrent wash circuit. The conversion residue is repulped and filtered twice: first with overflow solution from the subsequent repulp stage, thickened and filtered, and then repulped a second time with hot wash water, at which time air is sparged through the slurry. The air oxidises cerium to an optimal degree for rejection during the rare earth leach. As with caustic conversion, the performance of the cerium oxidation is measured by cerium extraction in the rare earth leach.
| 10.2.5.7 | Rare Earth Leach |
The rare earth leach is more acidic than the gangue leach, with the goal of dissolving rare earth minerals that are naturally amenable to leaching, and also those that have been converted in the caustic conversion process. The pH is held at 2 under ambient temperature. During the test work, a sulphuric acid leach was considered and tested but rejected as an option because additional downstream processing was required to achieve the same rare earth recoveries as the HCl process.
Using synthetic sodium hydroxide solution versus plant-recycled sodium hydroxide solution in the caustic conversion appeared to have a significant impact on the extraction of REEs in the leach. This has been identified as an area that can be optimised.
| S-K 1300 Technical Report Summary on the Songwe Hill REE Project | Page 165 of 489 |
| |
| 10.2.5.8 | Caustic Evaporation |
Diluted caustic conversion liquor is fed to an evaporator to increase the concentration of sodium hydroxide from approximately 14 wt% to 33 wt% NaOH. In the full-scale plant, a multiple-effect evaporator plant run on saturated steam with mechanical vapour recompression has been costed. On the pilot plant, two pan boilers were used, alternating every 8 h. The solution was heated up in batch mode. The feed and discharge NaOH concentrations were monitored by titration. After evaporation, the solution was cooled down to drive the precipitation of sodium fluoride and sodium carbonate salts from the available fluoride and carbonate in solution. The residue was filtered and treated in a causticisation circuit to recover the sodium and regenerated sodium hydroxide.
The pilot plant data showed successful evaporation of moisture to reach > 33 wt% NaOH in solution and produce a hot solution with 1 wt% to 1.5 wt% dissolved Na2CO3. After cooling and filtration, approximately 90 % of the sodium carbonate was rejected from the solution, as well as > 90 % of the fluoride and sulphur, indicating the formation of sulphide salts as well.
| 10.2.5.9 | Causticisation |
Solids precipitated in caustic evaporation were digested with water and contacted with hydrated lime slurry to produce calcium salts and NaOH. The precipitated solids were filtered and washed before being discarded as waste, and the resulting filtrate and wash liquor were returned to the caustic evaporator. Water balance in the caustic circuit is critical, as any excess water will inevitably end up in the evaporator and consume large amounts of energy to be evaporated. Bench-scale test work indicated that the NaOH, F and Na2CO3 targets in the filtrate should be approximately 14 wt%, 5 wt% and 1.5 g/L, respectively.
During the pilot run, concentrations of sodium hydroxide, sodium carbonate and fluoride were erratic but appeared to stabilise at slightly below-target values. This is advantageous from an impurity perspective but means that the evaporator will consume more energy due to the lower NaOH than the design value. This is an area that can be optimised in conjunction with the rare earth leach to improve rare earth recoveries. Causticisation removed > 90 % of the fluoride but struggled to reach the 70 % target for Na2CO3 removal, achieving only approximately 30 %.
| 10.2.5.10 | Rare Earth Solution Purification |
Uranium and thorium, present in the ore, follow the REEs to the rare earth leach liquor, and must be removed to prevent them from being concentrated in the final product. Bench-scale and pilot-scale test work has been completed on the process, and a process design has been developed. Preliminary testing indicated a potential process for removing radium and other metals from the rare earth leach liquor. Radium is removed by adding barium chloride and sulphuric acid or calcium sulphate as a source of sulphate. Radium precipitates in the matrix of barium sulphate and can be removed.
Liquor from the radium removal tests still contained lead and zinc, and the addition of NaOH to slightly increase the pH to 4.7, along with the addition of 0.1 g Na2S/L feed, precipitated > 59 % of the lead and > 91 % of the zinc still present in the solution.
Uranium was not precipitated with radium or lead and zinc, and it must be removed from the solution with an ion-exchange process. As part of the 2022 DFS, solution properties were conveyed to the supplier of ion-exchange plants, and an ion-exchange plant was costed and included in the current design.
| S-K 1300 Technical Report Summary on the Songwe Hill REE Project | Page 166 of 489 |
| |
| 10.2.5.11 | Rare Earth Carbonate Precipitation |
ANSTO completed bench-scale test work on the precipitation of a rare earth carbonate product by the addition of ammonium bicarbonate to the purified pregnant leach solution (PLS) stream, increasing the pH to 6.7. Batch tests were completed to establish processing parameters. In the batch tests, 100 g/L NH4HCO3 solution was added to the PLS to incrementally increase the pH. Test work indicated that > 99 % of the rare earths could be precipitated with excellent rejection of Mn, Sr, Ca and Ba. This was used as the basis of design for the precipitation of the rare earth carbonate product, which is a straight-forward process if a pure enough feed solution is used.
Upon completion of bench-scale test work, four rare earth carbonate precipitation piloting runs were completed using ammonium bicarbonate. The precipitation of rare earths was greater than 99 %. Washed rare earth carbonate filter cake samples contained an average of 46.6 % w/w TRE+Y.
| 10.2.6 | Solid-Liquid Separation Test Work |
| 10.2.6.1 | Concentrator Plant |
During the flotation piloting, Metso-Outotec was commissioned to perform thickening and filtration test work on the flotation concentrate, and thickening test work on the flotation tails.
Outotec used a Larox® membrane filter press (MFP) to determine the filtration behaviour of the flotation concentrate.
| 10.2.6.2 | Hydrometallurgical Thickening Test Work |
ANSTO commissioned Fremantle Metallurgy to perform thickening test work on the hydrometallurgical slurry samples in May 2021. Cylinder settling tests were performed to determine the optimal thickening conditions, followed by dynamic thickening tests to obtain the data for equipment sizing.
| 10.2.6.3 | Hydrometallurgical Filtration Test Work |
ANSTO commissioned GBL Process Pty Ltd to perform filtration test work on the thickened samples supplied by Fremantle Metallurgy. The following eight slurries were tested (shown with their abbreviations as used in the report):
| · | Gangue Leach Slurry (GLS, G) |
| · | Gangue Leach Neutralisation Slurry (GLN, N) |
| · | Acid Regeneration Slurry (ARS, A) – Vacuum filtration was deemed to be more appropriate, and a vacuum belt filter was sized and costed. |
| · | Caustic Conversion Slurry (CC, CC) |
| · | Caustic Conversion Repulp Wash 1 and 2 Slurries (CCRW1/2, CR1,2) |
| · | Evaporation Slurry (ES, E) |
| · | Causticisation Slurry (CS, C) |
| · | Rare Earth Leach Slurry (RE, RE) |
| S-K 1300 Technical Report Summary on the Songwe Hill REE Project | Page 167 of 489 |
| |
| 10.2.6.4 | Tailings Geotechnical Test Work |
SENET contacted Western Geological Laboratory Services (WGLS) in February 2021 with a scope of work to geotechnically characterise the flotation and hydrometallurgical plant tailings streams. The purpose of this test work was to assist in the design of the TSF. The original scope of testing, as was received from the TSF contractor (Epoch), is given below:
| · | Drained and undrained settlement tests – at a tailings slurry solids content of 55 % w/w |
| · | Particle size distribution |
| · | Atterberg limits |
| · | Specific gravity determinations |
| · | Consolidation tests with oedometer |
| · | Consolidated undrained triaxial tests, with pore water pressure measurements |
| · | Flexible wall triaxial permeability tests |
During the operation of the flotation and hydrometallurgical pilot plants in 2021, samples were generated, and the scope was further refined to include more detailed rheology test work for the purposes of finalising the design of the pumping and distribution system in the TSF. Correspondence between WGLS and Epoch amended the initial quotation and scope of work to include additional viscosity and yield stress characteristics as a function of slurry solids content, and also shear stress versus shear rate for a range of slurry solids concentrations. For the purposes of the additional rheology test work, a combined tailings sample was dried and repulped to three different solids concentrations: 45 % w/w, 55 % w/w and 65 % w/w.
Samples were provided to WGLS by ALS (flotation tails) and ANSTO (hydrometallurgical plant tails). These samples were mixed in the approximate mass ratios that they were produced in during piloting and predicted by the SENET mass balance.
The combined processing plant tailings stream comprised primarily flotation tails, mixed with relatively smaller quantities of hydrometallurgical plant impurity solids and residues. Samples used in the mixing and generation of a combined tails sample were the following:
| · | Gangue leach neutralisation precipitate |
| · | Causticisation residue |
| · | Rare earth leach residue |
| · | Flotation tails |
The other hydrometallurgical waste streams were not deemed to have a large enough relative production rate to influence the characteristics of the combined tailings slurry to a significant degree; therefore, they were excluded from the combined sample.
The combined sample was found to exhibit shear-thinning behaviour within the range of solids concentrations tested. The complete set of test work results can be found in the WGLS Tailings Geotechnical Characterisation Study (Lebbos, 2022).
| S-K 1300 Technical Report Summary on the Songwe Hill REE Project | Page 168 of 489 |
| |
| 10.2.6.5 | Tailings Geochemical Characterisation |
SENET contacted SGS in April 2021 to perform geochemical analyses on separate and combined waste samples from the Songwe Hill processing plant. The environmental consultant provided the desired outputs from the test campaign for each sample where applicable – some samples were in liquor form already. The outputs provided by the environmental consultant are given in Table 10.4.
Table 10.4: Geochemical Testing Parameters
| General | ||
| Paste pH | ||
| ABA (Acid-Base Accounting) | ||
| NAG (Net Acid Generation) | ||
| Sulphur specification | ||
| Mineral composition | ||
| Reagent
(Distilled Water) Extraction |
Total
Element Analysis Using Aqua Regia (Total Digestion) |
Synthetic
Precipitation Leaching Procedure (SPLP) Leach Testing |
| pH | pH | pH |
| EC (Electrical Conductivity) | EC | EC |
| Alkalinity | Alkalinity | Alkalinity |
| Sulphate | Sulphate | Sulphate |
| Chloride | Chloride | Chloride |
| Fluoride | Fluoride | Fluoride |
| Nitrate | Nitrate | Nitrate |
| ICP-OES metal scan | ICP-OES metal scan | ICP-OES metal scan |
It became relevant to determine whether the Type 2 material should be classified as hazardous or non-hazardous in terms of acid generating capacity and radioactivity, and a sample of Type 2 material was received by SGS in Perth sent by KYSPYmet, which was still busy testing flotation regimes on the Type 2 material. The Type 2 material was tested, and the results were sent to the environmental consultant to interpret. The Type 2 material exhibited no hazardous leaching or geochemical behaviour and was classified as non-hazardous. Testing was also performed on the Type 1 ore, which led to the same conclusion. This indicated that both Type 1 and Type 2 material could be stockpiled without the need to make provision for hazardous leaching or weathering products.
After waste samples had been generated from the hydrometallurgical piloting campaigns, test work commenced at SGS. In April 2022, SGS started to report the first geochemical results. The following samples were tested:
| · | Gangue neutralisation precipitate |
| · | Causticisation residue |
| · | Rare earth leach residue |
| · | Rare earth carbonate precipitation barren liquor |
| · | Combined hydrometallurgical purification residue |
| S-K 1300 Technical Report Summary on the Songwe Hill REE Project | Page 169 of 489 |
| |
| · | Combined front- and back-end hydrometallurgical tails |
| · | Type 2 material sample |
| · | Type 1 ore sample |
The complete test work results and individual test work reports are provided in the SGS Tailings Geochemical Characterisation Report (SGS, 2022).
| 10.3 | QP Opinion |
It is the opinion of SENET, responsible and acting as the QP for the Songwe Hill process plant, that the metallurgical testing undertaken in support of the process design is at a level that meets the requirements for an DFS and represents good industry practice.
| S-K 1300 Technical Report Summary on the Songwe Hill REE Project | Page 170 of 489 |
| |
| 11 | Mineral Resource Estimates |
The Mineral Resource was estimated using the Canadian Institute of Mining, Metallurgy and Petroleum (CIM) Estimation of Mineral Resources and Mineral Reserves Best Practice Guidelines (2019) and is reported in accordance with the S-K 1300 definitions, which are consistent with the CIM Definition Standards for Mineral Resources and Mineral Reserves (CIM, 2014).
It should be noted that Mineral Resources are not Mineral Reserves and do not have demonstrated economic viability.
The Mineral Resource was originally reported with an effective date of 23 January 2019. Since then, various studies have been completed that have affected the assumptions used to demonstrate reasonable prospects for economic extraction. An updated Mineral Resource statement has been issued with an effective date of 30 June 2025 in order to incorporate the revised assumptions; however, as no exploration drilling or other mining activity has been completed since 2018, the block model used to report the 23 January 2019 Mineral Resource remains valid.
| 11.1 | Mineral Resource Estimation Database |
The database used for the Mineral Resource estimate consists of the following:
| · | Information from diamond drillholes: |
| o | Collar surveys. |
| o | Down-the-hole surveys. |
| o | Sampling and assay data. |
| o | Specific gravity (SG) measurements. The Phase 3 SG measurements were measured after wax was applied, and the Phase 1 and 2 SG measurements were originally measured without wax and later remeasured in 2018 using wax. The final SG measurements used for estimation were the waxed sample data. |
| o | Geology logs |
| · | A DTM based on a high-resolution LiDAR survey. |
The principal sources of information used for the estimate include raw data generated during the exploration drilling programme conducted by Mkango in three phases (2011, 2012, and 2018). The Mineral Resource estimate was based on individual REE core sample assays, and density measurements taken on drillhole cores. Other attributes not deemed critical for the reporting of the Mineral Resource were estimated, including thorium, uranium calcium, iron, manganese, aluminium, silica and potassium based on assays from the diamond drillhole cores.
The cut-off date for inclusion of data into this estimate was 1 December 2018, at which time there were no outstanding drilling data. To the QP’s knowledge, no additional resource evaluation drilling has been undertaken since then.
| S-K 1300 Technical Report Summary on the Songwe Hill REE Project | Page 171 of 489 |
| |
| 11.2 | Exploratory Analysis of the Raw Data |
| 11.2.1 | Attributes |
The dataset examined consisted of sampling and logging data from diamond drillholes. The following attributes are of direct relevance to the estimate:
| · | Oxides of REEs: yttrium (Y2O3), lanthanum (La2O3), cerium (Ce2O3), praseodymium (Pr2O3), neodymium (Nd2O3), samarium (Sm2O3), europium (Eu2O3), gadolinium (Gd2O3), terbium (Tb2O3), dysprosium (Dy2O3), holmium (Ho2O3), erbium (Er2O3), thulium (Tm2O3), ytterbium (Yb2O3) and lutetium (Lu2O3), all in parts per million. |
| · | Aluminium (Al), potassium (K), silica (Si), calcium (Ca), iron (Fe) and manganese (Mn) expressed as percentages. |
| · | Thorium (Th) and uranium (U) in parts per million. |
| · | SG measurements |
The complex fenitisation and carbohydrothermal overprinting and small-scale (less than the sample length in some instances) lithological variation associated with the Songwe Hill mineralisation makes it difficult to accurately distinguish the different rock types through visual assessment. Accordingly, the lithologies were split into two categories (domains): carbonatite and non-carbonatite. A threshold of 15 % Ca was applied to discriminate the two domains, with carbonatite defined as > 15 % Ca and non-carbonatite as < 15 % Ca. Given the relationship between calcium grade and REE grade, the coding of the data into carbonatite and non-carbonatite resulted in a reasonable separation between high- and low-grade samples, consistent with the expected macro geology.
| 11.2.2 | Validation of the Data |
The validation process consisted of the following:
| · | Examining the sample assay, collar survey, down-hole survey and geology data to ensure that the data were complete for all the drillholes. |
| · | Examining the de-surveyed data in three dimensions to check for spatial errors. |
| · | Examining the assay and density data in order to ascertain whether they were within expected ranges. |
| · | Checking for from-to errors, to ensure that sample intervals did not overlap and that there were no unexplained gaps between samples. |
The data validation exercise revealed the following:
| · | Core recovery was 85 % on average across all drillholes, with cavities accounting for 2.5 % of the drilled length. |
| · | Sufficient density measurements were completed, although wax was not always used for the Phase 1 and Phase 2 samples. |
| · | There were no unresolved errors relating to missing intervals or any overlaps in the drillhole logging data. |
| · | No default values, except for detection limit data, were found. |
| · | Examination of the drillhole data in three dimensions showed that the collars of the drillholes surveyed by DGPS ´were plotted in their expected positions relative to the drilling pads and the topographic surface derived from the LiDAR survey. |
| · | No errors were found when checking extreme assays. |
| S-K 1300 Technical Report Summary on the Songwe Hill REE Project | Page 172 of 489 |
| |
| 11.2.3 | Statistics of the Sample Data |
A total of 12,953 assayed sample intervals is recorded in the Mkango database, which contains values for all the attributes described in Section 11.2.1, except for 77 intervals not containing thorium assays.
The two most frequent sample lengths are 1 m and 2 m, with 95 % of the sample lengths measuring 2 m or less.
The sample data were examined to understand the general grade distribution. The log cumulative frequency plots (see Figure 11.1) show that 75 % of the samples in the carbonatite domain have grades higher than 1 % TREO, while only 22 % of the samples in the non-carbonatite domain have grades higher than 1 % TREO.
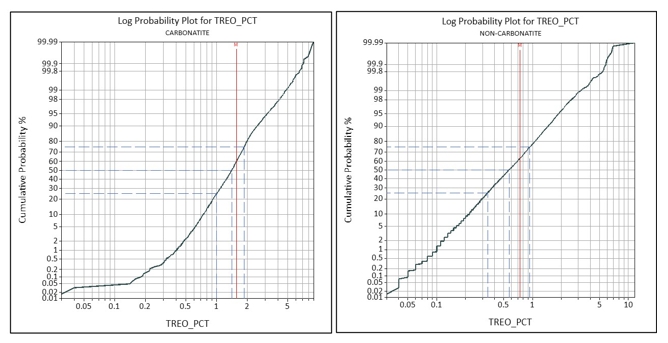
Figure 11.1: Log Cumulative Frequency Plot of the Sample TREO Grade Data
Scatterplots were generated to compare the grades of each variable to understand any relationships that may exist in the data and which should be preserved in the Mineral Resource estimate. There is a strong linear relationship between the grades of certain REEs. Each REE has a strong linear relationship with at least one other REE.
In summary, the exploratory analysis of the data revealed the following:
| · | The database is robust. |
| · | Most sample lengths are 2 m or less, with nominal sample lengths of either 1 m or 2 m. |
| · | Generally, the best mineralised lithologies are carbonatite dominant. |
| · | The threshold of 15 % Ca is appropriate to separate the high-grade samples from the lower-grade samples. |
| · | There is a strong relationship between individual REEs, which should be considered during estimation. |
| S-K 1300 Technical Report Summary on the Songwe Hill REE Project | Page 173 of 489 |
| |
| 11.3 | Geological Modelling |
| 11.3.1 | Topography |
Mkango completed a LiDAR survey, providing an accurate model of the topography. The processed data was provided by Mkango as a DTM (see Figure 11.2). A LiDAR survey is considered one of the most accurate remote methods to survey topography.
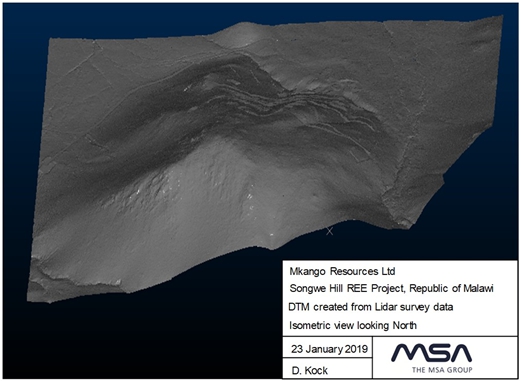
Figure 11.2: Isometric View of the DTM Created from the LiDAR Survey Data – View is Approximately to the North
| 11.3.2 | Mineralised Zones |
The raw drillhole data, coded as carbonatite or non-carbonatite using the 15 % Ca threshold, were modelled using Leapfrog Geo to attempt to create a carbonatite volume to constrain the higher-grade mineralisation. On querying the drillhole data within the model, it was found that 75 % of the data in the model was coded as carbonatite material and the other 25 % as non-carbonatite material. This created a mixed statistical REE grade distribution, which is not an ideal situation for grade estimation and hence an indicator approach was taken
| 11.3.2.1 | Oxidation/Weathering Surfaces |
An approximate overburden surface was modelled from the drillhole data using Leapfrog Geo to determine the amount of unconsolidated material overlying the fresh rock. Fresh rock tends to occur close to the surface at Songwe Hill and in some cases hard relatively unweathered rock outcrops on the hill.
| S-K 1300 Technical Report Summary on the Songwe Hill REE Project | Page 174 of 489 |
| |
| 11.4 | Statistical Analysis of the Composite Data |
Most of the sample lengths are less than 2 m, and therefore the samples were composited to 2 m using length weighting. No minimum length was applied. Compositing was done by domain (carbonatite or non-carbonatite) to avoid mixing the data.
The carbonatite and non-carbonatite coded sample intervals were de-clustered to a cell size of 20 mX by 20 mY by 5 mZ, and summary statistics were compiled for each mineralised zone (see Table 11.1).
Table 11.1: Summary Statistics (De-Clustered) of the 2 m Composite Data
| Variable (Unit) | Number of Composites | Minimum | Maximum | Mean | Coefficient of Variation (CV) | Skewness |
| Carbonatite | ||||||
| La2O3 (ppm) | 3,976 | 83 | 35,166 | 3,717 | 0.74 | 2.7 |
| Ce2O3 (ppm) | 3,976 | 167 | 46,033 | 6,670 | 0.58 | 2.11 |
| Pr2O3 (ppm) | 3,976 | 19 | 4,085 | 703 | 0.5 | 1.69 |
| Nd2O3 (ppm) | 3,976 | 66 | 10,898 | 2,404 | 0.45 | 1.39 |
| Sm2O3 (ppm) | 3,976 | 13 | 1,262 | 346 | 0.4 | 1.32 |
| Eu2O3 (ppm) | 3,976 | 3 | 343 | 95 | 0.39 | 1.43 |
| Gd2O3 (ppm) | 3,976 | 8 | 861 | 226 | 0.37 | 1.57 |
| Tb2O3 (ppm) | 3,976 | 1 | 112 | 27 | 0.37 | 1.6 |
| Dy2O3 (ppm) | 3,976 | 5 | 621 | 129 | 0.39 | 1.58 |
| Ho2O3 (ppm) | 3,976 | 1 | 103 | 21 | 0.41 | 1.64 |
| Er2O3 (ppm) | 3,976 | 2 | 245 | 50 | 0.44 | 1.73 |
| Tm2O3 (ppm) | 3,976 | 0 | 30 | 6 | 0.46 | 1.8 |
| Yb2O3 (ppm) | 3,976 | 2 | 169 | 36 | 0.46 | 1.92 |
| Lu2O3 (ppm) | 3,976 | 0 | 23 | 5 | 0.45 | 1.86 |
| Y2O3 (ppm) | 3,976 | 24 | 2,976 | 591 | 0.44 | 1.69 |
| TREO (%) | 3,976 | 0.04 | 10.02 | 1.50 | 0.54 | 2.09 |
| Th (ppm) | 3,958 | 14 | 2,727 | 346 | 0.5 | 2.1 |
| U (ppm) | 3,976 | 1 | 134 | 12 | 0.6 | 4.5 |
| Fe (%) | 3,976 | 0.9 | 33.74 | 10.70 | 0.4 | 1.48 |
| Mn (%) | 3,976 | 0.29 | 6.48 | 1.86 | 0.45 | 1.64 |
| SG | 2,912 | 1.47 | 3.43 | 2.76 | 0.07 | 0 |
| Non-Carbonatite | ||||||
| La2O3 (ppm) | 5,029 | 73 | 26,640 | 1,854 | 0.96 | 4.25 |
| S-K 1300 Technical Report Summary on the Songwe Hill REE Project | Page 175 of 489 |
| |
| Variable (Unit) | Number of Composites | Minimum | Maximum | Mean | Coefficient of Variation (CV) | Skewness |
| Ce2O3 (ppm) | 5,029 | 105 | 31,382 | 3,438 | 0.84 | 3.14 |
| Pr2O3 (ppm) | 5,029 | 11 | 2,838 | 376 | 0.78 | 2.71 |
| Nd2O3 (ppm) | 5,029 | 36 | 9,992 | 1,334 | 0.73 | 2.42 |
| Sm2O3 (ppm) | 5,029 | 6 | 1,450 | 208 | 0.64 | 2.08 |
| Eu2O3 (ppm) | 5,029 | 2 | 421 | 56 | 0.59 | 2.17 |
| Gd2O3 (ppm) | 5,029 | 5 | 1,049 | 130 | 0.56 | 2.49 |
| Tb2O3 (ppm) | 5,029 | 1 | 134 | 15 | 0.56 | 3.35 |
| Dy2O3 (ppm) | 5,029 | 5 | 623 | 70 | 0.59 | 3.84 |
| Ho2O3 (ppm) | 5,029 | 1 | 103 | 21 | 0.41 | 1.64 |
| Er2O3 (ppm) | 5,029 | 3 | 285 | 27 | 0.67 | 4.45 |
| Tm2O3 (ppm) | 5,029 | 0 | 41 | 3 | 0.7 | 4.69 |
| Yb2O3 (ppm) | 5,029 | 3 | 247 | 20 | 0.7 | 4.63 |
| Lu2O3 (ppm) | 5,029 | 0 | 30 | 3 | 0.67 | 4.11 |
| Y2O3 (ppm) | 5,029 | 32 | 3,528 | 328 | 0.66 | 4.29 |
| TREO (%) | 5,029 | 0.03 | 6.91 | 0.79 | 0.78 | 3.08 |
| Th (ppm) | 5,007 | 10.7 | 1,786.5 | 258 | 0.6 | 2.4 |
| U (ppm) | 5,029 | 0 | 89 | 13 | 0.6 | 2.1 |
| Fe (%) | 5,029 | 1.84 | 54.54 | 10.80 | 0.67 | 2.27 |
| Mn (%) | 5,029 | 0.10 | 10.40 | 1.54 | 0.77 | 2.39 |
| SG | 3,365 | 1.56 | 4.121 | 2.64 | 0.09 | 0.37 |
The statistical analysis revealed the following:
| · | The carbonatite domain is the main mineralisation zone, with a higher average grade than the non-carbonatite domain for all REEs. |
| · | Cerium, lanthanum and neodymium account for the largest proportion of the TREO grade. |
| · | The histograms for the REEs are strongly positively skewed. |
| · | The coefficients of variation (CVs) for the carbonatite domain are lower than for the non-carbonatite domain. This is due to the mixture of lithologies (and therefore grade) in the non-carbonatite domain. |
| · | The CVs for density are low. |
| · | Most importantly, the coded data discriminates the high-grade from the lower-grade material. |
| · | The densities of the two domains are different, with the non-carbonatite domain being of slightly lower density than the carbonatite domain. |
| S-K 1300 Technical Report Summary on the Songwe Hill REE Project | Page 176 of 489 |
| |
Figure 11.3 shows the histograms and log probability plots of the TREO grade for the two domains.
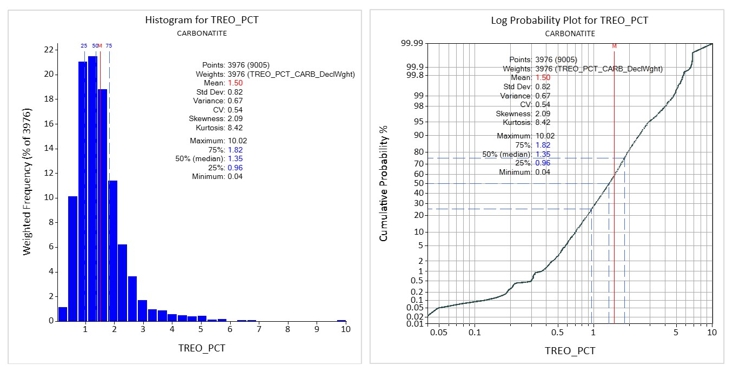
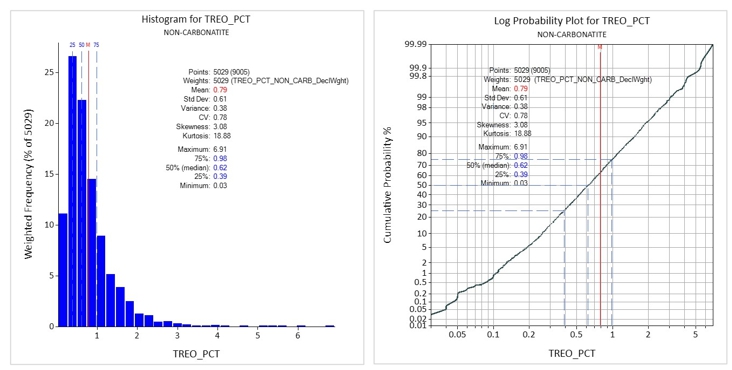
Figure 11.3: Histograms and Log Probability Plots for TREO Grade
| 11.4.1 | Cutting and Capping |
No cutting or capping was required, as no distinct outliers were present in the composite data.
| 11.5 | Geostatistical Analysis |
| 11.5.1 | Semi-Variograms |
The 2 m composite data were examined using semi-variograms that were calculated and modelled using Snowden Supervisor software. The variogram fans revealed anisotropy with the longest direction vertically and a strike of 155° (south-south-east). The longest direction in the horizontal plane was either south-south-east or east-north-east (065°). Rotations were aligned for all the attributes estimated. Normalised semi-variograms were calculated so that the sum of the variance (total sill value) was equal to one.
| S-K 1300 Technical Report Summary on the Songwe Hill REE Project | Page 177 of 489 |
| |
Semi-variograms were modelled with two spherical structures. The nugget effect was estimated by extrapolating the first two experimental semi-variogram points (calculated at the same lag as the composite length) to the Y-axis.
There were enough data to calculate robust semi-variograms for both domains.
Most variables show strong continuity in the down-plunge (vertical) direction, in excess of the drillhole spacing. Similarities were noted between elements; therefore, they were grouped into four categories within the carbonatite and non-carbonatite domains and modelled in the same way in each group.
The semi-variogram model parameters are shown in Table 11.2 and Table 11.3.
The reliability of the semi-variograms of the variables in all directions is considered to be generally good. The search neighbourhood was kept the same for all the individual oxides in order to maintain the relationships between the attributes in the block estimates.
Table 11.2: Semi-Variogram Parameters – Carbonatite Domain, Songwe Hill
| Attribute | Rotation Angle (degrees) |
Rotation
Axis |
Nugget
Effect (C0) |
Range of First Structure (R1) (m) |
Sill 1 (C1) | Range of Second Structure R2 (m) |
Sill 2 (C2) | ||||||||
| 1 | 2 | 3 | 1 | 2 | 3 | 1 | 2 | 3 | 1 | 2 | 3 | ||||
| La2O3 | 65 | 90 | 90 | Z | X | Z | 0.15 | 15 | 25 | 70 | 0.3 | 100 | 50 | 110 | 0.55 |
| Ce2O3 | 65 | 90 | 90 | Z | X | Z | 0.15 | 15 | 25 | 70 | 0.3 | 130 | 60 | 110 | 0.55 |
| Pr2O3 | 65 | 90 | 90 | Z | X | Z | 0.15 | 15 | 25 | 70 | 0.3 | 150 | 70 | 110 | 0.55 |
| Nd2O3 | 65 | 90 | 90 | Z | X | Z | 0.15 | 15 | 25 | 70 | 0.3 | 150 | 70 | 110 | 0.55 |
| Sm2O3 | 65 | 90 | 90 | Z | X | Z | 0.15 | 15 | 25 | 70 | 0.3 | 150 | 70 | 110 | 0.55 |
| Eu2O3 | 65 | 90 | 90 | Z | X | Z | 0.13 | 15 | 45 | 75 | 0.42 | 125 | 90 | 120 | 0.45 |
| Gd2O3 | 65 | 90 | 90 | Z | X | Z | 0.13 | 15 | 45 | 75 | 0.42 | 125 | 90 | 120 | 0.45 |
| Tb2O3 | 65 | 90 | 90 | Z | X | Z | 0.15 | 15 | 30 | 100 | 0.4 | 150 | 100 | 140 | 0.45 |
| Dy2O3 | 65 | 90 | 90 | Z | X | Z | 0.15 | 15 | 30 | 100 | 0.4 | 150 | 100 | 140 | 0.45 |
| Ho2O3 | 65 | 90 | 90 | Z | X | Z | 0.17 | 15 | 15 | 70 | 0.39 | 125 | 120 | 135 | 0.44 |
| Er2O3 | 65 | 90 | 90 | Z | X | Z | 0.17 | 15 | 15 | 70 | 0.39 | 125 | 120 | 135 | 0.44 |
| Tm2O3 | 65 | 90 | 90 | Z | X | Z | 0.17 | 15 | 15 | 70 | 0.39 | 125 | 120 | 135 | 0.44 |
| Yb2O3 | 65 | 90 | 90 | Z | X | Z | 0.17 | 15 | 15 | 70 | 0.39 | 125 | 120 | 135 | 0.44 |
| Lu2O3 | 65 | 90 | 90 | Z | X | Z | 0.17 | 15 | 15 | 70 | 0.39 | 125 | 120 | 135 | 0.44 |
| Y2O3 | 65 | 90 | 90 | Z | X | Z | 0.17 | 15 | 15 | 70 | 0.39 | 125 | 120 | 135 | 0.44 |
| Th | 65 | 90 | 90 | Z | X | Z | 0.14 | 10 | 20 | 15 | 0.35 | 110 | 60 | 60 | 0.51 |
| S-K 1300 Technical Report Summary on the Songwe Hill REE Project | Page 178 of 489 |
| |
| Attribute | Rotation Angle (degrees) |
Rotation
Axis |
Nugget
Effect (C0) |
Range of First Structure (R1) (m) |
Sill 1 (C1) | Range of Second Structure R2 (m) |
Sill 2 (C2) | ||||||||
| 1 | 2 | 3 | 1 | 2 | 3 | 1 | 2 | 3 | 1 | 2 | 3 | ||||
| U | 65 | 90 | 90 | Z | X | Z | 0.24 | 8 | 35 | 30 | 0.28 | 45 | 60 | 140 | 0.48 |
| Fe | 65 | 90 | 90 | Z | X | Z | 0.10 | 20 | 10 | 15 | 0.46 | 75 | 45 | 55 | 0.44 |
| Mn | 65 | 90 | 90 | Z | X | Z | 0.10 | 25 | 40 | 20 | 0.46 | 155 | 55 | 60 | 0.44 |
| Al | 65 | 90 | 90 | Z | X | Z | 0.14 | 20 | 20 | 15 | 0.24 | 200 | 100 | 75 | 0.62 |
| K | 65 | 90 | 90 | Z | X | Z | 0.14 | 20 | 20 | 15 | 0.24 | 200 | 100 | 75 | 0.62 |
| Si | 65 | 90 | 90 | Z | X | Z | 0.14 | 20 | 20 | 15 | 0.24 | 200 | 100 | 75 | 0.62 |
| Ca | 65 | 90 | 90 | Z | X | Z | 0.14 | 20 | 20 | 15 | 0.24 | 200 | 100 | 75 | 0.62 |
| Density | 65 | 90 | 90 | Z | X | Z | 0.15 | 15 | 25 | 70 | 0.3 | 100 | 50 | 110 | 0.55 |
Table 11.3: Semi-Variogram Parameters – Non-Carbonatite Domain, Songwe Hill
| Attribute | Rotation Angle (degrees) |
Rotation
Axis |
Nugget
Effect (C0) |
Range of First Structure (R1) (m) |
Sill 1 (C1) | Range of Second Structure (R2) (m) |
Sill 2 (C2) | ||||||||
| 1 | 2 | 3 | 1 | 2 | 3 | 1 | 2 | 3 | 1 | 2 | 3 | ||||
| La2O3 | 65 | 90 | 90 | Z | X | Z | 0.15 | 10 | 60 | 40 | 0.28 | 75 | 60 | 60 | 0.57 |
| Ce2O3 | 65 | 90 | 90 | Z | X | Z | 0.15 | 10 | 60 | 40 | 0.28 | 75 | 60 | 60 | 0.57 |
| Pr2O3 | 65 | 90 | 90 | Z | X | Z | 0.15 | 10 | 60 | 40 | 0.28 | 75 | 60 | 60 | 0.57 |
| Nd2O3 | 65 | 90 | 90 | Z | X | Z | 0.15 | 10 | 60 | 40 | 0.27 | 75 | 60 | 60 | 0.58 |
| Sm2O3 | 65 | 90 | 90 | Z | X | Z | 0.15 | 10 | 10 | 10 | 0.24 | 75 | 60 | 75 | 0.61 |
| Eu2O3 | 65 | 90 | 90 | Z | X | Z | 0.13 | 20 | 45 | 50 | 0.42 | 125 | 65 | 70 | 0.45 |
| Gd2O3 | 65 | 90 | 90 | Z | X | Z | 0.13 | 20 | 45 | 50 | 0.42 | 125 | 65 | 70 | 0.45 |
| Tb2O3 | 65 | 90 | 90 | Z | X | Z | 0.15 | 15 | 45 | 55 | 0.4 | 105 | 70 | 65 | 0.45 |
| Dy2O3 | 65 | 90 | 90 | Z | X | Z | 0.15 | 15 | 45 | 55 | 0.4 | 105 | 70 | 65 | 0.45 |
| Ho2O3 | 65 | 90 | 90 | Z | X | Z | 0.17 | 25 | 45 | 55 | 0.37 | 75 | 95 | 70 | 0.46 |
| Er2O3 | 65 | 90 | 90 | Z | X | Z | 0.17 | 25 | 45 | 55 | 0.37 | 75 | 95 | 70 | 0.46 |
| Tm2O3 | 65 | 90 | 90 | Z | X | Z | 0.17 | 25 | 45 | 55 | 0.37 | 75 | 95 | 70 | 0.46 |
| Yb2O3 | 65 | 90 | 90 | Z | X | Z | 0.17 | 25 | 45 | 55 | 0.37 | 75 | 95 | 70 | 0.46 |
| Lu2O3 | 65 | 90 | 90 | Z | X | Z | 0.17 | 25 | 45 | 55 | 0.37 | 75 | 95 | 70 | 0.46 |
| Y2O3 | 65 | 90 | 90 | Z | X | Z | 0.17 | 25 | 45 | 55 | 0.37 | 75 | 95 | 70 | 0.46 |
| Th | 65 | 90 | 90 | Z | X | Z | 0.08 | 10 | 50 | 5 | 0.22 | 175 | 55 | 60 | 0.70 |
| S-K 1300 Technical Report Summary on the Songwe Hill REE Project | Page 179 of 489 |
| |
| Attribute | Rotation
Angle |
Rotation
Axis |
Nugget
Effect (C0) |
Range
of First |
Sill 1 (C1) | Range
of Second |
Sill 2 (C2) | ||||||||
| 1 | 2 | 3 | 1 | 2 | 3 | 1 | 2 | 3 | 1 | 2 | 3 | ||||
| U | 65 | 90 | 90 | Z | X | Z | 0.12 | 20 | 10 | 25 | 0.50 | 70 | 55 | 165 | 0.38 |
| Fe | 65 | 90 | 90 | Z | X | Z | 0.08 | 20 | 40 | 55 | 0.46 | 75 | 80 | 75 | 0.46 |
| Mn | 65 | 90 | 90 | Z | X | Z | 0.08 | 25 | 10 | 65 | 0.46 | 75 | 90 | 75 | 0.46 |
| Al | 65 | 90 | 90 | Z | X | Z | 0.07 | 10 | 40 | 40 | 0.41 | 80 | 100 | 80 | 0.52 |
| K | 65 | 90 | 90 | Z | X | Z | 0.07 | 10 | 40 | 40 | 0.41 | 80 | 100 | 80 | 0.52 |
| Si | 65 | 90 | 90 | Z | X | Z | 0.07 | 10 | 40 | 40 | 0.41 | 80 | 100 | 80 | 0.52 |
| Ca | 65 | 90 | 90 | Z | X | Z | 0.07 | 10 | 40 | 40 | 0.41 | 80 | 100 | 80 | 0.52 |
| Density | 65 | 90 | 90 | Z | X | Z | 0.15 | 10 | 60 | 40 | 0.28 | 75 | 60 | 60 | 0.57 |
| 11.5.2 | Indicator Semi-Variograms |
The 2 m composite data were assigned indicators: carbonatite was assigned an indicator value of 1 and non-carbonatite was assigned 0. Semi-variogram data for the indicators were calculated and modelled in the same way as the grade data using Snowden Supervisor software.
The semi-variogram model parameters are shown in Table 11.4.
Table 11.4: Indicator Semi-Variogram Parameters, Songwe Hill
| Attribute | Rotation
Angle |
Rotation
Axis |
Nugget
Effect (C0) |
Range
of First Structure (R1) |
Sill 1 (C1) | Range
of Second Structure (R2) |
Sill 2 (C2) | ||||||||
| 1 | 2 | 3 | 1 | 2 | 3 | 1 | 2 | 3 | 1 | 2 | 3 | ||||
| Indicator | 65 | 90 | 90 | Z | X | Z | 0.53 | 5 | 35 | 20 | 0.24 | 100 | 120 | 60 | 0.23 |
| 11.5.3 | Kriging Neighbourhood Analysis |
A Kriging Neighbourhood Analysis (KNA) was performed on the elements selected for estimation in order to find a reasonable block size, the number of composites for estimation and the appropriate discretisation level. The KNA was carried out for both domains using Snowden Supervisor software. Kriging efficiency (KE%) and slope of regression (PSlope) were estimated to provide an indication of the quality and the level of conditional bias.
The selected 20 mE by 20 mN by 5 mRL block size resulted in the highest KE%, and PSlope for the blocks that were tested. A 5 m block size is considered appropriately aligned with the perceived open-pit mining method at Songwe Hill. The 20 mE by 20 mN dimension is less than half the general drillhole spacing and one third of the drillhole spacing in the sparser drilled areas. The minimum number of sample composite selected is 8 and the maximum is 16. A discretisation level of 5E by 5N by 5RL points was selected.
| S-K 1300 Technical Report Summary on the Songwe Hill REE Project | Page 180 of 489 |
| |
| 11.6 | Block Modelling |
A block model was created encompassing the drilled Songwe Hill deposit. The block model prototype parameters are shown in Table 11.5. No sub-celling of the model was necessary except to closely honour the topography.
Table 11.5: Block Model Prototype Parameters for Songwe Hill
| Block Size (m) | Model Origin | Rotation Angle | Rotation Axis | Number of Cells | ||||||||||
| X | Y | Z | X | Y | Z | 1 | 2 | 3 | 1 | 2 | 3 | X | Y | Z |
| 20 | 20 | 5 | 801530 | 8263120 | 300 | 0 | 0 | 0 | – | – | – | 30 | 35 | 150 |
| 11.7 | Estimation |
The proportion of carbonatite to non-carbonatite was estimated into the block model cells using indicator kriging. The minimum and maximum number of 2 m sample composites applied was four and eight, respectively.
Ordinary kriging was used to estimate the grade and density attributes into the block model cells using parent cell estimation. The search distance and the rotation angles that defined each search ellipse were based on the semi-variogram model for each attribute. The search parameters for the estimation are shown in Table 11.6, Table 11.7 and Table 11.8. The search parameters are the same for the individual REOs.
Two estimates were made: one using the carbonatite domain data and the other using the non-carbonatite domain data. The final grade was weighted between the carbonatite and non-carbonatite model domains using the indicator kriged model.
The following attributes were estimated into the block model cells:
| · | REE oxides: La2O3, Ce2O3, Pr2O3, Nd2O3, Sm2O3, Eu2O3, Gd2O3, Tb2O3, Dy2O3, Ho2O3, Er2O3, Tm2O3, Yb2O3, Lu2O3 and Y2O3 in parts per million |
| · | Th and U in parts per million |
| · | Al, Fe, Mn, K, Ca and Si expressed as percentages |
| · | Relative density |
Ce2O3, Pr2O3 and Tb2O3 were converted to CeO2, Pr6O11 and Tb4O7 as their more common oxide form for reporting purposes, and therefore the TREO grade (summation of the REO grades) was also adjusted.
| S-K 1300 Technical Report Summary on the Songwe Hill REE Project | Page 181 of 489 |
| |
Table 11.6: Search Parameters for the Carbonatite Domain, Songwe Hill – Ordinary Kriging
| Attribute | Search
Distance (m) |
Search
Angle |
Rotation Axis |
First
Search Volume |
Factor | Search Multiplier 2 |
Factor | Search
Multiplier 3 |
Max. | |||||||||
| 1 | 2 | 3 | 1 | 2 | 3 | 1 | 2 | 3 | Min. Num. | Max. Num. |
Min.
Num. |
Max. Num. | Min.
Num. |
Max. Num. | ||||
| REO | 130 | 100 | 130 | 65 | 90 | 90 | Z | X | Z | 8 | 16 | 2 | 4 | 16 | 5 | 1 | 16 | 3 |
| Th | 110 | 60 | 60 | 65 | 90 | 90 | Z | X | Z | 10 | 22 | 2 | 5 | 22 | 5 | 1 | 22 | 3 |
| U | 50 | 60 | 140 | 65 | 90 | 90 | Z | X | Z | 8 | 16 | 2 | 4 | 16 | 5 | 1 | 16 | 3 |
| Fe | 75 | 45 | 55 | 65 | 90 | 90 | Z | X | Z | 24 | 32 | 2 | 12 | 32 | 5 | 1 | 32 | 3 |
| Mn | 155 | 55 | 60 | 65 | 90 | 90 | Z | X | Z | 16 | 22 | 2 | 8 | 22 | 5 | 1 | 22 | 3 |
| Al | 100 | 50 | 50 | 65 | 90 | 90 | Z | X | Z | 8 | 14 | 2 | 4 | 14 | 5 | 1 | 14 | 3 |
| K | 100 | 50 | 50 | 65 | 90 | 90 | Z | X | Z | 8 | 14 | 2 | 4 | 14 | 5 | 1 | 14 | 3 |
| Si | 100 | 50 | 50 | 65 | 90 | 90 | Z | X | Z | 8 | 14 | 2 | 4 | 14 | 5 | 1 | 14 | 3 |
| Ca | 100 | 50 | 50 | 65 | 90 | 90 | Z | X | Z | 8 | 14 | 2 | 4 | 14 | 5 | 1 | 14 | 3 |
| Density | 100 | 50 | 50 | 65 | 90 | 90 | Z | X | Z | 8 | 14 | 2 | 4 | 14 | 5 | 1 | 14 | 3 |
| S-K 1300 Technical Report Summary on the Songwe Hill REE Project | Page 182 of 489 |
| |
Table 11.7: Search Parameters for the Non-Carbonatite Domain, Songwe Hill – Ordinary Kriging
| Attribute | Search Distance (m) |
Search Angle
|
Rotation Axis |
First Search Volume |
Factor | Search Multiplier 2 |
Factor | Search Multiplier 3 |
Max
| |||||||||
| 1 | 2 | 3 | 1 | 2 | 3 | 1 | 2 | 3 | Min. Num. |
Max. Num. |
Min. Num. |
Max. Num. |
Min. Num. |
Max. Num. | ||||
| REO | 100 | 80 | 70 | 65 | 90 | 90 | Z | X | Z | 8 | 16 | 2 | 4 | 16 | 5 | 1 | 16 | 3 |
| Th | 175 | 55 | 60 | 65 | 90 | 90 | Z | X | Z | 10 | 22 | 2 | 5 | 22 | 5 | 1 | 22 | 3 |
| U | 70 | 55 | 165 | 65 | 90 | 90 | Z | X | Z | 14 | 32 | 2 | 7 | 32 | 5 | 1 | 32 | 3 |
| Fe | 75 | 80 | 75 | 65 | 90 | 90 | Z | X | Z | 8 | 14 | 2 | 4 | 14 | 5 | 1 | 14 | 3 |
| Mn | 75 | 90 | 75 | 65 | 90 | 90 | Z | X | Z | 16 | 22 | 2 | 8 | 22 | 5 | 1 | 22 | 3 |
| Al | 50 | 50 | 50 | 65 | 90 | 90 | Z | X | Z | 8 | 14 | 2 | 4 | 14 | 5 | 1 | 14 | 3 |
| K | 100 | 50 | 50 | 65 | 90 | 90 | Z | X | Z | 8 | 14 | 2 | 4 | 14 | 5 | 1 | 14 | 3 |
| Si | 100 | 50 | 50 | 65 | 90 | 90 | Z | X | Z | 8 | 14 | 2 | 4 | 14 | 5 | 1 | 14 | 3 |
| Ca | 100 | 50 | 50 | 65 | 90 | 90 | Z | X | Z | 8 | 14 | 2 | 4 | 14 | 5 | 1 | 14 | 3 |
| Density | 50 | 50 | 50 | 65 | 90 | 90 | Z | X | Z | 8 | 14 | 2 | 4 | 14 | 5 | 1 | 14 | 3 |
Table 11.8: Search Parameters for Songwe Hill – Indicator Model
| Search Distance (m) |
Search Angle
(degrees)
|
Rotation Axis | First Search Volume | Factor | Search Multiplier 2 | Factor | Search Multiplier 3 |
Max.
Key
| |||||||||
| 1 | 2 | 3 | 1 | 2 | 3 | 1 | 2 | 3 | Min. Num. | Max. Num. | Min. Num. | Max. Num. | Min. Num. | Max. Num. | |||
| 100 | 120 | 60 | 65 | 90 | 90 | Z | X | Z | 4 | 8 | 2 | 4 | 8 | 5 | 1 | 8 | - |
| S-K 1300 Technical Report Summary on the Songwe Hill REE Project | Page 183 of 489 |
| |
| 11.8 | Validation of the Estimates |
The models were validated by
| · | Visual examination of the input data against the block model estimates |
| · | Sectional validation |
| · | Comparison of the composited sample data within the block with the block estimate |
The block model was examined visually in sections to ensure that the drillhole grades were locally well represented by the model. The drillhole grades compare well with the grades of the block model for the estimated attributes. Examples of sections showing the block model and drillholes shaded by TREO (expressed as a percentage) are shown in Figure 11.4.
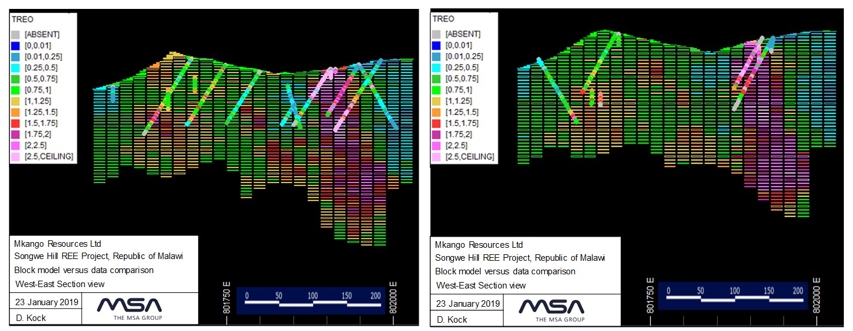
Figure 11.4: Sections through the Block Model and Drillhole Data Illustrating Correlation between Model and Data
Sectional validation plots were constructed for the individual grade attributes in order to compare the average grades of the block model against the input data along corridors in both northing and easting directions through the deposit. Samples of sectional validation plots for the Ce2O3 grade are shown in Figure 11.5. These show that the model estimates compare closely with the composite data where the data frequency is high. In areas with sparse data, particularly on the edges of the deposit, the model tends to be more smoothed.
| S-K 1300 Technical Report Summary on the Songwe Hill REE Project | Page 184 of 489 |
| |
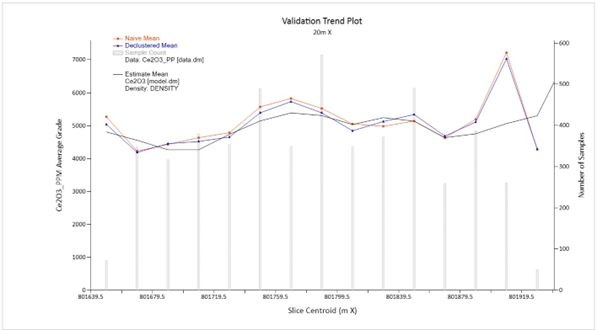
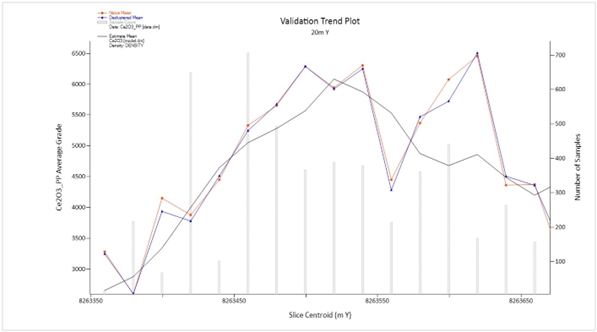
Figure 11.5: Sectional Validation Plots for Ce2O3 Grade
| S-K 1300 Technical Report Summary on the Songwe Hill REE Project | Page 185 of 489 |
| |
As a further check, individual block grades were compared with the 2 m composite data occurring within each block in the model (see Figure 11.6). The model and the data compare well, and blocks with three samples or more consistently attained a correlation coefficient higher than 0.8. This demonstrates that the estimate is an accurate representation of the data.
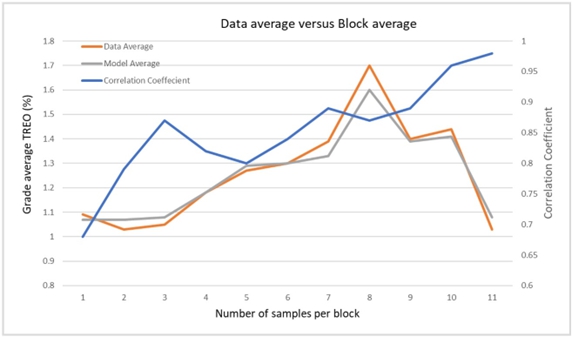
Figure 11.6: Comparison between Drillhole and Model Data on a per Block Basis
| 11.9 | Mineral Resource Classification |
Mineral Resources have been classified in accordance with the S-K 1300 definitions, which are consistent with the CIM (2014) definitions.
Classification of the Songwe Hill Mineral Resource was based on the degree of geological uncertainty, drillhole density and confidence parameter outputs from kriging. The main considerations in the classification of the Songwe Hill Mineral Resource are as follows:
| · | All the data that inform the Mineral Resource have been collected by Mkango using acceptable principles, and the assays passed the relevant QA/QC tests. |
| · | The semi-variogram ranges for the attributes are in excess of the general drillhole spacing in most areas. |
| · | The deposit is irregular and contains variable proportions of carbonatite, mixed and fenite lithologies. As the lithology has a strong relationship with grade, lithological variability is an important consideration. |
Given the aforementioned factors, the Songwe Hill Mineral Resource has been classified using the following criteria:
| · | Measured, Indicated and Inferred Mineral Resources are estimated on the basis of different levels of geological evidence (conclusive, adequate and limited, respectively) so they are not equal levels, i.e. the proportion of carbonatite to non-carbonatite lithologies, and the confidence in the grade estimate for each domain. |
| · | The Mineral Resource was classified as Measured where the level of confidence in the geology is high. This is underpinned by data on a drilling grid of 30 m spacing or less, which allows for the 20 mX by 20 mY block model cells to be well informed by drilling (two-thirds of the blocks contain a single drillhole, and one-third of the blocks are within a drillhole 5 m away). For the Measured Resource blocks, the kriging efficiency is between 60 % and 80 % and the slope of regression is higher than 0.9, which together indicate high quality estimates. |
| S-K 1300 Technical Report Summary on the Songwe Hill REE Project | Page 186 of 489 |
| |
| · | The Indicated Mineral Resource is underpinned by data on a drilling grid of approximately 50 m spacing. Although the kriging efficiency and the slope of regression are high, indicating high-quality grade estimates, the drillhole spacing is too wide to interpolate the geology (i.e. carbonatite to non-carbonatite lithologies) to a high level of accuracy. The Indicated area is directly adjacent to the Measured areas. |
| · | The level of confidence for the geology is relatively low for the Inferred areas. In these areas, the drillholes are sparse and local estimates for grade cannot be reliably made. The Inferred areas are directly adjacent to the Indicated areas and occur in the deeper portions of the Mineral Resource. |
The classified areas are shown in plan view in Figure 11.7 and in a north-east section in Figure 11.8.
The Mineral Resource forms an irregular, roughly circular surface expression with a diameter of approximately 450 m. The maximum depth of the Inferred Mineral Resource is 390 m below surface, with the Measured and Indicated Mineral Resource occurring to a maximum depth of 200 m, paralleling the topographic surface of the hill and surrounding plain. The majority of the Measured and Indicated Mineral Resource occurs to a depth of approximately 160 m. Extrapolation in the Inferred area was limited to a maximum of 50 m from the drilling area.
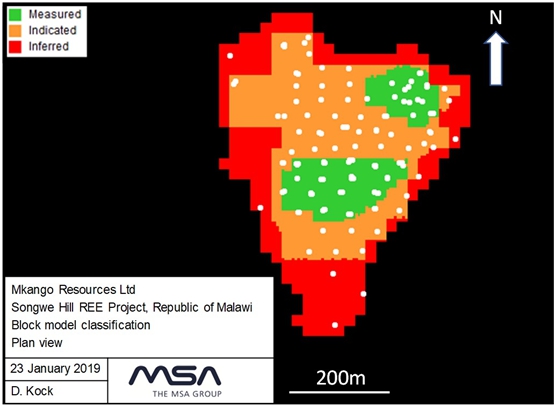
NOTE: Drillhole collars are shown in white. Drillholes are not drilled vertically (see Figure 11).
Figure 11.7: Mineral Resource Classification, Songwe Hill – Plan View from Top
| S-K 1300 Technical Report Summary on the Songwe Hill REE Project | Page 187 of 489 |
| |
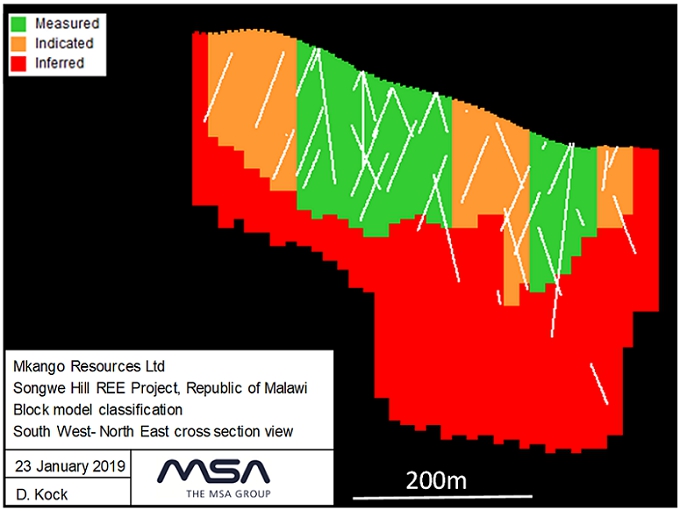
NOTE: Drillhole traces are shown in white.
Figure 11.8: Mineral Resource Classification, Songwe Hill – North-East Section View
| 11.10 | Assessment of reasonable prospects for economic extraction |
A pit optimisation exercise was undertaken based on the input parameters presented in Table 11.9. These parameters are aligned with those used in the Mineral Reserve pit optimisation with the exception of the TREO basket price, which is set at 10 % higher than the Mineral Reserve price. The Mineral Reserve price is the average base case basket price prediction for the first five years of production.
| S-K 1300 Technical Report Summary on the Songwe Hill REE Project | Page 188 of 489 |
| |
Table 11.9: Pit Optimisation Input Parameters for Mineral Resource
| Item | Value | Unit | Comment |
| Operating Cost | |||
| Waste | |||
| Mining Cost – Free Dig | 3.50 | US$/t mined | Contractor submission |
| Mining Cost – Drill and Blast | 4.73 | US$/t mined | Contractor submission |
| Mineralisation | |||
| Mining Cost – Free Dig | 2.92 | US$/t mined | Contractor submission |
| Mining Cost – Drill and Blast | 4.15 | US$/t mined | Contractor submission |
| Mining Time-Related Costs | 4.89 | US$/t mined | Contractor submission |
| Process Cost | 101.15 | US$/t milled | SENET |
| General and Administrative Cost | 5.60 | US$/t milled | SENET |
| Technical | |||
| Slope Angles | 36 to 49 | degrees | Geotechnical report (applied by sector) |
| Mining Dilution | 3 | % | Bara mine design |
| Mining Loss | 5 | % | Bara mine design |
| Bench Height | 10 | m | Bara mine design |
| Average Metallurgical Recovery | 40 | % | SENET |
| Production Rate | 1,000,000 | t/a | |
| Economic | |||
| Royalties | 5 | % | Used for cut-off grade |
| TREO Price (Basket Price) | 61.6 | US$/kg | Adamas (2025) Long-term base case +10 % |
| Discount for TREO in carbonate | 27 | % | Adamas (2025) Base Case |
| Discount Factor | 7.3 | % | Mkango |
The extents of the block model in relation to the Mineral Resource pit shell and the Mineral Reserve design pit shell are shown as a north-south section in Figure 11.9. The pit shell covers the entire extent of the classified resource model aerially and the majority at depth. The modelled pit shell area lies entirely within EPL 0284/10, and the eastern boundary of the licence is approximately 1 km to the east. There is no infrastructure, such as major roads, power lines, watercourses or settlements, within the pit or within the immediate vicinity of the pit shell outline.
| S-K 1300 Technical Report Summary on the Songwe Hill REE Project | Page 189 of 489 |
| |
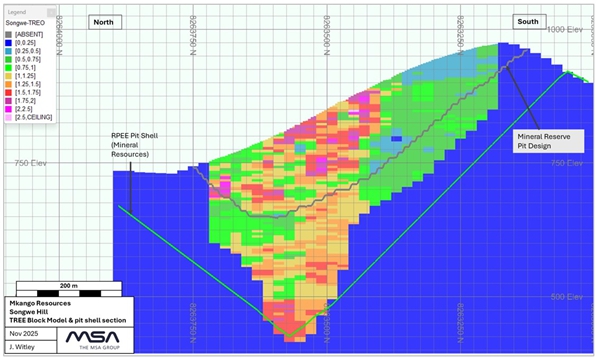
Figure 11.9: Section Looking North Showing Block Model Relative to Pit Shell Extents and Topography (Section 801775E)
For the purposes of calculating a cut-off grade, a TREO basket price was calculated using the proportion of individual REO in TREO, the individual processing recovery and the upside long-term REO price from the 2025 Adamas study as shown in Table 11.10.
Table 11.10: REO prices, in situ and Recovered Split used in Mineral Resource TREO Basket Price Calculation
| REO | Long-Term
REO Price (Adamas, 2025) (US$/kg) |
REO
Split in Total Resource (%) |
REO
Split in Product (Carbonate) (%) |
REO
Recovery (Mine to Carbonate) (%) |
| La2O3 | 1.40 | 23.42 | 37.39 | 63.24 |
| CeO2 | 1.45 | 45.18 | 18.2 | 15.96 |
| Pr6O11 | 165.91 | 4.80 | 7.81 | 64.48 |
| Nd2O3 | 165.91 | 16.28 | 26.10 | 63.52 |
| Sm2O3 | 4.16 | 2.44 | 3.58 | 58.08 |
| Eu2O3 | 34.45 | 0.66 | 0.92 | 55.62 |
| Gd2O3 | 88.43 | 1.54 | 1.98 | 50.91 |
| Tb4O7 | 1578.36 | 0.18 | 0.21 | 45.20 |
| Dy2O3 | 512.45 | 0.84 | 0.78 | 36.75 |
| Y2O3 | 8.00 | 3.89 | 2.59 | 26.39 |
| S-K 1300 Technical Report Summary on the Songwe Hill REE Project | Page 190 of 489 |
| |
| REO | Long-Term
REO Price (Adamas, 2025) (US$/kg) |
REO
Split in Total Resource (%) |
REO
Split in Product (Carbonate) (%) |
REO
Recovery (Mine to Carbonate) (%) |
| Ho2O3 | 174.23 | 0.14 | 0.10 | 29.65 |
| Er2O3 | 57.84 | 0.32 | 0.19 | 23.17 |
| Tm2O3 | 0.00 | 0.04 | 0.02 | 21.64 |
| Yb2O3 | 17.36 | 0.24 | 0.11 | 17.87 |
| Lu2O3 | 906.40 | 0.03 | 0.01 | 14.41 |
| Basket | 67.19 | 100.00 | 100.00 | 39.6 |
Using the upside basket price and the out-of-pit assumptions stated in Table 11.9, a marginal cut-off grade of 0.55 % TREO was calculated.
The reader is cautioned that the assessment of reasonable prospects for economic potential that is incorporated in the Mineral Resource is solely for the purpose of reporting Mineral Resources and does not represent an attempt to estimate Mineral Reserves.
| 11.11 | Mineral Resource Tabulation |
The Mineral Resource has been categorised into three domains based on the carbonatite proportion:
| · | > 0.75 proportion carbonatite = Carbonatite |
| · | < 0.75 and > 0.25 proportion carbonatite = Mixed |
| · | < 0.25 proportion carbonatite = Fenite |
Mineral Resources are reported on an Exclusive basis, which is the standard for S-K 1300, and may be reported on an Inclusive basis under other minerals reporting standards. Exclusive Mineral Resources are reported after the removal of the portion that was converted to Mineral Reserves, whereas Inclusive Mineral Resources include the portion that was converted to Mineral Reserves. Mkango’s disclosure of the Songwe Hill Mineral Resource has until now been on an Inclusive basis in accordance with NI 43-101. Both Exclusive and Inclusive Mineral Resources are reported in this TRS, with Exclusive Mineral Resources presented as per the S-K 1300 standards and Inclusive Mineral Resources presented to be consistent with those reported by Mkango under the NI 43-101 standards.
| 11.11.1 | Exclusive Mineral Resource |
The Mineral Resource estimate as at 30 June 2025, excluding those resources converted to Mineral Reserves, is presented in Table 11.11 to Table 11.15. In the QP’s opinion, the Mineral Resources reported herein at the selected cut-off grade have reasonable prospects for economic extraction, taking into consideration mining and processing assumptions.
| S-K 1300 Technical Report Summary on the Songwe Hill REE Project | Page 191 of 489 |
| |
The QP is of the opinion that with consideration of the recommendations summarised in Sections 23 of this TRS, any issues relating to technical and economic factors likely to influence the prospect of economic extraction can be resolved with further work.
The Mineral Resource is classified into the Measured, Indicated and Inferred categories as summarised in Table 11.11.
Table 11.11: Songwe Hill, Exclusive Mineral Resources above 0.55 % TREO Grade, 30 June 2025
| Category | Tonnes (Mt) |
TREO (%) |
TREO Tonnes (kt) |
| Measured | 0.7 | 0.98 | 7 |
| Indicated | 3.4 | 1.05 | 36 |
| Total Measured and Indicated | 4.1 | 1.04 | 43 |
| Inferred | 55.9 | 1.05 | 589 |
| NOTES: | |
| 1. | Mineral Resources have been classified in accordance with the S-K 1300 definitions, which are consistent with the CIM (2014) definitions. |
| 2. | All tabulated data has been rounded, and as a result minor computational errors may occur. |
| 3. | Mineral Resources, which are not Mineral Reserves, have no demonstrated economic viability. |
| 4. | The Mineral Resource estimate is reported on a 100 % ownership basis. |
| 5. | Mineral Resources are reported from within an optimised pit shell. |
| 6. | For the purposes of assessing reasonable prospects for economic extraction and cut-off grade, metallurgical recoveries were applied to individual rare earth oxides. The average total rare earth oxide metallurgical recovery is 39.6 %. |
| 7. | Mineral Resources exclude the portion converted to Mineral Reserves. |
| 8. | Mineral Resources are reported on an in-situ basis without applying modifying factors. |
| 9. | A mean density of 2.73 t/m3 was applied for Measured, 2.67 t/m3 for Indicated and 2.77 t/m3 for Inferred Resources. |
| TREO = La2O3, CeO2, Pr6O11, Nd2O3, Sm2O3, Eu2O3, Gd2O3, Tb4O7, Dy2O3, Ho2O3, Er2O3, Tm2O3, Yb2O3, Lu2O3, and Y2O3 | |
| S-K 1300 Technical Report Summary on the Songwe Hill REE Project | Page 192 of 489 |
| |
The Exclusive Mineral Resource estimate is reported by domain and category in Table 11.12.
Table 11.12: Songwe Hill, Exclusive Mineral Resources above 0.55 % TREO Grade within the Different Domains, 30 June 2025
| Domain | Class | Tonnes (Mt) |
TREO (%) |
TREO Tonnes (kt) |
| Carbonatite | Measured | 0.2 | 1.15 | 2 |
| Carbonatite | Indicated | 0.7 | 1.23 | 9 |
| Mixed | Measured | 0.3 | 1.00 | 3 |
| Mixed | Indicated | 1.4 | 1.10 | 16 |
| Fenite | Measured | 0.2 | 0.76 | 1 |
| Fenite | Indicated | 1.3 | 0.90 | 12 |
| Total | Measured | 0.7 | 0.98 | 7 |
| Total | Indicated | 3.4 | 1.05 | 36 |
| Total | Measured and Indicated | 4.1 | 1.04 | 43 |
| Carbonatite | Inferred | 8.5 | 1.44 | 123 |
| Mixed | Inferred | 21.2 | 1.13 | 239 |
| Fenite | Inferred | 26.2 | 0.87 | 227 |
| Total | Inferred | 55.9 | 1.05 | 589 |
| NOTES: | |
| 1. | Mineral Resources have been classified in accordance with the S-K 1300 definitions, which are consistent with the CIM (2014) definitions. |
| 2. | All tabulated data has been rounded, and as a result minor computational errors may occur. |
| 3. | Mineral Resources, which are not Mineral Reserves, have no demonstrated economic viability. |
| 4. | The Mineral Resource estimate is reported on a 100 % ownership basis. |
| 5. | Mineral Resources are reported from within an optimised pit shell. |
| 6. | For the purposes of assessing reasonable prospects for economic extraction and cut-off grade, metallurgical recoveries were applied to individual rare earth oxides. The average total rare earth oxide metallurgical recovery is 39.6 %. |
| 7. | Mineral Resources exclude the portion converted to Mineral Reserves. |
| 8. | Mineral Resources are reported on an in-situ basis without applying modifying factors. |
| 9. | A mean density of 2.73 t/m3 was applied for Measured, 2.67 t/m3 for Indicated and 2.77 t/m3 for Inferred Resources. |
| TREO = La2O3, CeO2, Pr6O11, Nd2O3, Sm2O3, Eu2O3, Gd2O3, Tb4O7, Dy2O3, Ho2O3, Er2O3, Tm2O3, Yb2O3, Lu2O3, and Y2O3 | |
| S-K 1300 Technical Report Summary on the Songwe Hill REE Project | Page 193 of 489 |
| |
The Mineral Resource is presented at a variety of cut-off grades as shown in Table 11.13 for the combined Measured and Indicated Mineral Resources and in Table 11.14 for the Inferred Mineral Resource. Table 11.15 shows the grades of the individual REOs for each class and domain.
Table 11.13: Songwe Hill, Exclusive Measured and Indicated Mineral Resources Grade Tonnage, 30 June 2025
|
Cut-Off |
Tonnes (Mt) |
TREO (%) |
TREO Tonnes (kt) |
| 0.45 | 4.3 | 1.02 | 44 |
| 0.55 | 4.1 | 1.04 | 43 |
| 0.65 | 3.9 | 1.07 | 41 |
| 0.75 | 3.6 | 1.10 | 39 |
| 0.85 | 3.1 | 1.14 | 35 |
| 1.00 | 2.2 | 1.23 | 27 |
| NOTES: | |
| 1. | Mineral Resources have been classified in accordance with the S-K 1300 definitions, which are consistent with the CIM (2014) definitions. |
| 2. | All tabulated data has been rounded, and as a result minor computational errors may occur. |
| 3. | Mineral Resources, which are not Mineral Reserves, have no demonstrated economic viability. |
| 4. | The Mineral Resource estimate is reported on a 100 % ownership basis. |
| 5. | Mineral Resources are reported from within an optimised pit shell. |
| 6. | For the purposes of assessing reasonable prospects for economic extraction and cut-off grade, metallurgical recoveries were applied to individual rare earth oxides. The average total rare earth oxide metallurgical recovery is 39.6 %. |
| 7. | Mineral Resources exclude the portion converted to Mineral Reserves. |
| 8. | Mineral Resources are reported on an in-situ basis without applying modifying factors. |
| 9. | A mean density of 2.73 t/m3 was applied for Measured, 2.67 t/m3 for Indicated and 2.77 t/m3 for Inferred Resources. |
| TREO = La2O3, CeO2, Pr6O11, Nd2O3, Sm2O3, Eu2O3, Gd2O3, Tb4O7, Dy2O3, Ho2O3, Er2O3, Tm2O3, Yb2O3, Lu2O3, and Y2O3 | |
| S-K 1300 Technical Report Summary on the Songwe Hill REE Project | Page 194 of 489 |
| |
Table 11.14: Songwe Hill, Exclusive Inferred Mineral Resources Grade Tonnage, 30 June 2025
|
Cut-Off (TREO %) |
Tonnes (Mt) |
TREO (%) |
TREO Tonnes (kt) |
| 0.45 | 59.7 | 1.02 | 608 |
| 0.55 | 55.9 | 1.05 | 589 |
| 0.65 | 49.9 | 1.11 | 553 |
| 0.75 | 43.5 | 1.17 | 508 |
| 0.85 | 37.0 | 1.23 | 456 |
| 1.00 | 28.1 | 1.33 | 373 |
| NOTES: | |
| 1. | Mineral Resources have been classified in accordance with the S-K 1300 definitions, which are consistent with the CIM (2014) definitions. |
| 2. | All tabulated data has been rounded, and as a result minor computational errors may occur. |
| 3. | Mineral Resources, which are not Mineral Reserves, have no demonstrated economic viability. |
| 4. | The Mineral Resource estimate is reported on a 100 % ownership basis. |
| 5. | Mineral Resources are reported from within an optimised pit shell. |
| 6. | For the purposes of assessing reasonable prospects for economic extraction and cut-off grade, metallurgical recoveries were applied to individual rare earth oxides. The average total rare earth oxide metallurgical recovery is 39.6 %. |
| 7. | Mineral Resources exclude the portion converted to Mineral Reserves. |
| 8. | Mineral Resources are reported on an in-situ basis without applying modifying factors. |
| 9. | A mean density of 2.73 t/m3 was applied for Measured, 2.67 t/m3 for Indicated and 2.77 t/m3 for Inferred Resources. |
| TREO = La2O3, CeO2, Pr6O11, Nd2O3, Sm2O3, Eu2O3, Gd2O3, Tb4O7, Dy2O3, Ho2O3, Er2O3, Tm2O3, Yb2O3, Lu2O3, and Y2O3 | |
| S-K 1300 Technical Report Summary on the Songwe Hill REE Project | Page 195 of 489 |
| |
Table 11.15: Songwe Hill, Exclusive Mineral Resources, Individual REOs at 0.55 % (5,500 ppm) TREO Cut-Off Grade within the Different Domains, 30 June 2025
| Domain | Class | Tonnes (Mt) | TREO
(ppm) |
La2O3 (ppm) |
CeO2
(ppm) |
Pr6O11 (ppm) | Nd2O3
(ppm) |
Sm2O3
(ppm) |
Eu2O3
(ppm) |
Gd2O3
(ppm) |
Tb4O7
(ppm) |
Dy2O3 (ppm) |
Ho2O3
(ppm) |
Er2O3
(ppm) |
Tm2O3
(ppm) |
Yb2O3
(ppm) |
Lu2O3
(ppm) |
Y2O3
(ppm) |
Th*
(ppm) |
U*
(ppm) |
| Carbonatite | Measured | 0.2 | 11,489 | 2,441 | 5,104 | 571 | 2,023 | 319 | 88 | 203 | 24 | 108 | 18 | 41 | 5 | 33 | 5 | 506 | 295 | 11 |
| Carbonatite | Indicated | 0.7 | 12,264 | 2,920 | 5,557 | 576 | 1,921 | 289 | 78 | 188 | 23 | 108 | 18 | 43 | 5 | 31 | 4 | 503 | 306 | 10 |
| Mixed | Measured | 0.3 | 9,985 | 2,166 | 4,414 | 491 | 1,718 | 277 | 76 | 176 | 21 | 97 | 16 | 38 | 5 | 28 | 4 | 459 | 282 | 13 |
| Mixed | Indicated | 1.4 | 10,998 | 2,573 | 4,954 | 523 | 1,783 | 277 | 74 | 175 | 21 | 96 | 15 | 37 | 5 | 26 | 3 | 436 | 322 | 12 |
| Fenite | Measured | 0.2 | 7,573 | 1,628 | 3,337 | 373 | 1,327 | 223 | 60 | 138 | 16 | 71 | 11 | 27 | 3 | 21 | 3 | 335 | 251 | 13 |
| Fenite | Indicated | 1.3 | 8,986 | 2,000 | 4,002 | 439 | 1,532 | 246 | 66 | 154 | 18 | 82 | 13 | 31 | 4 | 21 | 3 | 376 | 328 | 13 |
| Total | Measured | 0.7 | 9,821 | 2,113 | 4,346 | 485 | 1,709 | 276 | 75 | 175 | 20 | 94 | 15 | 36 | 5 | 28 | 4 | 442 | 278 | 12 |
| Total | Indicated | 3.4 | 10,496 | 2,427 | 4,717 | 502 | 1,716 | 267 | 72 | 170 | 20 | 93 | 15 | 36 | 4 | 25 | 3 | 427 | 321 | 12 |
| Total | Measured and Indicated | 4.1 | 10,382 | 2,374 | 4,654 | 499 | 1,715 | 269 | 72 | 171 | 20 | 93 | 15 | 36 | 4 | 26 | 3 | 430 | 314 | 12 |
| Carbonatite | Inferred | 8.5 | 14,421 | 3,336 | 6,528 | 699 | 2,369 | 344 | 94 | 219 | 27 | 121 | 20 | 48 | 6 | 37 | 5 | 568 | 311 | 11 |
| Mixed | Inferred | 21.2 | 11,264 | 2,665 | 5,116 | 539 | 1,819 | 270 | 73 | 169 | 20 | 91 | 15 | 35 | 4 | 26 | 4 | 419 | 290 | 12 |
| Fenite | Inferred | 26.2 | 8,681 | 1,967 | 3,900 | 423 | 1,466 | 227 | 60 | 139 | 16 | 73 | 12 | 28 | 4 | 21 | 3 | 343 | 286 | 13 |
| Total | Inferred | 55.9 | 10,534 | 2,440 | 4,761 | 509 | 1,737 | 261 | 70 | 162 | 19 | 87 | 14 | 34 | 4 | 25 | 3 | 406 | 292 | 13 |
| NOTES: | |
| 1. | Mineral Resources have been classified in accordance with the S-K 1300 definitions, which are consistent with the CIM (2014) definitions. |
| 2. | All tabulated data has been rounded, and as a result minor computational errors may occur. |
| 3. | Mineral Resources, which are not Mineral Reserves, have no demonstrated economic viability. |
| 4. | The Mineral Resource estimate is reported on a 100 % ownership basis. |
| 5. | Mineral Resources are reported from within an optimised pit shell. |
| 6. | For the purposes of assessing reasonable prospects for economic extraction and cut-off grade, metallurgical recoveries were applied to individual rare earth oxides. The average total rare earth oxide metallurgical recovery is 39.6 %. |
| 7. | Mineral Resources exclude the portion converted to Mineral Reserves. |
| 8. | Mineral Resources are reported on an in-situ basis without applying modifying factors. |
| 9. | A mean density of 2.73 t/m3 was applied for Measured, 2.67 t/m3 for Indicated and 2.77 t/m3 for Inferred Resources. |
| TREO = La2O3, CeO2, Pr6O11, Nd2O3, Sm2O3, Eu2O3, Gd2O3, Tb4O7, Dy2O3, Ho2O3, Er2O3, Tm2O3, Yb2O3, Lu2O3, and Y2O3 | |
| *Th and U included for informational purposes. No value is derived. | |
| S-K 1300 Technical Report Summary on the Songwe Hill REE Project | Page 196 of 489 |
| |
| 11.11.2 | Inclusive Mineral Resource |
Inclusive Mineral Resources are presented in order to be consistent with those reported by Mkango under the NI 43-101 standards and are not compliant with the S-K 1300 reporting standards.
The Mineral Resource estimate as at 30 June 2025, including those resources converted to Mineral Reserves, is presented in Table 11.16 to Table 11.20. In the QP’s opinion, the Mineral Resources reported herein at the selected cut-off grade have reasonable prospects for economic extraction, taking into consideration mining and processing assumptions.
The QP is of the opinion that with consideration of the recommendations summarised in Sections 23 of this TRS, any issues relating to technical and economic factors likely to influence the prospect of economic extraction can be resolved with further work.
The Mineral Resource is classified into the Measured, Indicated and Inferred categories as summarised in Table 11.16.
Table 11.16: Songwe Hill, Inclusive Mineral Resources above 0.55 % TREO Grade, 30 June 2025
| Category | Tonnes (Mt) |
TREO (%) |
TREO Tonnes (kt) |
| Measured | 13.6 | 1.27 | 173 |
| Indicated | 24.4 | 1.08 | 264 |
| Total Measured and Indicated | 38.1 | 1.15 | 437 |
| Inferred | 55.9 | 1.05 | 589 |
| NOTES: | |
| 1. | Mineral Resources have been classified in accordance with the S-K 1300 definitions, which are consistent with the CIM (2014) definitions. |
| 2. | All tabulated data has been rounded, and as a result minor computational errors may occur. |
| 3. | Mineral Resources, which are not Mineral Reserves, have no demonstrated economic viability. |
| 4. | The Mineral Resource estimate is reported on a 100 % ownership basis. |
| 5. | Mineral Resources are reported from within an optimised pit shell. |
| 6. | For the purposes of assessing reasonable prospects for economic extraction and cut-off grade, metallurgical recoveries were applied to individual rare earth oxides. The average total rare earth oxide metallurgical recovery is 39.6 %. |
| 7. | Mineral Resources include the portion converted to Mineral Reserves. |
| 8. | Mineral Resources are reported on an in-situ basis without applying modifying factors. |
| 9. | A mean density of 2.73 t/m3 was applied for Measured, 2.67 t/m3 for Indicated and 2.77 t/m3 for Inferred Resources. |
| TREO = La2O3, CeO2, Pr6O11, Nd2O3, Sm2O3, Eu2O3, Gd2O3, Tb4O7, Dy2O3, Ho2O3, Er2O3, Tm2O3, Yb2O3, Lu2O3, and Y2O3 TREO = La2O3, CeO2, Pr6O11, Nd2O3, Sm2O3, Eu2O3, Gd2O3, Tb4O7, Dy2O3, Ho2O3, Er2O3, Tm2O3, Yb2O3, Lu2O3, and Y2O3 | |
| S-K 1300 Technical Report Summary on the Songwe Hill REE Project | Page 197 of 489 |
| |
The Inclusive Mineral Resource estimate is reported by domain and category in Table 11.17.
Table 11.17: Songwe Hill, Inclusive Mineral Resources above 0.55 % TREO Grade within the Different Domains, 30 June 2025
| Domain | Class | Tonnes (Mt) |
TREO (%) |
TREO Tonnes (kt) |
| Carbonatite | Measured | 3.7 | 1.57 | 58 |
| Carbonatite | Indicated | 3.5 | 1.36 | 48 |
| Mixed | Measured | 7.1 | 1.26 | 89 |
| Mixed | Indicated | 11.2 | 1.16 | 130 |
| Fenite | Measured | 2.9 | 0.91 | 26 |
| Fenite | Indicated | 9.7 | 0.88 | 86 |
| Total | Measured | 13.6 | 1.27 | 173 |
| Total | Indicated | 24.4 | 1.08 | 264 |
| Total | Measured and Indicated | 38.1 | 1.15 | 437 |
| Carbonatite | Inferred | 8.5 | 1.44 | 123 |
| Mixed | Inferred | 21.2 | 1.13 | 239 |
| Fenite | Inferred | 26.2 | 0.87 | 227 |
| Total | Inferred | 55.9 | 1.05 | 589 |
| NOTES: | |
| 1. | Mineral Resources have been classified in accordance with the S-K 1300 definitions, which are consistent with the CIM (2014) definitions. |
| 2. | All tabulated data has been rounded, and as a result minor computational errors may occur. |
| 3. | Mineral Resources, which are not Mineral Reserves, have no demonstrated economic viability. |
| 4. | The Mineral Resource estimate is reported on a 100 % ownership basis. |
| 5. | Mineral Resources are reported from within an optimised pit shell. |
| 6. | For the purposes of assessing reasonable prospects for economic extraction and cut-off grade, metallurgical recoveries were applied to individual rare earth oxides. The average total rare earth oxide metallurgical recovery is 39.6 %. |
| 7. | Mineral Resources include the portion converted to Mineral Reserves. |
| 8. | Mineral Resources are reported on an in-situ basis without applying modifying factors. |
| 9. | A mean density of 2.73 t/m3 was applied for Measured, 2.67 t/m3 for Indicated and 2.77 t/m3 for Inferred Resources. |
| TREO = La2O3, CeO2, Pr6O11, Nd2O3, Sm2O3, Eu2O3, Gd2O3, Tb4O7, Dy2O3, Ho2O3, Er2O3, Tm2O3, Yb2O3, Lu2O3, and Y2O3 | |
| S-K 1300 Technical Report Summary on the Songwe Hill REE Project | Page 198 of 489 |
| |
The Mineral Resource is presented at a variety of cut-off grades as shown in Table 11.18 for the combined Measured and Indicated Mineral Resources and in Table 11.19 for the Inferred Mineral Resource. Table 11.20 shows the grades of the individual REOs for each class and domain.
Table 11.18: Songwe Hill, Inclusive Measured and Indicated Mineral Resources Grade Tonnage, 30 June 2025
|
Cut-Off |
Tonnes (Mt) |
TREO (%) |
TREO Tonnes (kt) |
| 0.45 | 40.2 | 1.11 | 448 |
| 0.55 | 38.1 | 1.15 | 437 |
| 0.65 | 35.2 | 1.19 | 420 |
| 0.75 | 31.7 | 1.25 | 396 |
| 0.85 | 27.8 | 1.31 | 365 |
| 1.00 | 21.9 | 1.41 | 310 |
| NOTES: | |
| 1. | Mineral Resources have been classified in accordance with the S-K 1300 definitions, which are consistent with the CIM (2014) definitions. |
| 2. | All tabulated data has been rounded, and as a result minor computational errors may occur. |
| 3. | Mineral Resources, which are not Mineral Reserves, have no demonstrated economic viability. |
| 4. | The Mineral Resource estimate is reported on a 100 % ownership basis. |
| 5. | Mineral Resources are reported from within an optimised pit shell. |
| 6. | For the purposes of assessing reasonable prospects for economic extraction and cut-off grade, metallurgical recoveries were applied to individual rare earth oxides. The average total rare earth oxide metallurgical recovery is 39.6 %. |
| 7. | Mineral Resources include the portion converted to Mineral Reserves. |
| 8. | Mineral Resources are reported on an in-situ basis without applying modifying factors. |
| 9. | A mean density of 2.73 t/m3 was applied for Measured, 2.67 t/m3 for Indicated and 2.77 t/m3 for Inferred Resources. |
| TREO = La2O3, CeO2, Pr6O11, Nd2O3, Sm2O3, Eu2O3, Gd2O3, Tb4O7, Dy2O3, Ho2O3, Er2O3, Tm2O3, Yb2O3, Lu2O3, and Y2O3 | |
| S-K 1300 Technical Report Summary on the Songwe Hill REE Project | Page 199 of 489 |
| |
Table 11.19: Songwe Hill, Inclusive Inferred Mineral Resources Grade Tonnage, 30 June 2025
|
Cut-Off |
Tonnes (Mt) |
TREO (%) |
TREO Tonnes (kt) |
| 0.45 | 59.7 | 1.02 | 608 |
| 0.55 | 55.9 | 1.05 | 589 |
| 0.65 | 49.9 | 1.11 | 553 |
| 0.75 | 43.5 | 1.17 | 508 |
| 0.85 | 37.0 | 1.23 | 456 |
| 1.00 | 28.1 | 1.33 | 373 |
| NOTES: | |
| 1. | Mineral Resources have been classified in accordance with the S-K 1300 definitions, which are consistent with the CIM (2014) definitions. |
| 2. | All tabulated data has been rounded, and as a result minor computational errors may occur. |
| 3. | Mineral Resources, which are not Mineral Reserves, have no demonstrated economic viability. |
| 4. | The Mineral Resource estimate is reported on a 100 % ownership basis. |
| 5. | Mineral Resources are reported from within an optimised pit shell. |
| 6. | For the purposes of assessing reasonable prospects for economic extraction and cut-off grade, metallurgical recoveries were applied to individual rare earth oxides. The average total rare earth oxide metallurgical recovery is 39.6 %. |
| 7. | Mineral Resources include the portion converted to Mineral Reserves. |
| 8. | Mineral Resources are reported on an in-situ basis without applying modifying factors. |
| 9. | A mean density of 2.73 t/m3 was applied for Measured, 2.67 t/m3 for Indicated and 2.77 t/m3 for Inferred Resources. |
| TREO = La2O3, CeO2, Pr6O11, Nd2O3, Sm2O3, Eu2O3, Gd2O3, Tb4O7, Dy2O3, Ho2O3, Er2O3, Tm2O3, Yb2O3, Lu2O3, and Y2O3 | |
| S-K 1300 Technical Report Summary on the Songwe Hill REE Project | Page 200 of 489 |
| |
Table 11.20: Songwe Hill, Inclusive Mineral Resources, Individual REOs at 0.55 % (5,500 ppm) TREO Cut-Off Grade within the Different Domains, 30 June 2025
| Domain | Class | Tonnes (Mt) | TREO (ppm) |
La2O3
(ppm) |
CeO2
(ppm) |
Pr6O11 (ppm) |
Nd2O3
(ppm) |
Sm2O3 (ppm) | Eu2O3
(ppm) |
Gd2O3
(ppm) |
Tb4O7
(ppm) |
Dy2O3 (ppm) |
Ho2O3 (ppm) |
Er2O3 (ppm) |
Tm2O3 (ppm) |
Yb2O3 (ppm) |
Lu2O3 (ppm) |
Y2O3 (ppm) |
Th* (ppm) |
U* (ppm) |
| Carbonatite | Measured | 3.7 | 15,731 | 3,687 | 7,123 | 757 | 2,547 | 366 | 100 | 237 | 29 | 136 | 22 | 52 | 7 | 38 | 5 | 624 | 338 | 12 |
| Carbonatite | Indicated | 3.5 | 13,631 | 3,298 | 6,199 | 640 | 2,113 | 310 | 85 | 204 | 25 | 117 | 19 | 45 | 6 | 33 | 4 | 533 | 330 | 12 |
| Mixed | Measured | 7.1 | 12,595 | 2,968 | 5,679 | 602 | 2,029 | 300 | 82 | 194 | 24 | 109 | 18 | 42 | 5 | 31 | 4 | 508 | 315 | 13 |
| Mixed | Indicated | 11.2 | 11,640 | 2,838 | 5,285 | 546 | 1,815 | 271 | 73 | 175 | 21 | 96 | 15 | 36 | 5 | 26 | 3 | 435 | 319 | 13 |
| Fenite | Measured | 2.9 | 9,081 | 2,115 | 4,067 | 436 | 1,488 | 234 | 63 | 149 | 18 | 79 | 13 | 30 | 4 | 22 | 3 | 362 | 276 | 14 |
| Fenite | Indicated | 9.7 | 8,824 | 2,042 | 3,950 | 423 | 1,454 | 228 | 61 | 144 | 17 | 77 | 12 | 30 | 4 | 22 | 3 | 359 | 294 | 14 |
| Total | Measured | 13.6 | 12,702 | 2,983 | 5,730 | 609 | 2,055 | 304 | 83 | 196 | 24 | 110 | 18 | 42 | 5 | 31 | 4 | 509 | 313 | 13 |
| Total | Indicated | 24.4 | 10,811 | 2,589 | 4,887 | 511 | 1,715 | 259 | 70 | 167 | 20 | 91 | 15 | 35 | 4 | 25 | 3 | 419 | 311 | 13 |
| Total | Measured and Indicated | 38.1 | 11,489 | 2,730 | 5,189 | 546 | 1,837 | 275 | 75 | 177 | 21 | 98 | 16 | 38 | 5 | 27 | 4 | 451 | 312 | 13 |
| Carbonatite | Inferred | 8.5 | 14,421 | 3,336 | 6,528 | 699 | 2,369 | 344 | 94 | 219 | 27 | 121 | 20 | 48 | 6 | 37 | 5 | 568 | 311 | 11 |
| Mixed | Inferred | 21.2 | 11,264 | 2,665 | 5,116 | 539 | 1,819 | 270 | 73 | 169 | 20 | 91 | 15 | 35 | 4 | 26 | 4 | 419 | 290 | 12 |
| Fenite | Inferred | 26.2 | 8,681 | 1,967 | 3,900 | 423 | 1,466 | 227 | 60 | 139 | 16 | 73 | 12 | 28 | 4 | 21 | 3 | 343 | 286 | 13 |
| Total | Inferred | 55.9 | 10,534 | 2,440 | 4,761 | 509 | 1,737 | 261 | 70 | 162 | 19 | 87 | 14 | 34 | 4 | 25 | 3 | 406 | 292 | 13 |
| NOTES: | |
| 1. | Mineral Resources have been classified in accordance with the S-K 1300 definitions, which are consistent with the CIM (2014) definitions. |
| 2. | All tabulated data has been rounded, and as a result minor computational errors may occur. |
| 3. | Mineral Resources, which are not Mineral Reserves, have no demonstrated economic viability. |
| 4. | The Mineral Resource estimate is reported on a 100 % ownership basis. |
| 5. | Mineral Resources are reported from within an optimised pit shell. |
| 6. | For the purposes of assessing reasonable prospects for economic extraction and cut-off grade, metallurgical recoveries were applied to individual rare earth oxides. The average total rare earth oxide metallurgical recovery is 39.6 %. |
| 7. | Mineral Resources include the portion converted to Mineral Reserves. |
| 8. | Mineral Resources are reported on an in-situ basis without applying modifying factors. |
| 9. | A mean density of 2.73 t/m3 was applied for Measured, 2.67 t/m3 for Indicated and 2.77 t/m3 for Inferred Resources. |
| TREO = La2O3, CeO2, Pr6O11, Nd2O3, Sm2O3, Eu2O3, Gd2O3, Tb4O7, Dy2O3, Ho2O3, Er2O3, Tm2O3, Yb2O3, Lu2O3, and Y2O3*Th and U included for informational purposes. No value is derived. | |
The Mineral Resources could be affected by further infill drilling, which may result in increases or decreases in subsequent Mineral Resource estimates. Inferred Mineral Resources are high-risk estimates that may change significantly with additional data. It cannot be assumed that all or part of an Inferred Mineral Resource will necessarily be upgraded to an Indicated Mineral Resource as a result of continued exploration. The Mineral Resources may also be affected by subsequent assessments of mining, environmental, processing, permitting, taxation, socio-economic and other factors.
| S-K 1300 Technical Report Summary on the Songwe Hill REE Project | Page 201 of 489 |
| |
| 12 | Mineral Reserve Estimates |
| 12.1 | Mining Limits |
Mining at Songwe Hill will be by open-pit mining methods. The orebody outcrops on surface and is well suited to open-pit mining. The mining design will consider all the ore types, and the limit of the mine design will be determined by a pit optimisation exercise.
| 12.2 | Geological Data for Mine Design |
The geological data provided to Bara Consulting (Pty) Ltd (Bara) by MSA, for purposes of mine design, included a geological block model with the parameters given in Table 11.5.
Figure 11.7 and Figure 11 show a plan and cross section through the model, respectively, indicating the ore by resource class. The block model file used by Bara in the mine design is a Datamine format block model file entitled “mkango_mod_fin2”.
Mkango completed a LiDAR survey, which provides an accurate model of the topography. The processed data was provided by Mkango as a DTM (see Figure 11.2).
| 12.3 | Pit Optimisation |
The pit optimisation objective was to determine the best case achievable to feed the plant at the highest grade of total rare earth oxide per cent (TREO_PCT) possible for the life of operations (LOO) based on the parameters described below. The initial optimisation was run with all the Type 1 ore considered as ROM.
| 12.3.1 | Material Definition |
The geological resource model was separated into various material types to run the pit optimisation. These fields were class, ore type, and TREO_PCT grade cut-off.
The class has three categories:
1 = Measured
2 = Indicated
3 = Inferred
The ore type is defined by the ratio between manganese and magnesium (Mn:Mg):
| ● | Type 1 ore is all the material with a ratio of Mn:Mg equal to or below 3.5 |
| ● | Type 2 material is all the material with a ratio of Mn:Mg above 3.5 |
The grade cut-off was determined as follows: all the material with a TREO_PCT above 0.6 % was deemed to be ore. The ore was then split between high-grade and medium-grade material (grade bins, coded in the block model as GRDTYPE):
| ● | High grade – TREO_PCT equal to and greater than 1.2 % (GRDTYPE=1) |
| ● | Medium grade – TREO_PCT less than 1.2 % but greater than and equal to 0.6 % (GRDTYPE=2) |
| ● | Low grade – TREO_PCT less than 0.6 % (GRDTYPE=0) |
| ● | Waste – Host rock |
In order to identify and report on the various material types, the material types were coded using a combination of numbers representing the ore type, class and grade bin.
| S-K 1300 Technical Report Summary on the Songwe Hill REE Project | Page 202 of 489 |
| |
| 12.3.1.1 | Block Model Data |
Table 12.1 summarises the block model statistics by material type. Figure 12.1 shows a grade tonnage curve of the Songwe Hill resource.
Table 12.1: Block Model Statistics by Material Type
| CLASS | OTYPE | GRDTYPE | Volume | Density | Mass | TREO_PCT | Al_PCT | Ca_PCT | Fe_PCT | Mg_PCT | Mn_PCT | Mn:Mg Ratio |
| Total Model | ||||||||||||
| All | All | All | 40,904,712 | 2.71 | 110,987,088 | 1.00 | 4.17 | 14.42 | 10.68 | 0.79 | 1.66 | 3.63 |
| Class Split | ||||||||||||
| 3 | All | All | 24,945,189 | 2.74 | 68,237,995 | 0.96 | 4.25 | 13.77 | 10.71 | 0.89 | 1.66 | 3.41 |
| 2 | All | All | 10,607,597 | 2.65 | 28,155,308 | 1.00 | 4.47 | 14.45 | 10.45 | 0.59 | 1.64 | 4.43 |
| 1 | All | All | 5,351,926 | 2.73 | 14,593,785 | 1.21 | 3.23 | 17.38 | 10.94 | 0.73 | 1.69 | 3.08 |
| Class and Ore Type Split | ||||||||||||
| 3 | 2 | All | 8,067,947 | 2.55 | 20,570,860 | 0.84 | 5.27 | 11.83 | 12.17 | 0.28 | 1.94 | 7.79 |
| 3 | 1 | GRDTYPE | 16,877,242 | 2.82 | 47,667,135 | 1.02 | 3.81 | 14.61 | 10.08 | 1.15 | 1.54 | 1.53 |
| 2 | 2 | All | 5,139,396 | 2.60 | 13,347,329 | 1.07 | 4.34 | 15.03 | 11.41 | 0.29 | 1.87 | 7.25 |
| 2 | 1 | GRDTYPE | 5,468,201 | 2.71 | 14,807,978 | 0.93 | 4.58 | 13.92 | 9.59 | 0.87 | 1.42 | 1.89 |
| 1 | 1 | All | 3,678,389 | 2.76 | 10,154,533 | 1.20 | 3.18 | 17.50 | 10.32 | 0.89 | 1.58 | 2.02 |
| 1 | 2 | GRDTYPE | 1,673,537 | 2.65 | 4,439,252 | 1.24 | 3.33 | 17.10 | 12.35 | 0.38 | 1.92 | 5.51 |
| Class, Ore Type and Grade Cut-Off | ||||||||||||
| 1 | 1 | 0 | 369,090 | 2.70 | 998,253 | 0.46 | 6.56 | 9.30 | 7.68 | 0.82 | 0.99 | 1.69 |
| 1 | 1 | 1 | 1,653,066 | 2.81 | 4,641,178 | 1.66 | 1.87 | 20.42 | 11.32 | 0.98 | 1.85 | 2.12 |
| 1 | 1 | 2 | 1,656,233 | 2.73 | 4,515,102 | 0.90 | 3.77 | 16.32 | 9.87 | 0.81 | 1.44 | 2.00 |
| 1 | 2 | 0 | 90,940 | 2.57 | 233,648 | 0.47 | 7.54 | 7.12 | 7.67 | 0.25 | 1.19 | 4.99 |
| 1 | 2 | 1 | 813,320 | 2.69 | 2,183,943 | 1.58 | 2.38 | 19.08 | 13.57 | 0.41 | 2.12 | 5.58 |
| S-K 1300 Technical Report Summary on the Songwe Hill REE Project | Page 203 of 489 |
| |
| CLASS | OTYPE | GRDTYPE | Volume | Density | Mass | TREO_PCT | Al_PCT | Ca_PCT | Fe_PCT | Mg_PCT | Mn_PCT | Mn:Mg Ratio |
| 1 | 2 | 2 | 769,277 | 2.63 | 2,021,662 | 0.96 | 3.87 | 16.12 | 11.58 | 0.35 | 1.78 | 5.49 |
| 2 | 1 | 0 | 1,427,795 | 2.61 | 3,730,291 | 0.46 | 6.75 | 9.20 | 7.66 | 0.71 | 0.98 | 1.74 |
| 2 | 1 | 1 | 1,305,016 | 2.77 | 3,614,446 | 1.53 | 2.90 | 16.94 | 11.37 | 1.02 | 1.87 | 2.04 |
| 2 | 1 | 2 | 2,735,390 | 2.73 | 7,463,242 | 0.88 | 4.30 | 14.82 | 9.69 | 0.87 | 1.43 | 1.89 |
| 2 | 2 | 0 | 423,957 | 2.55 | 1,082,623 | 0.49 | 7.16 | 8.23 | 8.38 | 0.24 | 1.24 | 5.60 |
| 2 | 2 | 1 | 1,533,684 | 2.63 | 4,027,574 | 1.52 | 3.03 | 17.71 | 13.23 | 0.34 | 2.24 | 7.59 |
| 2 | 2 | 2 | 3,181,754 | 2.59 | 8,237,132 | 0.92 | 4.62 | 14.61 | 10.92 | 0.27 | 1.77 | 7.30 |
| 3 | 1 | 0 | 2,919,655 | 2.61 | 7,620,157 | 0.45 | 6.71 | 8.59 | 7.70 | 0.76 | 1.01 | 1.68 |
| 3 | 1 | 1 | 5,186,030 | 2.94 | 15,226,571 | 1.49 | 2.26 | 17.92 | 11.09 | 1.33 | 1.78 | 1.43 |
| 3 | 1 | 2 | 8,771,557 | 2.83 | 24,820,407 | 0.90 | 3.86 | 14.42 | 10.19 | 1.16 | 1.55 | 1.54 |
| 3 | 2 | 0 | 1,563,349 | 2.49 | 3,900,408 | 0.50 | 7.04 | 7.44 | 10.38 | 0.26 | 1.51 | 6.16 |
| 3 | 2 | 1 | 807,521 | 2.61 | 2,105,307 | 1.44 | 3.55 | 15.29 | 13.96 | 0.32 | 2.40 | 9.06 |
| 3 | 2 | 2 | 5,697,077 | 2.56 | 14,565,145 | 0.85 | 5.04 | 12.51 | 12.39 | 0.28 | 1.98 | 8.04 |
| Total | 40,904,712 | 2.71 | 110,987,088 | 1.00 | 4.17 | 14.42 | 10.68 | 0.79 | 1.66 | 3.63 |
| S-K 1300 Technical Report Summary on the Songwe Hill REE Project | Page 204 of 489 |
| |
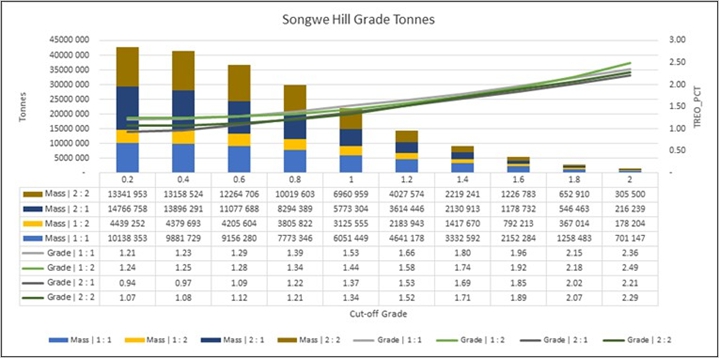
Figure 12.1: Grade versus Tonnage Curve
| S-K 1300 Technical Report Summary on the Songwe Hill REE Project | Page 205 of 489 |
| |
| 12.3.2 | Optimisation Parameters |
A set of optimisation input parameters was prepared based on the data available at the time.
Mining costs were based on budget estimates obtained from a mining contractor. The processing cost was provided by SENET. The general and administrative costs were estimated by Bara.
The slope angles were based on the 2022 DFS geotechnical report
Product prices and separation costs were provided by Mkango.
Table 12.2 shows the parameters used in the pit optimisation.
Table 12.2: Pit Optimisation Input Parameters
| Item | Value | Unit | Comments/Source |
| Operating Cost | |||
| Waste | |||
| Mining Cost – Free Dig | 3.50 | US$/t mined | Trollope Mining Services, 2025 |
| Mining Cost – Drill and Blast | 4.73 | US$/t mined | Trollope Mining Services, 2025 |
| Ore | |||
| Mining Cost – Free Dig | 2.92 | US$/t mined | Trollope Mining Services, 2025 |
| Mining Cost – Drill and Blast | 4.15 | US$/t mined | Trollope Mining Services, 2025 |
| Mining Time-Related Costs | 4.89 | US$/t mined | Trollope Mining Services, 2025 |
| Process Cost | 101.15 | US$/t milled | SENET |
| Technical | |||
| Slope Angles (Sector 1) | 49 | degrees | Geotechnical report |
| Slope Angles (Sector 2) | 44 | degrees | Geotechnical report |
| Slope Angles (Sectors 3 and 4) | 40 | degrees | Geotechnical report |
| Slope Angles (Sector 5) | 43 | degrees | Geotechnical report |
| Slope Angles (Sector 6) | 46 | degrees | Geotechnical report |
| Slope Angles (Sector 7) | 36 | degrees | Geotechnical report |
| Mining Dilution | 3 | % | Bara |
| Mining Loss | 5 | % | Bara |
| Bench Height | 10 | m | Bara |
| Metallurgical Recovery | 40 | % | Mkango (Weighted average recovery to carbonate) |
| Ore Production Rate | 83,333 | t/month | Per month – ORE only |
| Ore Production Rate | 1,000,000 | t/a |
| S-K 1300 Technical Report Summary on the Songwe Hill REE Project | Page 206 of 489 |
| |
| Item | Value | Unit | Comments/Source |
| Economic | |||
| Royalties | 5 | % | Covered in basket price calculation |
| TREO Price (Basket Price) | 40.86 | US$/kg | Basket price per kilogram of TREO recovered to carbonate |
| Discount Factor to Use | 7.3 | % | Mkango |
The basket price of the TREO product sold as carbonate was calculated based on the individual rare earth prices and associated process plant recoveries presented in Table 12.3. A discount of 27 % was applied to the rare earth prices to account for the product being sold as carbonate. The prices are based on the base case Adamas forecasted annual average prices for each REO until 2040 (see Section 16), and the processing recovery to carbonate is based on the work reported in Section 14.
Table 12.3: TREO Prices used in Pit Optimisation for Mineral Reserve Estimate
| REO | REO
Price (Adamas, 2025, Average, First 5-Years’ Production) (US$/kg) |
REO
Price after Carbonate Discount of 27 % (US$/kg) |
REO
Split in Resource (%) |
REO
Split in Product (Carbonate) (%) |
REO
Recovery (Mine to Carbonate) (%) |
| La2O3 | 1.39 | 1.01 | 24.46 | 39.07 | 63.24 |
| CeO2 | 1.45 | 1.06 | 45.59 | 18.38 | 15.96 |
| Pr6O11 | 142.00 | 103.66 | 4.72 | 7.70 | 64.48 |
| Nd2O3 | 142.00 | 103.66 | 15.64 | 25.10 | 63.52 |
| Sm2O3 | 3.75 | 2.74 | 2.26 | 3.31 | 58.08 |
| Eu2O3 | 33.80 | 24.67 | 0.61 | 0.85 | 55.62 |
| Gd2O3 | 75.69 | 55.25 | 1.44 | 1.86 | 50.91 |
| Tb4O7 | 1,407.56 | 1,027.52 | 0.18 | 0.20 | 45.20 |
| Dy2O3 | 457.00 | 333.61 | 0.79 | 0.74 | 36.75 |
| Y2O3 | 8.00 | 5.84 | 3.60 | 2.40 | 26.39 |
| Ho2O3 | 155.38 | 113.43 | 0.13 | 0.10 | 29.65 |
| Er2O3 | 57.65 | 42.09 | 0.30 | 0.17 | 23.17 |
| Tm2O3 | 150.00 | 109.50 | 0.04 | 0.02 | 21.64 |
| Yb2O3 | 16.34 | 11.93 | 0.22 | 0.10 | 17.87 |
| Lu2O3 | 879.40 | 641.96 | 0.03 | 0.01 | 14.41 |
| Basket | 55.98 | 40.86 | 100.00 | 40 |
Applying the process recovery of 40 % to the weighted average basket price recovered results in a basket price per tonne of ore mined of US$16.18 per kg of contained REO.
| S-K 1300 Technical Report Summary on the Songwe Hill REE Project | Page 207 of 489 |
| |
Only Type 1 ore Measured and Indicated Resources were considered for processing in the pit optimisation model. In this report, no processing of Type 2 material is considered. Type 2 material will be treated as waste in the pit optimisation and future financial modelling exercises, but it will be stockpiled separately so that it can be accessed for processing in future should a viable processing solution be developed.
Inferred Resources were not considered for processing and report to the waste material bin.
The pit optimisation was undertaken using Deswik Pseudoflow®, a module of the Deswik® suite of mine design and scheduling software.
| 12.3.3 | Results of Pit Optimisation |
The results of the optimisation exercise are presented in Figure 12.2 and Table 12.4.
| S-K 1300 Technical Report Summary on the Songwe Hill REE Project | Page 208 of 489 |
| |
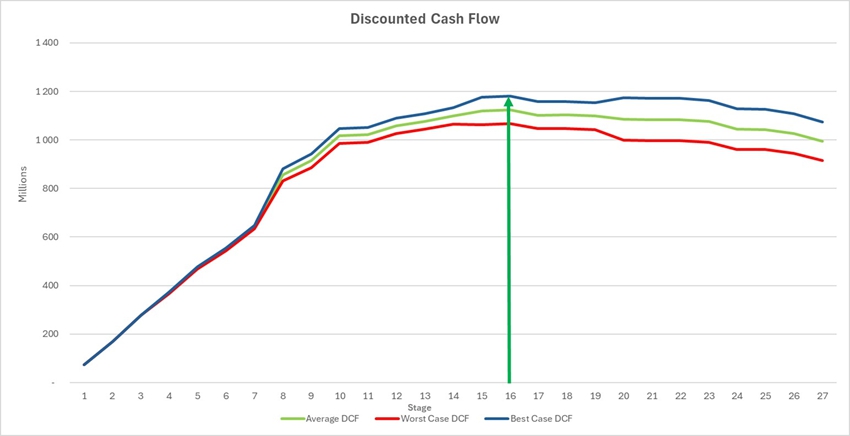
Figure 12.2: Discounted Cash Flow by Pit Shell
| S-K 1300 Technical Report Summary on the Songwe Hill REE Project | Page 209 of 489 |
| |
Based on the results presented in Figure 12.2, the optimum pit shell, where the net present value (NPV) is maximised, on the average case curve, is pit shell Number 16. The material contents and grade of Shell 16 are highlighted in Table 12.4.
Table 12.4: Material Contents of Pit Optimisation Shells
| Stage | Total (t) | Waste (t) | Type 2 Material (t) | Type 1 Ore (t) |
| 1 | 981,416 | 310,062 | 126,714 | 544,641 |
| 2 | 3,037,150 | 877,635 | 666,823 | 1,492,692 |
| 3 | 5,944,787 | 1,243,729 | 1,919,410 | 2,781,649 |
| 4 | 7,966,011 | 1,369,873 | 2,515,948 | 4,080,190 |
| 5 | 10,587,780 | 1,961,889 | 2,987,407 | 5,638,484 |
| 6 | 12,706,489 | 2,412,039 | 3,536,805 | 6,757,646 |
| 7 | 15,451,382 | 2,853,839 | 4,388,850 | 8,208,693 |
| 8 | 22,874,488 | 4,990,844 | 5,913,968 | 11,969,676 |
| 9 | 25,236,124 | 5,731,742 | 6,604,246 | 12,900,136 |
| 10 | 31,298,763 | 8,863,349 | 7,324,894 | 15,110,519 |
| 11 | 31,513,413 | 8,967,493 | 7,376,020 | 15,169,900 |
| 12 | 35,612,726 | 11,636,634 | 7,790,428 | 16,185,663 |
| 13 | 40,030,173 | 14,624,538 | 8,222,105 | 17,183,530 |
| 14 | 44,027,084 | 16,964,091 | 8,860,983 | 18,202,011 |
| 15 | 48,201,042 | 19,039,560 | 9,767,789 | 19,393,692 |
| 16 | 49,251,015 | 19,494,803 | 10,151,289 | 19,604,923 |
| 17 | 59,773,211 | 28,683,235 | 10,439,110 | 20,650,866 |
| 18 | 59,820,496 | 28,696,945 | 10,443,274 | 20,680,276 |
| 19 | 64,417,538 | 32,464,565 | 10,695,150 | 21,257,823 |
| 20 | 68,134,601 | 35,743,579 | 10,820,808 | 21,570,215 |
| 21 | 72,748,098 | 39,042,363 | 11,267,146 | 22,438,590 |
| 22 | 75,747,256 | 40,657,123 | 12,173,711 | 22,916,422 |
| 23 | 78,064,733 | 42,604,797 | 12,311,842 | 23,148,095 |
| 24 | 87,195,326 | 50,417,635 | 13,152,567 | 23,625,125 |
| 25 | 87,665,221 | 50,730,497 | 13,297,056 | 23,637,667 |
| 26 | 92,426,565 | 54,719,567 | 13,817,450 | 23,889,549 |
| 27 | 102,647,840 | 62,579,693 | 15,678,201 | 24,389,946 |
In order to maximise the NPV, while maintaining an acceptable LOO, a number of scenarios were tested applying the following:
| ● | A cut-off grade varying from 0.55 % to 1.2 % TREO |
| ● | Varying cut-off grades over time |
The scenarios given in Table 12.5 were tested.
| S-K 1300 Technical Report Summary on the Songwe Hill REE Project | Page 210 of 489 |
| |
Table 12.5: Cut-Off Grade Scenarios Tested
| Cut-Off Grade Phase 1 | Period | ||
| 0.6 % TREO | LOO | ||
| 0.8 % TREO | LOO | ||
| 1.0 % TREO | LOO | ||
| 1.2 % TREO | LOO | ||
| VARYING CUT-OFF GRADE | |||
| Cut-Off Grade Phase 1 | Period | Cut-Off Grade Phase 2 | Period |
| 1.2 % TREO | 5 years | 0.6 % TREO | Remaining LOO |
| 0.8 % TREO | |||
An LOO of at least 15 years at a processing rate of 1.0 Mt/a was required by Mkango, provided that the schedule supported a viable financial result.
The results of the various scenarios tested are given in Table 12.6.
Table 12.6: Results of the Cut-Off Grade Scenarios Tested
| Scenario | Cut-Off Grade | ROM Tonnes | ROM
Grade (% TREO) |
Waste Tonnes | Strip Ratio |
| 1 | 0.60 % | 18,213,194 | 1.15 | 35,320,013 | 1.94 |
| 2 | 0.80 % | 14,246,194 | 1.27 | 34,003,657 | 2.39 |
| 3 | 1.00 % | 11,341,066 | 1.39 | 42,506,076 | 3.75 |
| 4 | 1.20 % | 7,850,222 | 1.53 | 38,183,838 | 4.86 |
The ore tonnes resulting from the 1.2 % and 1.0 % TREO cut-off grades were insufficient to support the required LOO at the targeted production rate of 1.0 Mt/a, so the pit optimisation was then rerun using the Type 1 ore Measured and Indicated cut-off grades of 0.6 % and 0.8 %, respectively. These options resulted in a lower grade to the plant, which proved unviable.
Options considering a varying cut-off grade over time were then considered. A higher cut-off grade was applied in the earlier years of the LOO, with the aim of maintaining a higher grade during the Project payback period and then reducing the cut-off grade later in the LOO. Lower-grade ore, below the Stage 1 cut-off grade, mined in the earlier years will be stockpiled and processed later in the LOO. Table 12.7 shows the results for the options considered using a varying cut-off grade.
Table 12.7: Varying Cut-Off Grade Scenarios Tested
| Scenario | Cut-Off Grade | ROM Tonnes | ROM
Grade (% TREO) |
Waste Tonnes | Strip Ratio |
| 5 | 1.2 %, 0.6 % | 18,261,011 | 1.22 | 46,236,506 | 2.53 |
| 6 | 1.2 %, 0.8 % | 13,699,377 | 1.34 | 42,907,143 | 3.13 |
Option 5, a Phase 1 cut-off grade of 1.2 % TREO for a period of approximately five years, followed by a cut-off grade of 0.6 % thereafter, was selected as the preferred option, based on an acceptable early grade resulting in early cash flow and payback of capital and a suitably long and sustained LOO.
The combination of the two cut-off grades resulted in a two-phased pit. The contents of nested pit shells within each phase of the pit are given in Table 12.8.
| S-K 1300 Technical Report Summary on the Songwe Hill REE Project | Page 211 of 489 |
| |
Table 12.8: Results of Two-Phased Pit Optimisation
| Stage | Total Tonnes | Waste Tonnes | SR | MAT2 Tonnes | MAT3 Tonnes | MAT4 Tonnes | MAT1 Tonnes | MAT1 ROM Tonnes | TREO_DIL MAT1 | Mn_DIL MAT1 | Mg_DIL MAT1 | Fe_DIL MAT1 | Ca_DIL MAT1 | MngRT_DIL MAT1 | MAT2 ROM Tonnes | TREO_DIL MAT2 | Mn_DIL MAT2 | Mg_DIL MAT2 | Fe_DIL MAT2 | Ca_DIL MAT2 | Mn:Mg_DIL MAT2 |
| Phase 1: 1.2 % Cut-off grade – Revenue factor: 0.00 to 0.49 | |||||||||||||||||||||
| 1 | 1,481,412 | 873,669 | 1.95 | 61,031 | 99,522 | - | 447,190 | 446,072 | 2.00 | 1.86 | 1.21 | 9.86 | 20.62 | 1.54 | 60,878 | 1.60 | 1.74 | 0.35 | 11.85 | 15.25 | 4.97 |
| 2 | 2,743,002 | 1,370,944 | 1.90 | 503,235 | 146,120 | - | 722,703 | 720,896 | 1.60 | 1.83 | 0.91 | 10.59 | 18.73 | 2.02 | 501,977 | 1.62 | 2.12 | 0.37 | 13.25 | 16.57 | 5.80 |
| 3 | 4,607,969 | 2,353,249 | 1.77 | 820,100 | 102,269 | - | 1,332,351 | 1,329,021 | 1.49 | 1.76 | 0.80 | 10.88 | 17.64 | 2.20 | 818,050 | 1.60 | 2.15 | 0.41 | 13.28 | 16.77 | 5.20 |
| 4 | 2,920,728 | 1,472,588 | 2.18 | 306,925 | 466,929 | 13 | 674,274 | 672,588 | 1.54 | 1.79 | 0.93 | 10.52 | 17.64 | 1.92 | 306,157 | 1.50 | 2.16 | 0.40 | 13.37 | 17.39 | 5.40 |
| 5 | 5,556,400 | 3,188,498 | 2.69 | 851,049 | 318,514 | 14,647 | 1,183,692 | 1,180,733 | 1.49 | 1.78 | 0.93 | 11.12 | 18.17 | 1.92 | 848,922 | 1.42 | 2.09 | 0.38 | 14.09 | 18.09 | 5.47 |
| 6 | 5,427,302 | 3,298,644 | 3.16 | 570,611 | 482,054 | 30,744 | 1,045,249 | 1,042,636 | 1.50 | 1.75 | 1.01 | 11.04 | 16.98 | 1.74 | 569,185 | 1.46 | 2.07 | 0.37 | 13.99 | 16.85 | 5.55 |
| Total | 22,736,812 | 12,557,592 | 2.32 | 3,112,951 | 1,615,407 | 45,404 | 5,405,458 | 5,391,945 | 1.56 | 1.78 | 0.93 | 10.79 | 18.02 | 1.93 | 3,105,169 | 1.52 | 2.11 | 0.39 | 13.61 | 17.15 | 5.45 |
| Phase 2: 0.6 % Cut-off grade – Revenue factor: 0.50 to 0.98 | |||||||||||||||||||||
| 7 | 2,416,045 | 533,441 | 0 | 638,349 | 83,478 | 28,463 | 1,132,314 | 1,129,484 | 1.19 | 1.56 | 0.86 | 10.29 | 16.21 | 1.81 | 636,754 | 1.24 | 2.09 | 0.37 | 14.94 | 15.12 | 5.65 |
| 8 | 2,032,531 | 437,303 | 1 | 500,714 | 176,442 | 56,490 | 861,581 | 859,427 | 1.17 | 1.54 | 0.87 | 9.92 | 16.15 | 1.77 | 499,462 | 1.18 | 1.88 | 0.35 | 12.19 | 16.11 | 5.44 |
| 9 | 318,033 | 51,442 | 0 | 26,190 | 39,324 | 8,418 | 192,659 | 192,177 | 1.14 | 1.39 | 0.98 | 9.04 | 15.53 | 1.42 | 26,125 | 1.07 | 1.81 | 0.31 | 11.91 | 15.41 | 5.79 |
| 10 | 4,243,248 | 735,439 | 0 | 1,536,451 | 155,868 | 12,965 | 1,802,524 | 1,798,018 | 1.13 | 1.52 | 0.84 | 10.12 | 15.69 | 1.82 | 1,532,610 | 1.07 | 1.71 | 0.30 | 10.68 | 14.74 | 5.74 |
| 11 | 2,080,171 | 616,263 | 1 | 255,346 | 256,461 | 98,381 | 853,720 | 851,585 | 1.15 | 1.51 | 0.94 | 9.90 | 15.78 | 1.60 | 254,708 | 1.26 | 1.97 | 0.36 | 14.32 | 13.64 | 5.53 |
| 12 | 2,857,084 | 913,295 | 1 | 506,844 | 291,660 | 64,974 | 1,080,310 | 1,077,610 | 1.16 | 1.55 | 0.95 | 10.46 | 16.70 | 1.63 | 505,577 | 1.22 | 1.93 | 0.37 | 12.72 | 15.97 | 5.17 |
| 13 | 5,011,578 | 1,941,118 | 1 | 531,357 | 823,371 | 229,315 | 1,486,417 | 1,482,701 | 1.15 | 1.52 | 0.93 | 10.05 | 16.91 | 1.64 | 530,029 | 1.20 | 1.82 | 0.34 | 11.90 | 12.58 | 5.44 |
| 14 | 1,941,156 | 180,354 | 0 | 1,015,009 | 52,873 | 157,712 | 535,208 | 533,870 | 1.09 | 1.58 | 0.67 | 10.16 | 17.42 | 2.34 | 1,012,472 | 1.15 | 1.87 | 0.32 | 10.92 | 17.98 | 5.87 |
| 15 | 3,029,346 | 928,075 | 1 | 584,698 | 393,267 | 180,089 | 943,216 | 940,858 | 1.06 | 1.49 | 0.80 | 9.93 | 16.47 | 1.85 | 583,236 | 1.09 | 1.73 | 0.30 | 10.37 | 16.30 | 5.69 |
| 16 | 4,298,474 | 1,170,084 | 1 | 983,417 | 640,284 | 340,515 | 1,164,175 | 1,161,264 | 0.99 | 1.45 | 0.85 | 9.66 | 14.61 | 1.70 | 980,958 | 1.03 | 1.62 | 0.28 | 9.43 | 15.80 | 5.87 |
| 17 | 3,232,469 | 873,020 | 1 | 704,304 | 642,985 | 172,006 | 840,153 | 838,053 | 0.95 | 1.40 | 0.88 | 9.33 | 14.88 | 1.60 | 702,543 | 1.01 | 1.64 | 0.26 | 9.17 | 16.99 | 6.22 |
| 18 | 4,899,480 | 1,521,583 | 1 | 755,498 | 978,161 | 597,371 | 1,046,868 | 1,044,251 | 0.93 | 1.46 | 0.84 | 9.61 | 14.85 | 1.74 | 753,609 | 0.93 | 1.67 | 0.28 | 10.32 | 14.48 | 5.95 |
| 19 | 5,355,439 | 1,993,907 | 2 | 702,582 | 798,979 | 943,564 | 916,407 | 914,116 | 0.87 | 1.43 | 0.87 | 9.61 | 14.83 | 1.65 | 700,826 | 0.87 | 1.78 | 0.25 | 11.10 | 12.06 | 7.06 |
| Total | 41,715,052 | 11,895,324 | 0.93 | 8,740,760 | 5,333,153 | 2,890,261 | 12,855,553 | 12,823,414 | 1.08 | 1.50 | 0.87 | 9.93 | 15.84 | 1.74 | 8,718,908 | 1.08 | 1.78 | 0.31 | 11.13 | 15.30 | 5.85 |
| TOTAL | 64,451,864 | 24,452,917 | 1.34 | 11,853,711 | 6,948,560 | 2,935,665 | 18,261,011 | 18,215,359 | 1.22 | 1.58 | 0.89 | 10.18 | 16.49 | 1.80 | 11,824,077 | 1.20 | 1.87 | 0.33 | 11.78 | 15.78 | 5.74 |
| S-K 1300 Technical Report Summary on the Songwe Hill REE Project | Page 212 of 489 |
| |
Based on the results, the 0.6 % TREO_PCT cut-off grade produced the most favourable pit shells.
Phase 1 (1.2 % cut-off) is to Stage 6, and Phase 2 (0.6 % cut-off grade) is from Stage 7 to Stage 19. When the varying cut-off grades were applied, Pit 19 as the ultimate pit shell resulted in the maximum NPV.
The pit shells will be used as a guide for the ultimate pit designs. Cross sections and plan views illustrating the pit shells are shown below (see Table 12.9 for the legend to the colours used in Figure 12.3 to Figure 12.6).
Table 12.9: Legend for the Pit Shells
| Pit Shell | Colour |
| Phase 1 | |
| Phase 2 | |
| Material Type | Colour (code) |
| Measured, Type 1 Ore | 1_1 |
| Measured, Type 2 Material | 1_2 |
| Indicated, Type 1 Ore | 2_1 |
| Indicated, Type 2 Material | 2_2 |
| Inferred, Type 1 Ore | 3_1 |
| Inferred, Type 2 Material | 3_2 |
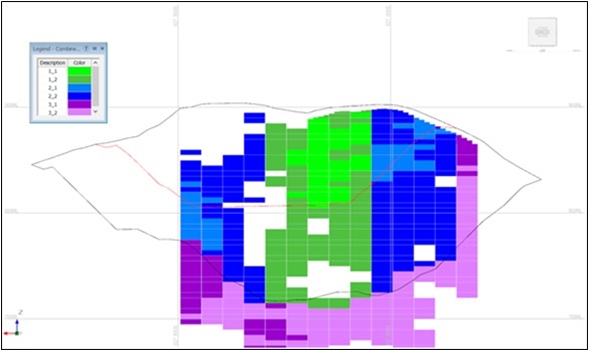
Figure 12.3: Phase 1 and 2 Pit Shells EW Section
| S-K 1300 Technical Report Summary on the Songwe Hill REE Project | Page 213 of 489 |
| |
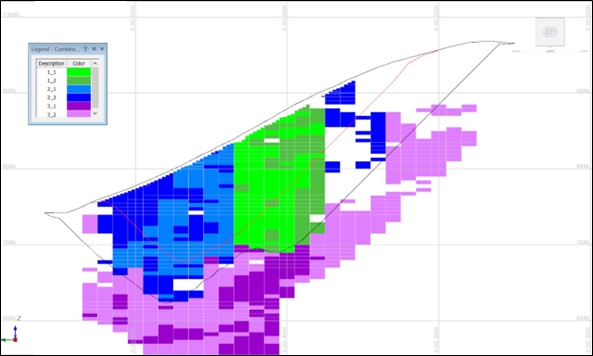
Figure 12.4: Phase 1 and 2 Pit Shells NS Section
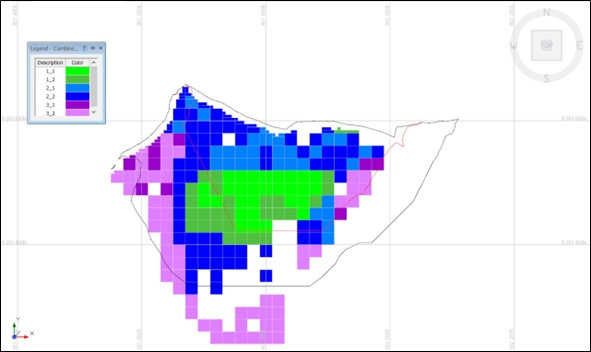
Figure 12.5: Phase 1 and 2 Pit Shells Plan View 800 m Elevation
| S-K 1300 Technical Report Summary on the Songwe Hill REE Project | Page 214 of 489 |
| |

Figure 12.6: Phase 1 and 2 Plan View 700 m Elevation
| 12.4 | Pit DeSign |
| 12.4.1 | Pit Design Overview |
The pit design was structured around the strategy of Phase 1 accessing high-grade Type 1 ore for the first five years and stockpiling any medium-grade Type 1 ore to feed as ROM at a later stage. The high-grade pit shell from the pit optimisation was used as a guide for the design of the first five-year pit.
The ultimate pit pushback Phase 2 was then designed to the ultimate pit limits, and the ultimate pit shell from the pit optimisation was used as a guide. The designs also took into consideration the following:
| ● | Mine design criteria |
| ● | Geotechnical slope designs |
| ● | Bench configuration |
| ● | Access |
Figure 12.7 and Figure 12.8 show a general plan and cross section looking east of the ultimate pit design.
| S-K 1300 Technical Report Summary on the Songwe Hill REE Project | Page 215 of 489 |
| |
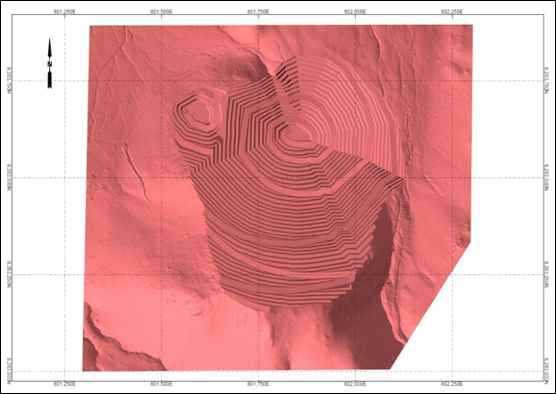
Figure 12.7: Plan View of Final Open Pit
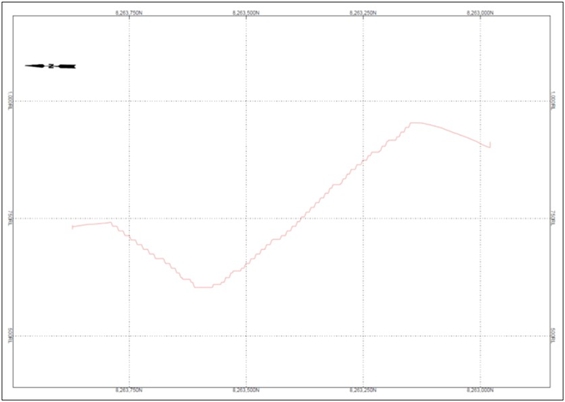
Figure 12.8: Cross Section Looking East of Final Open Pit
| S-K 1300 Technical Report Summary on the Songwe Hill REE Project | Page 216 of 489 |
| |
| 12.4.2 | Design Criteria |
The following pit design parameters were considered for the design of the open pit:
| ● | Berm width – Varied based on geotechnical requirements |
| ● | Batter angle (bench face angle) – Varied based on geotechnical requirements |
| ● | Bench height – 10 m |
| ● | Inter-ramp angle (IRA) limits – Varied based on geotechnical requirements |
| ● | Overall slope angle (OSA) limits – Varied based on geotechnical requirements |
| ● | Ramp width – 15 m based on a 40 t articulated dump truck |
| ● | Ramp gradient – 10 % |
| ● | Switchback width and gradient – As per ramp width |
| ● | Minimum radius for curves – 30 m |
| ● | Minimum mining width (pit bottom, bench ends, stage cutback widths) – Minimum of 20 m by 20 m mining blocks were considered |
| ● | Preferred effective bench mining width – Not less than 20 m |
| 12.4.2.1 | Geotechnical Slope Design |
The slope designs were based on the design criteria set out in the geotechnical report and discussed in Section 13.2.
The geotechnical domain minimum bench widths and stack angle were applied to each design sector to ensure that the berm width was within the geotechnical requirements.
The designed pit overall slope angles for each sector are all within the geotechnical design requirements and are given in Table 12.10.
Table 12.10: Pit Design versus Specified Slope Angles
| Design Sector | Overall
Slope Angle Geotechnical Requirement (°) |
Overall Slope Angle from Design (°) |
| 1 | 47 | 40.5 |
| 2 | 44 | 43.4 |
| 3 and 4 | 40 | 39.8 |
| 5 | 42 | 40.0 |
| 6 | 43 | 41.6 |
| 7 | 39 | 36.8 |
| 12.4.2.2 | Access Ramp |
The access ramp was designed at a 15 m width and a slope of 10 %. The pit exit was determined by the flatter terrain to the east portion of the orebody on the 760 m elevation. This allowed for the ramp to access both the hill and the deeper section of the orebody from the same access point. The strategy to access early higher-grade Type 1 ore was also considered, and this access point also allowed for the pushback to the ultimate pit to be from the same ramp position.
| S-K 1300 Technical Report Summary on the Songwe Hill REE Project | Page 217 of 489 |
| |
| 12.4.3 | Ultimate Pit Design Volumes |
Figure 12.9 to Figure 12.11 illustrate the Phase 1 and 2 (ultimate pit) designs and the pit optimisation shells on which the designs were based. Table 12.11 shows a comparison of the designed pit volumes and the pit optimisation shells.
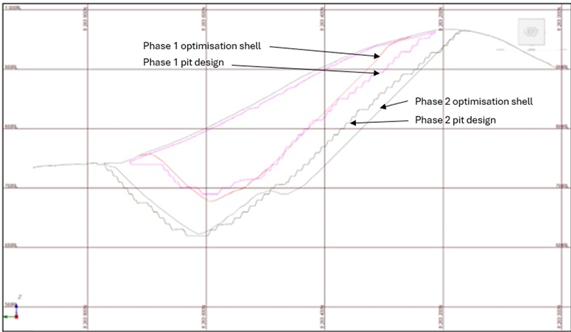
Figure 12.9:
Cross Section (Looking East) Showing Pit Optimisation Shells and
Pit Designs
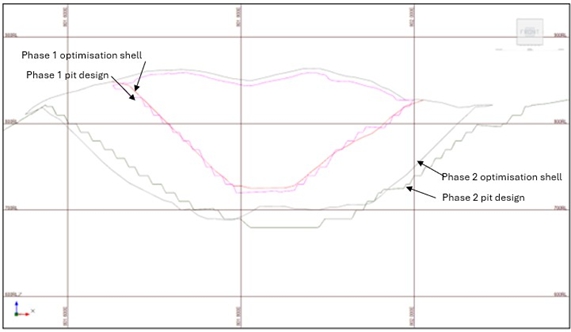
Figure 12.10: Cross Section (Looking South) Showing Pit Optimisation Shells and Pit Design
| S-K 1300 Technical Report Summary on the Songwe Hill REE Project | Page 218 of 489 |
| |
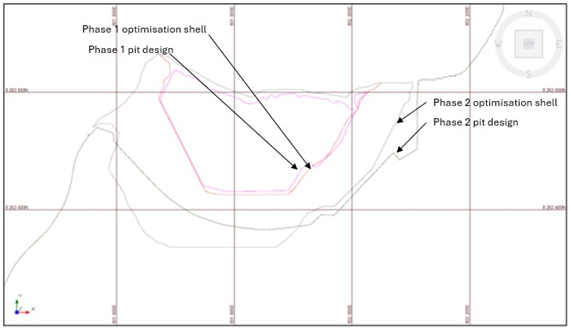
Table 12.11: Pit Design Versus Pit Optimisation Shell Comparison
| Description | Pit Optimisation Shell (19) | Pit Design |
| Waste Tonnes | 43,159,715 | 40,553,931 |
| Type 1 Ore Tonnes | 21,257,823 | 18,147,781 |
| TREO % | 1.09 | 1.16 |
| TREO (t) | 231,010 | 210,984 |
The final designed pit contains 2.6 Mt less waste and 3 Mt less ore than the pit optimisation shell, resulting in a stripping ratio of 2.23. This is due to the final ramp design against the hill having a zigzag pattern and switchbacks as well as the slope angle required for that geotechnical sector.
| 12.4.4 | Mining Modifying Factors |
Only Measured and Indicated Mineral Resources have been considered in the mine plan. Inferred Resources were not considered as ore. Although Inferred Resources were included in the block model, these were not included in the mine design and mining inventory.
Modifying factors have been applied to the mineral resource to emulate practical mining conditions and estimate the mining inventory that will be delivered to the plant as ROM production. Modifying factors that have been applied are as follows:
| ● | Ore recovery of 95 %. |
| ● | External dilution of 3 % – This is waste at zero grade added to the ore volume to account for inaccuracies in mining. |
| ● | Internal dilution – This is dilution included in the mining blocks (minimum mining units) applied in the mine design. The mining block size applied at Songwe Hill was 20 m × 20 m × 10 m depth. Internal dilution amounts to 5 % at a grade of 0.68 TREO %. This internal dilution is made up of a combination of Inferred resources, Type 2 material, and waste, all of which are treated as waste material in the mine design but are included in the mining blocks selected as ore blocks. |
| S-K 1300 Technical Report Summary on the Songwe Hill REE Project | Page 219 of 489 |
| |
The above schedule has been generated at a DFS level. The ROM tonnages and grades reported in the above mining schedule can be considered as Mineral Reserves in terms of S-K 1300, provided that the Project is shown to be viable by the financial analysis. A statement of Mineral Reserves is included in Section 12.5.
| 12.5 | Mineral Reserve Statement |
The portion of the Mineral Resources estimated for the Project has been converted to Mineral Reserves after it was demonstrated that the material is economically viable with the appropriate application of modifying factors.
Although the Bara QP was not responsible for the completion of the processing, tailings storage, environmental and financial modelling sections of this TRS, the Bara QP has relied on the specialists in these fields for completion of their respective sections. The Bara QP has reviewed the sections completed by others and has found no reason not to accept their work. The results of the 2022 DFS have shown that the mining inventory, which is derived from only Measured and Indicated Mineral Resources, can be viably mined based on the techno-economic assumptions documented in this TRS.
Table 12.12 shows a summary of the total Mineral Reserves.
Table 12.12: Mineral Reserve Summary as at 30 April 2025
| Category | Tonnage (Mt) | TREO (%) | TREO (t) |
| Proven Mineral Reserves | 8.160 | 1.28 | 104,183 |
| Probable Mineral Reserves | 9.988 | 1.07 | 106,801 |
| Total Mineral Reserves | 18.147 | 1.16 | 210,984 |
|
NOTE: Totals might not add up due to rounding. Mineral Reserves are stated as tonnages and grades delivered to the processing plant and are inclusive of dilution and mining losses expected during mining. The Mineral Reserve estimate is reported on a 100 % ownership basis. The Mineral Reserve is stated at a cut-off grade of 0.6 % TREO, which was supported by metal prices stated in Table 12.3. Ore tonnages are stated at an average in-situ density of 2.76 t/m3. A weighted average process recovery to carbonate of 40 % was used to calculate revenue from Mineral Reserves. | |||
| S-K 1300 Technical Report Summary on the Songwe Hill REE Project | Page 220 of 489 |
| |
Table 12.13: Mineral Reserve Summary Showing Rare Earth Element Grades
| Category | Tonnage (Mt) | TREO (%) |
CeO2 (ppm) | Dy2O3 (ppm | Er2O3 (ppm) | Eu2O3 (ppm) | Gd2O3 (ppm) | Ho2O3 (ppm) | La2O3 (ppm) | Lu2O3 (ppm) | Nd2O3 (ppm) | Pr6O11 (ppm) | Sm2O3 (ppm) | Tb4O7 (ppm) | Tm2O3 (ppm) | Y2O3 (ppm) | Yb2O3 (ppm) | Th (ppm) | U (ppm) |
| Proven Mineral Reserves | 8.16 | 1.28 | 5,779 | 108 | 41 | 80 | 190 | 17 | 3,069 | 4 | 2,027 | 606 | 294 | 23 | 5 | 493 | 30 | 296 | 13 |
| Probable Mineral Reserves | 9.988 | 1.07 | 4,852 | 89 | 34 | 66 | 159 | 14 | 2,633 | 3 | 1,642 | 498 | 243 | 19 | 4 | 410 | 25 | 295 | 13 |
| Total Mineral Reserves | 18.147 | 1.16 | 5,269 | 98 | 37 | 72 | 173 | 16 | 2,829 | 4 | 1,815 | 547 | 266 | 21 | 5 | 448 | 27 | 295 | 13 |
NOTE: Totals might not add up due to rounding. Mineral Reserves are stated as tonnages and grades delivered to the processing plant and are inclusive of dilution and mining losses expected during mining. The Mineral Reserve estimate is reported on a 100 % ownership basis. The Mineral Reserve is stated at a cut-off grade of 0.6 % TREO, which was supported by metal prices stated in Table 12.3. Ore tonnages are stated at an average in-situ density of 2.76 t/m3. A weighted average process recovery to carbonate of 40 % was used to calculate revenue from Mineral Reserves. | |||||||||||||||||||
| S-K 1300 Technical Report Summary on the Songwe Hill REE Project | Page 221 of 489 |
| |
Type 2 material, which is mineralised material with a grade above the cut-off grade but with an Mn:Mg ratio of greater then 3.5, is stockpiled on site for possible future processing. This material is excluded from both the ROM ore inventory and any Mineral Reserve estimate.
Inferred Resources are not considered as ore in the mine plan and as such are treated as waste and not included in the ROM ore inventory.
The Bara QP is not aware of any issues that materially affect the Mineral Reserve estimation for Songwe Hill. The Mineral Resource and Mineral Reserves are sensitive to cut-off grade as shown in the Mineral Resource grade tonnage curves from the Mineral Resource section (Section 14). The factors affecting the Mineral Reserve cut-off grade are as follows:
| ● | REE prices |
| ● | Mining costs |
| ● | Processing recovery costs |
| ● | Processing costs |
| ● | Environmental closure costs |
In order to test the sensitivity of the Mineral Reserve estimate to product price, the pit optimisation was run at product prices 10 % and 20 % higher than the prices reported in Table 12.4. The results are presented in Table 12.14.
Table 12.14: Sensitivity to Product Price
| Parameters | 2025 Price (Pit 16) |
2025 Price plus 10 % | 2025 Price plus 20 % | ||
| Item | Variance (%) |
Item | Variance (%) | ||
| Measured (t) | 8,469,145 | 9,446,300 | 12 | 9,875,304 | 17 |
| TREO Average (%) | 1.26 | 1.22 | −3 | 1.21 | −4 |
| Indicated (t) | 11,135,778 | 12,630,073 | 13 | 13,681,693 | 23 |
| TREO Average (%) | 1.00 | 0.96 | −4 | 0.95 | −4 |
| Total ROM (t) | 19,604,923 | 22,076,373 | 13 | 23,556,997 | 20 |
| TREO Average (%) | 1.11 | 1.07 | −4 | 1.06 | −4 |
| TREO Contained (t) | 217,615 | 236,204 | 9 | 250,098 | 15 |
| Waste (t) | 29,646,092 | 33,602,259 | 13 | 35,428,038 | 20 |
| Strip ratio (t:t) | 1.51 | 1.52 | 1 | 1.50 | −1 |
| Total Tonnes (t) | 49,251,015 | 55,678,632 | 13 | 58,985,035 | 20 |
Applying a price 10 % higher than the price used in the pit optimisation will result in an increase of 9 % in contained TREO, at a grade of 1.07 % (4 % reduction).
Other factors that can affect the Mineral Reserve estimate are the following:
| ● | Environmental and social risks, including the timely completion of the relocation action plan required to allow the Project to proceed |
| ● | Adherence to geotechnical design recommendations |
| ● | Production throughput, which directly influences the rate of depletion of the mineral reserve |
| ● | Achievement of the planned modifying factors, including ore loss and dilution |
| S-K 1300 Technical Report Summary on the Songwe Hill REE Project | Page 222 of 489 |
| |
| 12.6 | Mineral Reserve Reconciliation |
The previous Mineral Reserve estimate was published in the 2022 NI 43-101 report by Mkango. The 2021 Mineral Reserve summary is given in Table 12.15.
Table 12.15: Mineral Reserve Summary as at 31 December 2021
| Category | Tonnage (Mt) | TREO (%) | TREO (t) |
| Proven Mineral Reserves | 8.160 | 1.28 | 104,183 |
| Probable Mineral Reserves | 9.988 | 1.07 | 106,801 |
| Total Mineral Reserves | 18.147 | 1.16 | 210,984 |
|
NOTE: Totals might not add up due to rounding. Mineral Reserves are stated as tonnages and grades delivered to the processing plant and are inclusive of dilution and mining losses expected during mining. The Mineral Reserve estimate is reported on a 100 % ownership basis. Ore tonnages are stated at an average in-situ density of 2.76 t/m3. | |||
No mining or further exploration work has been conducted since December 2021; therefore, the Mineral Reserve remains unchanged.
| S-K 1300 Technical Report Summary on the Songwe Hill REE Project | Page 223 of 489 |
| |
| 13 | Mining Methods |
| 13.1 | Mining Overview |
The mining method at Songwe Hill will be conventional open-pit mining, making use of relatively small-scale trucks and diesel-hydraulic excavators, selected to match the mining conditions and required production rates.
The procedure followed in arriving at the mine design was as follows:
| ● | A geotechnical evaluation was completed including logging of core on site. The geotechnical data was collated into a database and used to inform a geotechnical design of the pit slope design parameters. |
| ● | Using the slope design parameters, mining costs obtained from mining contractors, modifying factors derived during the pre-feasibility mining study, and the product price data provided by Mkango, a pit optimisation was completed. The results of the pit optimisation were analysed, and a pit shell was selected on which to base the 2022 DFS pit design. |
| ● | Various scenarios of production rate, cut-off grade application, and stockpiling strategy were tested during the pit optimisation, which ultimately led to the selection of an option developed in more detail for the 2022 DFS pit design. |
| ● | Mine design criteria were developed for the pit design. A practical pit design was completed which included the design of haul roads and safety berms. The overall pit was split into two phases or cutbacks. |
| ● | A production schedule was developed, reporting all the material types produced from the pit over the LOO. The material types reported include |
| o | Waste. |
| o | Type 1 ore – This is ore above the cut-off grade with an Mn:Mg ratio of less than 3.5. This ore can be processed in the current plant design proposed. |
| o | Type 2 material – This is material above the cut-off grade but with an Mn:Mg ratio of 3.5 or greater. This material cannot be handled by the current process but will be stockpiled for potential processing at a later stage. |
The sections below describe the design and operation of the proposed open-pit mining operation.
| 13.2 | Mining Geotechnical Evaluation |
Bara subcontracted Middindi Consulting to carry out an open-pit slope design for the Songwe Hill Project at a DFS level of accuracy. The study addresses the geotechnical characteristics of the rock mass within the planned open-pit area, the methods used for the slope design, and the pit slope configurations obtained. A summary of the geotechnical findings and slope design, extracted from the 2022 DFS Geotechnical Report (Middindi, 2019), is given below.
| S-K 1300 Technical Report Summary on the Songwe Hill REE Project | Page 224 of 489 |
| |
| 13.2.1 | Hydrogeology |
The outcome of the hydrogeological assessment conducted by Digby Wells to ensure stability of the slopes recommends the following:
| ● | Periodical, long-term groundwater level monitoring in the surrounding areas of the proposed mine |
| ● | Placement of monitoring boreholes in the vicinity of the Songwe Hill pit to act as an early warning system |
| ● | Minimal pit dewatering, which might only be needed for the later years of mining, when mining of the pit nears the deepest part |
The geotechnical pit design provided in 2019 for Songwe Hill is still valid and applicable as saturated conditions were incorporated into the open-pit slope design to account for surface water ingress or subsurface water within the slopes.
| 13.2.2 | Seismicity |
According to Chapola (2001), Malawi is within the most seismically active belt of the East African Rift System (EARS). The magnitudes of the earthquakes are categorised as moderate and may reach up to 6.3 on a Richter Scale. For a 50- to 100-year period, peak ground acceleration (PGA) values range from 80 cm/s2 to 130 cm/s2 (0.8 m/s2 to 1.3 m/s2) in cities such as Mzuzu, Lilongwe and Blantyre (Chapola, 2001).
The spatial distribution of earthquakes shows northern Malawi as highly active, followed by the centre, with sparse distribution to the south. The Salima event of 1989 and the Karonga event of 2009 were the largest recorded earthquakes in Malawi, with magnitudes of up to M6.2 and M6.0, respectively (Chindandali, 2016).
The pit slope design for Songwe Hill accounted for potential seismicity by including a seismic coefficient (ks) in the limit equilibrium analysis models. The seismic coefficients are dimensionless coefficients which represent the PGA as a fraction of the acceleration due to gravity, or ks = ac /g.
Typical values are in the range of 0.1 to 0.3 (Rocscience Slide, 2017). PGA values of up to 1.3 m/s2 (130 cm/s2) for Malawi thus equate to a ks of 0.13.
| 13.2.3 | Geotechnical Data Acquisition |
Geotechnical data was obtained from geotechnical logging of borehole core and from laboratory testing of core on selected rock samples.
| S-K 1300 Technical Report Summary on the Songwe Hill REE Project | Page 225 of 489 |
| |
| 13.2.3.1 | Borehole Data |
Eighteen boreholes were logged geotechnically, totalling 2,198 m of core. The core was selectively sampled for rock strength testing, and the results of the drill core logging informed the geotechnical characterisation for the Project. The positions of the geotechnical boreholes in relation to the planned pit shell are shown in Figure 13.1.
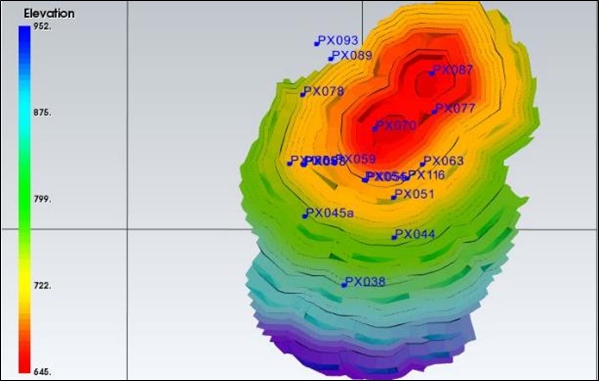
Figure 13.1: Locations of Geotechnical Boreholes
The core was logged per run within lithologies, recorded on a geotechnical log sheet, and then captured on an MS Excel spreadsheet. All the boreholes were orientated, thereby enabling discontinuity orientations to be analysed. Discontinuity orientations are recorded by measuring alpha (α) and beta (β) angles, which are thereafter corrected into dip angles and dip directions, respectively.
For each borehole logged, the following parameters were recorded by Middindi Consulting using ISRM (International Society of Rock Mechanics) based SOPs for geotechnical logging:
| ● | Drill run (from, to) |
| ● | Rock type |
| ● | Weathering of the rock mass |
| ● | Hardness of the rock mass (field estimate) |
| ● | Total core recovery (TCR) |
| ● | Solid core recovery (SCR) |
| ● | Rock quality designation (RQD) |
| ● | Number of joints per run |
| ● | Number of pieces per run |
| ● | Total number of cemented joints per run |
| ● | Depth of each individual open joint |
| ● | Dip angle (α-angle), i.e. angle of defects relative to the long axis of the core |
| ● | Dip direction (β-angle) |
| ● | Joint condition (roughness, infill type, infill thickness and joint alteration) |
| S-K 1300 Technical Report Summary on the Songwe Hill REE Project | Page 226 of 489 |
| |
During core drilling, runs of core (approximately 1.5 m to 3.0 m lengths) are extracted from the core barrel and placed in core boxes. The extraction process rotates the core randomly so that once the core is laid out in core boxes its original orientation is lost, although the orientation of the core axis is generally still known. Unorientated core can thus not allow for a complete geotechnical analysis of the discontinuity orientations (dip and dip directions), and the identification of dominant discontinuity sets is also limited.
The logging data was transformed into rock quality parameters such as rock mass rating (RMR) and geological strength index (GSI), which, together with weathering and hardness properties, enabled the derivation of geotechnical domains within the rock mass.
| 13.2.3.2 | Rock Testing |
A series of rock samples were selected from the boreholes during the data acquisition phase, in line with the ISRM’s guideline for sample selection for different rock tests. Uniaxial compressive strength with elastic moduli (UCM), triaxial compressive strength (TCS), indirect tensile strength (UTB) and direct shear on saw-cut surface (base friction angle (BFA)) tests were delivered and performed at the Rocklab Laboratory in South Africa. Samples of only the rock types which were dominant in the rock mass (i.e. fenite, phonolite, C2-carbonatite/breccia and C3-carbonatite) were selected. All the variations of breccias and carbonatites could not be sampled, such as brown banded carbonatite and dark matrix carbonatite, due to their sparsity. A brief description of the tests is presented in the subsections below.
| 13.2.3.2.1 | Uniaxial Compressive Strength with Elastic Moduli (UCM) |
Twenty-one UCM tests were carried out by Rocklab Laboratory. The UCM test allows for rock samples to be assessed and categorised by their unconfined strengths and is the most commonly used strength test. The elastic modulus and Poisson’s Ratio are also obtained from the UCM tests.
| 13.2.3.2.2 | Triaxial Compressive Strength (TCS) |
Twenty-two TCS tests were carried out by Rocklab Laboratory to determine the effect of confining stress on the strength of rock samples. The TCS test results allow for the derivation of mechanical rock properties such as Hoek-Brown and equivalent Mohr-Coulomb parameters, which are important in describing the behaviour of the rock mass in numerical models. This is achieved using the Rocscience RocData software.
| 13.2.3.2.3 | Indirect Tensile Strength (UTB) |
Twelve indirect tensile tests of rock, also known as the Brazilian Disc Test, were carried out to provide an alternative to direct tensile testing. The Brazilian tests produce tensile failure in the end faces of cylindrical rock samples by subjecting these specimens to a compressive force along their length. Specimens usually have a height-to-diameter ratio of at least 0.5:1.0, and a typical diameter of 54.0 mm. The specimens were placed horizontally and loaded in compression until the flat ends split, revealing the tensile strength data.
| 13.2.3.2.4 | Base Friction Angle (BFA) |
Direct shear tests of saw-cut surfaces on nine core specimens were carried out by Rocklab Laboratory to determine the BFA of “artificial” discontinuities within each domain. BFA tests are tilt tests performed on saw-cut surfaces representative of a cohesionless joint (c = 0 kPa). The BFA (φb) is a quantity that is fundamental to the understanding of the shear strength of discontinuity surfaces. The BFA values were entered into the Rocscience RocData program, from which equivalent Mohr-Coulomb properties were derived using the Barton-Bandis model, for large-scale discontinuities.
| S-K 1300 Technical Report Summary on the Songwe Hill REE Project | Page 227 of 489 |
| |
| 13.2.4 | Geotechnical Characterisation |
This section presents and discusses the results of the geotechnical properties attained from core logging, analysis of data, and rock testing. The geotechnical characteristics of all material layers of significance are reported herein.
| 13.2.4.1 | Geotechnical Domains |
The geotechnical data gathered during the logging process was subdivided into the following geotechnical domains based on the degree of weathering, hardness and rock mass ratings:
| ● | Weathered |
| ● | Transitional |
| ● | Poor quality |
| ● | Trans-fresh |
The four domains were categorised based on their characteristics as follows:
| ● | Weathered – completely to highly weathered, the RMR89 (Bieniawski, 1989) was generally less than 40 and logged as very weak to weak in terms of “hardness”. This domain usually occurs towards the upper surface of the borehole. |
| ● | Transitional – moderately weathered, RMR89 between 40 and 60 and was on average 55 and logged as medium-strong rock. Transitional materials, as the name suggests, exhibit characteristics between weathered and fresh rock and were fair in quality. |
| ● | Poor quality – The poor-quality domain exhibited essentially the same properties as the weathered domain but occurred between the transitional and trans-fresh domains. Since “weathered” refers to rock that has decomposed due to external physical processes, this domain was referred to as “poor” since it is overlain by competent rock and therefore not subjected to external weathering factors. |
| ● | Trans-fresh – slightly weathered to unweathered, RMR89 between 60 and 80 with an average of 67 and logged as medium-strong to strong rock. This domain does not qualify as “completely fresh rock” as it exhibits signs of some degree of weathering, and only 7 % of the rock mass was logged as “unweathered.” |
A total of 62 % of the rock mass, represented by all the boreholes, was moderately weathered, followed by 23 % slightly weathered and only 7 % fresh rock.
A total of 58 % of the rock mass was classified as good quality, followed by 28 % of fair-quality rock.
| 13.2.4.2 | Rock Mass Quality |
The parameters logged and described in the previous section enabled the rock mass to be geotechnically characterised. Several classification systems are typically used for geotechnical design, including the rock quality designation (RQD), GSI, Barton’s Q Rating (Q) and Bieniawski’s rock mass rating (RMR89). For open-pit slope designs, GSI and RMR are the most imperative parameters required for rock mass characterisation.
| S-K 1300 Technical Report Summary on the Songwe Hill REE Project | Page 228 of 489 |
| |
| 13.2.4.3 | Rock Mass Classification |
The geotechnical domains derived from the logging data have been defined in terms of their geotechnical characteristics. A statistical summary of the rock quality geotechnical parameters: RQD, joint spacing, RMR and GSI are presented in Table 13.1.
Each parameter mentioned above is accompanied by mean, minimum, maximum, standard deviation, 25th percentile, 50th percentile and 75th percentile values.
Table 13.1: Geotechnical Parameters with Statistical Summary for All Domains
| Geotechnical Domain |
Statistical Parameter | RQD (%) | Joint Spacing (cm) |
GSI | RMR |
| Weathered and poor-quality rock |
Mean | 15.13 | 11.08 | 32.93 | 37.70 |
| Minimum | 0.00 | 0.00 | 0.00 | 0.00 | |
| Maximum | 98.21 | 50.83 | 58.00 | 63.00 | |
| Standard Deviation | 18.90 | 8.33 | 9.51 | 10.36 | |
| Percentile 25 % | 11.39 | 9.68 | 30.03 | 34.53 | |
| Percentile 50 % | 18.30 | 9.97 | 30.75 | 35.75 | |
| Percentile 75 % | 19.35 | 10.95 | 34.64 | 39.64 | |
| Transitional | Mean | 60.87 | 30.47 | 49.59 | 54.59 |
| Minimum | 4.88 | 4.69 | 28.00 | 33.00 | |
| Maximum | 100.00 | 175.00 | 78.00 | 83.00 | |
| Standard Deviation | 29.80 | 23.32 | 9.91 | 9.91 | |
| Percentile 25 % | 47.18 | 26.81 | 46.52 | 51.52 | |
| Percentile 50 % | 59.84 | 30.44 | 50.04 | 55.04 | |
| Percentile 75 % | 66.56 | 34.96 | 51.25 | 56.25 | |
| Trans-fresh | Mean | 87.35 | 73.27 | 62.92 | 67.92 |
| Minimum | 4.85 | 5.40 | 30.00 | 35.00 | |
| Maximum | 100.00 | 380.00 | 89.00 | 94.00 | |
| Standard Deviation | 17.31 | 65.07 | 8.76 | 8.76 | |
| Percentile 25 % | 83.54 | 56.50 | 61.29 | 66.29 | |
| Percentile 50 % | 86.28 | 67.26 | 62.39 | 67.39 | |
| Percentile 75 % | 90.31 | 88.17 | 64.32 | 69.32 |
| S-K 1300 Technical Report Summary on the Songwe Hill REE Project | Page 229 of 489 |
| |
| 13.2.4.4 | Laboratory Strength Tests |
The summarised laboratory test results are presented in this section.
The following tests were undertaken on the selected samples:
| ● | Uniaxial compressive strength with elastic moduli (UCM) |
| ● | Triaxial compressive strength (TCS) |
| ● | Indirect tensile strength (Brazilian Disc) (UTB) |
| ● | Base friction angle (BFA) |
Table 13.2 shows a summary of the UCS test results, while Table 13.3 shows the triaxial compressive strength results.
Table 13.2: Summary of UCS Results of All Rock Types
| Rock Type | Statistical Parameter | Density (g/cm3) |
Strength (UCS) (MPa) |
Tangent Elastic Modulus at 50 % UCS (GPa) |
Poisson’s Ratio Tangent at 50 % UCS |
| Fenite | Mean | 2.73 | 134.96 | 47.24 | 0.30 |
| Minimum | 2.54 | 111.37 | 33.30 | 0.25 | |
| Maximum | 2.88 | 174.36 | 58.80 | 0.38 | |
| Standard Deviation | 0.15 | 24.76 | 11.22 | 0.05 | |
| C2-Carbonatite | Mean | 2.84 | 135.32 | 63.13 | 0.29 |
| Minimum | 2.78 | 133.68 | 55.10 | 0.28 | |
| Maximum | 2.91 | 137.79 | 67.70 | 0.31 | |
| Standard Deviation | 0.07 | 2.18 | 6.98 | 0.01 | |
| C3-Carbonatite | Mean | 2.78 | 71.26 | 37.68 | 0.26 |
| Minimum | 2.67 | 50.52 | 27.30 | 0.24 | |
| Maximum | 2.85 | 99.61 | 51.80 | 0.29 | |
| Standard Deviation | 0.09 | 22.27 | 10.23 | 0.02 | |
| Phonolite | Mean | 2.97 | 168.74 | 67.47 | 0.29 |
| Minimum | 2.80 | 121.13 | 58.90 | 0.24 | |
| Maximum | 3.22 | 201.14 | 82.40 | 0.34 | |
| Standard Deviation | 0.22 | 42.11 | 12.98 | 0.05 |
| S-K 1300 Technical Report Summary on the Songwe Hill REE Project | Page 230 of 489 |
| |
Table 13.3: Summary of Triaxial Compressive Strength Test Results for All Rock Types
| Rock Type | Borehole ID | Sample ID | Depth from (m) | Depth to (m) | Failure Load (kN) | Confining Pressure σ3 (MPa) |
Strength σ1 (MPa) |
Comments |
| Fenite | PX105 | PX-TCS-04 | 10.62 | 10.83 | 199.30 | 5.00 | 114.00 | |
| PX063 | PX-TCS-07 | 79.01 | 79.16 | 161.93 | 10.00 | 91.50 | Data point excluded – failed on discontinuity | |
| PX063 | PX-TCS-08 | 84.19 | 84.34 | 372.82 | 15.00 | 210.03 | ||
| PX038 | PX-TCS-10 | 70.56 | 70.71 | 371.79 | 20.00 | 118.40 | Data point excluded – failed on discontinuity | |
| PX055 | PX-TCS-12 | 58.12 | 58.27 | 379.05 | 25.00 | 216.45 | Data point excluded – failed on discontinuity | |
| PX057 | PX-TCS-16 | 4.40 | 4.55 | 494.62 | 30.00 | 280.30 | ||
| C2-carbonatite | PX077 | PX-TCS-09 | 87.08 | 87.22 | 384.94 | 5.00 | 222.35 | |
| PX055 | PX-TCS-13 | 80.06 | 80.21 | 439.78 | 10.00 | 251.23 | ||
| PX070 | PX-TCS-22 | 44.32 | 44.47 | 355.01 | 15.00 | 201.61 | Data point excluded – failed on discontinuity | |
| PX054 | PX-TCS-20 | 143.59 | 143.75 | 544.62 | 20.00 | 312.45 | ||
| C3-carbonatite | PX058 | PX-TCS-01 | 150.90 | 151.05 | 238.40 | 15.00 | 134.36 | |
| PX059 | PX-TCS-02 | 51.16 | 51.33 | 267.64 | 5.00 | 151.35 | Data point excluded – outlier | |
| PX059 | PX-TCS-03 | 138.42 | 138.57 | 170.59 | 10.00 | 96.55 | ||
| PX105 | PX-TCS-05 | 21.52 | 21.68 | 165.74 | 2.00 | 94.40 | ||
| PX051 | PX-TCS-15 | 30.08 | 30.22 | 292.20 | 20.00 | 164.69 | Data point excluded – failed on discontinuity | |
| PX054 | PX-TCS-19 | 77.52 | 77.66 | 304.15 | 25.00 | 175.46 | ||
| PX093 | PX-TCS-21 | 77.10 | 77.26 | 304.32 | 30.00 | 171.81 | ||
| Phonolite | PX063 | PX-TCS-06 | 66.56 | 66.71 | 532.69 | 5.00 | 299.97 | Data point excluded – failed on discontinuity |
| PX038 | PX-TCS-11 | 101.43 | 101.59 | 620.57 | 10.00 | 198.76 | ||
| PX055 | PX-TCS-14 | 154.70 | 154.88 | 517.80 | 15.00 | 296.94 | ||
| PX044 | PX-TCS-17 | 131.37 | 131.52 | 384.59 | 20.00 | 218.68 | ||
| PX044 | PX-TCS-18 | 158.17 | 158.34 | 581.99 | 25.00 | 331.77 |
The derivation of Hoek-Brown and Mohr-Coulomb failure parameters from the triaxial tests results are shown in Table 13.4 where
| ● | GSI is the geological strength index |
| ● | σc is the unconfined compressive strength |
| ● | ρ is material density |
| ● | mi is the material constant and mb is the reduced value of the material constant mi |
| ● | D is the disturbance factor due to blasting and stress relief |
| ● | s and a are constants for the rock mass |
| ● | c is cohesion and φ is friction angle |
As samples of the weathered domain could not be selected, the lowest UCS value (71.26 MPa) was used in the estimation of its shear strength properties. The GSI of the weathered material was obtained from the logging data.
As expected, the shear strength properties of the transitional material are lower than those of the trans-fresh rock types.
| S-K 1300 Technical Report Summary on the Songwe Hill REE Project | Page 231 of 489 |
| |
Table 13.4: Shear Strength Properties of Rock Derived from TCS Test Results
| Geotechnical Domain | Weathered | Transitional | Trans-Fresh | |||||||
| Rock Properties |
Unit | Fenite Breccia | Fenite | C2- Carbonatite Breccia |
C3- Carbonatite |
Phonolite | Fenite | C2- Carbonatite Breccia |
C3- Carbonatite |
Phonolite |
| GSI | N/A | 33.00 | 50.00 | 50.00 | 50.00 | 50.00 | 63.00 | 63.00 | 63.00 | 63.00 |
| σc | MPa | 71.26 | 108.29 | 135.32 | 71.26 | 121.53 | 108.29 | 135.32 | 71.26 | 121.53 |
| mi | N/A | 14.00 | 15.44 | 14.07 | 7.23 | 22.29 | 15.44 | 14.07 | 7.23 | 22.29 |
| D | N/A | 0.80 | 0.80 | 0.80 | 0.80 | 0.80 | 0.80 | 0.80 | 0.80 | 0.80 |
| mb | N/A | 0.259 | 0.765 | 0.717 | 0.369 | 1.122 | 1.658 | 1.555 | 0.799 | 2.432 |
| s | N/A | 3.90E-05 | 5.13E-04 | 5.13E-04 | 5.13E-04 | 5.13E-04 | 4.00E-03 | 4.00E-03 | 4.00E-03 | 4.00E-03 |
| a | N/A | 0.518 | 0.506 | 0.506 | 0.506 | 0.506 | 0.502 | 0.502 | 0.502 | 0.502 |
| r | kg/m3 | 2,600.00 | 2,730.00 | 2,840.00 | 2,780.00 | 2,970.00 | 2,730.00 | 2,840.00 | 2,780.00 | 2,970.00 |
| c | MPa | 0.76 | 1.52 | 1.67 | 1.03 | 1.91 | 2.20 | 2.47 | 1.58 | 2.67 |
| f | degrees (°) | 24.38 | 36.30 | 37.17 | 26.95 | 39.60 | 42.54 | 43.37 | 32.88 | 45.84 |
| S-K 1300 Technical Report Summary on the Songwe Hill REE Project | Page 232 of 489 |
| |
The UTB test results range from 4.9 MPa to 15.1 MPa for the individual samples. The statistical parameters are presented in Table 13.5, which indicates an average tensile strength of 10.4 MPa for fenite, 9.5 MPa for C2-carbonatite, 7.7 MPa for C3-carbonatite, and 11.5 MPa for phonolite.
Table 13.5: Statistical Summary of UTB Test Results
| Rock Type | Statistical Parameter | UTB (MPa) |
| Fenite | Mean | 10.4 |
| Minimum | 7.0 | |
| Maximum | 14.1 | |
| Standard Deviation | 3.6 | |
| C2-Carbonatite Breccia | Mean | 9.5 |
| Minimum | 8.0 | |
| Maximum | 10.5 | |
| Standard Deviation | 1.3 | |
| C3-Carbonatite | Mean | 7.7 |
| Minimum | 6.4 | |
| Maximum | 9.1 | |
| Standard Deviation | 1.3 | |
| Phonolite | Mean | 11.5 |
| Minimum | 4.9 | |
| Maximum | 15.1 | |
| Standard Deviation | 5.7 |
BFAs range from 33° to 41° and are presented in Table 13.6. The BFAs were used to derive the discontinuity shear strength for the transitional and trans-fresh rock.
Table 13.6: Statistical Summary of BFA Test Results
| Rock Type | Statistical Parameter | BFA (°) |
| Fenite | Mean | 35.67 |
| Minimum | 33.00 | |
| Maximum | 37.00 | |
| Standard Deviation | 2.31 | |
| C2-Carbonatite | Mean | 34.50 |
| Minimum | 34.00 | |
| Maximum | 35.00 | |
| Standard Deviation | 0.71 |
| S-K 1300 Technical Report Summary on the Songwe Hill REE Project | Page 233 of 489 |
| |
| Rock Type | Statistical Parameter | BFA (°) |
| C3-Carbonatite | Mean | 36.00 |
| Minimum | 33.00 | |
| Maximum | 39.00 | |
| Standard Deviation | 4.24 | |
| Phonolite | Mean | 39.00 |
| Minimum | 37.00 | |
| Maximum | 41.00 | |
| Standard Deviation | 2.83 |
The Barton-Bandis criteria in the RocData program were used to determine the discontinuity shear strength parameters for transitional and trans-fresh rocks by entering the BFA (ϕb), joint roughness coefficient (JRC0), joint compressive strength (JCS0), and actual joint length (L0). Since there are significant scale effects that control joint behaviour, the JRC0 and JCS0 parameters were converted from laboratory-scale to in-situ scale (JRCn and JCSn) within RocData. The residual friction angle (ϕr) is derived from ϕb.
The derived discontinuity shear strength properties, cohesion (c) and joint friction angle (ϕj), are presented in Table 13.7.
| S-K 1300 Technical Report Summary on the Songwe Hill REE Project | Page 234 of 489 |
| |
Table 13.7: Discontinuity Shear Strength Parameters
| Geotechnical Domain | Transitional | Trans-Fresh | |||||||
| Rock Properties | Unit | Fenite | C2- Carbonatite |
C3- Carbonatite |
Phonolite | Fenite | C2- Carbonatite |
C3- Carbonatite |
Phonolite |
| fb | degrees (°) | 33.00 | 34.00 | 33.00 | 37.00 | 36.00 | 35.00 | 36.00 | 39.00 |
| fr | degrees (°) | 23.00 | 24.00 | 23.00 | 27.00 | 26.00 | 25.00 | 26.00 | 29.00 |
| JRCn | 3 | 3 | 3 | 3 | 3 | 3 | 3 | 3 | |
| JCSn | MPa | 46.91 | 56.29 | 21.27 | 51.01 | 56.85 | 56.99 | 30.01 | 71.06 |
| r | kg/m3 | 2,730 | 2,840 | 2,780 | 2,970 | 2,730 | 2,840 | 2,780 | 2,970 |
| c | MPa | 0.076 | 0.081 | 0.076 | 0.093 | 0.083 | 0.084 | 0.083 | 0.100 |
| fj | degrees (°) | 25.08 | 26.25 | 24.03 | 29.01 | 28.28 | 27.25 | 27.42 | 31.41 |
| S-K 1300 Technical Report Summary on the Songwe Hill REE Project | Page 235 of 489 |
| |
| 13.2.4.5 | Discontinuity Orientation |
The Rocscience Dips program was used to analyse the discontinuity data obtained from the boreholes. In order to determine the most appropriate method to group the discontinuity orientations, the following plots were analysed:
| ● | Discontinuities per borehole |
| ● | Discontinuities per rock type |
| ● | Discontinuities per defined sector across the pit (A, B and C) according to elevation (see Figure 13.2) |
| ● | All the discontinuities combined |
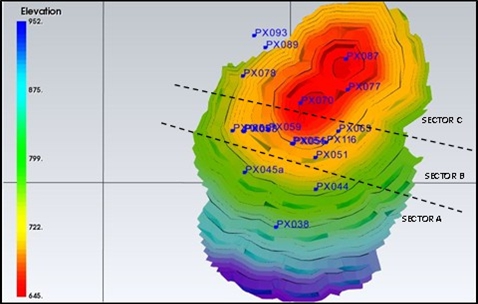
Figure 13.2: Sectors Defined According to Elevation for Discontinuity Orientation Analysis
Examination of the dips plots revealed that the trends in dominant discontinuity sets were similar irrespective of the grouping method. It was therefore concluded that a combination of all data (all boreholes and rock types) will be most representative of the rock mass for kinematic analysis. The number of data entries totalled 1,582 for the 18 boreholes. As depicted in Figure 13.3, the discontinuity data appeared to be scattered, but this may be attributed to the geological nature of the rock mass. Four joint sets were identified in the rock mass. The dips contour plot for the combined dataset is shown in Figure 13.4.
| S-K 1300 Technical Report Summary on the Songwe Hill REE Project | Page 236 of 489 |
| |
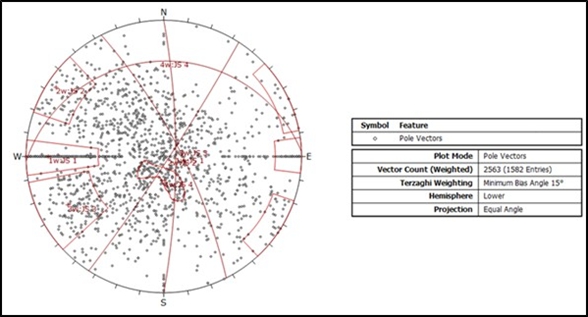
Figure 13.3: Dips Scatter Plot Showing Large Spread in Data
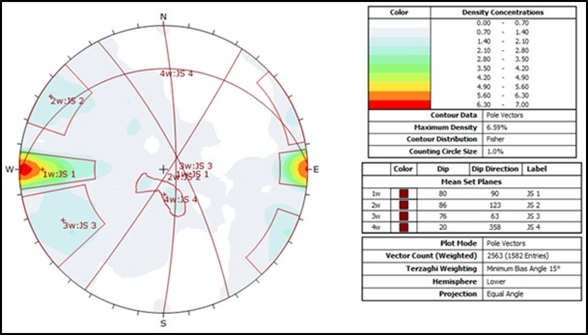
Figure 13.4: Dips Contour Plot Showing Dominant Joint Sets
The orientations of the dominant joint sets are summarised in Table 13.8.
Table 13.8: Summary of Discontinuity Sets for Songwe Hill
| Set No. | Dip Angle (°) | Dip Direction (°) |
| JS1 | 80 | 090 |
| JS2 | 86 | 123 |
| JS3 | 76 | 063 |
| JS4 | 20 | 358 |
| S-K 1300 Technical Report Summary on the Songwe Hill REE Project | Page 237 of 489 |
| |
| 13.2.5 | Slope Engineering |
The slope design reported herein provides recommendations for the vertical bench separation (bench or batter height), bench width or berm, bench face (or batter) angle, inter-ramp angle, and overall slope angle, for different design sectors of the open pits. The bench configuration is defined by a catch bench (or berm) width, vertical bench separation (or bench height), and bench face angle (or batter angle). The bench face angle is controlled by the material strength, the orientation of the discontinuities in relation to the face azimuth, and/or blasting and excavation practices. Production bench height is usually determined by grade control requirements and/or by equipment (production and making safe) capabilities. Multi-bench slope designs stack several production benches between catch benches so that the vertical catch bench separation is a multiple (usually two, three, or four) of the production bench height.
The inter-ramp angle (IRA) or stack angle is formed by a series of uninterrupted benches and corresponds to the inclination from the horizontal of a line joining the toes or crests of the benches.
The overall slope angle (OSA) is formed by a series of inter-ramp slopes separated by haul roads and corresponds to the angle formed by the line joining the toe of the lowest bench with the slope crest. The incorporation of ramps onto a wall will result in a slope that has a shallower overall slope angle than the inter-ramp angle.
Figure 13.5 depicts the typical slope configurations of an open-pit mine.
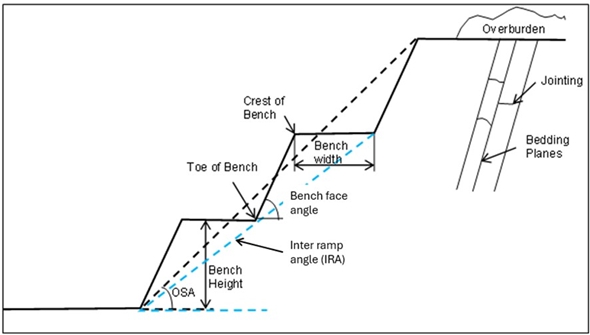
Figure 13.5: Typical Open-Pit Slope Terminology
| S-K 1300 Technical Report Summary on the Songwe Hill REE Project | Page 238 of 489 |
| |
For the kinematic analysis of the transitional and trans-fresh rock and the limit equilibrium analysis of the overall slopes, pit design sectors were derived based on highwall orientation (dip direction) and on the thicknesses of the domains within each sector. Figure 13.6 illustrates the various design sectors of the fresh rock in the pit.
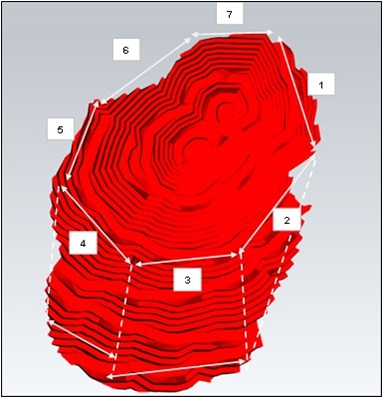
Figure 13.6: Pit Shell Layout Showing Design Sectors of Fresh Material
| 13.2.5.1 | Slope Design Methodology |
| 13.2.5.1.1 | Limit Equilibrium Analysis |
The Rocscience Slide program (Slide) was used to derive the stable bench face angles for the weathered and poor-quality domains. Slide provides FOS and probability of failure (POF) as a measure of stability (or instability) and uses Mohr-Coulomb or Hoek-Brown as input parameters. For the probabilistic analysis, random variables with their statistical parameters were specified.
For Songwe Hill, the weathered material extends up to 15 m in thickness, while the poor-quality material extends up to 30 m in thickness. The bench heights for weathered and poor-quality domains were fixed at 10 m. The BFA was varied from 90° to 70°. The models were simulated using completely saturated conditions.
Rock samples could not be tested for the weathered and poor-quality domains due to difficulty in obtaining intact samples. The shear strength properties (cohesion and friction angle) were therefore derived using the lowest UCS value from the rock test results and the GSI for the weathered domain from the logging data. A cohesion and friction angle of 760 kPa and 24.38°, respectively, were assigned to the weathered and poor-quality domains.
| S-K 1300 Technical Report Summary on the Songwe Hill REE Project | Page 239 of 489 |
| |
The input properties for the transitional and trans-fresh domains incorporated into the Slide models were derived from the analysis of laboratory test results presented in Table 13.4.
| 13.2.5.1.2 | Kinematic and Deterministic Analysis |
As previously stated, the Songwe Hill rock mass is dominated by transitional and trans-fresh domains. This suggests that pit slope stability will be controlled by the orientation of discontinuities rather than intact material strength. Three basic failure mechanisms are studied for rock slopes: plane failure, wedge failure, and toppling failure. As previously stated, the dominant mode of failure was wedge failure.
Kinematic analysis is the analysis of the relevant discontinuity data using stereographic projections. Rocscience Dips was used to assess the stability conditions of the transitional and trans-fresh domains at Songwe Hill to determine stable bench face angles. Major joint sets for the rock mass were identified using the relevant structural data as presented in the earlier sections.
The stability of the rock mass for each design sector was analysed using the dip direction of each sector’s highwall.
The stability of the fresh material was initially analysed using Rocscience Dips and thereafter where wedge failure was likely to occur, the domains were further analysed using Rocscience SWedge, which is a deterministic analysis program. SWedge was chosen for the analysis based on the program’s ability to provide FOS and POF as a measure of stability (or instability) for potential failures; Dips does not provide FOS but rather provides the percentage of poles plotting within the failure zone.
| 13.2.5.1.3 | Seismic Coefficient |
In addition to the input properties discussed above, a seismic coefficient was included in the limit equilibrium (Slide) and deterministic (SWedge) analyses. Seismic coefficients are dimensionless coefficients which represent the PGA as a fraction of the acceleration due to gravity, or ks = ac/g. Typical values are in the range of 0.1 to 0.3 (Rocscience Slide, 2017). PGA values of up to 1.3 m/s2 can be expected for Malawi (Chapola, 2001), which equate to a ks of 0.13.
| 13.2.5.2 | Slope Engineering Results |
This section presents the bench heights, bench face angles, bench widths, and overall slope angles derived from the slope engineering procedures as discussed in previous sections.
Mining equipment used to drill and blast the rock determines the bench height. Currently, most large mining operations adopt 10 m to 15 m bench heights. For the Songwe Hill open pit, a maximum of 10 m bench heights were adopted based on the PFS mine design criteria.
Based on the SWedge analysis results, a bench face angle of 70° is suggested for both transitional and trans-fresh domains.
For the weathered and poor-quality domains, 5 m spill bench and 10 m geotechnical bench widths (catch bench) are suggested. Spill benches are implemented after every single bench, while geotechnical benches are wider and are implemented after every stack. For the transitional domain, spill bench widths range from 5 m to 9 m with geotechnical bench widths ranging from 10 m to 12.5 m. For the trans-fresh domain, spill bench widths of 5 m to 8.5 m are suggested, with geotechnical bench widths of 9 m to 15 m, depending on the stack heights.
| S-K 1300 Technical Report Summary on the Songwe Hill REE Project | Page 240 of 489 |
| |
Overall slope angles range from 39° to 47°. The mean FOS obtained for the overall slope stability of the final wall designs ranged between 2.05 and 4.09, which were above the threshold criteria of 1.5 as stipulated.
The final slope configurations for the seven design sectors within the pit are summarised in Table 13.9. The slope diagrams for each design sector are depicted in Figure 13.7 to Figure 13.12.
Table 13.9: Summary of Slope Configurations
| Design Sector |
Stack No. |
Geotechnical Domain |
No. of Benches |
Bench Face Angle (°) |
Max. Bench Height (m) |
Min. Bench Width (m) |
Geotechnical Bench Width (m) |
Inter- Ramp Angle (°) |
Overall Slope Angle (°) |
| 1 | 1 | Weathered, Trans-Fresh | 5 | 70 | 10 | 5 | 12 | 49 | 47 |
| 2 | Transitional | 4 | 5 | 12.5 | 49 | ||||
| 3 | Transitional | 3 | 5 | Pit floor | 49 | ||||
| 2 | 1 | Weathered | 2 | 70 | 10 | 5 | 10 | 49 | 44 |
| 2 | Trans-Fresh | 3 | 5.5 | 9 | 48 | ||||
| 3 | Trans-Fresh | 4 | 5.5 | 12 | 48 | ||||
| 4 | Transitional | 3 | 6 | 10 | 46 | ||||
| 5 | Transitional | 5 | 6 | Pit floor | 44 | ||||
| 3 and 4 | 1 | Weathered | 2 | 70 | 10 | 5 | 10 | 49 | 40 |
| 2 | Transitional | 4 | 8 | 12.5 | 41 | ||||
| 3 | Trans-Fresh | 4 | 7.5 | 12 | 42 | ||||
| 4 | Transitional | 4 | 8 | 12 | 37 | ||||
| 5 | Poor Quality | 3 | 5 | 10 | 49 | ||||
| 6 | Trans-Fresh | 4 | 7.5 | 12 | 42 | ||||
| 7 | Trans-Fresh | 3 | 7.5 | 9 | 42 | ||||
| 8 | Transitional | 4 | 8 | 12.5 | 41 | ||||
| 9 | Transitional | 3 | 8 | Pit floor | 41 | ||||
| 5 | 1 | Weathered, Trans-Fresh | 6 | 70 | 10 | 5 | 15 | 45 | 42 |
| 2 | Transitional | 4 | 7 | 12.5 | 43 | ||||
| 3 | Transitional | 4 | 7 | Pit floor | 43 |
| S-K 1300 Technical Report Summary on the Songwe Hill REE Project | Page 241 of 489 |
| |
| Design Sector |
Stack No. |
Geotechnical Domain |
No. of Benches |
Bench Face Angle (°) |
Max. Bench Height (m) |
Min. Bench Width (m) |
Geotechnical Bench Width (m) |
Inter- Ramp Angle (°) |
Overall Slope Angle (°) |
| 6 | 1 | Weathered, Trans-Fresh | 6 | 70 | 10 | 5 | 15 | 45 | 43 |
| 2 | Transitional | 4 | 6 | 12.5 | 46 | ||||
| 3 | Transitional | 3 | 6 | Pit floor | 46 | ||||
| 7 | 1 | Weathered, Trans-Fresh | 5 | 70 | 10 | 8.5 | 12 | 39 | 39 |
| 2 | Transitional | 6 | 9 | Pit floor | 36 |
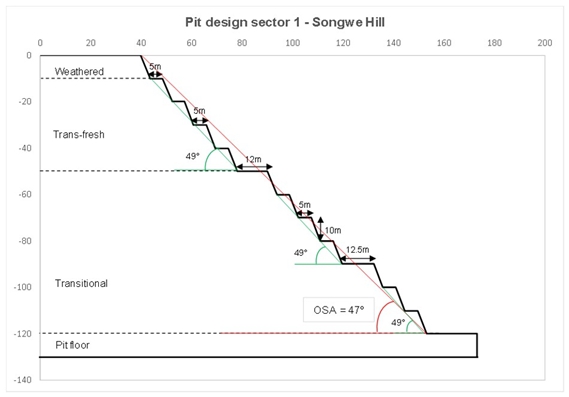
Figure 13.7: Diagram Showing Slope Geometry for Sector 1
| S-K 1300 Technical Report Summary on the Songwe Hill REE Project | Page 242 of 489 |
| |
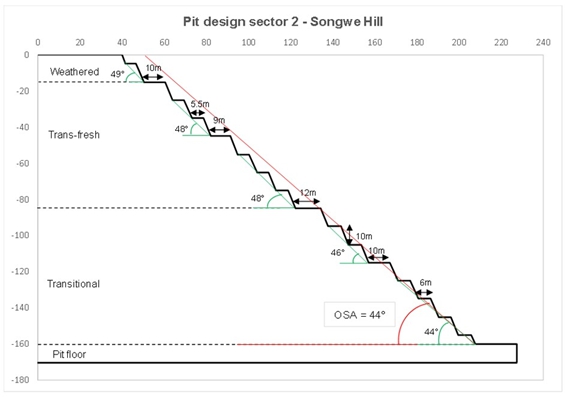
Figure 13.8: Diagram Showing Slope Geometry for Sector 2
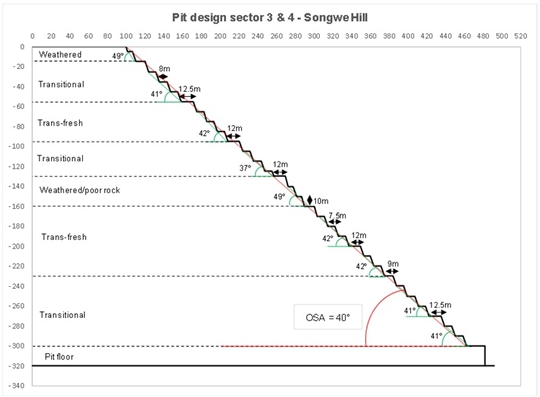
Figure 13.9: Diagram Showing Slope Geometry for Sectors 3 and 4
| S-K 1300 Technical Report Summary on the Songwe Hill REE Project | Page 243 of 489 |
| |
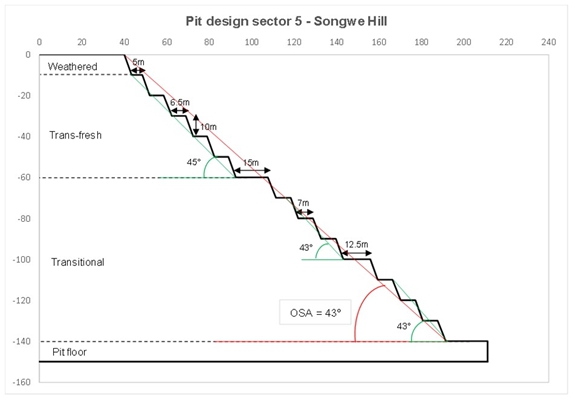
Figure 13.10: Diagram Showing Slope Geometry for Sector 5
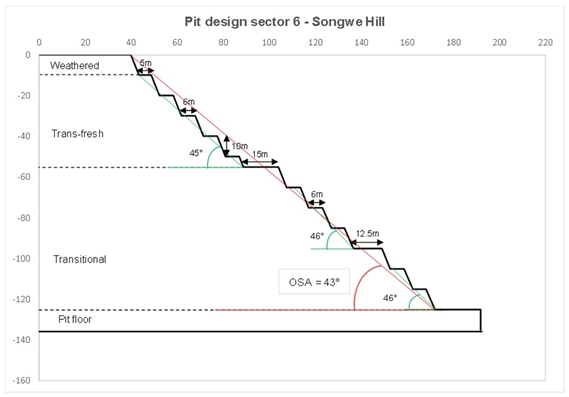
Figure 13.11: Diagram Showing Slope Geometry for Sector 6
| S-K 1300 Technical Report Summary on the Songwe Hill REE Project | Page 244 of 489 |
| |
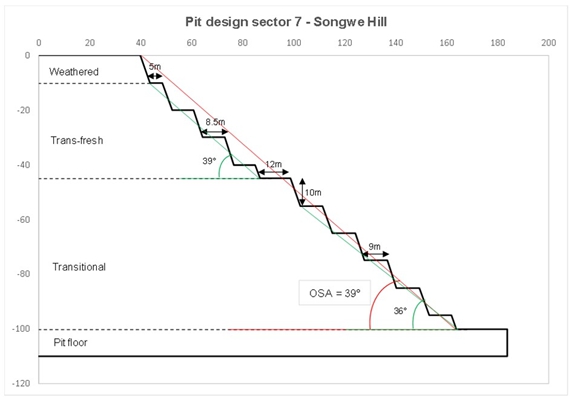
Figure 13.12: Diagram Showing Slope Geometry for Sector 7
| 13.3 | Mine Operation |
The mining operation at Songwe Hill will be outsourced to a contract mining company. Ore and waste will be drilled and blasted, then excavated using a hydraulic shovel and loaded onto dump trucks for hauling out of the pit to the ROM stockpile or waste dumps.
Waste will be transported to the waste dump sites, which are either the TSF or the designated waste dump. The waste rock will be used for the construction of the outer wall of the tailings dam. During early mining and site construction, a limited amount of waste will be used as construction material and fill.
Ore will be transported to the ROM pad adjacent to the processing plant in preparation for feeding to the plant, or to the medium-grade stockpile area adjacent to the pit. Ore will be placed in specific low- and high-grade stockpile areas on the ROM pad. The ore will be fed into the primary crusher using a front-end loader (FEL). Blending of the ore and feeding of the crusher will be the responsibility of the plant operations personnel.
Waste and ore will be transported from the pit to the waste dump, ROM pad or stockpile by dump trucks of 40 t capacity. Loading and hauling of waste will be a two-shift-per-day operation while mining of ore will be carried out during the day shift only, to allow for effective grade control to be maintained.
A number of contractors have been approached and have submitted proposals to Mkango for the operation of the open-pit mining based on these shift cycles and working arrangements.
| S-K 1300 Technical Report Summary on the Songwe Hill REE Project | Page 245 of 489 |
| |
| 13.3.1 | Drill and Blast |
It is expected that all ore and waste will require drilling and blasting. The geological logs, as well as observations on site, show very little weathered overburden which will not require blasting.
Blast designs were completed for both ore and waste assuming the rock characteristics described in Section 13.2. The Kuz-Ram equation was used to estimate the powder factor required to achieve a specific particle size distribution of the blasted muck pile. The input parameters used in the estimate for waste and ore are as follows:
| ● | UCS – 135 MPa |
| ● | Poisson’s ratio – 0.3 |
The blast design for ore targeted 50 % passing 270 mm and 100 % passing 1.0 m. For waste blasting, the target is 100 % passing 1.5 m.
This resulted in the blast designs given in Table 13.10.
Table 13.10: Drill and Blast Design
| Item | Value | |
| Waste | Ore | |
| Bench height (m) | 10 | 10 |
| Hole diameter (mm) | 152 | 127 |
| Subdrill (m) | 1.5 | 1.5 |
| Hole depth (m) | 11.5 | 11.5 |
| Powder factor (kg/m3) | 0.5 | 0.7 |
| Bulk explosive SG (t/m3) | 1.05 | 1.05 |
| Charge length (m) | 9.22 | 9.60 |
| Charge per hole (kg) | 176 | 128 |
| Metres cubed broken per hole (m3) | 351 | 182 |
| SG (in situ) (t/m3) | 2.73 | 2.90 |
| Tonnes blasted per hole (t) | 959 | 528 |
| Area per hole (m2) | 35.1 | 18.2 |
| Spacing to burden ratio | 1.2 | 1.2 |
| Burden (m) | 5.4 | 3.9 |
| Spacing (m) | 6.5 | 4.7 |
| Broken tonnes per metre drilled (t/m drilled) | 83 | 46 |
The drill rig specified by the Mining Contractor is a Sandvik Pantera 1500. This rig is capable of drilling both 152 mm and 127 mm diameter holes.
| S-K 1300 Technical Report Summary on the Songwe Hill REE Project | Page 246 of 489 |
| |
The design powder factor is 0.5 t/m3 and 0.7 t/m3 for waste and ore, respectively.
Bulk emulsion explosives and the associated initiation systems will be provided by a service provider in Malawi. The product will be imported from Zambia where a number of explosives suppliers have manufacturing facilities and distribution hubs.
| 13.3.2 | Load and Haul |
The mining will be done by contractors using 90 t excavators loading into 40 t articulated dump trucks. The specifications of a Caterpillar 740B ADT were used to determine the truck fleet size in a hauling route simulation model.
The material will be loaded and hauled via the required routes to either the plant, waste dump or stockpiles, to determine the cycle times and number of trucks required for the operation.
Material from the pit will be hauled to one of five destinations. Waste will either be hauled to the wall of the TSF or to the designated waste dump. During periods of tailings facility wall construction, waste will be dumped on the TSF wall. All other waste will be placed on the designated waste dump.
Type 2 material will be hauled to the Type 2 material stockpile, situated on the north side of the waste dump.
In the first five years of mining, ore with a grade of less than 1.2 % TREO will be placed on the Type 1 ore stockpile to the northeast of the pit. During this period, high-grade ore (greater than 1.2 % TREO) will be hauled directly to the ROM pad at the plant site.
From Year 6 onwards, the split of medium-grade ore sent directly to the plant or to the stockpile will be controlled by the grade control department to maintain a steady feed grade to the plant. High-grade ore will continue to be hauled directly to the ROM stockpile from the pit.
In the final years of the LOO, from Project Year 15 onwards, open-pit mining is completed, and the only hauling that takes place is to move the medium-grade ore from the stockpile area to the plant.
| S-K 1300 Technical Report Summary on the Songwe Hill REE Project | Page 247 of 489 |
| |
Figure 13.13 shows the haul routes from the pit to the various material destinations.
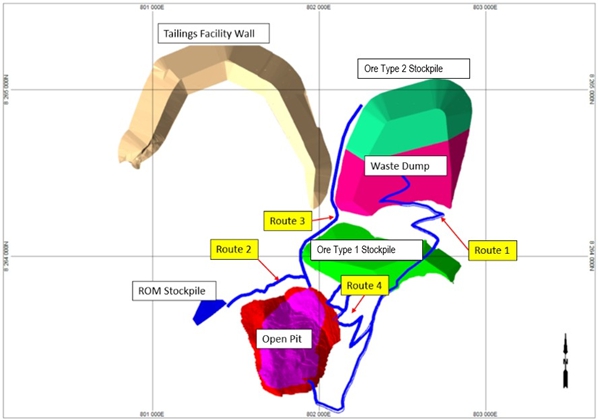
Figure 13.13: Haul Routes and Material Destinations
A haul route simulation was carried out using Deswik.LHS®. This allowed the average haul distances and haul route gradients to be calculated by period throughout the LOO.
| 13.3.3 | Technical Services |
Mining technical services on the mine will consist of the following functions:
| ● | Geology and grade control |
| ● | Survey |
| ● | Mine planning |
| 13.3.3.1 | Grade Control |
The geology department will provide a grade control service to the mining production teams.
Grade control drilling will be performed to provide sampling information, which will be used for the demarcation of the waste and ore boundaries and for evaluation of the ore blocks.
An allowance has been made in the OPEX model for the drilling of approximately 2,400 m per month of grade control holes. This will suffice for a spacing of 10 m × 10 m, with holes drilled to a depth of 30 m to cover three benches.
| S-K 1300 Technical Report Summary on the Songwe Hill REE Project | Page 248 of 489 |
| |
Prior to the mining of each flitch, the ore/waste boundary will be clearly marked by the geology department. Grade controllers will be on site at the point of loading at all times during the loading of ore.
On-site exploration and resource definition will also be undertaken by the site geological team.
A fully equipped assay laboratory will be established and operated on site. The laboratory will handle all regular plant and mining grade and quality control assay samples. The assay laboratory will be located in the vicinity of the plant and will be operated by an independent laboratory company. By far the largest number of samples that will be treated by the laboratory will be for plant control; however, the laboratory will handle all mining grade control samples as well.
| 13.3.3.2 | Survey |
The survey department will conduct routine surveys of the open pits, waste dumps, stockpiles and tailings storage facilities to comply with legal requirements and to ensure that adequate control over the operations is maintained. The mine surveyor will also conduct check surveys to confirm the quantities invoiced by the Mining Contractor.
| 13.3.3.3 | Mine Planning |
The mine planning function will ensure the optimal extraction of the orebody by providing planning assistance and guidance to the mining production teams. Short- and medium-term plans will be drawn up, evaluated, and implemented to ensure that the strategic plan of the mine is adhered to. The technical services function will monitor the mining of the ore and waste volumes, mined actuals versus planned, and reconcile the metal produced against the metal called for from the geological models to ensure that the grade control and grade estimation are continually improved.
| 13.4 | In-Pit Services |
| 13.4.1 | Dewatering |
The primary sources of water into the open-pit mine will be precipitation and groundwater.
| 13.4.1.1 | Precipitation |
Due to the topography of the open pit located on the side of Songwe Hill, precipitation water reporting into the mine will primary be from direct rainfall. Storm water diversion berms may be required on the eastern boundary to divert runoff water and prevent it from entering the pit.
The pit catchment area increases up to approximately Year 8, whereafter the catchment area does not increase significantly, i.e. the volume of water reporting to the pit from precipitation remains consistent after Year 8.
After Year 8, the depth of the pit increases and will require an additional pumping stage to overcome the rise in the static head.
The average monthly rainfall was used to determine the volume of water that will report to the open pit over time and used to size the dewatering system.
| S-K 1300 Technical Report Summary on the Songwe Hill REE Project | Page 249 of 489 |
| |
It is impractical to attempt to match the inflow from a large storm event with the pumping system. As such, the mining sequence should ensure that a sufficiently sized sump is available at the lowest section of the pit to cater for summer storms. Water accumulating in the sump will be dewatered over a period of a few days as required by the plant operations.
Should an adequately sized sump not be available, machines and equipment in the mine pit must be moved to higher ground before or during a storm event. Procedures for this should be described in a code of practice developed by the mine.
| 13.4.1.2 | Groundwater |
The following extracts from Digby Wells (2022b) are instructive:
| ● | Pit dewatering will be minimal and might only be needed for the later years of mining, when mining of the pit nears the deepest part; this is not expected to have a significant impact on third-party groundwater supplies. |
| ● | The calculated range of potential pit inflows and years in which this may occur are not detailed enough for a DFS design of the pit sump pump requirements. If this design is required, a DFS-level groundwater study should be carried out to narrow the range of pit inflows. |
| ● | Groundwater in-pit inflows will likely vary between ~20 m³/d and ~500 m³/d for the last years of mining. |
The dewatering design considered the most conservative estimate of 500 m³/d at Year 13 and assumed 50 % of the maximum flow at Year 8.
| 13.4.1.3 | Total Water Inflow |
The average monthly volume of water into the mining pit from precipitation and groundwater for Year 2 and Year 13 is graphically shown in Figure 13.14 with the orange and blue lines, respectively.
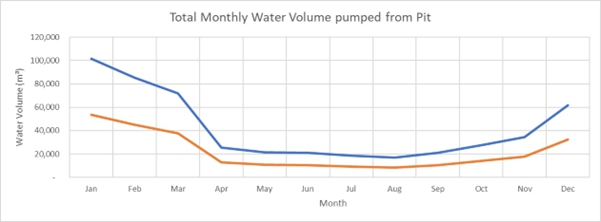
Figure 13.14: Monthly Water Inflow
| S-K 1300 Technical Report Summary on the Songwe Hill REE Project | Page 250 of 489 |
| |
| 13.4.1.4 | Dewatering Configuration |
Figure 13.15 shows the proposed dewatering configuration from initial mining to approximately Year 8.
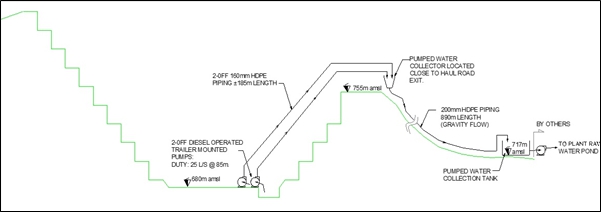
Figure 13.15: Flow Diagram up to Year 8
An additional pumping stage will be introduced when the pit is mined 75 m deeper than the truck haul road entrance. Figure 13.16 shows the proposed dewatering configuration from approximately Year 8 for the LOO.
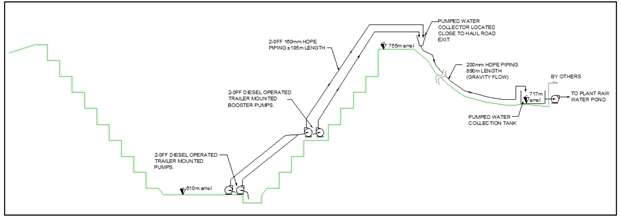
Figure 13.16: Flow Diagram from Year 8
Diesel-driven pumps were proposed for the Project as diesel will be transported into the pit for refuelling the drills and the excavators and will negate the need for expensive power cables from surface operations to the pumps. In addition, electrical cables in the pit are at risk of blast damage.
Two operational pump sets, each with a pumping capacity of 25 L/s, will be provided. During the dry season, one pump will operate between 3 h/d and 10 h/d. During the peak rainy season, two pump sets will operate up to 20 h/d.
A pump water receiving hopper will be installed near the pit entrance next to the truck haul road. This receiving hopper will receive water from the operating pumps in the pit and channel the water under gravity into a dewatering pipeline to a tank located at the primary crusher. The plant operations will pump the water from this tank at the primary crusher to the plant raw water dam. This configuration was proposed to use the electrical power located at the primary crusher, avoiding routing electrical power to the pit rim.
| S-K 1300 Technical Report Summary on the Songwe Hill REE Project | Page 251 of 489 |
| |
| 13.4.2 | Lighting |
Lighting for night-shift operations will be by diesel-generated mobile units. The units will be supplied, operated, and maintained by the Mining Contractor.
| 13.5 | Waste ROCK Dump and Stockpiles |
| 13.5.1 | Description |
The mining of the REE resource at Songwe Hill will produce various grades of ore and waste rock.
Selected material types will be disposed of for permanent storage, whilst other types of mined material, namely ore (of different grades), will only require temporary storage to allow for future blending and processing.
The mined materials (excluding high-grade ore) that require storage include the following:
| ● | Waste rock |
| ● | Medium-grade ore |
| ● | Type 2 material |
The high-grade ore will be mined and transported directly from the pit to the ROM pad and blending area.
Table 13.11 provides a summary of the design criteria for the selected mined materials storage facilities.
Table 13.11: Waste Rock and Ore Storage Facility Design Criteria
| Design Criteria | Value | Unit | Source |
| Total waste rock tonnes | 27 | Mt | Bara |
| Waste rock bulk density | 1.74 | t/m3 | Bara |
| Total waste rock volume (LCM) | 15.69 | Mm3 | Bara |
| Volume of waste rock required for the TSF | 5.50 | Mm3 | Epoch |
| Waste rock storage requirement | 10.19 | Mt | Calculation |
| Total medium-grade ore tonnes | 6.60 | Mt | Bara |
| Medium-grade ore bulk density | 1.74 | t/m3 | Bara |
| Medium-grade ore storage requirement | 3.79 | Mm3 | Calculation |
| Total Type 2 material tonnes | 12.60 | Mt | Bara |
| Type 2 material bulk density | 1.76 | t/m3 | Bara |
| Type 2 material storage requirement | 7.16 | Mm3 | Calculation |
| S-K 1300 Technical Report Summary on the Songwe Hill REE Project | Page 252 of 489 |
| |
The selection of suitable sites for the storage of the various mined materials was guided by the following criteria:
| ● | Avoid, as far as practical, all residential and environmentally sensitive or no-go areas. |
| ● | Minimise impact on groundwater and surface water resources. |
| ● | Avoid, where possible, all areas with cultural heritage significance, e.g. graveyards. |
| ● | Limit haul distances from the pit to the various material stockpiles. |
| ● | Accommodate the require volume of material. |
| ● | Effectively manage drainage and surface water. |
| ● | Ensure stable landforms during operation and after closure. |
| ● | Avoid close proximity to the Mozambican border located to the east of the mining area. |
The general Songwe Hill Project area is constrained with regard to available surface area. Following the positioning of the key major infrastructure areas, i.e. the processing plant and TSF, the remaining available area was assessed for the positioning of the ROM ore stockpile, WRD, and Type 2 material stockpile. The general areas identified for the facilities are located northeast of the pit.
The medium-grade ore stockpile is positioned against a hill, directly adjacent to the pit and close to the ROM pad. This is a stand-alone facility with its own water management measures.
The area to the east of the TSF and northeast of the pit was identified as the preferred location for the WRD and Type 2 material stockpile. In order to accommodate the waste rock and Type 2 material on the available footprint, the material will be co-disposed on the same facility. The waste rock will be disposed of on the southern portion of the facility, with the Type 2 material on the northern portion. The Type 2 material will be placed up against the waste rock, and the interface marked and surveyed. Figure 13.17 shows the locations of the mined material storage facilities.
| S-K 1300 Technical Report Summary on the Songwe Hill REE Project | Page 253 of 489 |
| |
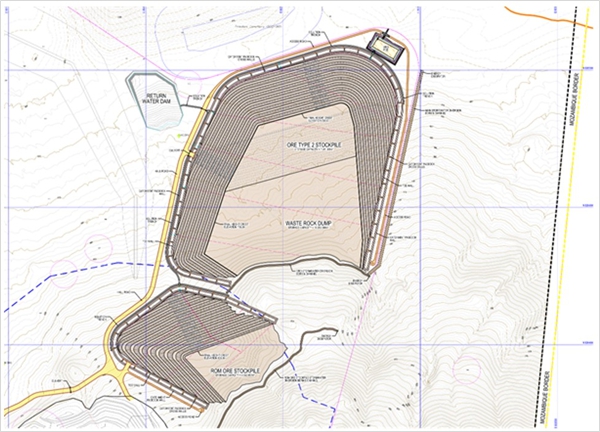
Figure 13.17: Positions of Mined Material Storage Facilities
The medium-grade stockpile will cover a total footprint of 16 ha against the steep hillside adjacent to the pit. The facility will have a maximum capacity of 4.05 Mm3, which translates into a tonnage of 7.05 Mt. The peak volumetric capacity requirement is 3.79 Mm3. The material will be deposited in 7.5 m lifts, with 7.5 m wide benches and intermediate slide slopes of 1V:1.5H. The maximum downstream height is 95 m. The intention is to place the medium-grade material on the medium-grade stockpile for temporary storage before removal for further blending at the ROM pad with high-grade material. The final capacity of the medium-grade ore stockpile is therefore variable over time.
The combined WRD and Type 2 material stockpile will be developed similarly to the medium-grade ore stockpile, with 7.5 m lifts, 7.5 m wide benches and intermediate slide slopes of 1V:1.5H. The WRD will cover a footprint (natural ground) of approximately 36 ha, with a final downstream height of 64 m. The Type 2 material stockpile will cover a natural ground footprint of approximately 14.7 ha, with a final downstream height of 75 m. The storage capacities of the WRD and the Type 2 material stockpile are summarised below:
| ● | WRD: | 10.26 Mm3/17.85 Mt |
| ● | Type 2 material stockpile: | 7.45 Mm3/13.1 Mt |
| S-K 1300 Technical Report Summary on the Songwe Hill REE Project | Page 254 of 489 |
| |
| 13.5.2 | Rehabilitation and Closure |
The ROM stockpile will be an active facility throughout the operational period as material is placed and removed over time. Rehabilitation activities will include the removal of concrete and uPVC pipes and stone pitching etc. The remaining material will be graded over the site and mixed with topsoil to encourage the growth of vegetation at closure.
The economic feasibility of the removal and processing of Type 2 material will be determined at a later stage. Regardless of which material is left on the WRD and Type 2 material stockpile, the following rehabilitation activities are envisaged:
| ● | Push the intermediate slope angles of the benches down to 1V:2.5H. |
| ● | Blend topsoil with the waste rock on the surface of the final landform. |
| ● | Establish vegetation by hydroseeding. |
| ● | Reshape the crest to promote runoff. |
| ● | Remove any concrete and stone pitching, HDPE geomembrane and drainage materials, and mechanical and electrical equipment if applicable. |
| ● | Where possible, grade and blend the remainder of the disturbed surface areas with topsoil to encourage the growth of vegetation. |
| 13.6 | Mine Scheduling |
| 13.6.1 | Schedule Parameters |
ROM feed to the crusher was planned at a rate of 1,000,000 t/a. To keep the stripping ratios as low as possible, the high-grade pit was mined first as the first phase of mining. This pit targets material with a TREO grade above 1.5 % or as close as possible for a period of five years. Material below the Phase 1 cut-off grade of 1.2 % will be stockpiled on a medium-grade stockpile close to the pit exit to the east on the Type 1 ore stockpile.
| 13.6.2 | Production Requirements |
The production rates for the mining schedule build up to 800,000 t per month for the first 12 months to access sufficient high-grade material to meet the plant feed requirements. The following five years are mined at a nominal 500,000 t per month, after which the required mining rate is 300,000 t per month. The stockpiled material will be processed for a further five to six years.
The loading rates have been determined as 6,000 t/d and 10,000 t/d per team. Three teams will be required for the first year with two teams doing 10,000 t/d and one team doing 6,000 t/d. One team can be removed after the first year, and then the smaller of the remaining two teams can be removed after Year 6 of production. A total of 18,25 Mt of ROM ore is mined at an overall average TREO grade of 1.16 %. The processing inventory is given in Table 13.12.
| S-K 1300 Technical Report Summary on the Songwe Hill REE Project | Page 255 of 489 |
| |
Table 13.12: Processing Tonnage and Grade
| Processing | Unit | 6 Years | Total |
| Total Throughput | t | 5,187,400 | 18,147,781 |
| Total TREO ROM Grade | % TREO | 1.50 | 1.16 |
| Total TREO Recovered Grade | % TREO | 0.53 | 0.41 |
| High Grade – Tonnage | t | 5,005,600 | 8,092,786 |
| High Grade – TREO Content | t | 76,545 | 122,459 |
| High Grade – TREO ROM Grade | % TREO | 1.53 | 1.51 |
| Medium Grade – Tonnage | t | 181,800 | 10,054,995 |
| Medium Grade – TREO Content | t | 1,466 | 88,524 |
| Medium Grade – TREO ROM Grade | % TREO | 0.81 | 0.88 |
Figure 13.18 shows the production from the open pit by material type by year.
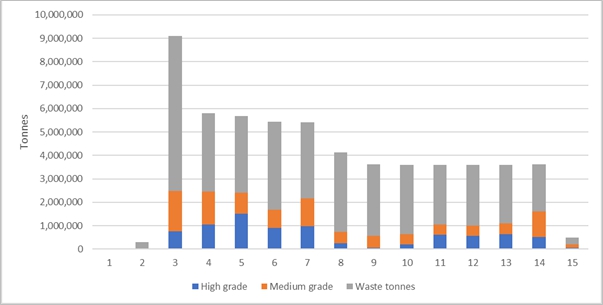
Figure 13.18: Production Profile by Year
| S-K 1300 Technical Report Summary on the Songwe Hill REE Project | Page 256 of 489 |
| |
Figure 13.19 shows the processing schedule by year. The processing schedule extends beyond the mining schedule as the medium-grade ore produced during the first five years of mining is processed after mining from the pit has ceased.
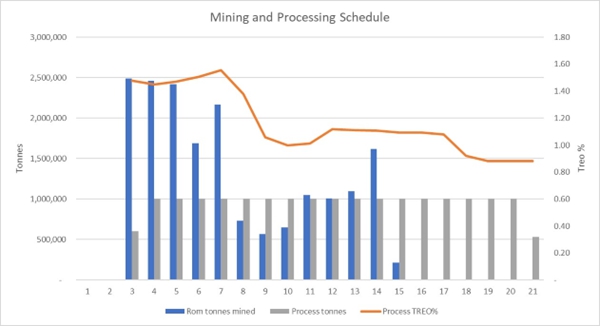
Figure 13.19: Processing Profile by Year
| 13.6.3 | Mining Sequence |
The sequence of mining is to access the high-grade pit in the first five years to achieve the plant feed of 1.5 % TREO. The mining of the hillside and final pushback commences in Year 4 of operation. The strip ratio will increase for the next few years in order to access Type 1 ore in the final pushback.
The total mining inventory from the open pit is given in Table 13.13.
Table 13.13: Mining Inventory from Pit
| Description | Value |
| ROM Tonnes Type 1 Ore (high grade and medium grade) (t) | 18,147,781 |
| ROM TREO Grade (%) | 1.16 |
| Contained TREO (t) | 210,984 |
| Total Waste Tonnes (t) | 40,553,931 |
| Strip Ratio | 2.23 |
| NOTE: Waste tonnes include mineralised waste below the cut-off grade (3.9 Mt), mineralised Type 2 material (13.2 Mt), and Inferred Resources (11.3 Mt). | |
The overall strip ratio of the mine is 2.23 (waste tonne to ore tonne).
| S-K 1300 Technical Report Summary on the Songwe Hill REE Project | Page 257 of 489 |
| |
Figure 13.20 and Figure 13.21 show the high-grade Phase 1 pit and the ultimate pit shell, in plan view and in section view looking east, respectively.
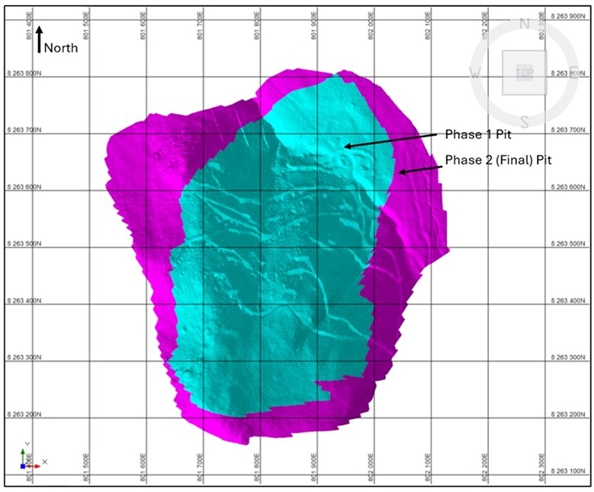
Figure 13.20: Phase 1 and 2 Pit Designs shown in Plan View
| S-K 1300 Technical Report Summary on the Songwe Hill REE Project | Page 258 of 489 |
| |
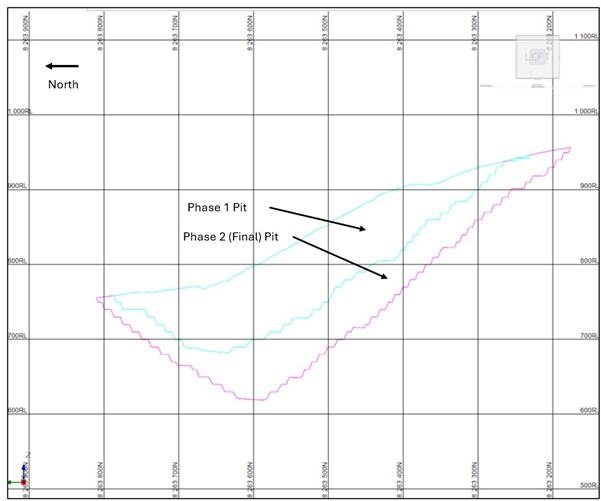
Figure 13.21: Phase 1 and 2 Pit Designs shown in Section View Looking East
| 13.7 | Mining Equipment |
A list of the required mining equipment has been provided by the Mining Contractor and was estimated based on the production rate required to supply the processing plant with the correct quantities of ore.
Productivity calculations were performed by Bara to check the fleet specified by the contractor. The productivity calculations are based on the following assumptions:
| ● | Operating days per year: | 356 (9 lost days) |
| ● | Operating shifts per day: | 2 × 11 h shifts |
| ● | Hours operated per shift: | 8 h (includes allowance for shift change, availability (80 %) and utilisation (80 %) of equipment) |
The requirement for secondary equipment was also specified by the contractor.
| S-K 1300 Technical Report Summary on the Songwe Hill REE Project | Page 259 of 489 |
| |
Table 13.14 shows the mining fleet requirement as specified by the contractor as well as the Bara estimate for the primary equipment requirement.
Table 13.14: Mining Fleet Requirement for Year 3
| Unit Type | Typical Model | Contractor
Estimate |
Bara
Estimate |
| Primary Mining Fleet | |||
| Excavator | Volvo EC950 Excavator | 3 | 3 |
| Haul Truck | Volvo A40G Articulated Dump Truck (ADT) | 14 | 12 |
| Drill (Explosives) | Pantera 1500 | 2 | 2 |
| Drill (Grade Control) | – | 1 | 1 |
| Secondary Vehicles | |||
| Dozer | Caterpillar D8R | 3 | |
| Grader | Caterpillar 140H | 2 | |
| Compactor | Caterpillar CS533E Compactor | 1 | |
| Front-End Loader | Caterpillar 966H Wheel Loader | 2 | |
| Diesel Lights | – | 8 | |
| Tractor loader backhoe (TLB) | Caterpillar 428 | 1 | |
| Diesel-Driven Dewatering Pumps | Xylem diesel-driven pump | 3 | |
| Light Vehicles | Toyota Land Cruiser | 8 | |
| Water Truck | Caterpillar 745C | 2 | |
| Diesel Bowser | Bell B18 | 1 | |
| Bus | Toyota Troop Carrier | 2 | |
| Service Truck (Breakdown) | – | 1 | |
| Crane Truck | – | 1 | |
| Diesel Generator | – | 2 | |
| Total | 57 | ||
| 13.8 | Manpower |
In order to estimate the manpower requirement for the operation of the Songwe Hill Project, data was sourced from a number of sources. Many of the operations, including mining operations, will be undertaken by contractors. As part of this report, contractors were approached to provide proposals for the mining operation. The manpower plans submitted by these contractors have been used in determining the overall site manpower plan.
The complement of people required by the mine owner to manage and operate the mine has been estimated. Labour costs have been applied to this complement to estimate the manpower portion of the Owner’s cost.
| S-K 1300 Technical Report Summary on the Songwe Hill REE Project | Page 260 of 489 |
| |
The labour schedule has been built up in monthly periods from the ramp-up period to full production.
Table 13.15 shows a summary of the manpower requirement at steady-state operation. Table 13.16 shows a summary of the manpower categories. Both tables indicate the relevant employer (mine owner or contractor).
Table 13.15: Summary of Manpower Plan
| Description | Total
Complement |
Mine Owner/Contractor |
| Contract Manager | 1 | Mine Owner |
| Technical Manager | 1 | Mine Owner |
| Production Manager | 1 | Contractor |
| Training Manager | 0 | Contractor |
| Pit Superintendent | 1 | Contractor |
| Pit Controller | 4 | Contractor |
| Safety, Health and Environment (SHE) Controller | 2 | Contractor |
| SHE Manager | 1 | Contractor |
| Trainer | 1 | Contractor |
| Surveyor | 1 | Contractor |
| Surveyor Assistant | 2 | Contractor |
| Surveyor | 1 | Mine Owner |
| Surveyor Assistant | 1 | Mine Owner |
| Senior Geologist | 1 | Mine Owner |
| Geologist | 2 | Mine Owner |
| Geological/Grade Control Technicians | 4 | Mine Owner |
| Geotechnical Engineer | 1 | Mine Owner |
| Geotechnicians | 2 | Mine Owner |
| Buying Clerk | 4 | Contractor |
| Logistics Controller | 1 | Contractor |
| Mine Planner | 2 | Mine Owner |
| Human Resources (HR) Administrator | 1 | Contractor |
| Store Clerk | 4 | Contractor |
| HR Clerk | 1 | Contractor |
| Data Capturing Clerk | 1 | Contractor |
| Administration Clerk (SHE) | 1 | Contractor |
| Drilling Foreman | 1 | Contractor |
| Drill Rig Operator | 6 | Contractor |
| Assistant Drill Rig Operator | 6 | Contractor |
| Load and Haul Foreman | 2 | Contractor |
| Earth-Moving Plant Foreman | 0 | Contractor |
| Dump Truck Operator | 28 | Contractor |
| Excavator Operator (Excavator and Shovel) | 6 | Contractor |
| S-K 1300 Technical Report Summary on the Songwe Hill REE Project | Page 261 of 489 |
| |
| Description | Total
Complement |
Mine Owner/Contractor |
| Dozer Operator | 1 | Contractor |
| Loader Operator | 1 | Contractor |
| Diesel Bowser Operator | 1 | Contractor |
| Grader Operator | 1 | Contractor |
| Water Bowser Operator | 1 | Contractor |
| Wheel Dozer Operator | 1 | Contractor |
| FEL Operator | 1 | Contractor |
| Dewatering Pump Operator | 2 | Contractor |
| People Bussing Operator | 8 | Contractor |
| Tyre Handler Operator | 1 | Contractor |
| Service Truck (Breakdown) Operator | 1 | Contractor |
| Roller Operator | 1 | Contractor |
| Multi-Skilled Operator | 8 | Contractor |
| Workshop Foreman | 1 | Contractor |
| Auto Electrician | 1 | Contractor |
| Boilermaker | 2 | Contractor |
| Diesel Mechanic | 2 | Contractor |
| Earth-Moving Mechanic (Breakdown) | 4 | Contractor |
| Maintenance Planner | 1 | Contractor |
| Apprentice | 2 | Contractor |
| General Worker (Cleaner, Water Pump Attendant, Surveyor) | 6 | Contractor |
| General Worker | 5 | Mine Owner |
| Explosives Team | 4 | Contractor |
| Original Equipment Manufacturer Specialist | 2 | Contractor |
| IT Support | 1 | Contractor |
| Total | 150 |
Table 13.16: Summary of Manpower Categories by Employer
| Employer | Complement |
| Mine Owner | 21 |
| Skilled (Paterson Band C and above) | 15 |
| Semi-skilled (Paterson Band A and B) | 6 |
| Contractor | 129 |
| Skilled (Paterson Band C and above) | 48 |
| Semi-skilled (Paterson Band A and B) | 81 |
| Total | 150 |
The Owner’s team will be responsible for the management of the Mining Contractor and for the provision and maintenance of the surface infrastructure required to support the mining and plant operator contractors.
Of the 150 people comprising the total manpower mining complement, 15 are expected to be expatriates, 63 will be skilled workers (Paterson Band C and higher), and 87 will be semi-skilled workers. The Paterson Band C and higher employees are expected to be housed on-site, while Paterson Band A and B employees are expected to be recruited from local communities. The manpower cost of the Owner’s team has been calculated by applying a cost-to-company rate, estimated by Bara, to the complement. The cost of manpower employed by the Mining Contractor is included in the contract rates, as discussed in Section 18.
| S-K 1300 Technical Report Summary on the Songwe Hill REE Project | Page 262 of 489 |
| |
| 14 | Processing and Recovery Methods |
| 14.1 | Overview |
The process design is based on a comprehensive test work programme, which is discussed in more detail in Section 10. MKAR is targeting a high-grade rare earth enriched, mixed rare earth carbonate (MREC) product that is cerium depleted. The key design parameters for the processing plant are summarised in Table 14.1. The more detailed process design is described in the sections below.
Table 14.1: Key Design Parameters
| Parameter | Unit | Value |
| ROM Feed Rate | t/a | 1,000,000 |
| ROM Head Grade | % w/w TREO | 1.5 |
| Operating Hours | h/a | 8,760 |
| Crushing Plant Availability | % | 65 |
| Flotation Feed Particle Size | μm, P80 | 16.7 |
| Flotation and Hydrometallurgical Plant Availability | % | 92 |
| Flotation Plant Feed Rate (Design) | t/h | 138 |
| Concentrate Mass Pull | % | 7.4 |
| Concentrate TREO Recovery | % | 74.1 |
| Concentrate TREO Grade | % w/w TREO | 15 |
| Hydrometallurgical Plant Feed Rate (design) | t/h | 10.8 |
| Rare Earth Carbonate Produced | t/a dry solids | 10,826 |
| Contained TREO in Product | t/a | 5,954 |
The concentrator plant flowsheet consists of the comminution and flotation circuits. Figure 14.1 shows the high-level flowsheet of the concentrator plant.
The hydrometallurgical plant flowsheet consists of several unit operations aimed at extracting, purifying and recovering REEs. Figure 14.2 shows the high-level flowsheet of the hydrometallurgical plant.
| S-K 1300 Technical Report Summary on the Songwe Hill REE Project | Page 263 of 489 |
| |
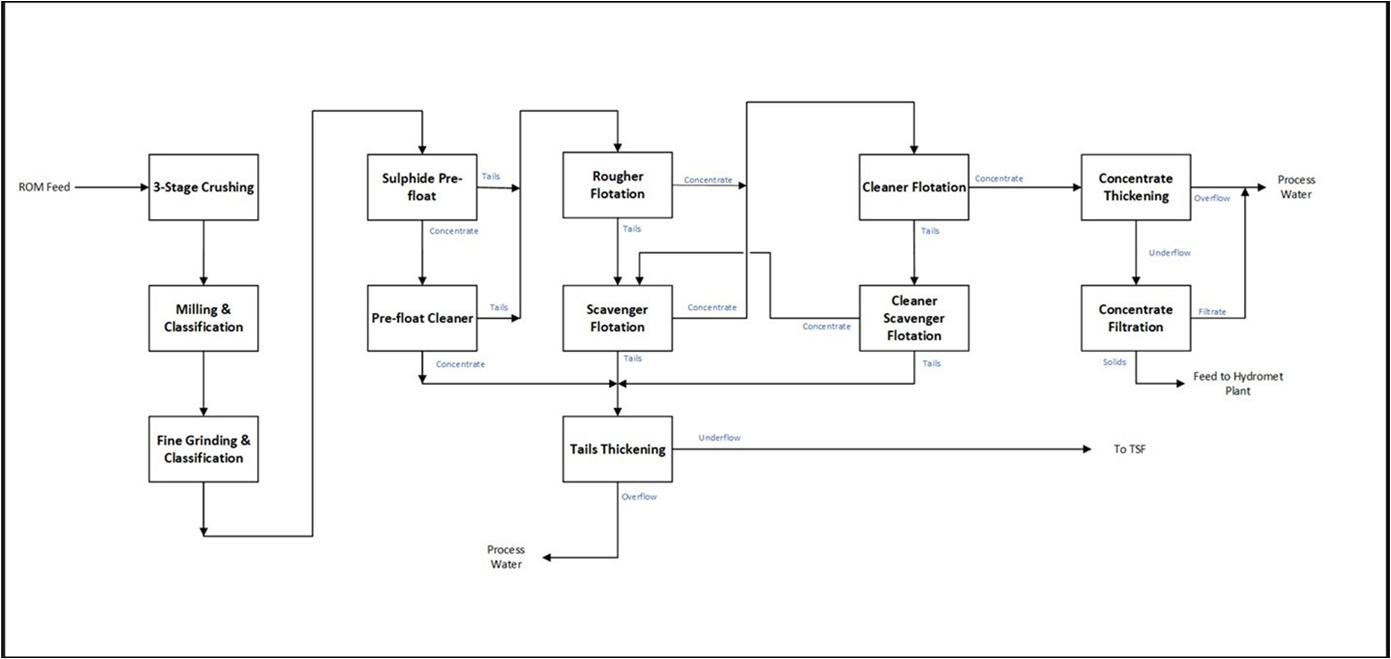
Figure 14.1: Concentrator Plant Flowsheet
| S-K 1300 Technical Report Summary on the Songwe Hill REE Project | Page 264 of 489 |
| |
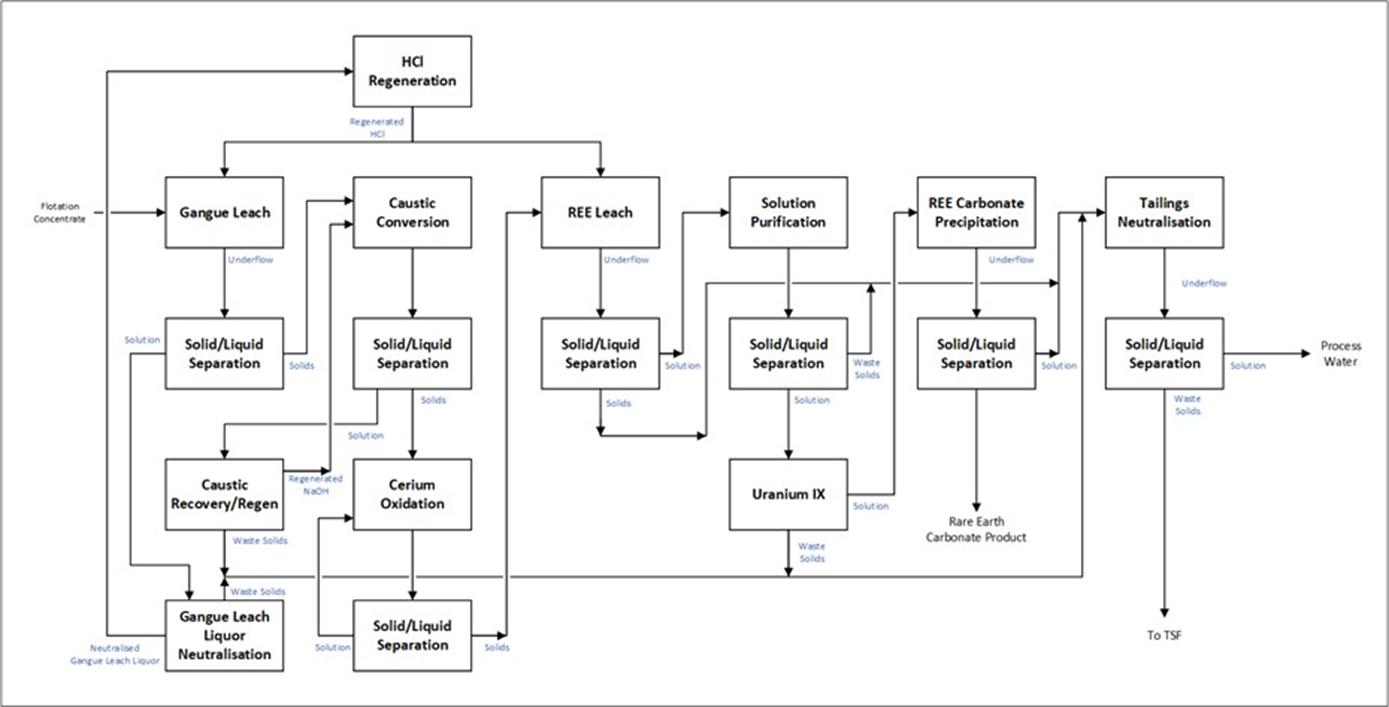
Figure 14.2: Hydrometallurgical Plant Flowsheet
| S-K 1300 Technical Report Summary on the Songwe Hill REE Project | Page 265 of 489 |
| |
| 14.2 | Process Description |
| 14.2.1 | Introduction |
Songwe Hill is an REE deposit in the south-eastern region of Malawi. It comprises mostly carbonaceous gangue minerals and rare earths associated with oxides. Minor amounts of sulphide minerals are also present. The purpose of the concentrator plant or “front end” is to produce a rare earth oxide (REO) concentrate, which is to be treated in a subsequent hydrometallurgical plant.
Flotation of oxide minerals is typically more difficult to achieve than flotation of sulphide minerals, and a defining characteristic of this Project has been to develop a flotation circuit and reagent suite that effectively float the REOs from the other oxidic gangue. The key in achieving flotation recovery lies in the combination of fine grinding, high-intensity conditioning, elevated temperature, and the correct reagent suite and dosages.
A PFS was completed for Songwe Hill by SNC-Lavalin in 2015, after which SENET was commissioned to proceed with several scoping studies to define the scope of the subsequent 2022 DFS and develop the 2022 TR. Continuous flotation test work drove the development of the process design, and the current flotation circuit has been proven to produce good recoveries and concentrate grades. The update to the 2022 TR, presented in this TRS, has maintained the process design, focusing only on updating the CAPEX and OPEX to reflect 2025 prices.
The processing plant consists of two circuits, namely the concentrator and the hydrometallurgical plant.
| 14.2.1.1 | Concentrator Plant |
The crushing circuit consists of a primary jaw crusher and secondary and tertiary cone crushers. Primary and secondary screens are used to optimise the size of the crushers. The crushed product is milled in a ball mill in a closed circuit with a primary cyclone cluster. The cyclone overflow is ground in stirred media mills and classified before being pumped to the flotation circuit.
The flotation circuit starts with sulphide pre-float rougher and cleaner cells to remove sulphide minerals ahead of the main REO flotation. Pre-float tails are conditioned and fed into REO roughers and scavengers. The rougher and scavenger concentrate is treated in cleaner cells, and the cleaner concentrate ultimately reports to the concentrate thickener. The thickener underflow is filtered and sent to the hydrometallurgical plant for further processing. The cleaner tails are treated in cleaner scavenger cells, and the concentrate is recycled to the rougher scavenger feed. The rougher, scavenger and cleaner scavenger tails report to the tailings thickener and are pumped to a TSF.
| 14.2.1.2 | Hydrometallurgical Plant |
The hydrometallurgical plant receives the flotation concentrate from the flotation plant and treats it with an up-front gangue leach to dissolve the acid-consuming gangue minerals with dilute acid. Gangue leach liquor is purified to precipitate impurities, filtered, and dosed with calcium chloride and sulphuric acid to regenerate hydrochloric acid and produce solid gypsum for possible sale.
| S-K 1300 Technical Report Summary on the Songwe Hill REE Project | Page 266 of 489 |
| |
Gangue leach residue is contacted with concentrated NaOH solution at a high temperature in order to convert insoluble rare earth minerals into soluble rare earth hydroxides in the caustic conversion. The caustic conversion residue proceeds to cerium oxidation, where the slurry is sparged with air to oxidise cerium and render it insoluble in the subsequent rare earth leach. The caustic conversion solution is evaporated to reconcentrate it and then undergoes a causticisation process to regenerate sodium hydroxide for reuse in the process.
Cerium oxidation residue is thickened and filtered before being fed into a more severe rare earth leach with hydrochloric acid. The leach residue is thickened and filtered before being repulped in the hydrometallurgical tails neutralisation area and then combined with flotation and other hydrometallurgical tails streams to be sent to the TSF. Gypsum generated from the process as waste, is filtered, dried and sold to cement and allied industries. Rare earth leach liquor is purified of heavy metals and radionuclides before being precipitated as an MREC product.
Details of the two plants are described in the following sections.
| 14.2.2 | Crushing |
ROM ore is delivered to the plant by haul trucks that tip the ore directly into the ROM bin. Material is withdrawn via an apron feeder and vibrating grizzly arrangement to feed the primary jaw crusher. A rock breaker is installed in the ROM bin area to break any oversize material that could become stuck in the primary crusher. The primary crusher product is discharged onto the primary crusher product conveyor. An overhead magnet installed on the conveyor removes any tramp steel. A belt weightometer installed on the primary crushing product conveyor controls the circuit feed tonnage by varying the speed of the ROM bin reclaim apron feeder.
The primary crusher product is conveyed to the secondary screen, which removes the target size material from the feed to the secondary cone crusher. The screen oversize is fed to the secondary crusher via a bin and pan feeder arrangement. The screen undersize joins the secondary crusher product and tertiary crusher product and is conveyed to the tertiary screen.
The tertiary screen oversize is fed into the tertiary cone crusher via a bin and pan feeder, and the tertiary screen undersize is conveyed to the ball mill feed bin. The tertiary crusher product is combined with the secondary screen undersize and secondary crusher product and conveyed to the tertiary screen to be classified once more in a recirculating loop.
The ball mill feed bin provides a process de-coupling between crushing and milling, and it also provides an 8 h surge capacity to allow for the lower availability in the crusher circuit. The mill feed bin overflows onto an emergency stockpile; the mill feed bin overflow can then be reclaimed with FELs and returned to the mill feed conveyor. The mill feed bin discharges onto the mill feed conveyor via a belt feeder.
A weightometer installed on the ball mill feed conveyor is used to control the mill circuit feed by varying the speed of the mill feed bin discharge belt feeder. The mill feed conveyor weightometer is used for metallurgical accounting purposes.
| S-K 1300 Technical Report Summary on the Songwe Hill REE Project | Page 267 of 489 |
| |
Conveyor skirting and dust enclosures, together with dust extraction systems, are included in the design as a means of containing the dust produced by the crushing circuit.
| 14.2.3 | Ball Milling |
The milling circuit comprises a ball mill operating in a closed circuit with a classification cyclone. Fresh feed to the ball milling circuit consists of crushed ore that is milled down prior to further grinding in the fine grinding circuit. Process water is fed at a ratio of the mill feed tonnage required to obtain the target in-mill solids density and is also added at a controlled rate to the mill discharge sump to achieve the set cyclone feed solids density.
Milled slurry overflows from the mill through the trommel screen to remove scats, and into the mill discharge sump. Scats are collected in a bunker and removed periodically using an FEL.
Mill discharge slurry is pumped to a cluster of hydrocyclones for classification. The cyclone overflow gravitates to the fine grinding circuit for further processing while the cyclone underflow gravitates back to the ball mill feed chute.
Steel grinding media are added into the mill feed chute by means of a magnet, hoist and kibble system. The media level in the mill is determined by measuring the mill power draw, and fresh media is added when the power draw decreases below a set limit.
Spillage in the area is contained by a concrete bunded area with a sloped floor to direct spillage to the mill feed side spillage sump, equipped with a vertical spindle pump to return the spillage to the mill discharge sump.
| 14.2.4 | Fine Grinding |
The product from the ball mill circuit gravitates to the regrind mill feed sump for ultra-fine grinding, which comprises several regrind mills operating in a closed circuit with a classification cyclone. The regrind mills use ceramic grinding media and stirrers to further decrease the size of the flotation feed slurry.
The cyclone underflow flows to a splitter box to feed four regrind mills operating in parallel, with one additional mill on standby. The product from the regrind mills reports back to the circuit feed sump to be classified once more in a recirculating loop.
The cyclone overflow gravitates to the flotation feed sampler, which comprises a two-in-one sampling system. The cyclone overflow material is passed through a trash screen, which separates out undesirable material, such as wood chips, to a skip. The screened underflow material gravitates to the pre-float rougher surge tank for further processing.
| 14.2.5 | Flotation |
The cyclone overflow from the fine grinding circuit reports to the flotation circuit of the concentrator.
The flotation circuit consists of rougher and cleaner sulphide pre-flotation, total rare earth oxide (TREO) rougher flotation, TREO scavenger flotation, TREO cleaner flotation, and TREO cleaner scavenger flotation. All cells are tank cells with forced-draft air systems.
| S-K 1300 Technical Report Summary on the Songwe Hill REE Project | Page 268 of 489 |
| |
Automatic head sampling consists of a feed box, launder, and a two-in-one sampling system (primary cross-cut sampler and vezin sampler) and provides flotation feed samples at regular intervals for metallurgical accounting purposes.
An on-line stream analyser is provided on the key feed, concentrate and tailings streams for process control purposes.
| 14.2.5.1 | Pre-Flotation Rougher Flotation |
The cyclone overflow material from the fine grinding cyclone cluster reports to the pre-float surge tank, where it is diluted with process water to the desired solids density for froth flotation. The diluted slurry is pumped, at a controlled rate and density, from the surge tank to an overflow conditioning tank, where collector and frother reagents are added. The reagents are dosed at the dosage rates required for optimal flotation performance. The conditioned slurry overflows by gravity to the first of four cells in series in the flotation bank. Blower air is provided via the low-pressure air reticulation system.
The concentrate from the cells gravitates into the pre-float rougher flotation concentrate sump, from where it is pumped to pre-float cleaner flotation. Spray water is provided at the concentrate launder of each cell to assist with washing down the froth and to improve flow.
Tailings gravitate to the pre-float rougher flotation tailings tank, from where they are pumped to the TREO rougher flotation.
Pressure pipe samplers are installed on the pre-float rougher flotation feed and tailings pump discharge lines, providing sample material to the automatic on-line stream analyser for plant control. Recirculating streams from the on-line stream analyser are directed back to the pre-float rougher flotation and rougher flotation feed surge tanks.
Spillage in the pre-float rougher flotation bunded area reports to the pre-float rougher flotation surge tank.
| 14.2.5.2 | Pre-Flotation Cleaner Flotation |
The pre-flotation cleaner flotation circuit is fed directly with pumped pre-float rougher concentrate material. This section comprises two cells in series. Blower air is provided via the low-pressure air reticulation system.
The concentrate from the cells gravitates into the pre-float cleaner concentrate sump, from where it is pumped to scavenger flotation. Spray water is provided at the concentrate launder of each cell to assist with washing down the froth and to prevent/minimise gangue material recovery or entrainment to the concentrate.
Tailings gravitate to the pre-float cleaner tailings tank, from where they are pumped to the TREO rougher flotation.
Pressure pipe samplers are installed on the pre-float cleaner concentrate and tailings discharge lines, providing sample material to the automatic on-line stream analyser for plant control. Concentrate and tailings return material from the on-line stream analyser are directed back to the scavenger flotation and rougher flotation feed surge tanks, respectively.
| S-K 1300 Technical Report Summary on the Songwe Hill REE Project | Page 269 of 489 |
| |
Spillage in the pre-float cleaner flotation bunded area reports to the first cell in the circuit.
| 14.2.5.3 | TREO Rougher Flotation |
The TREO rougher flotation circuit receives tailings material from the pre-float rougher and cleaner circuits via the rougher flotation surge tank. Steam is sparged into the surge tank to heat the slurry to the target temperature for downstream processing. The slurry is pumped, at a controlled rate and density, from the surge tank to a series of three overflow conditioning tanks, where further steam is sparged along with M4P, M7, caustic soda, collector, and frother. The reagents are dosed at the rates required for optimal flotation performance. The conditioned slurry overflows by gravity to the first of four cells in series in the flotation bank.
The flotation feed pumps from the surge tank control the level in the conditioning tanks and the feed rate to the flotation cells. Blower air is provided via the low-pressure air reticulation system.
The concentrate from the cells gravitates into the TREO rougher concentrate sump, from where it is pumped to cleaner flotation. Spray water is provided at the concentrate launder of each cell to assist with washing down the froth and to improve flow.
Tailings gravitate to the TREO rougher tailings tank, from where they are pumped to the scavenger flotation circuit, with the option of being bypassed to tailings thickening.
Pressure pipe samplers are installed on the rougher flotation concentrate and tailings discharge lines, providing sample material to the automatic on-line stream analyser for plant control. Concentrate and tailings return material from the on-line stream analyser are directed back to the cleaner and scavenger feed surge tanks, respectively.
Spillage in the rougher flotation bunded area reports to the rougher flotation surge tank.
| 14.2.5.4 | TREO Scavenger Flotation |
The TREO scavenger flotation circuit receives TREO rougher tailings and cleaner scavenger concentrate via the scavenger flotation surge tank. Steam is sparged into the surge tank to heat the slurry to the target temperature for downstream processing. The slurry is pumped, at a controlled rate and density, from the surge tank to a series of two overflow conditioning tanks ahead of flotation, where further steam is sparged along with M7, collector, and frother. The reagents are dosed at the dosage rates required for optimal flotation performance. The conditioned slurry overflows by gravity to the first of two cells in series in the flotation bank.
The flotation feed pumps from the surge tank control the level in the conditioning tanks and the feed rate to the flotation cells. Blower air is provided via the low-pressure air reticulation system.
The concentrate from the cells gravitates into the scavenger concentrate sump, from where it is pumped to cleaner flotation, with the option of being bypassed to concentrate thickening. Spray water is provided at the concentrate launder of each cell to assist with washing down the froth and to improve flow.
| S-K 1300 Technical Report Summary on the Songwe Hill REE Project | Page 270 of 489 |
| |
Tailings gravitate to the scavenger tailings tank, from where they are combined with cleaner scavenger tailings and pre-float cleaner concentrate and pumped to the tailings thickening circuit.
Pressure pipe samplers are installed on the scavenger flotation concentrate and the combined tailings discharge lines, providing sample material to the automatic on-line stream analyser for plant control. Rejects material from the on-line stream analyser is directed back to the scavenger feed surge tank.
Spillage in the scavenger flotation bunded area reports to the scavenger flotation surge tank.
| 14.2.5.5 | TREO Cleaner Flotation |
The TREO cleaner flotation cells receive as feed the concentrate streams from the rougher flotation and scavenger flotation circuits via the cleaner flotation surge tank. Steam is sparged into the surge tank to heat the slurry to the target temperature for downstream processing. The slurry is pumped, at a controlled rate and density, from the surge tank to a series of two overflow conditioning tanks ahead of flotation, where additional steam is sparged along with collector and frother reagents. The reagents are dosed at the dosage rates required for optimal flotation performance. The conditioned slurry overflows by gravity to the first of four cells in series in the flotation bank.
The flotation feed pumps from the surge tank control the level in the conditioning tanks and the feed rate to the flotation cells. Blower air is provided via the low-pressure air reticulation system.
The concentrate from the cells gravitates into the cleaner flotation concentrate sump, from where it is pumped to concentrate thickening. Spray water is provided at the concentrate launder of each cell to assist with washing down the froth and to prevent/minimise gangue material recovery or entrainment to the concentrate.
Tailings gravitate to the cleaner flotation tailings tank, from where they are pumped to the cleaner scavenger flotation circuit, with the option of being bypassed to the cleaner scavenger circuit.
Pressure pipe samplers are installed on the cleaner flotation concentrate and tailings discharge lines, providing sample material to the automatic on-line stream analyser for plant control. Concentrate and tailings rejects material from the on-line stream analyser is directed back to the cleaner feed surge tank and scavenger feed surge tank, respectively.
Spillage in the cleaner flotation bunded area reports to the cleaner flotation surge tank when required.
| 14.2.5.6 | TREO Cleaner Scavenger Flotation |
The cleaner flotation tailings material is pumped to the cleaner scavenger flotation surge tank ahead of the cleaner scavenger flotation. Steam is sparged into the surge tank to heat the slurry to the target temperature for downstream processing, and collector reagent is dosed at the required dosage rate. The conditioned slurry overflows by gravity to the first of three cells in series in the flotation bank.
| S-K 1300 Technical Report Summary on the Songwe Hill REE Project | Page 271 of 489 |
| |
The flotation feed pumps from the surge tank control the level in the conditioning tanks and the feed rate to the flotation cells. Blower air is provided via the low-pressure air reticulation system.
The concentrate from the cells collects in overflow boxes and flows gravimetrically to the cleaner scavenger flotation concentrate sump to be pumped to the feed surge tank on the scavenger flotation circuit. Spray water is provided at the concentrate launder of each cell to assist with washing down the froth and to prevent/minimise gangue material recovery or entrainment to the concentrate.
Tailings from the cleaner scavenger circuit collect in the cleaner scavenger flotation tailings sump, from where they are pumped to the scavenger flotation tailings tank along with pre-flotation concentrate to feed the tailings thickener.
A pressure pipe sampler is installed on the discharge line from the cleaner scavenger flotation tailings pumps. The sample reports to the automatic on-line stream analyser for plant control. Rejects from the on-line stream analyser are directed to the scavenger flotation area surge tank.
Spillage in the cleaner scavenger flotation bunded area is pumped via a spillage pump to the cleaner scavenger flotation surge tank when required.
| 14.2.6 | Concentrate Thickening |
The cleaner flotation concentrate slurry is pumped to the concentrate thickener for dewatering ahead of filtration. Scavenger flotation concentrate may also be bypassed intermittently to the concentrate thickener when required.
The concentrate slurry to the thickener is mixed with diluted flocculant in the feed well of the thickener to aid settling. The thickener underflow is pumped to the concentrate filter feed tank.
Clear thickener overflow water gravitates to the concentrate thickener overflow tank, from where it is pumped to the process water pond via the heat exchanger
The thickener feed passes through an automatic sampling system consisting of a stilling box, launder, and primary cross-cut and secondary vezin samplers. The final flotation tailings metallurgical accounting sample is taken at regular intervals at this point. Rejects from the secondary sampler, with by-passed sampler feed, are directed back to the concentrate thickener feed tank.
Spillage in the concentrate thickening area is contained in a bunded area and pumped back to the thickener using the spillage pump.
| 14.2.7 | Concentrate Filtration |
The concentrate thickener underflow material is pumped to the agitated filter feed tank for surge storage capacity ahead of the filters. The two duty concentrate filters are operated in a parallel, staggered cycling arrangement to match downstream processing in the hydrometallurgical plant.
| S-K 1300 Technical Report Summary on the Songwe Hill REE Project | Page 272 of 489 |
| |
The thickened concentrate material is further dewatered by a pressing action between the cloth surfaces of the filter press and forms the filter cake. After a completed filter cycle, the concentrate filter cake is discharged onto the concentrate filter transfer and discharge conveyors, which offload the filter cake either to the conveyor feeding the hydrometallurgical plant for repulping and further downstream processing or to the emergency stockpile during process upset conditions.
The cloth wash water tank pumps raw water to the filters for cloth cleaning.
The filtrate gravitates to the filtrate tank and is pumped back to the concentrate thickening tank.
A weightometer is fitted onto the filter discharge conveyors for metal accounting of the final concentrate from the plant.
| 14.2.8 | Tailings Thickening |
The tailings thickener receives feed slurry from the combined flotation tailings sump in the scavenger flotation circuit for dewatering ahead of disposal in the TSF. Rougher tailings may also be bypassed intermittently to the tailings thickener when required.
The tailings slurry to the thickener is mixed with diluted flocculant in the feed well of the thickener to aid settling. The thickener underflow material is pumped to the agitated final tailings tank, from where it is pumped to the TSF. A dedicated system consisting of a tank and pumps for supplying high-pressure gland seal water for the tailings disposal pumps is provided.
Clear thickener overflow water gravitates to the tailings thickener overflow tank, from where it is pumped to the process water pond via the heat exchanger
The thickener feed passes through an automatic sampling system consisting of a stilling box, launder, and primary cross-cut and secondary vezin samplers. The final flotation tailings metallurgical accounting samples are taken at regular intervals at this point. Rejects from the secondary sampler, with bypassed sampler feed, are directed back to the tailings thickener feed tank.
Spillage in the tailings thickening area is contained in a bunded area and pumped back to the thickener using the spillage pump.
| 14.2.9 | Tailings Storage and Return Water |
Thickened tailings from the tailings thickener underflow are pumped to the TSF, along with the hydrometallurgical plant final tailings. Water from the settled tailings is siphoned off and pumped via return water pumps to the TSF return water pond.
The return water pumps pump water from the TSF return water pond to the process water pond for use in the plant process water circuit.
| S-K 1300 Technical Report Summary on the Songwe Hill REE Project | Page 273 of 489 |
| |
| 14.2.10 | Reagents |
Various reagents are used in the flotation circuits to achieve a concentrate grade that is as rich in the value-bearing minerals as possible. The following reagents are added at selected points within the flotation circuit:
| ● | pH modifier: Modifier 2 |
| ● | Flocculant: Magnafloc 351 or equivalent |
| ● | Modifiers: Modifier M7 and Modifier M4P |
| ● | Frother: F1P |
| ● | Collectors: C15P and potassium amyl xanthate (PAX) |
Each reagent area is equipped with an eye-wash station and a safety shower. Hoists are provided to lift reagent bags/drums.
| 14.2.10.1 | Sodium Hydroxide |
Sodium hydroxide (caustic) is delivered to site in bulk bags, lifted using a hoist, broken via a bulk bag breaker, fed into the caustic make-up tank, and mixed mechanically via the caustic make-up agitator with the required amount of raw water to attain a target concentration of 5 % w/w. Once the solution is made up, it is pumped via transfer pumps to the concentrator sodium hydroxide dosing tank or the hydrometallurgical sodium hydroxide dosing tank.
The flotation circuit requires cleaner sodium hydroxide than the hydrometallurgical circuit, which is why the concentrator sodium hydroxide dosing tank does not receive regenerated sodium hydroxide from the evaporator and sodium hydroxide regeneration circuit. Positive displacement pumps dose sodium hydroxide to the rougher flotation area, and the sodium hydroxide flow rate is controlled by pH measurement, which adjusts the positive displacement pump speed.
Regenerated sodium hydroxide is pumped into the hydrometallurgical plant sodium hydroxide dosing tank and topped up with freshly made-up sodium hydroxide to account for sodium hydroxide consumption, losses and bleed streams in the process.
Spillage in the caustic area is contained in a bunded area and directed to the floor sump, which is equipped with a spillage pump that pumps the spillage into the tailings thickener feed tank.
| 14.2.10.2 | Flocculant |
The flocculant make-up plant feeds dilute flocculant solution to the concentrate thickener and the tailings thickener.
The flocculant bags are lifted and emptied into the flocculant feed hopper. The flocculant in the flocculant feed hopper is withdrawn using a screw feeder. The flocculant powder is then transferred to a liquid jet eductor driven by high-pressure raw water. The screw feeder is programmed to operate on a timer, set to deliver the required amount of dry flocculant to prepare a batch of the desired concentration.
After the flocculant powder is wetted in the liquid jet eductor, it is discharged into the mixing tank. The concentrated flocculant solution is mixed at the target concentration of 0.25 % w/v using a low-shear agitator and then pumped to the flocculant dosing tank. Flocculant dosing is controlled by varying the speed of the flocculant dosing pumps prior to in-line dilution to the target concentration of 0.025 % w/v with recirculating thickener overflow in the respective areas.
| S-K 1300 Technical Report Summary on the Songwe Hill REE Project | Page 274 of 489 |
| |
Spillage in the flocculant make-up area is contained in a bunded area, which is equipped with a spillage pump that pumps the spillage into the tailings thickener feed tank.
| 14.2.10.3 | Flotation Modifiers |
| 14.2.10.3.1 | Modifier M7 |
M7 is delivered to site in liquid form via bulk tankers and stored in on-site storage tanks. Concentrated M7 is transferred from the storage tank to the make-up/mixing tank, where it is combined with the required amount of raw water to attain the target concentration of 4 % v/v required in the flotation process. From the make-up tank, the diluted M7 solution is pumped via transfer pumps to the dosing tank. Dedicated dosing pumps deliver the diluted M7 solution at the required dosage rates from the dosing tank to the relevant dosing points within the flotation circuit.
Spillage in the M7 make-up area is contained in a bunded area and directed to the floor sump, which is equipped with a spillage pump that pumps the spillage into the tailings thickener feed tank.
| 14.2.10.3.2 | Modifier M4P |
M4P is delivered to site in powder form in bulk bags, lifted using a hoist, broken via a bulk bag breaker, fed into and mixed mechanically via an agitator in the make-up tank with the required amount of raw water to attain a target concentration of 1 % w/w. Once the solution is made up, the M4P is pumped via transfer pumps to the dosing tank. Dedicated dosing pumps deliver diluted M4P solution at the required dosage rates from the dosing tank to the relevant dosing points within the flotation circuit.
Spillage in the M4P make-up area is contained in a bunded area and directed to the floor sump, which is equipped with a spillage pump that pumps the spillage into the tailings thickener feed tank.
| 14.2.10.4 | Frother |
Frother is used in the flotation process to produce the froth or foam to which the valuable minerals attach (in and on the surface of a froth layer) for recovery.
Frother solution is delivered in an intermediate bulk container. A drum pump is used to pump neat frother into the dilution tank, where it is combined with the required amount of raw water to attain a target concentration of 2 % w/w solution prior to transfer to the dosing tank. Dedicated dosing pumps deliver diluted frother at the required dosage rates from the dosing tank to the relevant dosing points within the flotation circuit.
Spillage in the frother make-up area is contained in a bunded area and directed to the floor sump, which is equipped with a spillage pump that pumps the spillage into the tailings thickener feed tank.
| S-K 1300 Technical Report Summary on the Songwe Hill REE Project | Page 275 of 489 |
| |
| 14.2.10.5 | Collectors |
A collector attaches to the mineral surface and produces a hydrophobic surface to improve recovery in the flotation process.
| 14.2.10.5.1 | C15P |
The collector bags are delivered to the make-up area and lifted onto the top of the make-up tank using the reagent area hoist. The operator lifts the bags onto the bag breaker, which discharges the collector powder into the make-up tank, which is half-filled with raw water. Once the required number of bags has been added to the make-up tank, the tank is topped up with the required amount of raw water to attain a target concentration of 5 % w/w.
After the collector powder is dissolved completely during the make-up process, the solution is pumped to the collector dosing tank using a transfer pump. Dedicated dosing pumps deliver diluted collector solution at the required dosage rates from the dosing tank to the relevant dosing points within the flotation circuit.
| 14.2.10.5.2 | Potassium Amyl Xanthate |
The PAX bags are delivered to the make-up area and lifted onto the top of the make-up tank using the reagent area hoist. The operator lifts the bags onto the bag breaker, which discharges the PAX powder into the make-up tank, which is half-filled with raw water. Once the required number of bags has been added to the make-up tank, the tank is topped up with the required amount of raw water to attain a target concentration of 0.5 % w/w.
After the PAX powder is dissolved completely during the make-up process, the solution is pumped to the PAX dosing tank using a transfer pump. Dedicated dosing pumps deliver diluted PAX solution at the required dosage rates from the dosing tank to the relevant dosing points within the flotation circuit.
| 14.2.11 | Grinding Media |
Grinding media storage bunkers are constructed in the milling area to hold the ball mill and regrind mill grinding media.
| 14.2.11.1 | Ball Mill |
The ball loading system for the ball mill consists of a ball loading hopper (fed by an FEL) with a transfer chute and ball loading kibble. The overhead travelling hoist is used to lift the kibble and feed the steel balls to the ball feeding hopper located at the mill feed chute. The ball addition rate is based on the mill power draw. A detailed, standard operating procedure for this method will be developed in later Project stages.
| 14.2.11.2 | Regrind Mill |
The ball loading method used for the regrind mill consists of an overhead travelling hoist, which is used to lift the ceramic media bulk bags and feed the media into the media feeding hopper located at the mill feed chute, inside the vendor package. A detailed, standard operating procedure for this method will be developed in later Project stages and provided by the mill supplier.
| S-K 1300 Technical Report Summary on the Songwe Hill REE Project | Page 276 of 489 |
| |
| 14.2.12 | Air Services |
The plant air high-pressure compressors supply the plant air required for the concentrate filter press receiver and the instrument air receiver, in a single duty/standby arrangement. Air from the compressors to the filter press is filtered through a pair of air filters before it is stored in the filter air receiver.
Instrument air is passed through a pair of air filters and the instrument air dryer. Dried instrument air is filtered again through a pair of air filters before it is stored in the instrument air receiver. The instrument air is distributed from the receiver to all the air-operated instruments throughout the plant.
A common air services plant supplies the concentrator and hydrometallurgical plants with air services.
The low-pressure compressors (one duty and one standby) supply the low-pressure air required for the flotation circuit in a flotation air ring main.
| 14.2.13 | Water Services |
| 14.2.13.1 | Process Water Distribution |
The sources of process water are the concentrate thickener overflow, tailings thickener overflow, the raw water top-up, and TSF return water. Process water is used in milling and the flotation circuits for dilution, launder spray water, flushing, hosing, and screen washing applications.
Process water from the flotation concentrate thickener and flotation tails thickener is still at the flotation temperature – approximately 50 °C. This thickener overflow is not sent to the TSF because of the contained heat that will be lost. Instead, it is stored in a separate pond with an interchange heat exchanger to salvage heat from the incoming solution and transfer it to the process water stream being pumped to the milling and flotation circuit.
The following solution streams are sent to the TSF:
| ● | Moisture with the flotation tails slurry |
| ● | Moisture with the hydrometallurgical plant waste residue filter cakes |
| ● | Barren solution from rare earth carbonate precipitation (containing chlorides and ammonium) |
The TSF is lined and sized to accommodate the impurities present in the above-mentioned moisture streams based on the geochemical characterisation performed by SGS Australia (2022).
The TSF return stream to the process water pond has the ability to be wholly or partially fed through a reverse osmosis (RO) plant, which will prevent the build-up of deleterious elements in recirculating water streams from the plant. Impurities that build up in the process water stream with repeated circulation in the flotation circuit will also be removed in the process water reverse osmosis plant, as will any impurities present in the borehole water entering the system as top-up to accommodate moisture losses in the processing plant. Brine from the RO plant is pumped to the TSF, where it is diluted with other waste liquor streams, of which a certain percentage remains on the TSF as it fills up. A combined TSF water stream is then returned to the plant to be partially or wholly purified, depending on the water quality. During the next phase of study, the brine handling will be further refined and optimised along with the potential recovery of ammonium and chloride discussed below.
| S-K 1300 Technical Report Summary on the Songwe Hill REE Project | Page 277 of 489 |
| |
The SENET mass balance has included hydrological studies from the environmental and tailings consultants to determine the level to which elements such as chlorine and ammonium will build up in the TSF return water stream.
During the next phase of study, options will be evaluated to further reduce the recirculating chloride and ammonium quantities, with the possibility of regenerating reagents for reuse in the plant or for sale to external customers.
| 14.2.13.2 | Raw Water Distribution |
Raw water is drawn from a wellfield of boreholes and, once abstracted, is stored in a borehole receiving tank, from which it is pumped to the raw water pond. Raw water is also used for potable water top-up, fire water top-up, primary crushing (dust suppression), and process water top-up.
Water is pumped from the raw water pond, via the concentrator raw water pumps, to the vendor filter package. Filtered water from the filtration plant is stored in a gland water tank to supply gland service water to the concentrator plant and the hydrometallurgical plant. Filtered water is also pumped to the concentrator raw water tank, which supplies water to the reagents, steam and concentrate filtration circuits.
| 14.2.13.3 | Potable Water Distribution |
Raw water is supplied to the potable water treatment plant and treated for potable water distribution. Potable water is stored in the potable water storage tank and delivered to the potable water hydrospheres. The hydrospheres are used to maintain the required pressure in the potable water distribution and safety shower headers. Potable water is used for the safety showers of the concentrator plant and the hydrometallurgical plant. A potable water line is also installed to supply water by gravity to the surrounding infrastructure (site camp, administration buildings and mining services).
| 14.2.13.4 | Fire Water Distribution |
Fire water is drawn from the raw water pond. The raw water pond has pump suction locations at different levels along the pond wall – the top-level suctions feeding the raw water pumps supplying raw water to the rest of the plant, and the lower-level suctions providing water for fire suppression. This is done to ensure that there is always sufficient fire water capacity and that the required fire water capacity is not used by another part of the plant. An electric pump serves as the primary fire water pump, with a diesel-driven pump as a standby pump to supply water to the fire water system in the event of a power outage. A jockey pump maintains the fire water system pressure for the concentrator plant and the hydrometallurgical plant.
| 14.2.13.5 | Steam Plant |
The steam plant consists of vendor-supplied electrical boilers (configured in a duty/standby arrangement), operating in a closed circuit with the hydrometallurgical plant condensate return. Filtered raw water is converted to steam in electrical boilers. Steam is required for direct injection via spargers at surge tanks and conditioner tanks in the flotation circuit, to maintain the targeted slurry temperature. Steam is also used in the hydrometallurgical plant for the caustic conversion, gangue leach and caustic evaporation processes.
| S-K 1300 Technical Report Summary on the Songwe Hill REE Project | Page 278 of 489 |
| |
| 14.2.14 | Gangue Leach |
The flotation concentrate is conveyed into an open-top, agitated repulp tank that is dosed with regenerated hydrochloric acid and dilution water to achieve the correct pre-leach slurry solids concentration.
The repulped gangue leach slurry is pumped into the first of four closed-top, agitated leach tanks, where gangue minerals are selectively dissolved into solution. Each leaching tank overflows into the next, and the circuit has the flexibility to remove any one tank from duty without interrupting the process. Acidic fumes from the reaction between carbonaceous gangue and hydrochloric acid are ducted away to a scrubber.
The incoming hydrochloric acid solution passes through a gangue leach heat exchanger to be heated up with hot water before entering the repulp and leaching tanks. The hot water used to heat up the hydrochloric acid is also circulated through coils in the first two leaching tanks in order to maintain the temperature of the gangue leach at 80 °C. Hydrochloric acid solution is added to the tanks in order to maintain the acidity of the leach at a pH of 4.
The leached slurry is pumped from either Tank 4 or Tank 3 (if Tank 4 is offline) into the feed tank of the gangue leach thickener. The high-rate gangue leach thickener increases the slurry density prior to filtration. The thickener underflow is pumped to the agitated gangue leach filter feed tank. The thickener overflow is collected in an overflow tank, and from there it is pumped to gangue leach liquor purification tanks.
The filter feed slurry is pumped with high-pressure pumps into the gangue leach filter. The filter is a horizontal recessed chamber filter. The filter cake is washed by circulating a predetermined amount of raw water through the bed of solids. The gangue leach filter discharge conveyor discharges the filter cake into the caustic conversion repulp tank. The filtrate is collected in a sloped-bottom tank and pumped back to the gangue leach thickener.
| 14.2.15 | Caustic Conversion |
The gangue leach residue filter cake is conveyed into an open-top, agitated repulp tank that is dosed with regenerated sodium hydroxide and dilution water to achieve the correct solids density before caustic conversion.
The repulped caustic conversion slurry is pumped into the first of four closed-top, agitated conversion tanks, where rare earth minerals that are refractory to hydrochloric acid leach are converted into more soluble rare earth hydroxides. Each tank overflows into the next, and the circuit has the flexibility to remove any one tank from duty without interrupting the process. Fumes from the hot caustic solution are ducted away into a scrubber.
The temperature in the caustic conversion process is measured and maintained at between 90 °C and 100 °C via the sparging of low-pressure saturated steam into the first and second caustic conversion tanks.
| S-K 1300 Technical Report Summary on the Songwe Hill REE Project | Page 279 of 489 |
| |
The converted slurry is pumped from either Tank 4 or Tank 3 (if Tank 4 is offline) into the feed tank of the caustic conversion thickener. The high-rate caustic conversion thickener increases the slurry density prior to filtration. The thickener underflow is pumped to the agitated gangue leach filter feed tank. The thickener overflow is collected in an overflow tank, and from there it is pumped to the caustic evaporation feed tank.
The filter feed slurry is pumped with high-pressure pumps into the gangue leach filter. The filter is a horizontal recessed chamber filter press. The filter cake is washed by circulating a predetermined amount of raw water through the bed of solids. The gangue leach filter discharge conveyor discharges the filter cake into the cerium oxidation repulp tank. The filtrate is collected in a sloped-bottom tank and pumped back to the caustic conversion thickener.
| 14.2.16 | Cerium Oxidation |
The caustic conversion residue filter cake is conveyed into an open-top, agitated repulp tank that is fed with cerium oxidation thickener overflow solution to achieve the correct solids density before cerium oxidation.
The repulped cerium oxidation slurry is pumped into the first of four closed-top, agitated tanks, where cerium is oxidised with air in order to render it insoluble during the rare earth leach. The process temperature is not controlled. Air flow is controlled at a volumetric set point that is determined by test work and verified during commissioning to achieve an optimal oxidation of cerium. Air is supplied by a duty-standby arrangement of air blowers with control instrumentation, and air is sparged into all four cerium oxidation tanks. Each tank overflows into the next, and the circuit has the flexibility to remove any one tank from duty without interrupting the process.
The discharge slurry is pumped from either Tank 4 or Tank 3 (if Tank 4 is offline) into the feed tank of the cerium oxidation thickener. The high-rate cerium oxidation thickener increases the slurry density prior to filtration. The thickener underflow is pumped to the agitated cerium oxidation filter feed tank. The thickener overflow is collected in an overflow tank, and from there it is pumped to the cerium oxidation repulp tank.
The filter feed slurry is pumped with high-pressure pumps into the cerium oxidation filter. The filter is a horizontal recessed chamber filter press. The filter cake is washed by circulating a predetermined amount of raw water through the bed of solids. The cerium oxidation filter discharge conveyor discharges the filter cake into the rare earth leach repulp tank. The filtrate is collected in a sloped-bottom tank and pumped back to the cerium oxidation thickener.
| 14.2.17 | Rare Earth Leach |
The converted and oxidised filter cake is conveyed into an open-top, agitated repulp tank that is dosed with regenerated hydrochloric acid and dilution water to achieve the correct pre-leach slurry density.
The repulped leach slurry is pumped into the first of four open-top, agitated leach tanks, where the rare earth minerals are dissolved. Each leaching tank overflows into the next, and the circuit has the flexibility to remove any one tank from duty without interrupting the process.
| S-K 1300 Technical Report Summary on the Songwe Hill REE Project | Page 280 of 489 |
| |
The incoming hydrochloric acid solution is not heated, and the reaction takes place at ambient temperatures and pressure. The pH is controlled at a set point of 2 by the addition of hydrochloric acid solution into either of the first two leaching tanks.
The leached slurry is pumped from either Tank 4 or Tank 3 (if Tank 4 is offline) into the feed tank of the rare earth leach thickener. The high-rate gangue leach thickener increases the slurry density prior to filtration. The thickener underflow is pumped to the agitated rare earth leach filter feed tank. The thickener overflow is collected in an overflow tank, and from there it is pumped to the PLS purification tanks.
The filter feed slurry is pumped with high-pressure pumps into the rare earth leach filter. The filter is a horizontal recessed chamber filter press. The filter cake is washed by circulating a predetermined amount of raw water through the bed of solids. The rare earth leach filter discharge conveyor discharges the filter cake into the hydrometallurgical tails neutralisation repulp tank. The filtrate is collected in a sloped-bottom tank and pumped back to the rare earth leach thickener. The filter press package contains all auxiliary equipment such as a cloth wash water tank and pumps, and manifold flush.
| 14.2.18 | PLS Purification |
The PLS from the rare earth leach thickener contains significant amounts of zinc and other base metals, but also minor amounts of radium, so it is necessary to purify it.
The PLS solution is pumped into the first of six agitated, open-top purification tanks that overflow from the first into the next.
Sodium hydroxide is dosed into either or both of the first two purification tanks to control the pH at approximately 5. Sodium sulphide is added to the first two tanks to precipitate zinc and other base metals as sulphides, which become insoluble at a pH of approximately 5. Sodium sulphide is controlled by the volumetric flow of the feed solution and the concentration of the base metals as indicated by test work.
Barium chloride and calcium sulphate are dosed into Tank 3 and/or Tank 4 to facilitate the precipitation of radium sulphate. Dosing is controlled by the volumetric flow and the concentration of radium in the feed solution, determined by test work.
Tanks 5 and 6 serve to provide residence time and sufficient reaction kinetics for the respective reactions to reach equilibrium. The discharge from Tank 6 or Tank 5 (if Tank 6 is offline) is pumped into the feed tank of the PLS purification thickener. The high-rate PLS purification thickener increases the slurry density prior to filtration. The thickener underflow is pumped to the agitated PLS purification filter feed tank. A recycle stream is taken from the thickener underflow pumps and returned to the first or second tank to serve as a reseed for crystal growth in the tanks. The thickener overflow is collected in an overflow tank, and from there it is pumped to the uranium ion exchange feed tank.
A bleed stream from the PLS purification thickener overflow is taken and mixed with flocculant before being reintroduced to the thickener feed in order to improve the settling rate of the solids.
The filter feed slurry is pumped with high-pressure pumps into the PLS purification filter. The filter is a horizontal recessed chamber filter press. The filter cake is washed by circulating a predetermined amount of raw water through the bed of solids. The PLS purification filter discharge conveyor discharges the filter cake into the hydrometallurgical tails neutralisation repulp tank. The filtrate is collected in a sloped-bottom tank and pumped back to the PLS purification thickener.
| S-K 1300 Technical Report Summary on the Songwe Hill REE Project | Page 281 of 489 |
| |
| 14.2.19 | Uranium Ion Exchange |
The purified PLS contains trace amounts of uranium that may precipitate with any rare earths.
The uranium ion-exchange plant consists of a feed tank that receives PLS from PLS purification. Three fixed-bed ion-exchange columns operate in a lead-lag-guard configuration, in which fresh PLS is pumped through the adsorption columns countercurrently to the flow of resin. The respective roles of the columns are alternated in cycles to load and elute the resin.
The loaded resin is washed and stripped with hydrochloric acid in an elution cycle that prepares the resin for use in the adsorption cycle once more. The resin inventory is measured and topped up with new resin as required.
The PLS stripped of uranium is pumped to the rare earth precipitation area. Waste eluate is neutralised, during which uranium is precipitated as a solid which is disposed of along with the rest of the tails.
| 14.2.20 | Rare Earth Precipitation |
The PLS from the uranium ion exchange plant is received into the first or second of four open-top, agitated precipitation tanks in series. The tanks overflow from one to the other, and valving arrangements allow for any one tank to be taken offline without interrupting the process.
The ammonium bicarbonate solution is dosed into Precipitation Tank 1 and/or Precipitation Tank 2, and the volumetric flow of the ammonium bicarbonate solution is controlled to maintain the pH of the precipitation process at 6 to 6.5.
The discharge slurry from Tank 4 or Tank 3 (if Tank 4 is offline) is pumped into the feed tank of the rare earth precipitation thickener. The high-rate rare earth precipitation thickener sufficiently increases the slurry density prior to filtration. The thickener underflow is pumped to the agitated rare earth precipitation filter feed tank. A recycle stream is taken from the thickener underflow pumps and returned to the first or second tank to serve as a reseed for crystal growth in the tanks. The recycle stream density is measured and controlled according to the solids flow back to the precipitation tanks. The thickener overflow is collected in an overflow tank, and from there it is pumped to the hydrometallurgical tails neutralisation tank.
The filter feed slurry is pumped with high-pressure pumps into the rare earth precipitation filter. The filter is a horizontal recessed chamber filter press. The filter cake is washed by circulating a predetermined amount of raw water through the bed of solids. The rare earth precipitation filter discharge conveyor discharges the filter cake onto a product stockpile, from where it is loaded with an FEL into a drumming plant for product packaging. The filtrate is collected in a sloped-bottom tank and pumped back to the rare earth precipitation thickener.
| S-K 1300 Technical Report Summary on the Songwe Hill REE Project | Page 282 of 489 |
| |
| 14.2.21 | Hydrometallurgical Tails Neutralisation |
The combined hydrometallurgical plant tailings streams are the following:
| ● | Rare earth leach residue |
| ● | Causticisation residue |
| ● | PLS purification residue |
| ● | Gangue leach liquor neutralisation residue |
The combined hydrometallurgical tailings, along with spillage from several areas, are either pumped or conveyed into the open-top, agitated hydrometallurgical tailings neutralisation repulp tank along with raw water to achieve the correct slurry solids density.
The repulped tailings slurry is pumped to the first of three open-top, agitated tanks in series for neutralisation. The tanks overflow from one into the next, and valving arrangements allow for any one tank to be taken offline without interrupting the process.
The hydrated lime slurry is dosed into the first and/or second tank, and the volumetric flow of the lime is controlled to maintain the pH of the neutralisation tanks at approximately 10.
The discharge slurry from Tank 3 or Tank 2 (if Tank 3 is offline) is pumped into the feed tank of the hydrometallurgical tails neutralisation thickener. The high-rate hydrometallurgical tails neutralisation thickener increases the slurry density prior to tails discharge. The thickener underflow is pumped to the flotation tails thickener underflow tank, from where it is pumped to the TSF with the flotation tails.
| 14.2.22 | Gangue Leach Liquor Purification |
The gangue leach liquor contains significant amounts of detrimental elements that interfere with reactions and build up in the system due to the recycle of regenerated hydrochloric acid. Before the gangue leach liquor can be fed into the hydrochloric acid regeneration process, it must first be purified of certain metal species in solution such as iron and aluminium.
The gangue leach thickener overflow is pumped into the first of three open-top, agitated purification tanks that overflow from one to the next.
The hydrated lime slurry is pumped into Tank 1 and/or Tank 2, and the volumetric flow of the lime slurry is controlled to maintain the pH at approximately 10 to facilitate the precipitation of impurity base metals as insoluble base metal hydroxides.
The discharge slurry from Tank 3 or Tank 2 (if Tank 3 is offline) is pumped into the feed tank of the gangue leach liquor neutralisation thickener. The high-rate gangue leach liquor neutralisation thickener increases the slurry density prior to filtration. The thickener underflow is pumped to the agitated gangue leach liquor neutralisation filter feed tank. A recycle stream is taken from the thickener underflow pumps and returned to the first or second tank to serve as a reseed for crystal growth in the tanks. The recycle stream density is measured and controlled according to the solids flow back to the precipitation tanks. The thickener overflow is collected in an overflow tank, and from there it is pumped to the hydrochloric acid regeneration tanks.
| S-K 1300 Technical Report Summary on the Songwe Hill REE Project | Page 283 of 489 |
| |
The filter feed slurry is pumped with high-pressure pumps into the gangue leach liquor neutralisation filter. The filter is a horizontal recessed chamber filter press. The filter cake is washed by circulating a predetermined amount of raw water through the bed of solids. The gangue leach liquor neutralisation filter discharge conveyor discharges the filter cake into the hydrometallurgical tails neutralisation repulp tank. The filtrate is collected in a sloped-bottom tank and pumped back to the gangue leach liquor neutralisation thickener.
| 14.2.23 | Hydrochloric Acid Regeneration |
The purified gangue leach liquor contains significant amounts of calcium and chloride, which are utilised to regenerate the hydrochloric acid for use in the gangue leach and rare earth leach processes.
The purified gangue leach liquor is pumped into the first of four open-top, agitated overflow tanks in series. The valving arrangements allow for any one tank to be taken offline at any time without interrupting the process.
The calcium chloride solution and concentrated sulphuric acid are pumped into Tank 1 and/or Tank 2 to react with each other and the residual calcium chloride in solution to form gypsum and hydrochloric acid according to the following formula:
CaCl2(aq) + H2SO4(l) → CaSO4(s) + 2HCl(aq)
The reaction is mildly exothermic, and the temperature is controlled at approximately 50 °C with the use of cooling water circulating through coils in the tanks.
The discharge slurry from the last tank is pumped into the agitated hydrochloric acid regeneration filter feed tank.
The filter feed slurry is pumped with high-pressure pumps into the hydrochloric acid regeneration filter. The filter is a pressure belt filter that operates continuously and discharges waste solids onto a hydrochloric acid regeneration filter discharge conveyor. The filter cake is continuously washed by circulating a predetermined amount of raw water through the bed of solids. The hydrochloric acid regeneration neutralisation filter discharge conveyor discharges the filter cake onto a stockpile, from where it is collected with an FEL and loaded into a bagging plant. The filtrate is collected in a sloped-bottom tank and pumped to the hydrochloric acid regeneration dosing tank, from where it is pumped to the gangue leach and rare earth leach processes.
The generated gypsum is used in the PLS purification process as a source of sulphate, and the remainder is sold for use in local cement manufacture.
| 14.2.24 | Sodium Hydroxide Evaporation |
The caustic conversion thickener overflow contains the unreacted sodium hydroxide, as well as some impurity elements mobilised during the caustic conversion. The caustic conversion overflow is pumped into a multiple-effect evaporator plant that uses low-pressure steam to evaporate moisture from the overflow stream and increase the concentration of sodium hydroxide in solution.
| S-K 1300 Technical Report Summary on the Songwe Hill REE Project | Page 284 of 489 |
| |
The evaporator package consists of various vessels operating under vacuum and heated with recycled steam, which incrementally heats up the process stream vessel by vessel and also incrementally evaporates the moisture. Heat exchangers ensure the efficient recycle of heat, and a mechanical vapour recompression system facilitates the efficient use and recycle of steam.
The discharge solution is concentrated in sodium hydroxide at an elevated temperature (> 90°C). The discharge solution is pumped into a closed-top, agitated cool down tank that cools down the solution by circulating cooling water through coils in the tank. A decrease in temperature drives the precipitation of impurity sodium salts, such as sodium carbonate and sodium fluoride, transforming the solution into a slurry.
The discharge slurry is pumped into an agitated evaporator discharge filter feed tank. The filter feed slurry is pumped with high-pressure pumps into the evaporation discharge filter. The filter is a horizontal recessed chamber filter press. The filter cake is washed by circulating a predetermined amount of raw water through the bed of solids. The evaporation discharge conveyor discharges the filter cake into the causticisation repulp tank. The filtrate is collected in a sloped-bottom tank and pumped to the regenerated sodium hydroxide storage tank.
| 14.2.25 | Causticisation |
The sodium salts precipitated during caustic evaporation are repulped in an open-top, agitated repulp tank. Raw water is added to the tank to ensure the correct solids density in the repulped slurry.
The repulped slurry is pumped from the repulp tank into the first or second of four open-top, agitated overflow tanks in series. Lime is added to the first and/or second tank, and the volumetric flow of the lime slurry is controlled by the stoichiometric requirements of calcium for the amount of sodium salts being fed to the process. Test work will indicate the composition of the sodium salts and determine the dosing of calcium hydroxide set point.
The precipitated sodium salts dissolve in raw water under ambient conditions and neutral pH, and calcium hydroxide reacts with the dissolved species to regenerate the sodium hydroxide and insoluble calcium salts in the following ionic exchange reactions:
Ca(OH)2(aq) + 2NaF(s) → 2NaOH(aq) + CaF2(s)
Ca(OH)2(aq) + Na2CO3(s) → 2NaOH(aq) + CaCO3(s)
The discharge slurry is pumped from the last tank to the causticisation filter feed tank. The filter feed slurry is pumped with high-pressure pumps into the causticisation filter. The filter is a horizontal recessed chamber filter press. The filter cake is washed by circulating a predetermined amount of raw water through the bed of solids. The causticisation filter discharge conveyor discharges the filter cake into the hydrometallurgical tails neutralisation repulp tank. The filtrate is collected in a sloped-bottom tank and pumped back to the feed of the caustic evaporator since dilution and washing have again diluted the sodium hydroxide in solution.
| S-K 1300 Technical Report Summary on the Songwe Hill REE Project | Page 285 of 489 |
| |
| 14.2.26 | Off-Gas Scrubbing |
Acidic and alkaline fumes from the gangue leach and caustic conversion processes are ducted from the top of the tank to the off-gas scrubber.
The polluted off-gas is extracted with a fan from all the gangue leach and caustic conversion tanks and is circulated from the bottom of a packed bed column to the top. The packed bed is filled with media to obstruct the flow of air and to ensure good contact with the down-flowing liquor. The polluted off-gas and alkaline scrub solution flow countercurrently to each other in the packed bed column so that the solution can make contact with the off-gas and adsorb acidic and environmentally unfriendly species.
Sodium hydroxide slurry is pumped from the sodium hydroxide make-up area to the sodium hydroxide feed tank inside the vendor package. The sodium hydroxide slurry is added to the recirculating scrub solution, determined by the pH of the scrub solution. As the recirculating volume of the scrub solution decreases in pH, it is periodically bled from the system and pumped to hydrometallurgical tails neutralisation tanks. Fresh sodium hydroxide and water are added to maintain an inventory of recirculating scrub solution.
The scrubber off-gas is released into the atmosphere via an off-gas stack.
| 14.2.27 | Lime |
Hydrated lime (Ca(OH)2) solid powder is delivered to site in bulk bags and lifted by a hoist onto a bag breaker installed on top of the lime make-up tank. Lime is delivered in the hydrated form and therefore no slaker is required.
Hydrated lime powder is mixed with water in the correct ratio to achieve a 20 % w/w slurry in an open-top, agitated tank.
The made-up slurry is pumped into a dosing tank that operates on level control, and from there the slurry is pumped to the process areas.
| 14.2.28 | Purification Reagents 1 – Sodium Sulphide |
Sodium sulphide is delivered to site in bulk bags and hoisted onto a bag breaker installed on an open-top, agitated make-up tank. Sodium sulphide powder is added to the make-up tank in the correct ratio with raw water to produce a 20 % w/w solution.
The made-up solution is pumped to a dosing tank, which operates on level control, and then pumped to the PLS purification circuit.
| 14.2.29 | Purification Reagents 2 – Barium Chloride and Calcium Sulphate |
| 14.2.29.1 | Barium Chloride |
Barium chloride is delivered to site in bulk bags and hoisted onto a bag breaker installed on an open-top, agitated make-up tank. Barium chloride powder is added to the make-up tank in the correct ratio with raw water to produce a 20 % w/w solution.
The made-up solution is pumped to a dosing tank, which operates on level control, and then pumped to the PLS purification circuit.
| S-K 1300 Technical Report Summary on the Songwe Hill REE Project | Page 286 of 489 |
| |
| 14.2.29.2 | Calcium Sulphate |
Calcium sulphate is produced in the hydrochloric acid regeneration area. The majority of the gypsum is sold to cement manufacturers in the region, but a small portion is reused in the process.
Calcium sulphate bags are transported from the gypsum bagging plant and hoisted onto a bag breaker installed on an open-top, agitated make-up tank. Calcium sulphate powder is added to the make-up tank in the correct ratio with raw water to produce a 20 % w/w solution.
The made-up solution is pumped to a dosing tank, which operates on level control, and then pumped to the PLS purification circuit.
| 14.2.30 | Ammonium Bicarbonate |
Ammonium bicarbonate is delivered to site in bulk bags and hoisted onto a bag breaker installed on an open-top, agitated make-up tank. Ammonium bicarbonate powder is added to the make-up tank in the correct ratio with raw water to produce a 20 % w/w solution.
The made-up solution is pumped to a dosing tank, which operates on level control, and then pumped to the PLS purification circuit.
| 14.2.31 | Calcium Chloride |
Calcium chloride is delivered to site in bulk bags and hoisted onto a bag breaker installed on an open-top, agitated make-up tank. Calcium chloride powder is added to the make-up tank in the correct ratio with raw water to produce a 20 % w/w solution.
The made-up solution is pumped to a dosing tank, which operates on level control, and pumped to the PLS purification circuit.
| 14.2.32 | Steam |
Filtered raw water is pumped into the electrical steam boiler plant. A raw water supply tank provides raw water inventory for the electrical steam boilers to produce low-pressure (7 bar(g)) steam for the purpose of process heating. The generated steam is directed to process areas that require heating.
A hot water tank is filled with filtered raw water and supplies a hot water ring main to the gangue leach tanks. The temperature is controlled by modulating the flow of steam into spargers located in the hot water tank. Hot water is circulated with pumps, and the ring main returns cooled-down water to the hot water tank to be heated once more.
| 14.2.33 | Air Services |
A duty/standby arrangement of air compressors supplies the compressed air to a header that feeds the plant compressed air reticulation system.
Before the compressed air is directed to the air receivers in the concentrator and hydrometallurgical plants, the air is
| ● | Filtered for use as plant air |
| ● | Filtered, dried, and filtered again for use as instrument air |
| S-K 1300 Technical Report Summary on the Songwe Hill REE Project | Page 287 of 489 |
| |
| 14.2.34 | Process Water |
The TSF return water is pumped into the process water pond, which provides storage and surge capacity for use in the concentrator and hydrometallurgical plants.
The flotation concentrate thickener overflow and flotation tails thickener overflow are pumped into a process water heat exchanger to transfer the heat from the flotation thickener overflow at approximately 50 °C to the process water leaving the process water pond.
The process water pond discharge pumps pump the process water through the process water heat exchanger to be heated before being directed to the plant areas for use – primarily the milling and flotation sections.
| 14.2.35 | Potable Water |
Raw water is pumped from the raw water storage pond to a reverse osmosis water processing plant. The reverse osmosis plant removes impurities from the raw water and renders it clean enough for use as potable water for consumption and in the plant safety shower system.
Potable water is stored in a potable water storage tank and pumped to site offices, accommodation, and safety shower systems. Hydrospheres on the supply lines of the safety shower systems provide pressure in case of pump failure or power outage.
| 14.3 | QP Opinion |
The selected process plant configuration, design and associated engineering activities are supported by comprehensive testwork, which has validated the proposed processing route (flowsheet). This flowsheet, comprising a concentrator plant for the production of flotation concentrate and a hydrometallurgical extraction facility for the generation of MREC product, has been demonstrated to be optimal for the Songwe Hill ore.
It is the opinion of SENET, responsible and acting as the QP for the Songwe Hill process plant, that the design undertaken for the processing and recovery methods for the process plant is at a level that meets the requirements for an DFS and represents good industry practice.
| S-K 1300 Technical Report Summary on the Songwe Hill REE Project | Page 288 of 489 |
| |
| 15 | Infrastructure |
| 15.1 | Project On-Site Infrastructure – Process Plant |
The Songwe Hill Project is a greenfield project, and as such minimal infrastructure has been established on the Project site. The on-site infrastructure required will be related to the processing plant and the supporting facilities as follows:
| ● | Earthworks |
| ● | Civil works |
| ● | Plant buildings |
| ● | Process plant site drainage |
| ● | Sewage disposal |
| ● | Security |
| ● | Water supply |
| ● | Power supply |
| ● | Process plant diesel backup generators |
| ● | Communications |
| S-K 1300 Technical Report Summary on the Songwe Hill REE Project | Page 289 of 489 |
| |
The main plant areas are shown in the plant layout in Figure 15.1.
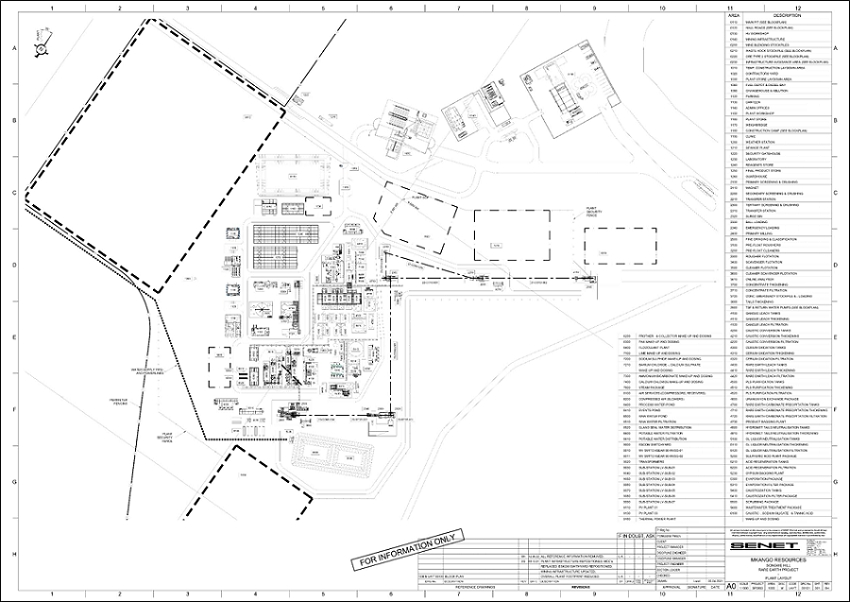
Figure 15.1: Plant Layout
| S-K 1300 Technical Report Summary on the Songwe Hill REE Project | Page 290 of 489 |
| |
| 15.1.1 | Earthworks |
| 15.1.1.1 | General Earthworks |
Earthworks allowances were made for terracing, roads and storm water infrastructure on the processing plant, photovoltaic (PV) plants, construction camp and fuel depot. No allowances were made for any mining-related infrastructure.
The average slope of the natural ground over the processing plant area is 1:15, which makes this an unusually steep site for the construction of a processing plant. To best utilise the slope and minimise the earthworks, the plant was divided into terraces with earth berm drops on smaller level differences and strategically positioned concrete retaining walls where steeper drops were required.
The terrace levels were influenced by several factors including process flows, equipment locations and tie-in levels. As a result, the plant terracing is complex in construction and post-construction operation and will require further consideration and refinement in the detailed design phase.
It should be noted that the proposed concrete retaining walls between terraces would require a good coordination between the Earthworks and Civil Works Contractors and would also require them to work simultaneously in specific areas. This could have a potential impact on the construction schedule.
The following design assumptions were made based on the geotechnical report recommendations:
| ● | The soil improvements recommended in the geotechnical report range in depth from 1 m to 2.2 m. |
| ● | The report did not include an investigation for potential borrow pits in the area, and this might pose a risk to the assumption that G5 and G6 materials, to be used as fill material, will be available in a 2 km radius, either from necessary excavations or borrow pits. |
| ● | With the many boulders encountered, it was assumed that 20 % intermediate and 15 % hard rock excavations would be required, and an allowance was made accordingly. |
| ● | Provision was made to grade the PV plants to a maximum gradient of 14 % to allow for the axial movement of the panels. |
| ● | The process water pond and events pond were considered to have double HDPE liner systems, while the raw water pond was considered to have a single HDPE liner system. All the relevant geotextiles and installation of the systems were included. |
| ● | The ROM wall was included as a mechanically stabilised earth wall with a gabion face. It was assumed that the gabion rock for that wall face would be locally available, either from site or from commercial sources. |
Further geotechnical investigations and an update of the geotechnical report are planned before the detailed design phase commences to address the areas in the geotechnical report that were not conclusive. All the design assumptions will be reviewed and updated where necessary after the updated report has been reviewed.
| S-K 1300 Technical Report Summary on the Songwe Hill REE Project | Page 291 of 489 |
| |
| 15.1.1.2 | Processing Plant Access and Formalised Roads |
The existing road (T415) to the west of the proposed process plant will be diverted to the east and west to grant access to the processing plant and PV Plant 4, respectively. The preliminary design for these roads assumed these to be 8 m wide gravel roads with 500 mm of compacted road layers and a gravel wearing course of 300 mm.
Selected fill gravel roads were also considered on PV Plants 1 and 4 where formal access to infrastructure needed to be allowed for. The preliminary design for these roads assumed these to be 5 m wide gravel roads with 500 mm of compacted road layers and a gravel wearing course of 300 mm.
| 15.1.1.3 | Internal Roads |
The internal roads on the plant are divided into three categories:
| ● | Access ramps between platforms, which will be constructed by compacting suitable material in layers to a specified density, levels and requirements to be stipulated in the detailed design. A gravel wearing course will be constructed on these access ramps as per the detailed design. The access ramps will provide a throughway between the platforms on different levels and ensure that access to all critical areas is possible for stipulated vehicles. |
| ● | In-plant roads, which will allow access to the infrastructure on the relevant platforms. These will be constructed as part of the platform earthworks, and their location will be demarcated. |
| ● | Perimeter roads on the PV plants along the security fence. These roads will be considered informal roads stripped of vegetation and topsoil. |
| 15.1.2 | Civil Works |
The following design assumptions were made in quantifying the civil works for this Project:
| ● | All the structural concrete was assumed to be 30 MPa. |
| ● | Raft foundations were assumed for areas sensitive to differential settlement and any area requiring acid protection. |
| ● | Surface beds and bases were assumed for lower-load and less-sensitive areas. |
| ● | Bunded area volumes were assumed to allow for the containment of 110 % of the volume of the largest vessel in the bund. |
| ● | Ring beams for all tanks were assumed at a minimum height of between 600 mm and 750 mm, depending on the tank size or the required height with regard to the process. |
| ● | The foundations for the solar panel structures on PV Plants 1 and 3 were assumed to be pre-drilled for steel profiles and backfilled with concrete. |
| ● | The foundations for the solar panel structures on PV Plant 4 were assumed to be directly rammed steel profiles. |
Civil works allowances were made for all the structures on the plant including the construction camp, sewage treatment plant, electrical infrastructure, Electricity Supply Corporation of Malawi (Escom) switchyard, prefabricated buildings, pre-engineered structural steel buildings, and solar panel foundations. No mining-related infrastructure was considered.
The particular areas that were identified as requiring acid protection were considered according to the specific chemical and mechanical abrasiveness. Particular acid protection systems were considered for the respective areas based on the area properties.
Although the current design assumptions are not expected to change significantly in the detailed design phase, all the design assumptions will nevertheless be reviewed and updated, where necessary, after the conclusive geotechnical report has been reviewed.
| S-K 1300 Technical Report Summary on the Songwe Hill REE Project | Page 292 of 489 |
| |
| 15.1.3 | Plant Buildings |
The plant buildings will consist of the following:
| ● | Gatehouse |
| ● | Change house and laundry |
| ● | Clinic |
| ● | Canteen |
| ● | Plant control rooms (two) |
| ● | Office buildings (two) |
| ● | Metallurgical laboratory |
| ● | Plant workshop |
| ● | Plant main store |
| ● | Reagents store |
| ● | Final product store |
| ● | Air services building |
| ● | Blower air building |
| 15.1.4 | Process Plant Site Drainage |
| 15.1.4.1 | Storm Water and Drainage |
Storm water diversion berms will be constructed to separate clean and dirty storm water. All dirty/contaminated storm water will be collected and contained within the storage facilities on site while the clean water will be routed to run off into the natural watercourse.
The berms will be constructed using the material from the bulk excavations when the bulk earthworks are carried out.
Concrete-lined storm water channels and grid inlets will be constructed throughout the plant area to ensure that any storm or dirty water runoff that is not contained in the bunded areas is diverted to discharge into the event pond located north of the plant store.
| 15.1.4.2 | Erosion Protection |
Provision has been made for all sloped earth embankments to be protected from erosion by installing an earth stabilising system to reinforce the embankments, mitigating possible erosion damage whilst promoting and enabling vegetation growth.
| S-K 1300 Technical Report Summary on the Songwe Hill REE Project | Page 293 of 489 |
| |
| 15.1.5 | Sewage Disposal |
A 45 m3/h containerised sewage treatment plant will be provided north of the main plant terrace for the treatment and disposal of the sewage generated by the process plant as well as the mining operations.
The technology selected is compact, simple and robust, and is based on a standard activated sludge system, where the biochemical oxygen demand is broken down using air and bacteria that grow in this medium.
| 15.1.6 | Security |
The perimeter of the site will be fully enclosed by a low-security fence to keep out animals and unauthorised people. The process plant, construction camp, fuel farm, backup fuel and electrical ring main unit will be enclosed by a medium-security fence. The PV plants, explosives magazine and electrical transformer are considered higher risk areas and provision has therefore been made for these areas to be enclosed with a high-security fence. An additional allowance was made for low-security stock fencing around the raw and process water ponds, event pond, and return water pond.
Access to the plant site will be restricted to one access point at the main gate, which will be equipped with a gatehouse that is manned 24 h/d. Other emergency and maintenance access gates will be provided but will be kept locked at all times.
Booms to control vehicle access will be provided at the entry gate to the process plant and at the entrance to the waste facility perimeter road leading to the mine access area.
Furthermore, the plant will be fitted with closed-circuit television (CCTV) cameras installed at strategic locations. Views from the cameras will be fed to the central security control room situated in the gatehouse to a central security control room situated in the security office.
| 15.1.7 | Water Supply |
To ensure an uninterrupted supply of water to the plant, water will be supplied via on-site raw water and process water ponds.
These ponds will be fed from two sources:
| ● | Boreholes located to the west of the plant. This borehole water will be filtered through a sand filter to remove most of the suspended solids and be collected in a supply tank. From this tank, the water will be pumped to the raw water pond (RWP), from where it will be processed through a reverse osmosis plant for potable water supply to the plant infrastructure. |
| ● | The TSF water return system (50 m3/h design flow rate) |
The interaction of the various flows for the process plant and TSF is described in detail in Section 15.4, which was the basis for the water balance. This water balance was used as the basis for sizing the water storage dam. Water stored in the RWP will be pumped to the process plant for make-up operations.
| S-K 1300 Technical Report Summary on the Songwe Hill REE Project | Page 294 of 489 |
| |
The pit dewatering requirements to cater for the ground and rainwater ingress have been met by diesel-powered water pumps located in the pit. This water is then pumped to a high point next to the pit into a collection tank. The water is then gravity fed to another collection tank located at the primary crusher, from where it will be pumped to the RWP.
A floating barge system will be installed at the TSF to house the two return pumps, which pump the process water to the RWP. Pumps at the RWP pump the return water to the process water pond located in the plant.
| 15.1.7.1 | Potable Water Distribution |
Raw water will be supplied from the raw water pond to the potable water storage tank situated in close proximity to the pond. Potable water will be supplied to all the areas inside the plant via piping running above ground in the plant area. Potable water will be supplied directly to safety showers, ablution areas, and the change house.
The potable water plant will be a containerised unit capable of producing 15 m3/h of potable water. The water will be chemically oxidised, and the pH will be adjusted. Then the water will flow through an arsenic removal filter and an activated carbon filter.
| 15.1.7.2 | Fire Water Distribution |
There will be an electric and a diesel-powered fire water pumping system. The electric-powered pump will be used in the event of a fire, and the diesel pump will be a backup in case the motor control centres (MCCs) are on fire. A jockey pump will be provided to maintain the pressure in the fire water header during normal plant runs. An alarm will be sounded at the plant site for low system pressure.
The fire water system will consist of a fire water loop and hydrant system at the plant site, ancillary buildings, and at the process plant. Hose cabinets will be placed at the fire hydrant locations, and the system will be supplemented with portable fire extinguishers placed within the process plant facilities. The administration building, change house, and canteen will have hose reels and portable fire extinguishers.
A complete self-contained fire alarm system will be installed in all the buildings in order to comply with the local codes and insurance underwriter’s regulations for fire protection.
| 15.1.8 | Power Supply |
After considering the results established in the technical and commercial evaluation, MKAR plans to have electricity supplied by an independent power producer (IPP) to reduce the initial upfront capital.
Three options were evaluated based on reliability, utilisation, and redundancy in order to achieve the best cost of energy:
| ● | Thermal power generation (i.e. from the national grid) |
| ● | Hybrid system with thermal and solar PV power generation |
| ● | Hybrid system with thermal, solar PV and energy storage system power generation |
| S-K 1300 Technical Report Summary on the Songwe Hill REE Project | Page 295 of 489 |
| |
The OPEX of thermal power plants is significantly high due to their fuel consumption, and consequently the cost of energy is high since it is related to the fuel cost. Commercial solar PV power has been proven to provide lower cost energy for longer life cycle projects. A hybrid system uses PV power generation to reduce the loading of the thermal generators, which results in a considerable saving on fuel consumption and lowers the environmental impact of the emissions produced by the plant. However, the PV penetration is limited due to the minimum loading requirement for the generators, as well as the operating reserve required for the PV generation capacity, which ensures network stability in the event of a sudden change in PV generation capacity or load requirements. The option that was found to achieve the best cost of energy was the hybrid system in combination with a suitably sized battery energy storage system to provide operating reserves and to enable the thermal plant to run at its best efficiency point to allow for higher solar PV penetration and lower fuel consumption.
This option is designed to deliver the lowest cost of energy and reliable electricity, but it also includes a strong renewable energy component that will significantly reduce the carbon footprint of the mine.
| 15.1.8.1 | Power Demand |
An outline of the electrical power demand is shown in Table 15.1, based on the mechanical equipment list (MEL) and plant infrastructure.
Table 15.1: Electrical Power Demand
| Project Load | Continuous Power Demand (kW) | Maximum Start-Up Demand (kW) |
| Process Plant | 20,201 | – |
| Off-Site Infrastructure | 1,447 | – |
| Camps | 418 | – |
| Ball Mill | 3,004 (3,400a) | 4,640 |
| Total | 25,071 | |
| a Rated | ||
The maximum steady-state continuous power demand is estimated at 25,071 kW, with the ball mill being the only load of critical relevance to the maximum start-up energy demand. The ball mill drive will be driven by a squirrel cage motor, and the start-up current will be limited with a variable speed drive (VSD). It is anticipated that the VSD will reduce the starting power demand of the ball mill to a maximum of 1.0 to 1.30 times the rated capacity of the motor.
The start-up sequence of the ball mill will last for approximately 60 s to 180 s, and it will increase the plant’s maximum power demand to 26,487 kW. The power system should be suitably designed to deliver the required power for the start-up duration without interruptions to the other loads and will limit the voltage regulation to within 10 % of the rated system voltage.
| 15.1.8.1.1 | Power Plant |
The Songwe Hill Project will have access to the Malawian national grid and solar PV as a secondary source. The grid will be predominantly in use during night-time and in the event that the condition for solar PV is unfavourable. Furthermore, if the grid is not available, there are provisions for six 1.6 MW backup generators (five running and one on standby) to supply only the essential load during this scenario.
| S-K 1300 Technical Report Summary on the Songwe Hill REE Project | Page 296 of 489 |
| |
The use of solar PV has been proven to offer a lower OPEX for projects by reducing the power purchased from the grid. Furthermore, the renewable energy component significantly reduces the carbon footprint of the mine.
| 15.1.8.1.2 | Thermal Generation |
The backup thermal diesel generators are configured to operate in a prime operating mode. The total number of allocated backup generators is six to allow for an n+1 redundancy.
The diesel generator parameters are provided in Table 15.2.
Table 15.2: Diesel Generator Sets
| Item | Description |
| Prime Rated Power | 2,000 kVA/1,600 kWe at 0.8 pf |
| Total Generation Capacity | 8.0 MW/10 MVA at 0.8 pf, Prime |
| Rated Voltage | 11 kV |
| Fuel Consumption, 100 % Load | 0.248 L/kWh |
| Fuel Consumption, 75 % Load | 0.251 L/kWh |
| 15.1.8.1.3 | Solar PV Plant |
The PV plant shall only use Tier 1 manufacturers for key components such as inverters, transformers, PV modules and metering equipment.
The PV modules shall use mono PERC (passivated emitter and rear cell) crystalline bi-facial technology supplied by Tier 1 manufacturers with a 30-year linear degradation guarantee. The modules shall comply with IEC 61215 and IEC 61730. The parameters of the PV plant are shown in Table 15.3.
Table 15.3: Solar PV Plant
| Item | Description |
| AC Power Rating | 24.386 MW |
| DC Power Rating | 31.58 MWp |
| Production, Year 1 – P50 (probability percentage) | 67,661 MWh/a |
| Specific Production | 2,142.53 kWh/kWp/a |
| Guaranteed Degradation | < 2 % for Year 1, 0.45 % from Years 2 to 30 |
| PV Module Size | 540 Wp |
| Number of PV Modules | 58,493 |
| S-K 1300 Technical Report Summary on the Songwe Hill REE Project | Page 297 of 489 |
| |
The grid-tied PV system is aimed at both reducing the cost of energy and the impact on the environment while also increasing the reliability of the power system. This enables MKAR to meet their sustainable development goals.
The following assumptions have been made:
| ● | The grid will have one outage a week for 8 h. |
| ● | The essential load will be capped at a constant 7.2 MW, 90 % of the generator capacity. |
| ● | Infrastructure equipment will have a 0.65 diversity factor. |
| ● | The grid will be available three months before the concentrator is commissioned. |
| 15.1.8.2 | Power Reticulation Voltages |
Power reticulation will be done at the following voltages:
| ● | Medium voltage: 11,000 V |
| ● | Low voltage: 400/230 V |
| ● | Control voltage: 110 V AC |
| 15.1.8.3 | Transformers |
Distribution transformers will be manufactured in accordance with IEC 60076 and other relevant international standards, and will be as follows:
| ● | Outdoor oil immersed type |
| ● | Insulation medium air ONAN (oil natural air natural) |
| ● | Three-phase |
| ● | Copper windings |
| ● | Vector Group Dyn 11 |
| ● | Offload tap changer ± 2 × 2.5 % |
| 15.1.8.4 | Low-Voltage Distribution |
The maximum transformer rating for low-voltage (LV) supplies will be 2,500 kVA. Each transformer will feed a 400 V MCC that supplies power to a dedicated section of the plant. Feeds to the MCCs will be single feeds only.
The MCCs will feed the lighting distribution boards that will supply lighting and small power distribution (normal) at 400 V/230 V (single-phase or three-phase).
| 15.1.8.5 | Motor Control Centres |
Five containerised MCCs have been allocated for the process plant. The MCCs will be of the compartmentalised, non-withdrawable type with moulded case circuit breakers, magnetic contactors and earth bus, and they shall comply with IEC 61439-2.
| S-K 1300 Technical Report Summary on the Songwe Hill REE Project | Page 298 of 489 |
| |
| 15.1.8.6 | Electrical Motor Control Stations |
The electric motors are as per the requirements on the equipment list. Motors shall be of Efficiency Class IE3 (premium efficiency) in accordance with IEC 60034-30-1.
The control of these motors can be summarised as follows:
| ● | Start-Stop/Emergency-Stop push-button stations will be located at each motor. |
| ● | Stations located in wet process areas or outdoors will be of watertight construction. |
| 15.1.8.7 | Earthing and Lightning Protection |
Provision has been made for earthing of all electrical equipment and buildings where applicable.
The earthing philosophy for the supply of plant equipment shall be the TN-S earthing system, where one of the points in the generator or transformer is connected to earth, usually the star point in a three-phase system. The enclosure of the electrical device is connected to earth via this earth connection at the transformer.
Provision has been made for earth resistivity testing prior to the installation. Earth mats shall be installed at all medium-voltage (MV) substations, ring main units, and transformers.
High mast lighting shall form part of the plant’s lightning protection system by serving as lightning surge arrestors.
| 15.1.8.8 | Electrical Cables |
The following shall apply to electrical cables:
| ● | All cables specified shall comply with the relevant part of SANS 1507. |
| ● | All outdoor cables shall either be buried in the ground or placed on cable racking. |
| ● | Cables shall cross underneath roads in dedicated sleeve polyvinyl chloride pipes. |
| ● | Grouped cables shall be de-rated in accordance with SANS 10142-1 for 600 V/1,000 V cables. |
| 15.1.8.9 | Cable Racking |
Cable racking shall be used where cables are running on structures or indoors, or where cable support is required.
| 15.1.8.10 | Lighting |
Provision has been made for light-emitting diode (LED) lighting, which will be structure-mounted to ensure safe working conditions. Lighting will also be installed to ensure that visual security monitoring can be conducted at all times in and around the process plant and associated infrastructure to maintain a safe work environment. The final design and layout will be confirmed during the implementation phase.
| 15.1.8.11 | Fire Detection System |
Provision has been made for fire detection systems for all MV switches, MCCs, servers and control rooms. These rooms will also be equipped with handheld firefighting equipment. The fire detection systems will be integrated with the plant’s central control system to alert the plant operators of any fire incidents.
| S-K 1300 Technical Report Summary on the Songwe Hill REE Project | Page 299 of 489 |
| |
| 15.1.8.12 | Process Plant Diesel Backup Generators |
The diesel backup generators for the plant will consist of six 1.6 MW diesel-powered generators. These units have been sized to allow adequate power to the process and hydrometallurgical plant to ensure that the process will not be interrupted during a power outage. The supply calculations were done only to keep the agitators running to avoid settlement in the process tanks.
The diesel will be transported from the supply facility operated by the Fuel Supply Contractor by means of a diesel bowser to the two storage tanks. The self-bunded storage tanks can store 20 m3 diesel each.
| 15.1.9 | Communications (IT Network) |
The communications system (IT network) for the plant will be specified by MKAR. A provision for this system has been made under the Owner’s pre-production cost.
An Airtel communication tower was installed in 2021, west of the plant area on a hill very close to the proposed process plant location. This tower has been used with good results thus far.
| 15.2 | Project On-Site Infrastructure – Mining |
Figure 15.2 is a sketch of the proposed mining infrastructure area (MIA).
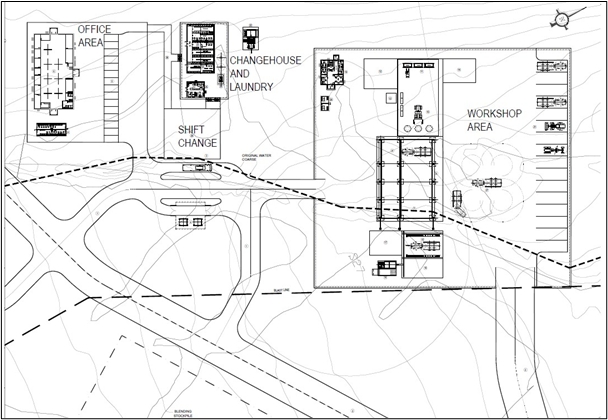
Figure 15.2: Mining Infrastructure Site Layout
| S-K 1300 Technical Report Summary on the Songwe Hill REE Project | Page 300 of 489 |
| |
The natural terrain at the Songwe Hill Project area is sloped and will require earthworks to create terraces for the infrastructure. The terraced areas were divided into logical areas to reduce the volume of the earthworks. The terraced areas provided include an area for the offices, with parking, change house and laundry area, shift change and workshop areas. The mining infrastructure is located outside of the 500 m blast radius.
| 15.2.1 | Mining Staff Complement |
The mining manpower plan is presented in Section 13.8. The total mining complement is 150 people, made up of 129 contractor employees and 21 mine employees. The infrastructure described below is designed to accommodate the staff complement.
| 15.2.2 | Offices for Management and Operations |
The proposed terraced layout for the mining operations is divided into three areas, with the following dimensions for the terraces:
| 1. | General offices: 50 m × 30 m |
| 2. | Change house: 30 m × 20 m |
| 3. | Workshop offices: 20 m × 15 m |
The sections below describe the provisions made for the buildings and facilities in each of the three areas.
| 15.2.2.1 | General Offices |
The general offices are intended to accommodate up to 30 people.
| 15.2.2.2 | Change House Area |
The change house area will accommodate up to 110 people over two shifts. The peak number of users will be 74 people in one shift. The ratio of change house male to female users was assumed to be 80:20.
A laundry was provided separately from the change house.
| 15.2.2.3 | Workshop Offices |
The workshop offices are intended to accommodate up to five people and are equipped with office furniture.
| 15.2.3 | Mine Workshop and Vehicle Servicing |
Due to its remote location, servicing of the mining equipment will take place at the mine. Table 13.14 shows the mining fleet that is required for the mining operations and that was used to determine the workshop requirements.
The primary workshop primarily services the haul trucks. The drill rigs and excavators are usually serviced in the mining pit but may be transported to the primary workshop for major repairs.
| S-K 1300 Technical Report Summary on the Songwe Hill REE Project | Page 301 of 489 |
| |
| 15.2.4 | Diesel Storage |
Diesel will be provided from a central fuel farm supplied and operated by others. The Mining Contractor will collect the fuel from the fuel farm by either refuelling at the central station or distributing it to the in-pit users with a fuel bowser.
| 15.2.5 | Explosives Magazine Storage |
The Mining Contractor is responsible for the supply and storage of the explosives and blasting accessories required for the liberation of ore. The Mining Contractor is also responsible for providing their own level, prepared platform, complete with storm water management and drainage, in a suitable location on which to build their explosives magazine storage facility.
The Mining Contractor shall ensure that the facility is properly secured and that it complies with the requirements of the Malawian standard for the construction of explosives storage.
| 15.2.6 | Potable Water |
Potable water will be supplied to the mining office infrastructure from the plant operations from the bulk water supply system and reticulated to the individual buildings from a tank and pressure boost station.
| 15.2.7 | Other Supporting Infrastructure |
Provision was made for the following:
| ● | Emulsion receiving, storage and distribution area. |
| ● | A shift change area for people to wait for the buses transporting people to the pit. |
| ● | Explosives magazine and detonator store. The bunkers are located 500 m away from the main infrastructure. |
| 15.2.8 | Wastewater |
Wastewater from the individual buildings will be reticulated to a lift station. The lift station will pump the wastewater to a central sewage treatment and disposal plant operated by others. Refer to Section 15.1.5.
| 15.2.9 | Power Supply and Reticulation |
Power supply to the MIA will be provided from the plant by others. Power will be reticulated to the infrastructure buildings from a local mini-substation unit.
| S-K 1300 Technical Report Summary on the Songwe Hill REE Project | Page 302 of 489 |
| |
The mining infrastructure equipment installed load is 233 kW and consists of the loads detailed in Table 15.4.
Table 15.4: Installed Loads for Mining Infrastructure
| Description | Number of Motors/Loads |
Rated Power per Motor/Load (kW) |
Total Installed Motors/Loads (kW) |
| Laundry | 1 | – | 46.0 |
| Change house (male and female) | 1 | – | 26.9 |
| Offices (620 m²) | 1 | 10 | 10.0 |
| Emulsion storage | 1 | 2 | 2.0 |
| Sewage pumping | 1 | 15 | 15.0 |
| Explosives destruction | 1 | 2 | 2.0 |
| Workshop | 1 | – | 112.1 |
| Area lighting | 8 | 9.6 | 19.2 |
| Total | 233 | ||
| 15.2.10 | Storm Water Management |
Storm water runoff from the MIA reports to a new drainage system that diverts the water to the TSF storm water dam. The new drainage system will be developed as part of the TSF infrastructure development by others.
Any storm water collected as dirty water at the workshop areas will report to the workshop’s silt and oil trap area. From here, the water will be treated with a biological process and then stored for reuse.
| 15.2.11 | Haul Roads |
The Songwe Hill mining area will include a network of major haul roads linking the following primary areas:
| ● | Open pit |
| ● | ROM pad and blending area |
| ● | Medium-grade ore stockpile |
| ● | WRD |
| ● | Type 2 material stockpile |
| ● | MIA |
Minor haul roads will be positioned on the perimeter of the ore stockpile and WRD to provide access.
| 15.2.11.1 | Haul Road Design Criteria |
The haul roads are required to facilitate bi-directional travel for the major routes and single directional travel for the minor access routes. Table 15.5 provides a summary of the haul road geometry and layer works.
| S-K 1300 Technical Report Summary on the Songwe Hill REE Project | Page 303 of 489 |
| |
Table 15.5: Haul Road Design Criteria
| Description | Item | Source |
| Vehicle type | 40 t ADT (e.g. Caterpillar 740B) | Bara |
| Vehicle width | 3,801 mm | CAT |
| Vehicle operating weight (max.) | 74,363 kg | CAT |
| Vehicle axle weight (max.) | 25,638 kg | CAT |
| Single carriageway width factor | 2 | Prime Resources |
| Single carriageway width (min.) | 7.6 m | Prime Resources |
| Dual carriageway width factor | 3.5 | Prime Resources |
| Dual carriageway width (min.) | 13.3 m | Prime Resources |
| Cross-slope gradient | 2 % | Prime Resources |
| Road gradient (max.) | 10 % | Prime Resources |
| Drainage | Side drainage channel | Prime Resources |
| 15.2.11.2 | Haul Road Geometry |
The dual- and single-carriageway haul road widths have been selected as 13.5 m and 8 m, respectively. The crossfall on the surface of the haul roads is 2 %. The total length of the haul roads is approximately 4 km. The topography of the mining area is very steep, specifically the areas along the hills surrounding the pit, which require a maximum road gradient of 10 %.
The crossfall on the road surface allows for surface runoff to flow into a drainage channel positioned alongside the haul road. The drainage channel will comprise a trapezoidal profile, with a depth of 0.5 m, a base width of 0.5 m, and side slopes of 1V:1.5H. Light vegetation such as short grass should be allowed to establish in the channel to avoid erosion within the channel. The channels should be maintained and kept free of large debris or excessive silt build-up which could influence the hydraulic function and capacity of the channels. Runoff collected in the channel will be diverted into the surrounding environment with mitre drains. The spacing will range from 50 m to 200 m, with spacing decreasing with increases in the road gradient.
| 15.2.11.3 | Haul Road Layer Works |
A series of dynamic cone penetration (DCP) tests were undertaken along the centreline of the proposed haul road route to determine the in-situ material resistance to penetration.
The DCP results, most of which indicated values of between approximately 5 mm and 10 mm per blow, are indicative of dense to very dense soils. Loose and soft soils were also encountered in places.
The DCP results were converted to California Bearing Ratio (CBR) values, and the haul road layer works were designed as per the CBR cover curve method (Thompson et al., 2019), assuming a fully laden total truck mass of approximately 74 t and a maximum wheel-to-ground pressure of 352 kPa. An in-situ CBR value of 6 % was selected as the basis of design. The layer works materials specification was adopted from the South African recommended standards for road construction materials (Committee of State Road Authorities, 1985).
| S-K 1300 Technical Report Summary on the Songwe Hill REE Project | Page 304 of 489 |
| |
Table 15.6 summarises the proposed haul road layer works specifications. The compaction specifications are stated as relative compaction density, in a percentage of MOD AASHTO2 density at optimum moisture content.
Table 15.6: Haul Road Layer Works
| Layer | Thickness (mm) |
Minimum CBR (%) |
Material Type | Relative Compaction (%) |
| Wearing course | 200 | 80 | G4 (natural gravel) | 98 |
| Base | 200 | 45 | G5 (natural gravel) | 95 |
| Sub-base | 300 | 25 | G6 (natural gravel) | 93 |
| Subgrade (in situ) | 200 | 6 | G7 (natural gravel) | 90 |
| 15.3 | Project Off-Site Infrastructure |
| 15.3.1 | Site Location and Accessibility |
Songwe Hill is located approximately 110 km (2 h) northeast of Blantyre, which also has the closest airport to the Project. The Project is west of the Mozambiquan border, south of Lake Chilwa (see Figure 15.3).
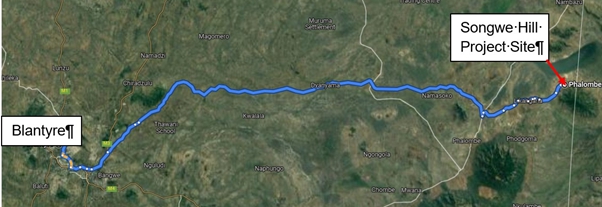
Figure 15.3: Main Access to the Project Site
| 2 | Mod AASHTO density is the maximum dry density of soil determined using the modified AASHTO (American Association of State Highway and Transportation Officials) compaction test |
| S-K 1300 Technical Report Summary on the Songwe Hill REE Project | Page 305 of 489 |
| |
Access to the Project site from Blantyre is north via the S146, branching off east on the S145 to the town of Siana. From Siana, the S147 north is taken for approximately 600 m before the split east at the village of Migowi onto the T415. From Migowi, the T415 is followed northeast, through the town of Likangaria, for approximately 10 km until it reaches the Project site.
From this point, a new access road will be constructed heading east into the proposed processing plant area.
Sections of the S145 between Blantyre and Siana are currently being upgraded to a Class 1 bitumen road, which will improve access conditions up to this point.
The S145 passes through Migowi, which is located approximately 15 km from Songwe Hill. The Project is approximately 9 km from the village of Maoni, which is connected to Migowi via T415, an all-weather, double-lane graded and gravelled road with new, reinforced concrete bridges and culverts.
As part of the Project, a diversion of the T415 will be constructed to the north of the Project site in order to route around the proposed Project infrastructure.
| 15.3.2 | Camp and Catering Facilities |
| 15.3.2.1 | Existing Camp |
Certain administrative and support infrastructure has been established by Mkango off site in the form of an exploration camp, complete with sample storage buildings and accommodation for exploration and security staff. The camp also has its own kitchen and ablution facilities. This tented accommodation, currently being used by security staff, will also be used during the early works phase of the Project until the new accommodation facility has been erected.
| 15.3.2.2 | New Accommodation Facility |
The new accommodation facility will be adequate to house a total of 320 people. It will be divided into tented accommodation and flat pack accommodation. The tented accommodation will be used for the 150 general labourers required during the construction phase. This tented accommodation will be temporary and can be removed once the construction phase of the Project has been completed.
The flat pack accommodation will consist of a flat pack containerised unit for managers and plant equipment vendors during the construction phase. There will be 20 single accommodation units with en suite ablutions and 75 double accommodation units with en suite ablutions, for a total of 170 people. After construction, these units will remain and be utilised for the permanent accommodation of non-local personnel and visitors.
The accommodation facilities will be equipped with a complete kitchen, laundry and two dining areas for the 320 occupants. A containerised sewerage and water treatment (reverse osmosis) plant will form part of this stand-alone facility, with two 400 kVA diesel generators for the power supply to the accommodations until the final electrical infrastructure is in place and installed from the process plant.
Raw water will be fed from the borehole complex to the west, and the water will be treated through the reverse osmosis plant to ensure the quality for potable use.
| S-K 1300 Technical Report Summary on the Songwe Hill REE Project | Page 306 of 489 |
| |
| 15.3.2.3 | Catering Facilities |
All catering and housekeeping services will be managed by the catering and camp management services team. This includes food and consumables management, room cleaning, personnel laundry services, and pesticide spraying.
In addition to catering for the staff at the camps, food will also be prepared for lunch time meals at the process plant. The process plant has its own kitchen and dining room.
Appointing a housekeeping and catering services contractor can be considered as an alternative.
| 15.3.3 | Medical Facilities |
All medical services will be managed by the clinic in the process plant.
| 15.3.4 | PV Power Plants |
The PV plants are located in three different areas. PV Plants 1 and 3 are situated within the fenced process plant area, while PV Plant 4 is located further northwest and will be fenced off separately for security and access control.
| 15.3.5 | Diesel Fuel Storage |
The diesel for the mining fleet and the process plant will be supplied and operated by a fuel supplier.
The storage of the diesel will be at the mining fleet dispensing station, located west of the mining infrastructure buildings, where allowance has been made for 10 d storage of diesel for mining, plant and emergency power generation.
| 15.3.6 | Communication |
An integrated information system will be provided by MKAR, including the latest operating systems enabling effective telephonic and digital communications.
| 15.3.7 | Water Supply System |
A continuous supply of potable water will be provided to a connection point at the accommodation area. This is the same water supply that feeds the process plant and will be fed from the borehole complex on the western side of the plant.
The accommodation area will be equipped with a stand-alone water system including a reverse osmosis plant to ensure potable water quality.
| 15.3.8 | Sewage Disposal |
The accommodation area has its own stand-alone sewage water treatment facility to cater for the full complement of the accommodation facility.
| S-K 1300 Technical Report Summary on the Songwe Hill REE Project | Page 307 of 489 |
| |
| 15.4 | Tailings Storage Facility |
| 15.4.1 | Introduction |
Epoch Resources (Pty) Ltd (Epoch) was appointed by SENET to undertake the 2022 DFS design of the TSF associated with the Project.
The battery limits for the 2022 DFS design of the TSF are as follows:
| ● | The downstream infrastructure around the TSF, within the access road and catchment paddocks where the access road is absent, comprising the tailings dam (TD) and storm water control dam (SWCD) |
| ● | Downstream of the point where the slurry delivery pipeline crosses the toe line of the TD embankment wall |
| ● | The top surface of the decant/excess water pond on the TD/SWCD (i.e. excluding the decant turret) |
| 15.4.2 | Design Criteria and Project Information |
| 15.4.2.1 | TSF Design Parameters |
The key TSF design parameters are summarised in Table 15.7 with references to the source of the information where applicable.
Table 15.7: Key TSF Design Parameters
| Item | Design Criteria | Value | Source |
| 1 | Tailings Material | REEs | Project specific |
| 2 | Typical Tailings Deposition Rate | 1 Mt/a | Mkango |
| 3 | LOO Storage | 20 years | Mkango |
| 4 | Total Tonnage | 20 Mt | Mkango |
| 5 | Tailings Specific Gravity | 2.8 | Laboratory test work from Western Geotechnical and Laboratory Services (WGLS) |
| 6 | Tailings Particle Size Distribution (PSD) | 94 % passing 75 µm sieve | WGLS |
| 7 | Slurry Percentage Solids by Mass | 50 % solids by mass | SENET |
| 8 | Slurry Density | 1.47 t/m3 | Epoch, calculated from percentage solids and SG |
| 9 | Tailings Settled Void Ratio | 1 | Estimated from laboratory test results |
| 10 | Placed Dry Density | 1.4 t/m3 | Estimated from laboratory test results |
| 11 | Freeboard | 1 m above the Inflow Design Flood | Epoch, calculated based on Canadian Dam Association (CDA) wave run-up guidelines |
| 12 | TSF Lining System | TSF will be lined with 2 mm HDPE | Project decision based on generally accepted practice |
| S-K 1300 Technical Report Summary on the Songwe Hill REE Project | Page 308 of 489 |
| |
| Item | Design Criteria | Value | Source |
| 13 | Depositional Methodology | Spigot/open-ended discharge | Epoch |
| 14 | Type of Facility | Full containment | Epoch |
| 15 | Return Water Management Strategy | Return water sump and SWCD | Epoch |
| 16 | Storm Water Management Strategy | Storm water diverted around TD into SWCD | Epoch |
| 17 | TSF Decant System | Turret system | Epoch |
| 18 | Maximum Height of TSF | 42 m | Epoch |
| 19 | Survey Information | Minimum contour interval of 1 m and an accuracy of 0.1 m | SENET, based on received PhotoSat survey |
| 20 | Mean Annual Rainfall (MAR) | 334 mm | Digby Wells |
| 21 | Mean Annual Evaporation (MAE) | 1,047 mm | Digby Wells |
| 22 | Maximum Credible Earthquake (MCE) | 1:10,000 recurrence interval for Extreme Consequence facilities | As per Global Industry Standard on Tailings Management (GISTM) |
| 23 | Peak Ground Acceleration (PGA) for MCE | 0.239 g | As per seismic hazard assessment |
| 24 | Environmental Design Flood | 1:200 7 d storm event: 267 mm | Epoch |
| 25 | Inflow Design Flood | Probable maximum precipitation (PMP): 1,082 mm | Based on CDA guidelines for freeboard design |
| 15.4.2.2 | Design Legislation/Codes/Guidelines |
As Malawi does not have any existing TSF design legislation, codes, or guidelines, the design process is based on the GISTM (2020). The following additional guidelines were used:
| ● | For freeboard and storm diversion design recommendations: |
| o | CDA, Dam Safety Guidelines (2013) |
| o | CDA, Application of Dam Safety Guidelines to Mining Dams (2019) |
| ● | For positioning of the test pits and boreholes for the geotechnical site investigation: |
| o | South African Institution of Civil Engineering (SAICE) – Geotechnical Division, Site Investigation Code of Practice (2010). |
| 15.4.3 | Characterisation of the Tailings |
The following tailings streams are delivered to the TSF:
| ● | A flotation tailings slurry of approximately 50 % w/w solids to liquid ratio. The solution will contain residual flotation reagents such as collectors, depressants, and pH modifiers. These solids will also include a small quantity of sulphide pre-float concentrate, combined with the flotation tails samples. |
| S-K 1300 Technical Report Summary on the Songwe Hill REE Project | Page 309 of 489 |
| |
| ● | A combined hydrometallurgical solid residue and tailings stream as a composite of several other smaller streams from the hydrometallurgical plant, including the following: |
| o | Rare earth leach residue |
| o | Gangue leach purification residue |
| o | Causticisation residue |
| o | PLS purification residue |
| ● | A barren solution stream from the rare earth carbonate precipitation with ammonium bicarbonate, which forms part of the tailings slurry mixture and is not conveyed to the TSF as a separate stream. |
The tailings streams are summarised in Table 15.8.
Table 15.8: Tailings Streams
| TSF Feed Stream | Unit | Flow |
| Flotation Tails Solids (50 % of slurry mixture) | t/h | 114.2 |
| Flotation Tails Liquid (50 % of slurry mixture) | m3/h | 93.4 |
| Rare Earth Leach Residue | t/h | 2.11 |
| Gangue Leach Purification Residue | t/h | 0.6 |
| Causticisation Residue | t/h | 1.17 |
| PLS Purification Residue | t/h | 0.018 |
| Barren Solution | m3/h | 32.45 |
| 15.4.3.1 | Geotechnical Characterisation of the Tailings |
The physical and geotechnical characterisation of the tailings has been based on the following:
| ● | Indicator tests to determine the PSD |
| ● | Triaxial tests to determine shear strength parameters |
| ● | Permeability tests |
| ● | Consolidation tests |
| ● | Drained and undrained settlement tests |
The tailings sample on which the tests were conducted comprises the components listed in Table 15.9.
Table 15.9: Tailings Sample Components
| Sample Component | Percentage by Mass (%) |
| Gangue Leach Neutralisation Precipitate | 0.3 |
| Causticisation Residue | 1.1 |
| Rare Earth Leach Residue | 2.7 |
| Flotation Tailings | 95.8 |
| S-K 1300 Technical Report Summary on the Songwe Hill REE Project | Page 310 of 489 |
| |
The results of the testing show that
| ● | The PSD curve for the tailings sample, shown in Figure 15.4, indicates a fine material, with 94 % of the material passing the 0.075 mm sieve. |
| ● | Table 15.10 summarises the parameters adopted for the tailings and the study. In the slope stability analyses, the slip circle remains within the confines of the waste rock embankment wall; therefore, the strength parameters of the tailings do not affect the results. |
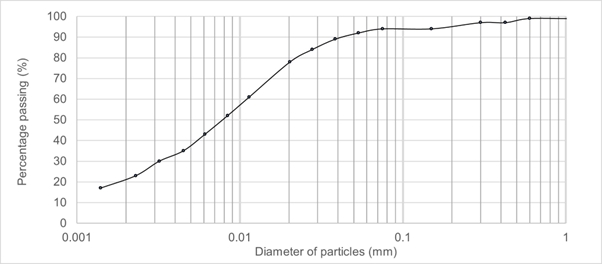
Figure 15.4: PSD for Rare Earth Tailings
Table 15.10: Material Parameters Adopted for the TSF Slope Stability Analyses
| Material Description |
Unit Weight (kN/m3) |
Effective Friction Angle, φ’ (degrees) |
Effective Cohesion, c’ (kPa) |
Hydraulic Conductivity (m/s) |
| Rare Earth Tailings | 13 | 32 | 0 | 4 × 10⁻⁷ |
| 15.4.3.2 | Radioactive Characterisation of the Tailings |
Due to the presence of naturally occurring radionuclides in the rare earth deposit, Digby Wells commissioned AquiSim Consulting (Pty) Ltd (AquiSim) as the Radiation Protection Specialist to conduct the Radiological Protection and Safety Assessment (RPSA) to assess the potential radiological impact on members of the public from the Songwe Hill REE Project.
The findings of the RPSA are summarised below:
| ● | The contribution of radon, thoron and dust inhalation as well as animal and crop ingestion are all below the total effective dose (less than 20 % of the dose limit of 1,000 μSv.year-1 for public exposure) at selected receptor locations. As a result, no additional management or mitigation measures are required from a regulatory compliance perspective. |
| S-K 1300 Technical Report Summary on the Songwe Hill REE Project | Page 311 of 489 |
| |
| ● | A simplified one-dimensional numerical groundwater model was used to assess the radiological consequences of leaching of radionuclides from the TSF, using a compartmental modelling approach to represent the migration and fate of contaminants in the environment. As a compliance point, a borehole 500 m away from the TSF was selected, assuming members of the public consume the contaminated groundwater daily. The findings of the assessment are summarised below. |
| ● | Groundwater modelling was undertaken as part of the radiation study and determined that potential doses through the groundwater pathway reach peak concentrations after 20,000 years and the peak dose would be below 20 μSv.year-1. This is significantly less than the public dose limit of 1,000 μSv.year-1. |
| 15.4.3.3 | Geochemical Characterisation of the Tailings |
SGS Perth Environmental Laboratory was appointed by Digby Wells to conduct the geochemical analysis on the tailings and barren liquor stored in the TSF. One barren liquid and six tailings composite samples were analysed with the following composition:
| ● | Gangue Leach Neutralisation Precipitate |
| ● | Causticisation Residue |
| ● | Rare Earth Leach Residue |
| ● | Combined Hydrometallurgical Purification Residue |
| ● | Combined Front- and Back-End Hydrometallurgical Tailings |
| ● | Flotation Tailings |
The analytical suite included the following:
| ● | Mineralogical analysis – XRD analysis to determine the mineral constituents of the samples |
| ● | Total metal analysis – XRF and acid digestion (aqua regia) followed by a semi-quantitative 29 element ICP scan |
| ● | Synthetic precipitation leaching procedure (SPLP) and deionised water leaching test at a 1:4 solid to liquid ratio |
| ● | Acid-base accounting (ABA) tests including sulphur speciation (total sulphur, sulphate sulphur and sulphide sulphur) |
| ● | Non-acid generating test, where an oxidising agent (hydrogen peroxide) is used to assess whether a sample can neutralise the potential acidity on complete oxidation of sulphides |
The results of the analyses are as follows:
| ● | The reactive minerals in the tailings were acid neutralising minerals, namely carbonates (1.5 % to 57 %), aluminosilicates (1.3 % to 17 %) and goethite (3.7 % to 4.1 %), contributing to the overall neutralisation potential (NP) of the tailings. |
| ● | The tailings streams were acidic to alkaline (pH 4.4 to 13) in the short term. The acidic tailings streams were rare earth leach residue (pH 4.4) and combined hydrometallurgical purification residue (pH 4.9). |
| S-K 1300 Technical Report Summary on the Songwe Hill REE Project | Page 312 of 489 |
| |
| ● | Consistent with the mineralogy results, total sulphur in the tailings ranged from 0.14 % to 1.2 %. The sulphur occurred predominantly as sulphate (0.14 % to 1.0 %). Sulphide sulphur ranged from 0 to 0.2 %. |
| ● | The NAG pH ranged from pH 4.3 to 13. All the tailings streams will be non-acid forming (NAF) in the long term except the rare earth leach residue and combined hydrometallurgical purification residue, which were inconclusive and classified as Uncertain. |
| ● | The leachate from the tailings streams were highly alkaline (pH 9.1 to 13) except for rare earth leach residue (pH 4.3) and combined hydrometallurgical purification residue (pH 4.7). The leachates are saline (total dissolved solids (TDS), 3,045 mg/L to 22,516 mg/L) except rare earth leach residue (TDS, 838 mg/L) and flotation tails (TDS, 230 mg/L). The potential parameters of concern in the tailings’ leachates were identified as alkalinity, arsenic (As), calcium (Ca), chloride (Cl), chromium (Cr), fluoride (F), sodium (Na), TDS, and zinc (Zn). |
| 15.4.4 | Geochemical Characterisation of the Waste Rock Material |
Bara was appointed to identify potential pollutants associated with the waste rock material and to assess the metal-leaching and acid-generating potential of these materials. The TSF will be constructed from the waste rock made available from mining operations; therefore, the test work is relevant to the TSF design.
The following may be concluded based on the test work conducted:
| ● | The composite samples have insufficient sulphide present (below the limit of 0.3 %) to sustain long-term acid generation if oxidised. |
| ● | The leach test results have shown that the pH of the leachate exceeds the International Finance Corporation (IFC) standard (maximum pH of 9) for discharge; however, the pH was within the Malawi Bureau of Standards drinking water quality requirement (maximum pH of 9.5). The runoff from the WRD is therefore anticipated to be alkaline with minor enrichment of contaminants of concern and REEs. |
| ● | The waste rock is enriched in barium (Ba), cadmium (Cd), manganese (Mn), molybdenum (Mo), lead (Pb), selenium (Se), strontium (Sr), thorium (Th), Zn and REEs. The mobility of these elements in the leaching experiments, except for some of the REEs, was found to be below the IFC guidelines and therefore poses a low risk of pollutant release in the short term. The non-acid generating pH was pH 9.3, indicating that the waste rock will be non-acid forming in the long term. |
Although the anticipated runoff from the waste rock is not considered to be of a high risk due to its lack of acidity and low concentrations of regulated contaminants, there is potential for the waste rock to release an elevated alkaline discharge (high pH) with minor concentrations of REEs which could pose a risk to freshwater resources. It is recommended that protection of groundwater resources should be prioritised due to their extensive use in the region. Therefore, an engineered basal liner of compacted in-situ soil or similar is recommended to restrict ingress of potentially contaminated runoff to groundwater.
| 15.4.5 | Site Selection |
A site selection study was conducted for the initial required storage capacity of 30 Mt, and the self-raising TSF considered in previous assessments prior to the 2022 DFS was replaced with a more robust, full-containment facility after taking the publication of GISTM in 2020 into account in the design, and also taking cognisance of the seismic nature of the area.
| S-K 1300 Technical Report Summary on the Songwe Hill REE Project | Page 313 of 489 |
| |
Table 15.11 summarises the trade-off between the four options based on the criteria listed above. Fatal flaws are highlighted in red, and undesirable flaws are highlighted in orange.
Table 15.11: Site Selection Aspects
| Item Description | Option 1 | Option 2 | Option 3 | Option 4 |
| Space for the plant | Yes South of TSF |
Yes Southwest of TSF |
Yes South of TSF |
No |
| Space for the WRD and ore stockpile | Yes East of TSF |
Potentially West of TSF |
Yes East of TSF |
No |
| Proximity to the 100 m graveyard boundaries | Requires relocation of Maoni graveyard | Requires relocation of most graveyards | Requires relocation of Maoni graveyards | No relocation of graveyards required |
| Proximity to the school, road and villages to the north | Requires relocation of village around the road on the west | Requires relocation of village around the road on the east | Requires relocation of some villages | Requires relocation of some villages |
| Potential for expansion should the LOO be extended or the tailings production rate be increased | Yes | Yes | Yes | No (no space for plant) |
| High-level CAPEX (US$ million) |
85 | 88 | 100 | 90 |
| Fatal flaws are highlighted in red, and undesirable flaws are highlighted in orange. | ||||
Option 1 has been selected as the final site on which the 2022 DFS design will be conducted, for a design storage capacity of 20 Mt of dry tailings, with the potential to expand to 30 Mt in the future, because of the following:
| ● | It was the most economical site based on the high-level CAPEX estimate, and one of the lower risk sites. |
| ● | It can be expanded for the 30 Mt scenario should the LOO increase. |
| ● | There is sufficient space available for the construction of an SWCD system downstream of the TD, a plant to the south, and waste rock and ore stockpiles to the east. |
| ● | It lies downstream of the plant and pit; therefore, in the event of a TSF failure, it will not affect these structures. |
| S-K 1300 Technical Report Summary on the Songwe Hill REE Project | Page 314 of 489 |
| |
| 15.4.6 | Geotechnical Investigation |
| 15.4.6.1 | Geotechnical Site Investigation of the TSF Site |
Geoconsult Pty Ltd, appointed by SENET, undertook a geotechnical site investigation of the preferred TSF footprint identified for the design. The locations of the test pits and boreholes were selected in accordance with the guidelines specified in the Site Investigation Code of Practice (SAICE, 2010).
The laboratory test work on the samples collected by Geoconsult was conducted by Zutari. Suitable samples for the triaxial test work were not available; therefore, a geotechnical engineer will be appointed to retrieve adequate samples from test pits on site, prior to the detailed design, to complete the test work campaign on the in-situ materials.
| 15.4.6.2 | Laboratory Test Work |
The test results for the test pit showed the soil to have a predominantly medium plasticity index (PI) range falling within the CL (inorganic clays of low to medium plasticity, silty clays) to SC (clayey sands and sand clay mixtures) Unified Soils Classification System (USCS) classification range, indicating a blend of cohesive soils with sand.
The soil parameters for the study were estimated based on recommended parameters provided by Zutari and shall be revalidated once the triaxial test results become available. The shear strength and permeability parameters of the in-situ and remoulded soils beneath the TSF embankment for preliminary design purposes are shown in Table 15.12.
Table 15.12: Recommended Design Parameters
| Soil Type | Estimated Parameters | |||||
| Effective
Cohesion, c’ (kPa) |
Effective
Friction Angle, φ’ (degrees) |
In-Situ
Permeability Coefficient (m/s) |
Remoulded Permeability Coefficient (m/s) |
Classification | Bulk
Unit Weight (kN/m3) | |
| Silty Clay | 2 | 24 | 5.5 × 10⁻⁸ | 1 × 10⁻⁹ | CL | 18 |
| Clayey Sand | 0 | 34 | 3.0 × 10⁻⁶ | 1 × 10⁻⁷ | SC | 20 |
| 15.4.7 | Tailings Storage Facility Design |
The TSF comprises the following:
| ● | A 2,000 µm HDPE-lined, full-containment valley TD constructed in four downstream lifts following the construction of the initial starter embankment |
| ● | The TD embankment constructed from waste rock material sourced from mining operations, with a 10 m wide crest comprising a 5 m layer of fine-grained material on the upstream face of the 5 m wide waste rock embankment wall |
| ● | A 2,000 µm HDPE-lined SWCD comprising a 1 m high wall, 3.5 m cut basin with a maximum storage capacity of 66,000 m3 |
| ● | Associated infrastructure, including the slurry distribution pipeline, catchment paddocks, toe drain system, underdrainage system, curtain drain system, solution collection pipeline, collection sumps and manholes, seepage cut-off trench, storm water diversion trenches, emergency spillways and leakage detection drains |
| ● | A floating turret to decant the supernatant tailings slurry water and storm water from the facility back to the plant |
| S-K 1300 Technical Report Summary on the Songwe Hill REE Project | Page 315 of 489 |
| |
Figure 15.5 shows a close-up of the TSF configuration.
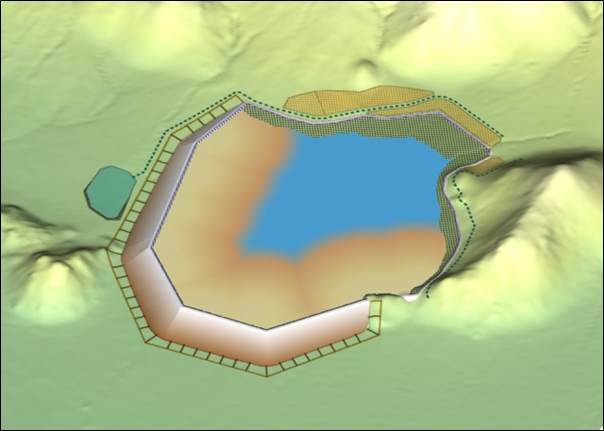
Figure 15.5: Close-Up of the TSF Site
| 15.4.7.1 | Tailings Dam Consequence Classification |
The Consequence Classification of the TSF has been carried out in accordance with the GISTM (2020) guidelines and provides the required design loading conditions to be adopted and applicable to the Songwe Hill TSF. The Consequence Classification for the Songwe Hill TSF is Extreme, implying that the maximum prescribed loading conditions/events are to be adopted and applied for the TSF design.
The TSF is to be constructed as a valley deposit behind a compacted waste rock embankment that is unlikely to liquefy should a seismic event take place. The delineation of the breach zone of the TSF is, however, based on the premise that a failure of the embankment wall will occur, resulting in the release of water and eroded/liquefied tailings from the facility.
A preliminary assessment using simple and conservative procedures has been done to obtain a first approximation of the theoretical inundation zone and thus level of consequences. A more comprehensive dam break analysis will be completed at the detailed design stage to more accurately define the potential inundation extent of the TSF.
| 15.4.7.2 | Design Aspects of the TSF |
The TSF has been designed taking cognisance of the following aspects:
| ● | The topography, the immediate surroundings, and mine infrastructure |
| S-K 1300 Technical Report Summary on the Songwe Hill REE Project | Page 316 of 489 |
| |
| ● | A total dry tailings storage capacity of 20 Mt at a deposition rate of 1 Mt/a over the LOO of 20 years |
| ● | Phased construction of the TSF over the LOO |
Table 15.13 summarises the key parameters associated with the TSF. The TSF shall be constructed in five phases over the LOO.
Table 15.13: Key Parameters Associated with the TSF
| Tailings Dam Parameter | Phase 1 | Phase 2 | Phase 3 | Phase 4 | Phase 5 |
| Total footprint area of the facility within the tailings surface and pond (ha) | 64 | 77 | 82 | 89 | 95 |
| Maximum design embankment wall elevation (mamsl) | 681.5 | 686.5 | 691.0 | 694.5 | 698 |
| Maximum design embankment wall height (m) | 23.5 | 28.5 | 33.0 | 36.5 | 41.0 |
| Outer side slope of embankment wall | 1V:3H | ||||
| Inner side slope of embankment wall | 1V:2H | ||||
| Embankment wall crest width (m) | 10 | ||||
| Embankment wall material | Waste rock from mining operations (5 m) and suitable fine-grained material to upstream embankment wall face (5 m) | ||||
| Years of tailings deposition | 4 | 4 | 4 | 4 | 4 |
| Cumulative years of tailings deposition | 4 | 8 | 12 | 16 | 20 |
| Tonnes of dry tailings stored in TSF (Mt) | 4 | 4 | 4 | 4 | 4 |
| Cumulative tonnes of dry tailings stored in TSF (Mt) | 4 | 8 | 12 | 16 | 20 |
Staged Capacity Curves
The stage capacity curves show the development of the TSF over time and illustrate the relationship between tailings elevation, rate of rise, storage volume, footprint area, cumulative tonnage and time.
| S-K 1300 Technical Report Summary on the Songwe Hill REE Project | Page 317 of 489 |
| |
The compacted earth embankment of the TSF is constructed in phases over its operational life, reaching a final height of 41 m above natural ground level, corresponding to an elevation of 698 mamsl. For each phase, tailings will be deposited behind the embankment wall until the maximum elevation is reached at the freeboard level below the crest elevation. By this time, the embankment wall of the subsequent phase will have been constructed and be ready to contain the deposited tailings. Table 15.14 summarises the tailings elevation, operational years, and dry tonnes of tailings per phase over the LOO.
Table 15.14: Staged Capacity of the TSF
| Phase of Facility | Tailings Elevation (mamsl) | Cumulative Years | Cumulative Tonnage (Mt) |
| 1 | 681.5 | 4 | 4 |
| 2 | 686.5 | 8 | 8 |
| 3 | 691.0 | 12 | 12 |
| 4 | 694.5 | 16 | 16 |
| 5 | 698.0 | 20 | 20 |
Preparatory Works
The preparatory works associated with the TSF are shown in the drawings and comprise the following for Phase 1 of the TSF:
| ● | Topsoil stripping to a depth of 0.2 m within the TSF footprint, including the embankment wall footprint area and associated TSF infrastructure area. |
| ● | A shear key 4.0 m deep beneath the compacted earth embankment, using suitable fine-grained material. |
| ● | A compacted waste rock embankment with a 10 m wide crest, an outer side slope of 1V:3H, and an inner side slope of 1V:2H. |
| ● | A 5 m wide layer of suitable fine-grained material on the upstream face of the waste rock embankment wall, forming part of the total embankment wall width of 10 m. |
| ● | A compacted layer of suitable fine-grained material to a depth of 1.0 m beneath the TSF embankment wall to limit seepage through the waste rock embankment wall into the environment. |
| ● | A 1 m high bund wall with an outer side slope of 1V:3H and an inner side slope of 1V:2H along the final TSF perimeter. |
| ● | A 3 m wide elevated toe drain located on an elevated platform at 368 mamsl, along a section of the embankment corresponding to the first three months of tailings deposition elevation. During this time period, the pond is pushed away from the drain, which comprises slotted 160 nominal diameter (ND) HDPE piping, suitably graded filter sand, and intermediate and coarse graded stone, all wrapped in non-woven geofabric. The drain serves to draw down the phreatic surface within the TSF. |
| ● | A 3 m wide toe drain, constructed where the elevated toe drain is absent, comprising suitably graded filter sand, intermediate and coarse graded stone, and 160ND slotted HDPE piping, all wrapped in non-woven geofabric. This serves to draw down the phreatic surface within the TSF. |
| ● | Drains that are 3 m wide, constructed within the basin in the form of a grid, above the liner, comprising suitably graded filter sand, intermediate and coarse graded stone, and 160ND slotted HDPE piping, all wrapped in non-woven geofabric. This serves to draw down the phreatic surface within the TSF. |
| S-K 1300 Technical Report Summary on the Songwe Hill REE Project | Page 318 of 489 |
| |
| ● | A 0.75 m wide vertical curtain drain within the Phase 1 main embankment, extending from the embankment wall base to an elevation of 674 mamsl, comprising suitably graded filter sand, coarse graded stone, 160ND slotted HDPE piping, and non-woven geofabric. This serves to prevent the phreatic surface from migrating through the TSF embankment and exiting on the downstream side in the case of a liner leak. |
| ● | Pipes (160ND non-slotted HDPE) at specified intervals along the perimeter of the elevated toe drains, underdrains, and vertical curtain drains, channelling the water collected by these drains into the solution pipeline. |
| ● | A 355ND HDPE buried solution pipeline with 1 m backfill cover to channel the water from the various drain outlets to a water collection sump. |
| ● | Solution collection manholes spaced at intervals along the solution pipeline to collect seepage from the outlet pipes to be conveyed to the collection sump via the solution pipeline. |
| ● | A seepage cut-off drain located ~15 m downstream of the Phase 1 embankment downstream toe. It is 1 m wide and 2 m deep and collects sub-surface seepage water. The drain comprises coarse drainage material, 19 mm stone, two 160ND slotted HDPE pipes, all wrapped in non-woven geofabric. |
| ● | A water collection sump for the collection of water from the solution pipeline and seepage cut-off manhole, from where it is pumped back onto the TSF and ultimately to the process plant for reuse. |
| ● | Catchment paddocks that are 1.5 m high, along the perimeter of the TSF. |
| ● | A 5 m wide gravel access road to divert the existing road around the TSF. |
| ● | A 1.5 m deep, 1V:1.5H side slope and 1.0 m wide base, trapezoidal dirty storm water diversion and associated cut to fill berm, leading into the SWCD. |
| ● | A 400 OD HDPE, PE100 PN10 SDR 17 slurry distribution pipeline along the perimeter length of the TSF, with discharge outlets located at 36 m intervals. |
| ● | An emergency spillway, with 1V:2H side slopes, 8 m wide base and a 0.3 m Reno mattress, to prevent overtopping of the TSF embankment wall in the unlikely event that the pond size increases, resulting in emergency decanting from the TSF. |
| ● | A 3.5 m deep SWCD basin and 1.5 m high compacted embankment wall with a 10 m wide crest. |
| ● | Leakage detection drains beneath the SWCD liner, comprising suitably graded filter sand, intermediate and coarse graded stone, and 160ND slotted HDPE piping, all wrapped in non-woven geofabric. |
| ● | A water collection manhole for the collection of leakage water beneath the liner. |
The preparatory works associated with Phases 2, 3, 4 and 5 of the TSF predominantly comprise the following:
| ● | The downstream lifting of the compacted earth embankment wall with suitable open-pit overburden material and fine-grained material on the upstream face. |
| ● | The augmentation or extension of the associated infrastructure where warranted, e.g. toe drains, solution trench, paddocks, and spillway. |
| S-K 1300 Technical Report Summary on the Songwe Hill REE Project | Page 319 of 489 |
| |
Tailings Dam Depositional and Operational Methodology
The proposed depositional methodology for the TSF is by spigot/open-ended discharge behind a fully contained valley-type dam concept. This requires that each phase of the TSF embankment be built to its required height prior to commencing with that phase’s associated deposition.
Surface water accumulating onto the TSF emanates from the following sources:
| ● | Supernatant slurry water on the TSF |
| ● | Storm water runoff from the surface of the TSF |
Supernatant water and storm water collected on the TSF shall be decanted by a floating turret arrangement and pumped back to the plant for reuse as process water. As the pond migrates up the valley, so too does the floating turret. The development of the TSF and anticipated movement of the TSF pond over the LOO is shown in Figure 15.6 and Figure 15.7. The pond extent is a function of the required depth for the operation of the turret, the volume of water required by the plant and a safe distance from the embankment wall. From a safety standpoint, the ideal pond extent to be maintained throughout the LOO has been depicted as 0.4 m deep, as shown in the figures below.
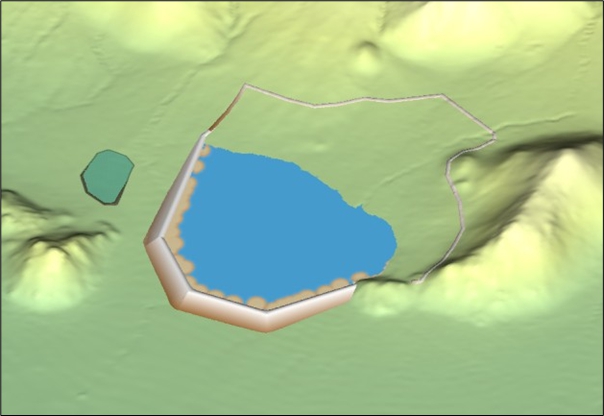
Figure 15.6: TSF Development at Phase 1 in Year 4 of the LOO
| S-K 1300 Technical Report Summary on the Songwe Hill REE Project | Page 320 of 489 |
| |
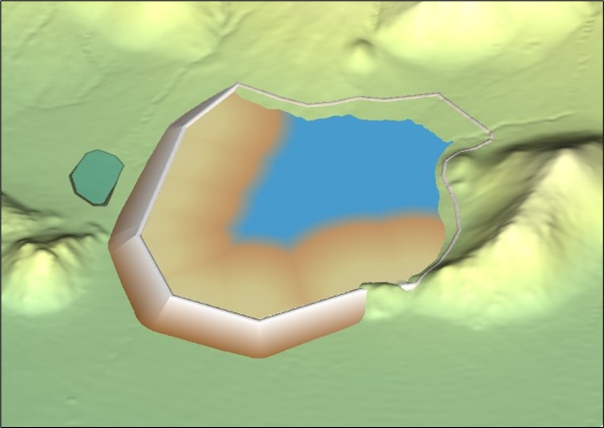
Figure 15.7: TSF Development at Phase 5 in Year 20 of the LOO
The purpose of the SWCD is to
| ● | Collect dirty storm water runoff from the mining areas. |
| ● | Contain the pond water pumped from the TSF at closure prior to the installation of the beach cover (at closure, the installation of a dry cover over the tailings beach would first require the removal of the remaining TSF water in the basin). |
| ● | Receive the seepage water from the drainage system on the floor of the TSF basin to desaturate the tailings prior to and during the installation of the beach cover. |
| ● | Receive the seepage water from the drainage system throughout operations for seepage monitoring purposes. |
Seepage water from the various drains shall be collected in a solution pipeline leading into a collection sump, from where it shall be pumped back onto the TSF. Seepage from the southern half of the underdrainage network will lead into the SWCD. Mkango requested that the SWCD be positioned away from the north of the TSF to avoid the settlements downstream as far as possible, and it was therefore positioned to the east. SENET has requested that the runoff from the mining areas be diverted into the SWCD to prevent dirty water from flowing into the environment downstream towards the settlements. The SWCD has been designed to store the water from the 1:100-year, 7 d storm event, collected by the storm diversion trench along the southern perimeter of the TSF, from the upstream catchment where the plant is positioned. This is 40,000 m3 of water that may be stored in the SWCD. SENET has also requested that the calculated runoff from the WRD be diverted to the SWCD and has provided the design flow of 26,000 m3. The SWCD is therefore designed to store the required capacity of 66,000 m3. In the case of water shortages, all the water available in the SWCD will be pumped to the TD, to be returned to the plant. Dirty water will not be discharged into the environment.
An emergency spillway has also been allowed for in each phase in the unlikely event that the pond size increases, resulting in emergency decanting off the TSF.
| S-K 1300 Technical Report Summary on the Songwe Hill REE Project | Page 321 of 489 |
| |
TSF Pond Water Management Philosophy
Figure 15.8, extracted from the CDA guidelines (2013), shows a section through a typical TSF, indicating the defined levels of water stored and conveyed, with an emergency spillway for passage of the Inflow Design Flood (IDF).
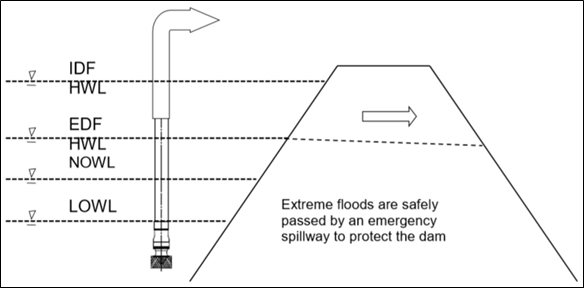
HWL: High water
level
LOWL: Low operating water level
NOWL: Normal operating water level
Figure 15.8: Typical Appurtenances Required for EDF Storage and IDF Conveyance
Storage capacity for the Environmental Design Flood (EDF) is required above the normal operating water level (NOWL) during the period when the EDF is retained. The TSF has been sized to store the EDF of the 1 in 200-years, 7 d storm event of 267 mm.
According to the CDA guidelines, the IDF is “the most severe inflow flood for which a dam and its associated facilities are designed.”
| S-K 1300 Technical Report Summary on the Songwe Hill REE Project | Page 322 of 489 |
| |
Table 15.15 presents the criteria for IDF target levels in the GISTM guidelines. These are considered applicable for the construction, operation, and transition phases. The IDF for the Extreme consequence class dam is the Probable Maximum Flood (PMF); the 24 h PMP of 1,082 mm was provided by Digby Wells (2021).
Table 15.15: GISTM Flood Design Criteria
| Consequence Class | Operations and Closure (Active Care) Return Intervals |
| Low | 1/200 |
| Significant | 1/1,000 |
| High | 1/2,475 |
| Very High | 1/5,000 |
| Extreme | 1/10,000 or PMF |
| 15.4.8 | Slope Stability Analyses |
Slope stability analyses were carried out on a variety of possible operational and upset conditions.
The tailings strength parameters were derived from laboratory test work results conducted by WGLS. The critical slip circles occur within the confines of the main embankment, thus negating the influence of the tailings geotechnical parameters and the phreatic surface within them.
The mine site is situated within the East African Rift, which has historically experienced earthquakes with a moment magnitude of up to 7.3, causing heavy damage to infrastructure. A deterministic and probabilistic seismic assessment was therefore conducted by Prof. Kijko of Natural Hazard Assessment Consultancy CC. The MCE was selected as the 1/10,000 return period, as per the GISTM recommendation for Extreme Consequence facilities. The PGA, defined as the maximum horizontal ground acceleration that occurred during an earthquake, is 0.239 g ± 0.101 g for the MCE, which will be used for the TSF slope stability modelling. A ground motion having the potential to cause significant risk to a structure’s architectural or structural components is a PGA of > 0.05 g. Based on the available information, the Deterministic Seismic Hazard Assessment (DSHA), the Probabilistic Seismic Hazard Assessment (PSHA), and the classification procedure by Shedlock et al. (2000), the mine site’s seismic hazard is rated as “Moderate”.
The outcomes from the slope stability analyses are summarised as follows:
| ● | The critical slip circles occur within the confines of the main embankment, thus negating the influence of the tailings geotechnical parameters and the phreatic surface within them. |
| ● | The FOS, reliability index and probability of failure of the TSF for the various scenarios considered meet the minimum prescribed values. |
| 15.5 | Logistics |
Mkango nominated C. Steinweg Bridge (Pty) Ltd as the freighter forwarder to conduct the route survey due to their proven track record and experience in Africa. Furthermore, C. Steinweg Bridge has been recommended to be the freighter forwarder during the execution of the Project.
Africa Route Clearance Consultants (Pty) Ltd (ARC) was commissioned by C. Steinweg Bridge to carry out a logistics study to identify the limitations on a transportation route for various loads (including abnormal loads with a laden height of up to 6.40 m).
| S-K 1300 Technical Report Summary on the Songwe Hill REE Project | Page 323 of 489 |
| |
The packing list suggests that the components would be transported either from premises in Johannesburg (Vereeniging was used as a typical point of origin) or from the ports of Durban and Richards Bay in South Africa to the MKAR Mine near Songwe Hill in Malawi.
The Logistics Study Report addresses the following:
| ● | Identifies the most suitable route(s) |
| ● | Identifies the clearance limits on the routes based on the largest vehicle combination abnormalities as follows: |
| o | Length | 7.20 m |
| o | Width | 6.16 m |
| o | Height | 5.30 m |
| o | Laden Height (using an 800 mm high lowbed) | 6.10 m |
| o | Laden Height (using a 1,200 mm high multi-axle) | 6.40 m |
| o | Weight/Mass | 35 t |
| ● | Makes recommendations based on the consultants’ previous experience from similar projects |
In general terms abnormal loads are classified as such when they exceed the following dimensions:
| ● | Maximum normal vehicle length of 22.0 m |
| ● | Maximum normal vehicle width of 2.60 m |
| ● | Maximum normal vehicle height of 4.30 m |
| ● | Maximum normal vehicle weight of 56.0 t |
Vehicle combinations within the above specifications have no problem travelling on any road infrastructure throughout all of the countries on the route.
Limitations that are insurmountable determine the window/geometric envelope for any specific route or can fatally flaw the use of a specific route.
Typically, insurmountable limitations comprise the following:
| ● | Overhead bridge structures (These cannot be modified.) |
| ● | Overhead Eskom (South African electricity public utility) transmission power lines (Some of these cannot be de-energised or lifted.) |
| ● | Weak bridge structures that cannot be propped/bypassed |
For this report, height clearance (which must apply to the laden height of the vehicle combination) was the focus although width at 6.16 m was also considered.
NOTE: Cargo dimensions
+ the height of the trailer + any spreader beams/sleepers/rockers/
other supports to secure the cargo make up the laden height.
| S-K 1300 Technical Report Summary on the Songwe Hill REE Project | Page 324 of 489 |
| |
Typically, trailer-bed heights range from 800 mm to 1,200 mm above road level. Therefore, a route with a maximum height clearance of 6.40 m will accommodate payload dimension heights of only 5.20 m to 5.50 m, depending on the trailer combination used.
Logistics and transport studies were conducted to
| ● | Define the possible access routes to site. |
| ● | Identify port facilities and capabilities at the point of discharge. |
| ● | Determine the most efficient routing and method of transport to site. |
| ● | Determine road/bridge upgrade requirements to ensure the safe delivery of all shipments. |
| ● | Determine the total logistics budget to complete the movement to site of all Project cargo. |
| ● | Determine customs and excise requirements in Malawi and their effect on the Project programme/budget. |
| 15.5.1 | Routing |
Four routing options were considered for containers, abnormal and break bulk:
| ● | Port of Durban (South Africa) to Blantyre (Malawi) by road freight |
| ● | Port of Richards Bay (South Africa) to Blantyre (Malawi) by road freight |
| ● | Port of Beira (Mozambique) to Blantyre (Malawi) by road freight |
| ● | Port of Nacala (Mozambique) to Blantyre (Malawi) by road freight |
For airfreight, the routing option was from Johannesburg O.R. Tambo Airport (South Africa) to Blantyre Airport (Malawian) via commercial airlines.
| S-K 1300 Technical Report Summary on the Songwe Hill REE Project | Page 325 of 489 |
| |
ARC embarked on a route study of the most probable route, which was identified as travelling through South Africa, Zimbabwe, Mozambique (northern section crossing from Zimbabwe to Malawi – see Figure 15.9) and into Malawi to the final destination, the MKAR Mine near Songwe Hill.
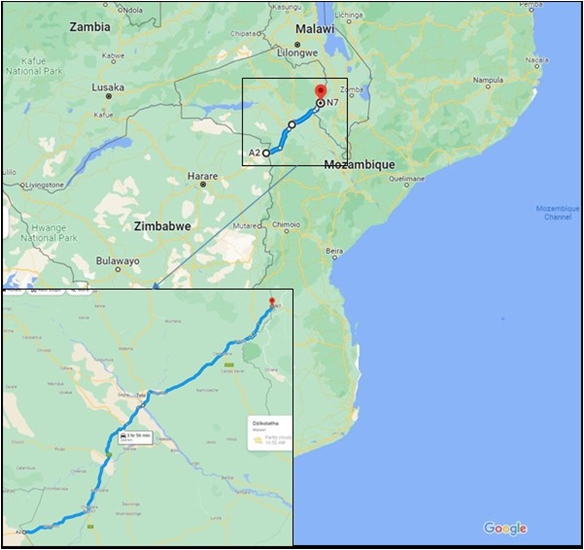
Figure 15.9: Route through Mozambique
Travelling from either of the two ports in Mozambique, through Mozambique inland to the Malawi border, is not the preferred option based on the following:
| ● | Mozambique, as an abnormal load route, has the most limitations of any country in the SADC (Southern African Development Community) region. |
| ● | While Mozambique may provide the shortest route to Malawi, this route is limited to normal heavy goods vehicles (HGVs). Using this route to accommodate abnormal load transportation – specifically abnormalities such as a laden height of 6.40 m – is not possible. |
| ● | Political unrest after the general elections held in October 2024 might disrupt Mozambique’s shipping industry. |
Accordingly, and in association with their colleagues ESA Lda in Mozambique and David Consulting Engineers in Malawi, ARC embarked on route inspections of the most probable route for sections that had not recently been inspected or had unknowns as to limitations.
| S-K 1300 Technical Report Summary on the Songwe Hill REE Project | Page 326 of 489 |
| |
The focus was on abnormal load routes as these routes have a larger window/geometric envelope than normal HGV routes, noting the laden height of the proposed combination, which is significant at 6.40 m.
The bulk of abnormal load transportation in South Africa emanates from the Port of Durban, with larger abnormal loads (super loads particularly with height restrictions) utilising the Port of Richards Bay.
| 15.5.2 | Port Facilities |
Based on ARC’s experience in clearing routes from each of the above-mentioned ports over the past 35 years, this section describes the suitability of each port based on ease of operation from each port.
Based on the route and climate conditions, as well as the size of cargo to be transported, any of the four routes can be used for the Project.
| 15.5.2.1 | Port of Durban, South Africa |
The Port of Durban is Africa’s biggest container port in terms of capacity. Located on some of the world’s busiest shipping routes, it is South Africa’s main port for general cargo and containers. It handles an average of 83,000 containers each month at the Port of Durban Container Terminal.
The abnormal loads route out of Durban is not recommended as the preferred route to use for high abnormal load transportation.
| 15.5.2.2 | Port of Richards Bay, South Africa |
The Port of Richards Bay is located approximately 160 km northeast of Durban and 465 km south of Maputo on the eastern seaboard of South Africa. The port has excellent road connections to the north and south, as well as to inland regions in the west.
The Port of Richards Bay is South Africa’s leading port in terms of cargo volumes handled. It is also the biggest port in size, covering an area of approximately 3,773 ha, a large portion of which is still available for further expansion.
The Port of Richards Bay is considerably less congested than the Port of Durban and has more abnormal load facilities.
| 15.5.2.3 | Port of Beira, Mozambique |
The Port of Beira, located strategically in the centre of the country, links directly, by road or by rail, the main markets of the Southern African hinterland (Zimbabwe, Botswana, Malawi, Zambia and the Democratic Republic of the Congo) to the marketing and routes of international trade.
The facilities include a 645 m long quay with a depth of 12 m. The terminal has four container gantry cranes, two of which have the capacity to carry 65 t.
The terminal can store more than 10,000 TEUs (twenty-foot equivalent units) and has 148 electricity connection points for refrigerated containers. Currently, the terminal can handle 300,000 TEUs a year.
| S-K 1300 Technical Report Summary on the Songwe Hill REE Project | Page 327 of 489 |
| |
| 15.5.2.4 | Port of Nacala, Mozambique |
The Port of Nacala, also called the Nacala Port Complex, is a Mozambican port located in the cities of Nacala and Nacala-a-Velha. It is the deepest port in Southern Africa. The natural deep harbour serves northern areas of Mozambique, as well as the landlocked Malawi with a 931 km (578 mi) railway. A railway extension also serves parts of Zambia, in particular the inland Port of Chipata.
The infrastructure belongs to the Mozambican government, which is responsible for its administration through the public-private joint venture company “Integrated Northern Logistical Corridor Society” (CLIN). CLIN was created to administer licences for cargo terminals in addition to passenger terminals.
There are four general cargo berths and one container berth.
| 15.5.3 | Summary of Findings |
There are no insurmountable height restrictions on the proposed routes that would preclude the use of the proposed routes for abnormal load travel for the proposed combinations.
In all the countries, electricity and telecommunications clearances will need to be obtained as there are numerous overhead electrical and telephone cables along the route (predominantly in Zimbabwe/Mozambique and Malawi) that will need to be raised to accommodate the passage of the loads. This is likely to require that the electricity and telecommunications authorities in all the countries arrange for personnel to travel ahead of the loads to physically lift the overhead lines.
The proposed lengths/widths/weights of the abnormal load combinations do not present any problems or limitations on any of the proposed routes.
| 15.5.4 | Consultants’ Recommendations |
The most probable route was identified as travelling through South Africa, Zimbabwe, Mozambique and into Malawi to the final destination of the Mkango Mine near Songwe Hill.
At the route clearance stage (one month prior to the physical travel of the loads), the Abnormal Vehicle Permits will have to be obtained.
The co-ordination of overhead line lifting capabilities for electricity and telephone cables will need to be arranged in each country.
It may be possible (by prior arrangement with the authorities in each country) for the abnormal load transporter to carry out the lifting of these overhead lines themselves. To do so, the abnormal load escort vehicle will need to travel ahead of the combinations with a 6.40 m height pole mounted to the vehicle and equipped with 6.50 m to 7.00 m insulated lifting poles to raise lines where required.
| S-K 1300 Technical Report Summary on the Songwe Hill REE Project | Page 328 of 489 |
| |
It is emphasised that permission to perform the latter must be sought from the authorities in each country who are the custodians of the infrastructure and who, in many cases, insist on carrying out such activities themselves to ensure that no damage is done.
The removal/replacement of overhead portal signs will also be arranged (usually by the Route Clearance Consultant providing the route to be travelled) at the route clearance stage prior to the physical travel of the abnormal load combination(s).
Listing the constraints of each of the routes may have been a somewhat superfluous exercise at this juncture. However, this logistics study has been produced to identify whether or not there are any insurmountable obstructions that would hinder the passage of the proposed abnormal loads, and there are not.
Certainly, when carrying out an updated inspection of the route prior to the passage of the loads (route clearance stage), any limitations that may have arisen since the production of this report will be identified and listed as part of the Route Clearance Report.
| 15.5.5 | Charter Aircraft and Airfreight |
In the event that the Project programme requires chartering an aircraft to swiftly transport goods into the country, the aircraft can be deployed into Chileka International Airport in Blantyre. These costs would have to be negotiated at the time of shipment.
The landing runway at Chileka International Airport has the following specifications:
| ● | Runway: | 7,628 ft (2,325 m) |
| ● | Elevation: | 2,555 ft (778 m) |
| ● | Surface: | Asphalt |
The landing runway, therefore, meets the landing runway distances required for the types of airplanes and specified payloads stated in Table 15.16.
Table 15.16: Typical Planes and Payloads
| Aircraft | Maximum Payload |
Runway Requirement |
Main Hold Size |
Main Door Size |
Volume |
| kg | m | cm (l × w ×h) | cm (w × h) | m³ | |
| Ilyushin IL-76 TF | 60,000 | 1,800 | 3,114 × 345 × 325 | 345 × 325 | 400 |
| Ilyushin IL-62 | 40,000 | 3,150 | 2,798 × 317 × 212 | 345 × 200 | 230 |
Cargo can also be airfreighted to Blantyre on scheduled daily flights, provided that the cargo weighs less than 3 t and its dimensions are less than 3.0 m (length), 2.0 m (width) and 1.50 m (height).
| S-K 1300 Technical Report Summary on the Songwe Hill REE Project | Page 329 of 489 |
| |
| 15.5.6 | Project Cargo |
Table 15.17 provides a summary of the Project cargo, outlining the number of trucks estimated to be required to transport the cargo to site.
Table 15.17: Number of Trucks
| Description | Number of Trucks |
| Structural Steelwork | 90 |
| Plate Work (Chutes etc.) | 26 |
| Plate Work (Tanks) | 41 |
| Mechanical | 94 |
| Piping and Valves | 73 |
| Electrical | 42 |
| Control and Instrumentation (C&I) | 7 |
| Civil and Earthworks | 40 |
| Water and Sewage Treatment Plants | 12 |
| Infrastructure | 28 |
| Spares | 11 |
| Contingency | 46 |
| Abnormal Loads – Ball Mill and Other Break Bulk Items | 18 |
| TOTAL | 528 |
| 15.6 | QP Opinion |
The infrastructure design is appropriate for the DFS level and supports the planned operations. The planned supporting Project infrastructure, sources and prices of logistics, power, and water are well understood and have been interpreted from reliable studies and evaluations.
It is the opinion of SENET, responsible and acting as the QP for the Songwe Hill Project infrastructure, that the level of assessment and design are appropriate for a DFS and represent good industry practice.
| S-K 1300 Technical Report Summary on the Songwe Hill REE Project | Page 330 of 489 |
| |
| 16 | Market Studies |
The information in this section has been compiled by Adamas Intelligence Inc. (Adamas), an independent research and advisory firm contracted by Mkango to forecast long-term supply, demand and prices for REEs as well as emerging trends in the market.
| 16.1 | Rare Earth Market Outlook |
| 16.1.1 | REEs: Critical Enablers of Electric Mobility, Automation and Energy Efficiency |
Compared to similarly abundant elements in nature, such as copper, lead, and tin, global annual production of rare earth elements is notably low.
Nevertheless, rare earth elements have become critical enablers of technologies at the heart of clean energy initiatives worldwide, as well as ubiquitous gadgetry and electronics that have pervaded modern society.
Rare earth elements are used in small, but often necessary, amounts in hundreds of different technologies, materials, and chemicals worldwide for commercial, industrial, social, medical, and environmental applications.
In just a period of decades, rare earth elements have seeped deeply into the fabric of modern technology and industry and have proven exceptionally challenging to duplicate or replace.
| 16.1.2 | Classification and Terminology |
On the Periodic Table of Elements, rare earth elements include the lanthanide series, plus yttrium and sometimes scandium (see Figure 16.1).
Yttrium is classified as a rare earth element because of its similar ionic radius and chemical properties to the lanthanides, resulting in its strong affinity for concentrating with the REEs in the same minerals. Although similar in nature, scandium often concentrates in a wider array of minerals without the REEs and therefore is not as commonly associated.
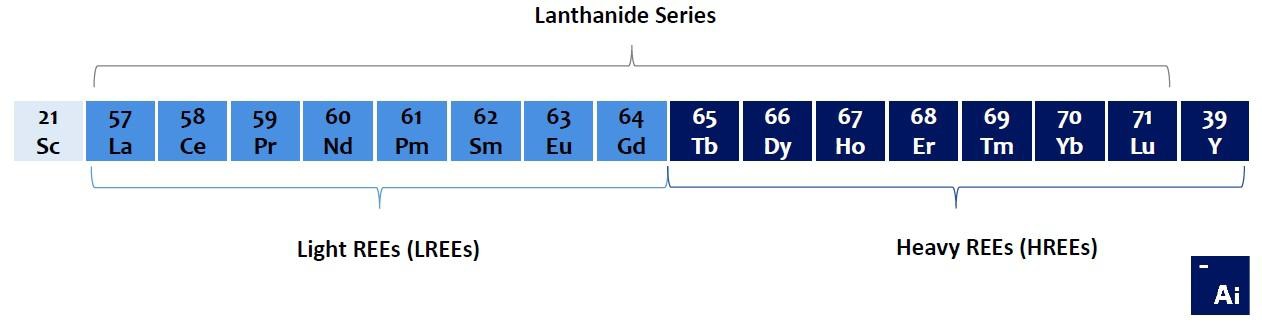
Figure 16.1: Rare earth elements include the lanthanide series plus yttrium and sometimes scandium
Rare earth elements are arbitrarily classified as light rare earth elements or oxides (“LREEs” or “LREOs”) or heavy rare earth elements or oxides (“HREEs” or “HREOs”) based on their electron configurations.
By virtue of having a higher crustal abundance, LREOs collectively make up over 90 % of the total rare earth oxide (TREO) content in a typical rare earth deposit and thereby also make up the vast majority of the world’s TREO output each year. Heavy rare earth oxides, on the other hand, are present in the Earth’s crust in substantially lower concentrations than LREOs and as such make up a relatively small portion of the world’s TREO output each year.
| S-K 1300 Technical Report Summary on the Songwe Hill REE Project | Page 331 of 489 |
| |
| 16.1.3 | Rarely Enriched in Nature |
Despite the misleading moniker, rare earth elements are not remarkably rare in nature, but rather are rarely concentrated into economically significant amounts for extraction and processing owing to certain physical and chemical characteristics that promote their broad dispersion in most rock types.
In fact, cerium is more abundant in the Earth’s crust than copper; neodymium, lanthanum, and yttrium are more abundant than lead; and praseodymium, samarium, and gadolinium are more abundant than tin (see Figure 16.2 – LHS).
Despite this fact, there were only 367,400 tonnes of all REOs combined (TREO) – lanthanides plus yttrium – produced globally in 2024 versus 23.0 million tonnes of copper, 4.3 million tonnes of lead and 300,000 tonnes of tin in the same year (see Figure 16.2 – RHS).
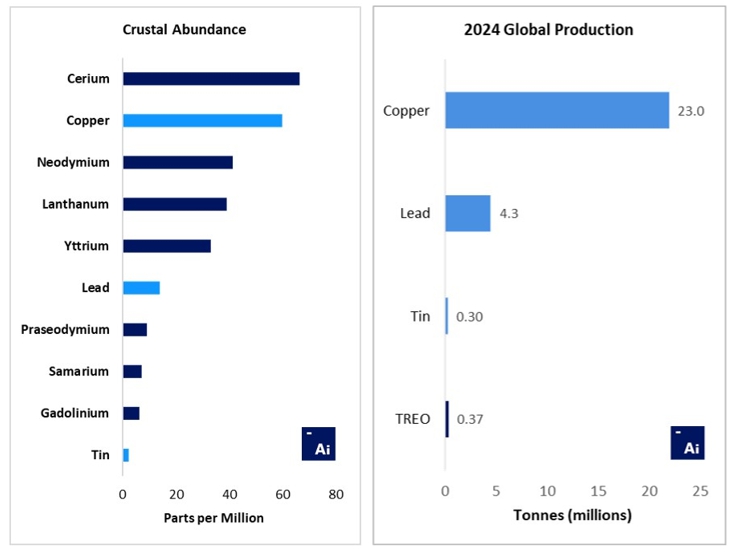
Source: Adamas Intelligence research, USGS, Jefferson Lab
Figure 16.2: Global production of REEs is remarkably low compared to similarly abundant elements
| S-K 1300 Technical Report Summary on the Songwe Hill REE Project | Page 332 of 489 |
| |
| 16.1.4 | Historical Production |
From 2020 through 2024, Adamas data indicates that global mine production of rare earth oxides (TREO) increased at a CAGR of 13.3 %, from 223,000 tonnes to 367,000 tonnes, with China responsible for 63 % to 70 % of output each year
Other notable mine producers in recent years have included Australia, the US, and Myanmar, albeit their combined share of global supply has fallen from 32 % in 2020 to 21 % in 2024, outpaced by China’s production growth.
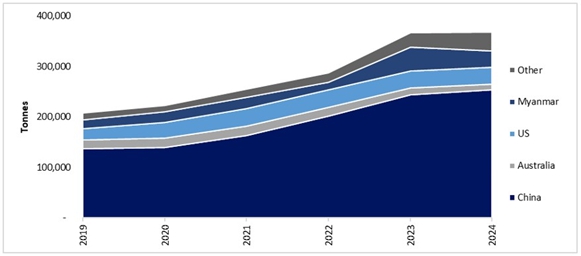
Figure 16.3: Historical global TREO mine production by country
Since the early 2000s, China has leveraged its dominance of upstream production to cement control over all downstream value adding steps along the mine-to-magnet supply chain.
As of 2024, China was responsible for 65 % of global mine production of magnet rare earths and over 90 % of each subsequent step, making it the world’s dominant producer of refined rare earth oxides, metals and alloys, magnetic alloys, and NdFeB permanent magnets.
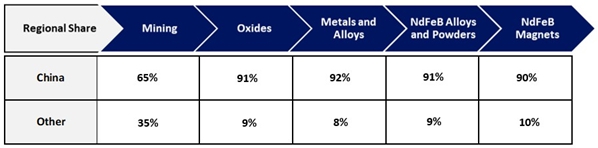
Figure 16.4: Overview of the global mine to magnet value chain in 2024, led by China at every step
| S-K 1300 Technical Report Summary on the Songwe Hill REE Project | Page 333 of 489 |
| |
| 16.1.5 | Eight End-Use Categories |
Rare earth elements are used in hundreds of unique end-uses and applications that collectively fall into one of eight end-use categories: 1.) Battery Alloys, 2.) Catalysts, 3.) Ceramics, Pigments and Glazes, 4.) Glass Polishing Powders and Additives, 5.) Metallurgy and Alloys, 6.) Permanent Magnets, 7.) Phosphors, and 8.) Other End-Uses and Applications (see Figure 16.5).
| End-Use Category | Description |  |
| Battery Alloys (La, Ce, Pr, Nd) |
Rare earth elements are used to produce anode materials for nickel-metal hydride (NiMH) batteries. NiMH batteries are used in hybrid electric vehicles, consumer electronics, cordless shavers, cordless power tools, baby monitors and other applications of rechargeable batteries. | |
| Catalysts (La, Ce) |
Rare earth elements, such as cerium and lanthanum, are used in catalytic converters of gasoline- and diesel-powered vehicles, as well as fuel cracking catalysts and additives used by oil refiners to break down crude oil into lighter distillates, such as gasoline, diesel, kerosene, and more. | |
| Ceramics, Pigments and Glazes (La, Ce, Pr, Nd, Y) |
Rare earth elements are used to produce decorative ceramics, functional ceramics, structural ceramics, bio ceramics and many other types of ceramics used in everything from jet engine coatings to ceramic cutting tools, dental crowns, ceramic capacitors, ceramic tiles, and more. | |
| Glass Polishing Powders and Additives (Ce, La, Er, Gd, Y) |
Rare earth elements, such as cerium, are used to polish optical glass, hard disk drive platters, LCD display screens and gemstones, among a long list of applications. Cerium is also used as an additive in UV-filtering glass and container glass, whereas lanthanum, yttrium, and gadolinium are used to produce high quality optical glass used in camera lenses, microscopes, and telescopes. | |
| Metallurgy and Alloys (La, Ce, Ho, Gd, Y) |
Rare earth mischmetal (a mixture of light REE metals) is used during production of some types of steel, as well as ductile iron making. Rare earth elements are also used to produce a variety of different alloys, such as ferro-cerium, ferro-holmium, ferro-gadolinium, and a growing list of others. | |
| Permanent Magnets (Nd, Pr, Dy, Tb, Sm) |
Rare earth elements are used to produce high-strength permanent magnets that have enabled the production of ubiquitous gadgets and electronics, such as mobile phones and laptops, as well as power dense energy-efficient electric motors and generators used in electric vehicles, wind turbines, energy efficient appliances, and hundreds of other applications. | |
| Phosphors (Ce, La, Y, Tb, Eu) |
Rare earth elements are used in phosphors for energy efficient lamps, display screens and avionics, and are added to fiat currency in some nations as an anti-counterfeit measure. | |
| Other (La, Ce, Nd, Dy, Tb, Gd, Lu, Tm) |
Aside from the above-described end uses and categories, rare earth elements are used in a long list of other end uses and applications, including many in defence, medicine, health, wellness, aerospace, agriculture, high-tech, and chemical industries. | |
Figure 16.5: Rare earth applications and end-uses fall into one of eight end-use categories
| S-K 1300 Technical Report Summary on the Songwe Hill REE Project | Page 334 of 489 |
| |
| 16.1.6 | Global Rare Earth Consumption in 2024 |
By volume, permanent magnets and catalysts were collectively responsible for 70 % of global TREO consumption in 2024 (see Figure 16.6). However, by value, permanent magnets alone were again responsible for over 95 % of the total value of global TREO consumption last year (see Figure 16.6) and this share continues to expand further as demand for (and prices of) neodymium, praseodymium, didymium, dysprosium, and terbium continue to outperform.
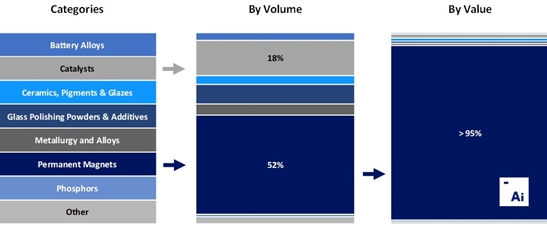
Figure 16.6: Permanent magnets and catalysts are the largest rare earth demand drivers
Not only does demand for neodymium, praseodymium, didymium, dysprosium, and terbium collectively make up the majority of global value today, but in the years ahead demand for these four rare earth elements will continue to grow faster than demand for all other rare earth elements, challenging the ability of the supply-side to keep up.
As shown in Figure 16.7, Adamas forecasts that global annual demand for didymium (NdPr) oxide and dysprosium oxide will increasingly exceed global annual production post-2030, leading to the depletion of historically accumulated inventories and, ultimately, shortages of these critical magnet materials if substantial additional sources of supply are not developed.
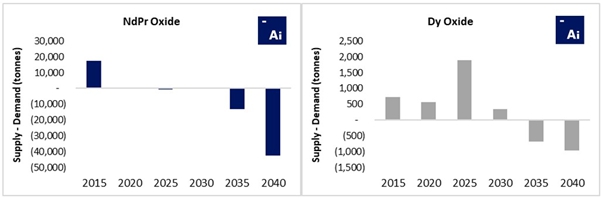
Note: Didymium Oxide = NdPr Oxide = Oxide compound of 75 % Nd2O3 and 25 % Pr6O11; NdPr is the main rare earth input material for NdFeB magnet production. Only minor quantities of individual Nd oxide and Pr oxide are produced globally each year
Figure 16.7: The supply-side will struggle to keep up with rising demand for magnet rare earths
| S-K 1300 Technical Report Summary on the Songwe Hill REE Project | Page 335 of 489 |
| |
| 16.1.7 | Rare Earth Balance Problem |
Over the past decade, rare earth producers globally have sacrificially overproduced certain low value rare earth elements, such as cerium (see Figure 16.8 – LHS), to keep up with rapidly growing demand for other high value rare earth elements and compounds, such as didymium (see Figure 16.8 – RHS).
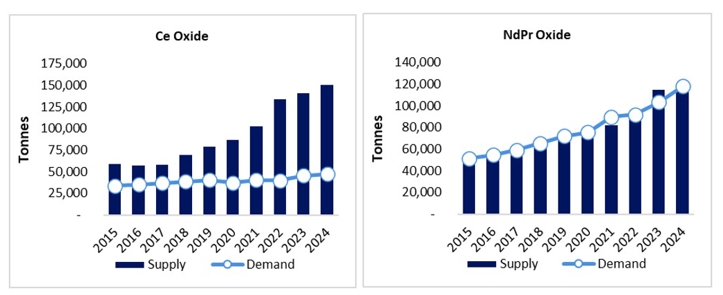
Figure 16.8: Sacrificial over-production of cerium oxide to satisfy rapidly growing demand for didymium oxide
Looking ahead, Adamas forecasts that steadily increasing demand for rare earth permanent magnets will drive global demand for didymium oxide (or oxide equivalent) to new heights (see Figure 16.9– RHS), exacerbating the imbalance between production and demand of other rare earth elements, such as cerium oxide (see Figure 16.9 – LHS) if the industry continues on a path of business-as-usual.
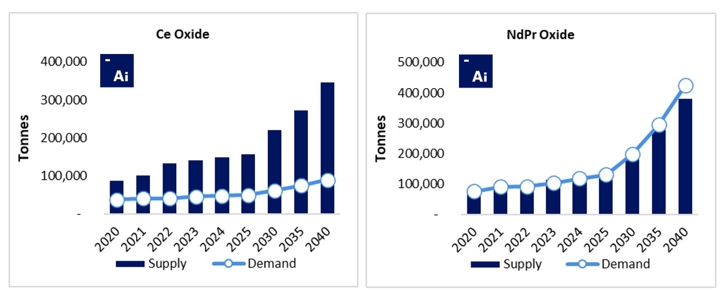
Figure 16.9: Strong future demand growth for permanent magnets will exacerbate the balance problem
| S-K 1300 Technical Report Summary on the Songwe Hill REE Project | Page 336 of 489 |
| |
| 16.1.8 | Implications of the Balance Problem |
Unless new end-uses and applications are developed for lanthanum, yttrium, and other sacrificially-overproduced rare earth elements in the near-term (see Figure 16.10), Adamas forecasts that prices of high-demand elements and compounds, like didymium, neodymium, praseodymium, dysprosium, and terbium will stay relatively strong and/or rise accordingly (see Figure 16.10) to compensate for losses that producers are chronically incurring by necessarily over-producing the other unsaleable, surplus rare earths.
The industries that will feel these price increases the most in the coming years are those reliant on use of high-strength NdFeB permanent magnets, such as the automotive industry, the wind power sector, the robotics industry, the defence industry, and many others.
Ultimately, Adamas expects that price increases of magnet input materials may upend the economics of using rare earths in some end-use sectors – pushing some manufacturers to adopt alternatives to rare earth permanent magnets where possible.
However, for the most promising of end-use sectors – such as electric vehicles, robotics, advanced air mobility, defence, and others – the economics of using rare earth elements are robust and Adamas expects these segments will continue to fuel strong rare earth demand growth into the foreseeable future.
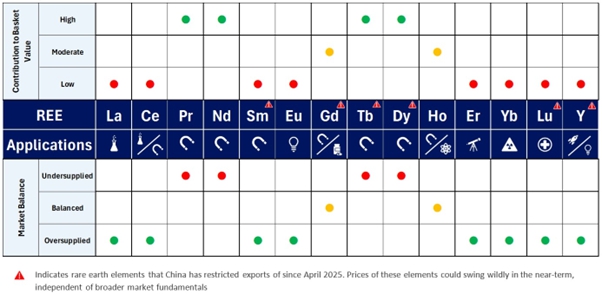
Figure 16.10: Prices of magnet rare earths will rise to compensate for losses incurred on other rare earths
| 16.1.9 | Forecasted TREO Demand by End-Use Category |
After rising 9.4 % last year, Adamas forecasts that global TREO demand will increase at a CAGR of 6.1 % going forward, from 234,000 tonnes in 2024 to 607,000 tonnes in 2040, driven primarily by the permanent magnet sector (see Figure 16.11).
| S-K 1300 Technical Report Summary on the Songwe Hill REE Project | Page 337 of 489 |
| |
In the years ahead, global TREO demand for permanent magnets is projected to rise at a market leading CAGR of 8.5 %, driven by double-digit demand growth for applications involving electric mobility, robotics, advanced air mobility and more (see Figure 16.11).
Conversely, over the forecast period, global TREO demand for all other end-use categories, except for phosphors, are projected to grow at market lagging CAGRs of 0 % to 6 %, while TREO demand for phosphors is projected to fall at a CAGR of -5.7 % (see Figure 16.11).
In the years ahead, the rapid TREO demand growth expected for permanent magnets will lead the end-use category to continuously absorb market share from incumbent categories.
By 2035, Adamas projects that permanent magnets will drive 66 % of global TREO demand by volume and over 95 % of the market’s value each year.
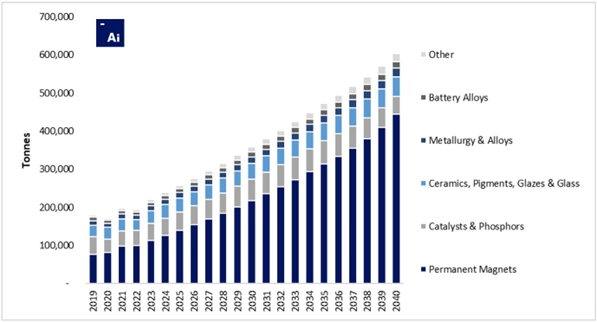
Figure 16.11:
Historical global consumption and forecasted demand for TREO
by end-use category
| 16.1.10 | NdFeB Permanent Magnets: Enablers of Modern Technology |
| 16.1.10.1 | What is NdFeB? |
Neodymium-iron-boron (NdFeB) is a permanent magnet alloy that was developed and commercialised in the 1980s as an alternative to costly samarium-cobalt (SmCo) alloy that was developed and commercialised three decades earlier.
| 16.1.10.2 | What is it made of? |
As the name suggests, NdFeB alloy is comprised primarily of neodymium, iron, and boron in a Nd2Fe14B tetragonal crystalline structure, and often contains lesser concentrations of praseodymium (combined with neodymium in the form of didymium), dysprosium, terbium, cerium, gadolinium, holmium, copper, cobalt, niobium, and other metals to optimise the alloy’s properties for certain applications.
| S-K 1300 Technical Report Summary on the Songwe Hill REE Project | Page 338 of 489 |
| |
| 16.1.10.3 | Why is it special? |
NdFeB permanent magnet alloy is the strongest type of permanent magnet material commercially available today in terms of maximum energy product (i.e. magnetic flux output per unit volume, measured in megagauss-oersteds (MGOe) or joules per cubic metre (J/m3)) (see Figure 16.12).
As such, NdFeB magnets have largely supplanted SmCo, AlNiCo, and ferrite magnets in many size- and weight-sensitive applications since the 1980s, and simultaneously have enabled the conception and miniaturisation of a wide array of ubiquitous gadgets and electronics that have pervaded modern society.
NdFeB permanent magnets are used in hundreds of different end-uses and applications – many of which we interact with daily, whether we realise it or not. From mobile phone loudspeakers and vibration motors to hard disk drives, optical disc drives, electric vehicle traction motors, automotive micromotors, wind power generators, and beyond – NdFeB permanent magnets are literally all around us.
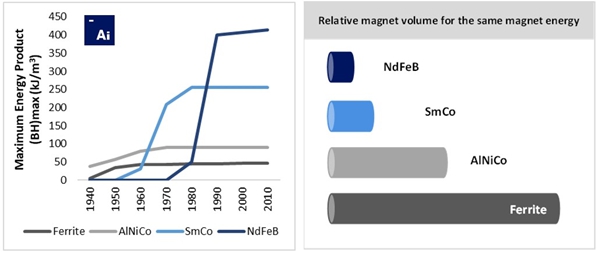
Source: After Kallaste et al. (2012), Adamas Intelligence research
Figure 16.12: NdFeB is the strongest permanent magnet material commercially available today
| 16.1.11 | Forecasted TREO Demand for Permanent Magnets by End-Use Category |
After an estimated 14.4 % increase in 2024, Adamas forecasts that global TREO demand for permanent magnets will rise at a CAGR of 8.5 % going forward, from 121,000 tonnes in 2024 to 447,000 tonnes in 2040, boosted by strong demand growth from electric vehicles, robotics, advanced air mobility, and other applications of NdFeB magnets (see Figure 16.13).
| S-K 1300 Technical Report Summary on the Songwe Hill REE Project | Page 339 of 489 |
| |
Specifically, from 2024 through 2040 Adamas forecasts that global TREO demand for passenger EV traction motors, commercial EV traction motors and “other e-mobility” applications will collectively increase at a CAGR of 8.9 %, together representing the single largest demand driver by 2040 (see Figure 16.13).
Similarly, from 2024 through 2040 Adamas forecasts that global TREO demand for industrial robots, consumer service robots and professional service robots will collectively increase at a CAGR of 25.4 %, poised to collectively overtake EV motors in the decade to follow (see Figure 16.13).
Moreover, from 2024 through 2040 Adamas projects that global TREO demand for applications involving advanced air mobility (AAM), including consumer drones, commercial drones, electric vertical take-off and landing (eVTOL) aircraft, and more, will increase at a CAGR of 16.1 % to become one of the largest end use categories by the end of the forecast period (see Figure 16.13).
Additionally, from 2024 through 2040 Adamas projects that global TREO demand for direct drive and hybrid direct drive wind power generators for onshore and offshore applications will rise at a CAGR of 8.2 % as the competitive economics of wind power generation (and low maintenance of hybrid and direct drive generators) continue to spur growing adoption (see Figure 16.13).
Lastly, from 2024 through 2040 Adamas forecasts that global TREO demand for all other end-uses and applications of NdFeB permanent magnets will increase at CAGRs of 3.5 % to 7.3 %, leading some sectors to forgo market share to electric vehicles, robotics and other high-growth applications (see Figure 16.13).
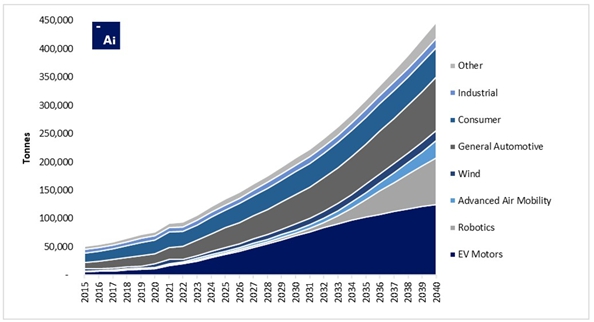
Figure 16.13: Historical global consumption and forecasted demand for magnet rare earth oxides by end-use category
| S-K 1300 Technical Report Summary on the Songwe Hill REE Project | Page 340 of 489 |
| |
| 16.1.12 | EVs, Robotics, AAM, and Energy Efficient Applications to Drive 76 % of Demand by 2040 |
By 2040, Adamas forecasts that electric vehicles, wind power generators, robotics, advanced air mobility and defence applications (see Figure 16.14 – dark blue bars) combined with automotive micromotors and sensors, industrial applications, consumer appliances, and magnetocaloric chillers (see Figure 16.14 – light blue bars) will collectively be responsible for 76 % of total global demand for NdFeB magnets and alloys, up from 61 % this year and just 53 % in 2020.
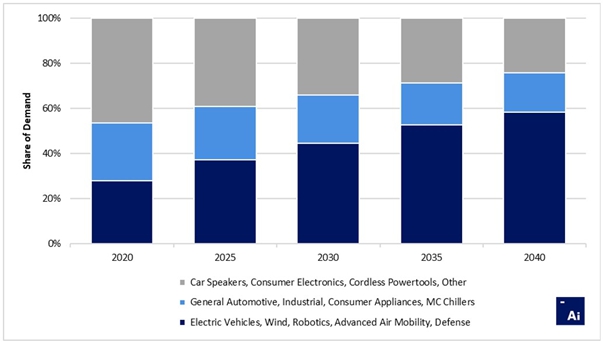
Figure 16.14: Forecasted share of global NdFeB demand driven by less price sensitive applications
Adamas believes this evolution is noteworthy as it implies that the future of magnet rare earths demand will be less sensitive to price than that of the past because future demand will be increasingly driven by the above-mentioned applications in which the use of rare earth permanent magnets imparts an economic benefit at the system level.
Be it through battery cost thrifting in an electric vehicle, maintenance cost savings in a wind farm or robot fleet, or electricity cost savings in an industrial facility, grocery store or hotel, the economic upsides enabled by using technologies based on rare earth permanent magnets often allow for a significant rise in magnet rare earth prices going forward before it would be economically justifiable to switch to a REE-free alternative.
As such – Adamas expects that the future of rare earths demand (at least in the case of didymium, dysprosium, and terbium) will be more robust, more resilient and less sensitive to price than demand of the past and present, which is still largely driven by price sensitive consumer and legacy automotive applications.
| 16.1.13 | Forecasted Production – Demand Balance for NdPr Oxide to 2040 |
From 2025 through 2029, we forecast that didymium oxide will experience persistent structural deficits as the supply side of the industry struggles to keep up with rapidly growing demand for NdFeB magnets for EV traction motors, wind power generators, industrial applications, consumer applications, robotics, advanced air mobility applications, and more.
| S-K 1300 Technical Report Summary on the Songwe Hill REE Project | Page 341 of 489 |
| |
By the end of the decade, with existing producers increasing output and 22 “highly probable”, “probable” and “possible” new producers coming online, including MKAR, we forecast that global didymium oxide production will moderately exceed global demand from 2030 through 2034 before flipping back to a structural deficit and rising shortages from 2035 through 2040 (see Figure 16.15).
Overall, for the global market to effectively balance production and demand from 2035 through 2040 will require the gradual addition of another 200,000 to 300,000 tonnes-per-annum of LREO-rich production by the end of the forecast period, over-and-above the production growth we are already forecasting.
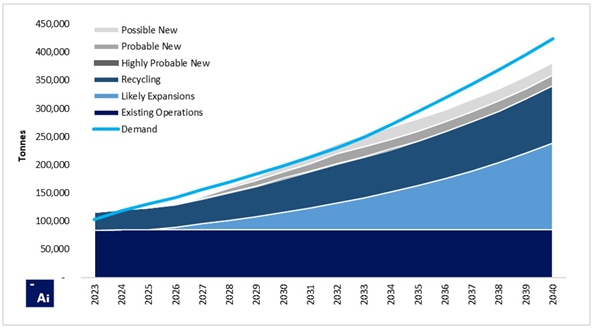
* Production from MKAR included in forecasted supply.
* Production from highly probable, probable and possible producers is not probability weighted.
Figure 16.15:
Forecasted production – demand balance for NdPr oxide to 2040
(Base Case)
| 16.1.14 | Forecasted REO Prices to 2040 |
As per its latest “Rare Earth Pricing Quarterly Outlook” report (Q4 2025), Adamas forecasted annual average prices for each rare earth oxide to 2040 under multiple scenarios.
| 16.1.14.1 | Base Case |
In the Base Case, Adamas expects the price of NdPr oxide to increase from US$55-60/kg last year to US$70-110/kg in the late-2020s. In a rational market, Adamas would expect these price increases to induce investment in new production capacity, however, owing to the long lead times to develop new rare earth supplies, Adamas sees potential for pervasive deficits to push prices above required inducement levels (estimated at US$100-150/kg) in the long term.
| S-K 1300 Technical Report Summary on the Songwe Hill REE Project | Page 342 of 489 |
| |
| 16.1.14.2 | Upside |
In the Upside forecast scenario, Adamas considered a future in which a strong, steady price environment induces the development of an additional 14 new producers (over and above the 18 already expected in the Base Case) from various corners of the globe.
Adamas believes the enhanced supply-side diversity, transparency, and lack of price volatility/swings would help assuage demand-side risk aversion, fostering a more robust demand outlook and higher prices than considered in the Base Case forecast scenario.
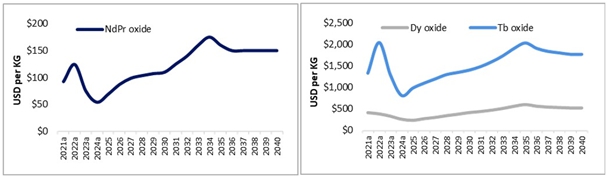
* Forecasted prices are in Real 2025 US dollars
Figure 16.16:
Forecasted magnet rare earth oxide prices to 2040
(Base Case – China FOB)
| 16.1.15 | Forecasted per-REO Contribution to Songwe Hill Project Basket Value |
Figure 16.17 below shows the relative distribution of rare earth oxides contained in mixed rare earth carbonate (MREC) that is anticipated to be produced from the Songwe Hill Project. By volume, the four critical magnet rare earth oxides (neodymium, praseodymium, dysprosium, and terbium) make up 34.0 % of the TREO contained in the MREC.
| Oxide | Relative % |  |
| La | 39.8 % | |
| Ce | 17.2 % | |
| Pr | 7.7 % | |
| Nd | 25.4 % | |
| Sm | 3.5 % | |
| Eu | 0.9 % | |
| Gd | 1.9 % | |
| Tb | 0.2 % | |
| Dy | 0.7 % | |
| Ho | 0.1 % | |
| Er | 0.2 % | |
| Tm | 0.0 % | |
| Yb | 0.1 % | |
| Lu | 0.0 % | |
| Y | 2.4 % | |
| TREO | 100.0 % |
Figure 16.17: Relative distribution of rare earth oxides in Songwe Hill Project product basket
| S-K 1300 Technical Report Summary on the Songwe Hill REE Project | Page 343 of 489 |
| |
Figure 16.18 below shows the forecasted per-REO contribution to the Songwe Hill MREC in 2030 based on Adamas’ Base Case scenario. By value, the four critical magnet rare earth oxides (neodymium, praseodymium, dysprosium, and terbium) are projected to drive 92.8 % of the Project’s basket value in 2030, a proportion that will go largely unchanged over the forecast period.
| Oxide | Relative % |  |
| La | 1.2 % | |
| Ce | 1.5 % | |
| Pr | 18.7 % | |
| Nd | 61.6 % | |
| Sm | 0.3 % | |
| Eu | 0.6 % | |
| Gd | 2.2 % | |
| Tb | 6.2 % | |
| Dy | 6.4 % | |
| Ho | 0.3 % | |
| Er | 0.3 % | |
| Tm | 0.0 % | |
| Yb | 0.0 % | |
| Lu | 0.0 % | |
| Y | 0.8 % | |
| TREO | 100.0 % |
Figure 16.18: Per-REO contribution to Songwe Hill Project basket value in 2030
| 16.1.16 | Forecasted Basket Value and Implications for Project |
Taking Adamas’ Base Case price forecasts into account, along with the relative distribution of rare earth oxides in Songwe Hill production (see Figure 16.17), the Project basket value (i.e. value of rare earth oxides contained in one kilogram of separated TREO produced from the Project) was projected for each year from 2025 through 2040, as shown in Figure 16.19 below.
In Adamas’ Base Case and Upside price forecast scenarios, the Songwe Hill Project basket value will increase overall from 2025 through 2040 at a CAGR of 5.2 % and 6.0 % respectively.

* Forecasted prices in Real 2025 dollars
Figure 16.19: Forecasted Songwe Hill basket value from 2025 through 2040
| S-K 1300 Technical Report Summary on the Songwe Hill REE Project | Page 344 of 489 |
| |
In all scenarios examined, Adamas projects that critical magnet rare earth oxides (i.e. neodymium, praseodymium, dysprosium, and terbium) will collectively drive over 93 % of the Songwe Hill Project basket value on average each year from 2025 through 2040 (see Figure 16.20).
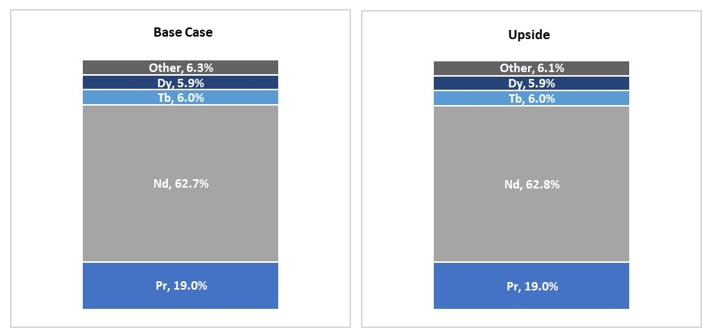
Figure 16.20: Contribution of magnet rare earth oxides to the Songwe Hill basket value in each scenario
| 16.1.17 | Forecasted Value of Songwe Hill Mixed Rare Earth Carbonate |
In Adamas’ view, the MREC that MKAR plans to produce from Songwe Hill would be amenable and desirable for downstream processing into refined rare earth oxides.
Since the MREC is highly depleted of low value cerium (Ce), which typically comprises around 40-50 % of the rare earth contents in a standard MREC, a prospective processor of Songwe Hill MREC, such as Mkango Polska, would not need to tie up capacity or expend costs on excessive Ce, making the MREC a premium product in Adamas’ view.
Inferring from the price of comparable mixed rare earth chemical concentrates sold in China along with the specific composition and purity of Songwe Hill MREC, Adamas believes MKAR could expect to receive a price for its MREC equal to 75 % of the rare earth oxide value it contains.
| S-K 1300 Technical Report Summary on the Songwe Hill REE Project | Page 345 of 489 |
| |
In its Base Case price forecast scenario, Adamas projects that the value of Songwe Hill MREC will amount to US$11.72 per kilogram in 2025 and will increase to US$28.71 per kilogram in 2034 then decline gradually to US$24.97 per kilogram by 2040, led by comparable movements in magnet rare earth prices.
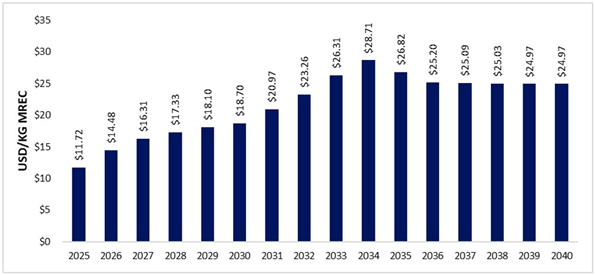
* Prices in USD per kilogram of MREC; MREC contains 55.0 weight % TREO
* Value based on forecasted China export (FOB) prices
* Forecast in Real 2025 dollars
Figure 16.21: Forecasted value of Songwe Hill MREC from 2025 through 2040
| 16.1.18 | International Supply Chain Development |
| 16.1.18.1 | A rare earth renaissance is underway in the West |
Over the past three years, strong rare earth magnet demand growth coupled with a wave of incoming rare earth oxide supply has helped de-risk the business case for downstream investments in metals, alloy and magnet production capacity, spurring public and private sectors into action.
More recently, China’s implementation of export controls on a suite of rare earth elements, including high-performance rare earth magnets, in April 2025, has further galvanised the resolve of governments and end users alike to support the expedited development of alternative supply chains connecting the Americas, Europe, Australia, Africa and beyond.
These developments, and others yet to come, are a testament to the upstream market’s rising diversity and supply security, coupled with the downstream market’s rapidly increasing demand for alternative supplies of NdFeB magnets.
According to Adamas Intelligence data, combined rare earth magnet production capacity in the U.S. and Europe is poised to increase 10-fold by 2030 as new factories are built and/or ramped up, necessitating comparable growth in rare earth oxide supplies.
| 16.1.18.2 | A year of unprecedented action and investment from governments |
China’s export restrictions on rare earth elements and magnets – implemented in April 2025 – have heightened the urgent need for diversified sources of rare earth and magnet supply, triggering a wave of investments, policies and international initiatives around the globe.
| S-K 1300 Technical Report Summary on the Songwe Hill REE Project | Page 346 of 489 |
| |
Governments have responded with substantial funding, strategic reserves, price supports and bilateral/multilateral partnerships to build resilient supply chains.
In the U.S., the Department of Energy and Department of War have committed hundreds of millions in grants, loans and equity stakes, including major public-private partnerships with producers like MP Materials to scale domestic mining, separation, and magnet production.
Across the Atlantic, the European Union is advancing its Critical Raw Materials Act (CRMA) with ambitious 2030 benchmarks for domestic extraction, processing and recycling, while accelerating implementation through the RESourceEU Action Plan. The plan introduces coordinated EU-level stockpiling, a permanent Raw Materials Platform for demand aggregation and joint purchasing, new calls for strategic projects, and enhanced financing mechanisms that will mobilise around €3 billion in EU and EIB funding over the next 12 months.
Canada is accelerating its Critical Minerals Strategy through multibillion-dollar investments and alliances aimed at unlocking billions in projects.
Japan is pursuing deep-sea mining trials, recycling innovations, and new frameworks for joint investment.
Full diversification from China may take years, but these coordinated actions position allied nations to rapidly reduce vulnerabilities and secure supplies for advanced technologies, renewable energy and national security.
| 16.1.18.3 | Europe’s Critical Raw Materials Act |
In 2024, the European Union passed into law the Critical Raw Materials Act (CRMA), which aims to secure supplies of critical raw materials (CRMs), including rare earth elements, essential for electric mobility, renewables, defence, and other domestic industries.
The act aims to reduce single source dependency on external suppliers, particularly China, by boosting domestic extraction, processing and recycling.
Key goals of the CRMA include achieving 10 % local extraction, 40 % processing, and 25 % recycling of the EU’s annual CRM consumption by 2030.
The act streamlines permitting and provides financing access for “Strategic Projects”, of which the European Commission announced 47 domestic projects in March 2025 (including Mkango’s Puławy separation plant in Poland), and 13 foreign projects in June 2025 (including Mkango’s Songwe Hill Project in Malawi).
Ultimately, Europe’s CRMA bodes well for rare earth projects in and around Europe as it aims to secure supplies, enhance resilience and support the demands of strategically important downstream industries.
| S-K 1300 Technical Report Summary on the Songwe Hill REE Project | Page 347 of 489 |
| |
| 16.1.19 | Current State of the Market and Near-Term Outlook |
| 16.1.19.1 | China’s export restrictions are wreaking havoc on supply chains |
In April 2025, China announced the implementation of export controls on a variety of rare earth materials, including so-called medium and heavy rare earths, as well as high-performance permanent magnets (e.g. NdFeB) containing dysprosium and/or terbium.
While aimed at the global export market broadly, the restrictions came in response to sweeping tariffs by the U.S. and are aimed at cutting off supplies of rare earths critical for defence and dual-use applications that could be used against China’s own interests.
The new control measures are not an outright ban on exports. Rather, they require that suppliers in China first apply for an export licence before fulfilling foreign purchase orders, allowing Beijing to halt supplies to specific companies, industries or regions with surgical precision.
In practice, the application, review and approval (or denial) process should take approximately two calendar months to complete; however, prolonged delays, additional verifications and export denials have left thousands of end users across industries (automotive, robotics, industrial, defence, etc.) worldwide with reduced and uncertain access to rare earth materials.
In October 2025, China announced an expansion of these export control measures to include a wider array of rare earth materials as well as technologies used to produce them.
Following U.S. – China negotiations in the weeks that followed, China agreed to delay the imposition of these expanded measures for one year, however, the restrictions from April remain in place.
| 16.1.19.2 | Myanmar’s supplies remain volatile and uncertain |
In recent years, Myanmar has become an indispensable supplier of heavy rare earth concentrate to China’s processors and magnet makers. However, with a coup underway in the nation since 2021, flows from Myanmar to China have been volatile and their sustainability uncertain.
In late-2024, resistance forces captured the largest rare earth mining centre in Myanmar from the military government leading to the shutdown of most mining operations in Kachin State and a steep drop in exports from Myanmar to China.
With Myanmar responsible for upwards of 50 % of global heavy rare earth mine production each year (all of which is processed in China), prolonged shutdowns could significantly disrupt China’s supply of these critical elements in the near-term and consequently supplies to end users around the world.
| 16.1.19.3 | The U.S. has halted concentrate exports to China |
Similarly, in recent years, the U.S. has become a leading supplier of light rare earth concentrate to China’s processors and magnet makers. However, with China imposing import tariffs on goods from the U.S. earlier this year, MP Materials, owner of the Mountain Pass mine in California, announced in April it was halting exports to China while accelerating development of its downstream operations.
| S-K 1300 Technical Report Summary on the Songwe Hill REE Project | Page 348 of 489 |
| |
| 16.1.19.4 | U.S. government established a rare earth price floor |
In July 2025, the U.S. Department of War (DoW) announced a landmark public private partnership with MP Materials, owner of the Mountain Pass rare earth mine and co-located processing facility in California.
As per the partnership, MP Materials will construct a 7,000 tonne-per-annum NdFeB magnet factory in the U.S. from which the DoW will offtake 100 % of production to sustain its own needs plus a portion domestic industrial demand.
Notably, the agreement includes a price floor of US$110/kg of NdPr oxide, applied proportionately to all products the company produces, from rare earth concentrate to oxides to metals to magnets.
At the time of the announcement, the US$110/kg price floor was almost two-times higher than the price of NdPr oxide in China, albeit the price has since rallied over 40 % higher.
| 16.1.19.5 | U.S. to expand price support for additional projects, other regions likely to follow |
The U.S. administration has stated that it’s pursuing a pandemic-like approach to rapidly build up critical minerals supply chains and minimise reliance on China.
As part of this effort, U.S. officials have indicated that they will provide minimum price level guarantees for other additional rare earth projects and producers.
According to U.S. officials, the floor price extended to MP Materials was “not a one-off” and that other similar deals were being explored.
In August 2025, Australian Resources Minister Madeleine King stated that Australia was also considering setting price floors to support critical minerals projects, explicitly including rare earths. This was in the context of pledging A$1.2 billion for such initiatives, aiming to act as a buyer to provide price certainty and boost emerging projects.
Similarly, in August, Australian Ambassador to the U.S., Kevin Rudd, stated that discussions were underway with trade partners about delivering pricing certainty for critical minerals, including rare earths, on the global market.
| 16.1.20 | Adoption of Ex-China Price Floors Adds Potential for Additional Upside |
Should the U.S. expand its price supports to additional rare earth producers and other nations and regions, such as Australia and Europe, enact similar supports, there’s potential for significantly higher rare earth prices to prevail outside China in the near-term than currently projected.
Should a floor price of US$110/kg of NdPr oxide become the standard outside China in the near-term, the value of Songwe Hill MREC (see Figure 16.21) could surge to levels significantly above those expected in the Upside forecast scenario.
| S-K 1300 Technical Report Summary on the Songwe Hill REE Project | Page 349 of 489 |
| |
| 16.1.20.1 | Price of NdPr oxide rallying higher in China |
Following the announcement of the DoW – MP Materials price floor agreement and the U.S. administration’s intent to offer similar price support to other producers, the price of NdPr oxide in China rallied significantly higher.
From US$63/kg in early July, the price soared 41 % to US$88/kg in late August.
The price has since retreated modestly but remains markedly higher (i.e. US$83/kg as of December 1, 2025) than levels observed prior to the DoW’s landmark investment in the rare earths industry.
Currently, the average price of NdPr oxide is in line with the Adamas Base Case scenario but could trend towards the Upside scenario should current elevated price levels persist.
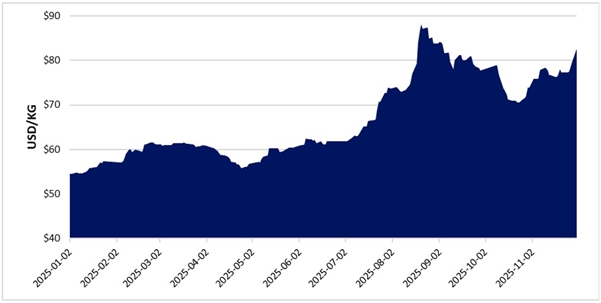
Figure 16.22: The price of NdPr oxide in China rallied 41 % following the U.S. establishment of a US$110/kg price floor
| 16.1.21 | Key Takeaways |
| ● | From 2024 through 2040, Adamas forecasts that global TREO demand for permanent magnets will rise at a CAGR of 8.5 %, boosted by strong demand growth from electric vehicles, robotics, advanced air mobility, and other applications of NdFeB magnets. |
| ● | Over the same period, Adamas forecasts that global production of neodymium, praseodymium, dysprosium, and terbium (the so-called magnet rare earths) will collectively increase at a slower CAGR of 7.4 % as the supply side of the market increasingly struggles to keep up with rapidly growing demand. |
| ● | Post-2025 Adamas forecasts that the global rare earth industry will consistently underproduce neodymium, praseodymium, dysprosium and terbium oxides (or oxide equivalents), resulting in the depletion of historically accumulated inventories and, ultimately, shortages of these critical magnet materials if supply is not increased beyond levels currently anticipated. |
| S-K 1300 Technical Report Summary on the Songwe Hill REE Project | Page 350 of 489 |
| |
| ● | The Songwe Hill Project offers a very high degree of economic exposure to the rare earth permanent magnet sector, which is the fastest-growing end-use category and most in need of additional rare earth supplies, according to Adamas. In all scenarios examined, Adamas projects that magnet rare earths will collectively drive over 93 % of the Songwe Hill product basket value each year from 2025 through 2040. |
| ● | In its Base Case scenario, Adamas forecasts that the product basket value of Songwe Hill TREO production will total US$28.40 per kilogram in 2025 and will increase to US$69.60 per kilogram in 2034 then decline gradually to US$60.53 per kilogram by 2040, led by comparable movements in magnet rare earth prices. |
| ● | Inferring from the price of comparable mixed rare earth chemical concentrates sold in China along with the specific composition and purity of Songwe Hill MREC, Adamas believes MKAR could expect to receive a price for its MREC equal to 75 % of the rare earth oxide value it contains. |
| ● | In its Base Case scenario, Adamas forecasts that the value of Songwe Hill MREC will amount to US$11.72 per kilogram of MREC in 2025 and will increase to US$28.71 per kilogram in 2034 then decline gradually to US$24.97 per kilogram by 2040, led by comparable movements in magnet rare earth prices. |
| ● | To reduce this high single source reliance, Europe must substantially increase rare earth permanent magnet production capacity in the years ahead and at the same time increase production of refined rare earth oxides to supply its magnet factories from a diverse, resilient base. |
| ● | Europe’s CRMA, which aims to boost domestic extraction, processing and recycling of rare earths, is a boon for projects in and around the region, offering streamlined permitting and access to financing. |
| 16.2 | QP OPINION |
This market overview and the estimates and forecasts contained therein are supported by comprehensive primary research and analyses conducted by Adamas Intelligence, a leading global provider of independent rare earth industry research since 2012.
In the opinion of Dahrouge Geological Consulting USA, responsible and acting as QP for Adamas Intelligence, the overview is presented at a level that is sufficient for a DFS and represents good industry practice.
| S-K 1300 Technical Report Summary on the Songwe Hill REE Project | Page 351 of 489 |
| |
| 17 | Environmental Studies, Permitting, and Plans, Negotiations, or Agreements with local Individuals or Groups |
Mkango appointed Digby Wells to undertake the Environmental, Social and Health Impact Assessment (ESHIA) process. The ESHIA process was undertaken with in-country partners ENVIROCONSULT. Digby Wells compiled the ESHIA for the Project as stipulated in Section 31 of the Environment Management Act, 2017 (Act No. 19 of 2017) (the EMA), as well as in accordance with the IFC Performance Standards (PSs) and Good International Industry Practice (GIIP). The ESHIA was submitted to the Malawi Environment Protection Authority (MEPA) in July 2022 for their review and comment prior to finalisation and submission for permitting. The ESHIA identified all the expected environmental and social impacts associated with the Project, including the prevention of pollution, treatment of waste, the safeguarding of natural resources, progressive reclamation and rehabilitation, and the minimising of the effects of mining activities. The ESHIA was approved by MEPA on 22 December 2022.
Environmental and social baseline studies have been conducted by Digby Wells in collaboration with a team of Malawian specialists associated with ENVIROCONSULT. These studies are aligned with the requirements of the Equator Principles, the IFC Performance Standards as well as specific requirements and interpretations of Malawian Legislation. Baseline conditions for various biophysical and social environmental aspects were determined, considering seasonal variation and input from various stakeholders. The sections below provide a summary of the biophysical and socio-economic baseline of the Project area.
It is the QP’s opinion that sufficient work on the environmental and social aspects has been conducted to adequately guide Project execution to the level required for a project of this nature and magnitude. No fatal flaws were found that would prevent the Project from proceeding provided the necessary mitigation measures are implemented. It is recommended that the baseline conditions be updated and taken into consideration during Project execution if substantial time elapses between the completion of the studies and the commencement of Project execution.
| 17.1 | Legal Framework |
The legal framework applicable to the Songwe Hill Project is set out in the sections below.
| 17.1.1 | Malawian Legislation |
| 17.1.1.1 | The Constitution of the Republic of Malawi |
Chapter 3 of the Constitution of the Republic of Malawi (1994)3 sets out fundamental principles and Section 13 seeks to promote the welfare and development of the people of Malawi by progressively adopting and implementing policies and legislations.
Regarding the environment, the Constitution states that the environment must be managed responsibly to achieve the following:
| (i) | Prevention of degradation of the environment |
| 3 | The Constitution of Malawi of 1994 with amendments through 2017. |
| S-K 1300 Technical Report Summary on the Songwe Hill REE Project | Page 352 of 489 |
| |
| (ii) | Provision of a healthy living and working environment for the people of Malawi |
| (iii) | Accordance of full recognition to the rights of future generations by means of environmental protection and the sustainable development of natural resources |
| (iv) | Conservation and enhancement of the biological diversity of Malawi |
The Private Sector Agreement document states that a Mining Development Agreement must be compiled for the Project. A Mining Development Agreement is a concession agreement which governs the relationship between the Government and a licence holder for the exploration of a certain area of land for minerals or for the mining of minerals in a certain area in exchange for royalties, taxes and other obligations. MKAR entered into the Mining Development Agreement with the Government of Malawi on 26 July 2024 (official signing date). 4
| 17.1.1.2 | Environmental Legislation |
| 17.1.1.2.1 | National Environmental Action Plan and Policy |
The National Environmental Policy (NEP) (1996), revised in 2004, is an overarching framework instrument that calls for the strengthening of institutional mechanisms, and the review and formulation of environmental legislation. The goal of this policy is to promote sustainable development through an efficient and sound management of the environment and natural resources.
The National Environmental Action Plan (NEAP) was prepared in 1994 in response to Agenda 21 that required signatories to the 1992 Rio Declaration on Environment and Development to prepare an action plan for integrating environmental issues into socio-economic development programmes. The NEAP was subsequently updated in 2004. The main objectives include the following:
| ● | Document and analyse all major environmental issues and measures to alleviate them. |
| ● | Promote sustainable use of natural resources in Malawi. |
| ● | Develop an Environmental Protection and Management Plan. |
| 17.1.1.2.2 | Environment Management Act and ESHIA |
The EMA, 2017, makes provision for the protection and management of the environment. Part VI of the Act addresses environmental management and ESHIAs.
Part VII of the Act sets out the environmental standards:
| ● | Air quality standards (Section 36) |
| ● | Water quality standards (Section 37) |
| ● | Standards for discharge of effluent into water (Section 38) |
| ● | Standards for control of obnoxious smells (Section 39) |
| ● | Standards for control of noise and vibration (Section 40) |
| ● | Soil quality standards (Section 41) |
| ● | Standards for minimisation of impact of ionising and other radiation (Section 42) |
| 4 | https://mkango.ca/site/assets/files/5002/29-07-24-final--mda-rns-v-final.pdf |
| S-K 1300 Technical Report Summary on the Songwe Hill REE Project | Page 353 of 489 |
| |
| ● | Other environmental quality standards (Section 43) |
| ● | Standards under other written law (Section 44) |
Other sections include the following:
| ● | Provisions for environmental monitoring, where the developer must compile an Environmental Management Plan, which will be used by the developer to manage the Project (Section 33) |
| ● | Provisions for the management, transportation, treatment and recycling, reduction, and the safe disposal of waste, and the prohibition of littering in public places (Section 56 (1)) |
| ● | Prohibition of persons from handling, storing, transporting, classifying, or destroying waste without the proper licence (Section 57 (1)) |
| ● | Provision for the exportation of hazardous waste under a permit (Section 58 (1)) |
| ● | Provision of guidelines for the management of toxic and hazardous substances (Section 59 (1)) |
| ● | Prohibition of the release of effluent into the environment without a licence (Section 61) |
| ● | Prohibition of the emission of gaseous substances or other pollutants that can cause air pollution (Section 62) |
| ● | Prohibition of noise emissions exceeding the established standards (Section 63) |
The Guidelines for ESHIAs as prescribed in the EMA, 2017, outline the basis for the ESHIA process in Malawi and provide a mechanism for integrating environmental and social development concerns. Through this process, sustainable development and improved living standards for Malawians can be achieved, and ecosystems as well as social and cultural values can be preserved.
| 17.1.1.2.3 | Atomic Energy Act |
The Atomic Energy Act, 2011 (Act No. 16 of 2011), supported by the Atomic Energy Regulations (2012), specifies the requirements for the protection of people against exposure to ionising radiation, the safety of radiation sources, waste management, and for the protection of the environment. The Act aims to prevent unlicensed access or damage to, and loss, theft or unlicensed transfer of, radioactive sources so as to reduce the likelihood of accidental harmful exposure to such sources. The Act requires the development, implementation and documentation of a radiation safety programme commensurate with the nature and extent of the risks associated with a Project.
| 17.1.1.3 | Mining Legislation |
The Mines and Minerals Act, 2019 (Act No. 8 of 2019) repealed the Mines and Minerals Act, 1981 (Act No. 1 of 1981) and made provision for the search for and mining of minerals, setting out the rules of engagement for players in the mining sector. This Act was in place when the various environmental and social studies were undertaken in support of the ESHIA and feasibility-related reports. The Mines and Minerals Act, 2023 (Act No. 25 of 2024) has subsequently been enacted.
| S-K 1300 Technical Report Summary on the Songwe Hill REE Project | Page 354 of 489 |
| |
Retention Licence RTL 0001/21 (the “Licence Area”) covers an area of 25 km2 and is one of 4 RTLs with a total area of ~100 km2. The block falls within the former EPL 0284/10 that had an area of 849.1 km2 and was originally granted to MKAR on 21 January 2010 with a three-year term. It was renewed successively for two-year periods until 20 January 2015, 19 January 2017, 21 January 2019, and 21 January 2021 by the Minister of Natural Resources, Energy and Mining under the Mines and Minerals Act, 2019. The EPL was then converted to an EL on 19 January 2021 to comply with the Mines and Minerals Act, 2019. A block of 11 RTLs was applied for and granted on 1 June 2021, and the Songwe Hill REE deposit falls within one of these licences, RTL 0001/21.
A legal opinion from Gustave and Company, dated 5 June 2026, confirms that MKAR is the registered and lawful holder of four Retention Licences (RTL0001/21, RTL0002/21, RTL0003/21 and RTL0007/21), issued on 1 June 2021 and will remain valid and will be maintained in good standing until the large scale mining licence approval process has been completed and the large scale mining licence formally issued. The licences are confirmed to be unencumbered, valid, in good standing, and enforceable in Malawi, with no disputes, filings, or outstanding obligations.
The RTL allows MKAR to explore for all 17 rare earths elements including yttrium, strontium, niobium, iron ore, manganese, gold, silver, copper, bauxite, fluorite, phosphate, uranium, thorium, monazite nepheline, syenite, zircon, tantalum, clay, kaolinite and associated minerals (the “Mineral Rights”). The RTL remains in good standing, in full force, and has not been revoked.
MKAR aims to convert the Retention Licences into a mining licence application once the feasibility studies are completed. Following completion of the feasibility studies, MKAR qualifies under the Mines Act to apply for a mining licence for the Songwe Hill Rare Earths Project.
| 17.1.1.4 | Applicable Malawian Legislation |
Other applicable national legislation for the Project includes the following:
| ● | Plant Protection Act (2018) |
| ● | Forestry Act (1997) |
| ● | Mines and Minerals Policy (2013) |
| ● | Water Resources Act (2013) |
| ● | Land Act (2016) |
| ● | Customary Land Act (2016) |
| ● | Lands Acquisition Act (1970) |
| ● | National Sanitation Policy (2006) and Public Health Act (1948) |
| ● | Occupational Safety, Health and Welfare Act (1997) |
| S-K 1300 Technical Report Summary on the Songwe Hill REE Project | Page 355 of 489 |
| |
| 17.1.2 | Licences Required for the Project |
The licences and/or permits identified in Table 17.1 must be applied for and granted to enable Mkango to undertake the Project.
Table 17.1: Licences Required for the Project
| Authorisation | Enabling Legislation | Description | Competent Authority |
| Large-Scale Mining Licence | Mines and Minerals Act, 2023 | For mineral extraction. | Ministry of Mines |
| Water Use Licence | Water Resources Act, 2013 | Permit is required to use and/or abstract water, build dams (TSF, return water dam (RWD) and SWCD), and for the discharge of effluent. | Water Resources Board: Water Abstraction Control Sub-committee |
| Effluent Discharge Consent | Water Resources (Water Pollution Control) Regulations | To control water pollution. Effluent must conform to standards set by the Malawi Bureau of Standards. |
Pollution Control Sub-committee |
| Air Pollution Licence | Environment Management Act, 2017 | Licence is required to emit any gas or other pollutants into the atmosphere. | Department of Environmental Affairs |
| Waste Licence | Environment Management Act, 2017 | A licence is required to handle, store, transport, classify or destroy waste other than domestic waste, or operate a waste disposal site. | Department of Environmental Affairs |
| Hazardous Waste Licence |
Environment Management Act, 2017 Occupational Safety, Health and Welfare Act, 1997
|
A permit is required to import or export and transport any hazardous waste in Malawi. | Department of Environmental Affairs |
| Storage of Explosives Licence | Explosives Act, 1968 | Authorises the holder to store explosives on the premises described in the licence. | Chief Inspector of Explosives |
| Dealer’s Licence | Explosives Act, 1968 | Authorises the holder to purchase, sell and deal in explosives. | Chief Inspector of Explosives |
| Permit to Possess Explosives | Explosives Act, 1968 | Authorises the holder to purchase and possess explosives. | Chief Inspector of Explosives |
| Blasting Licence | Explosives Act, 1968 | Authorises the holder to use explosives for the purpose of blasting. | Chief Inspector of Explosives |
| Electricity Generation Licence |
Energy Regulation Act, 2004 Energy Regulation
|
Authorises the holder to establish, operate and generate power. | Energy Authority |
| Bulk Fuel Storage Licence | Liquid Fuels and Gas (Production and Supply) Act, 2004 and Regulations, 2008 | Authorises the holder to store liquid fuels and gas for private use. | Department of Environmental Affairs |
| Permit for the relocation of graves and cemeteries as well as cultural heritage artefacts | Monuments and Relics Act, 1991 | Authorises
the holder to remove and relocate items of cultural heritage. No person shall, without the prior written consent of the Minister, (a) make any alteration to, or destroy or damage, any monument or relic or any part thereof; or (b) carry out any cultivation or mining project or other work so as to cause, or likely to cause damage to cultural heritage resources. |
Minister of Monuments and Relics |
| S-K 1300 Technical Report Summary on the Songwe Hill REE Project | Page 356 of 489 |
| |
| Authorisation | Enabling Legislation | Description | Competent Authority |
| Licence to undertake an activity with the potential to result in the exposure to ionising radiation from mining and processing REE | Atomic Energy Act, 2011 | To provide an appropriate and internationally acceptable standard of protection and safety for humans and the environment for activities involving the peaceful application of nuclear science technology, without unduly limiting the benefits of the uses of this technology. | Atomic Energy Regulatory Authority (AERA) |
| 17.1.3 | International Guidelines and Standards |
The Project complies with the World Bank criteria by complying with the IFC Standards and the Equator Principles.
The IFC’s Sustainability Framework expresses its strategic commitment to sustainable development. The framework encompasses the IFC’s Policy and Performance Standards on Environmental and Social Sustainability, and IFC’s Access to Information Policy (IFC, 2012).
An assessment was undertaken to determine the level at which the relevant IFC Performance Standards have been addressed in the ESHIA document. It can be confirmed that all the IFC Performance Standards were considered during the undertaking of the ESHIA process. Table 17.2 provides a summary of the findings and indicates that the majority of the requirements have been fully considered in the ESHIA.
Note that the Project area is still a greenfield site; therefore, all the management plans will be developed when the Project is implemented. The purpose of the ESHIA and accompanying Environmental and Social Management Plan (ESMP) has been to identify the potential impacts and propose mitigation and management measures for implementation at Project implementation.
Table 17.2: Alignment of the ESHIA with the IFC Performance Standards
| Performance Standard | No. of Requirements | Fully Considered | Partially Considered | Not Considered |
Not Applicable |
| 1 | 2 | 2 | |||
| 2 | 1 | 1 | |||
| 3 | 5 | 4 | 1 | ||
| 4 | 8 | 6 | 1 | 1 | |
| 5 | 7 | 7 | |||
| 6 | 7 | 2 | 2 | 3 | |
| 7 | 1 | 1 | |||
| 8 | 4 | 2 | 1 | 1 |
| S-K 1300 Technical Report Summary on the Songwe Hill REE Project | Page 357 of 489 |
| |
| 17.2 | Surface Water |
Two field assessments were undertaken in the Project area: in February 2018 during the wet season, and in September 2018 during the dry season. During the field assessments, the state of all rivers, streams, rivulets and springs was documented. In addition, instantaneous water levels and water velocity were taken using a measuring ruler and a current meter where possible. The data was analysed using standard statistical techniques, and the results are presented in this section.
| 17.2.1 | Hydrological Units |
Songwe Hill is located within the Lake Chilwa basin, in south-eastern Malawi. The Lake Chilwa basin is classified as Water Resource Area 2 (WRA 2) out of a total of 18 delineated WRAs in Malawi. In the Project area, the main hydrological unit is the transboundary Sombani River. The river swells up to form Mpoto Lagoon 1.3 km north of the Project area. Key inflowing rivers contributing approximately 70 % of the inflows into Lake Chilwa include Likangala, Naisi, Sombani, Lingoni, Thondwe, Namadzi and Phalombe from the Malawi part of the catchment, and the Sombani and Mnembo Rivers from the Mozambique part of the catchment.
The Sombani River at Phaloni Hills has an average daily discharge of 2.41 m3/s, making it the largest inflowing river by discharge contribution into Lake Chilwa. During the wet season field assessment (2018), the measured instantaneous water level for the Sombani River at Phaloni Hills Station was 1.5 m. During the dry season field visits (2018), the instantaneous water level of the Sombani River at Phaloni Hills was estimated at 0.45 m. The Songwe-Phalombe area was receiving substantial amounts of rainfall during the field assessment period.
| 17.2.2 | Water Quality |
Surface water quality samples were collected at the streams within and around the Project area. Surface water samples were collected in May 2013 at the lagoon, and samples were collected again in 2018 during the dry and wet seasons. Water quality data was benchmarked against the Malawi maximum permissible levels (MPLs) for drinking water (MS 214:2013) and the World Health Organization (WHO) drinking water quality guidelines.
Elevated levels of fluoride were observed in the Mpoto Lagoon samples from 2013, as well as the samples from September 2018. Although these levels were above the WHO drinking water quality standard (1.5 mg/L), they were within the Malawi MPL for drinking water (6 mg/L). Fluoride in this area is generally high as this was observed in most monitoring boreholes around the Project area and was attributed to the historical volcanic activity which released magmatic fluorine as hydrogen fluoride (HF) through volcanic degassing (Digby Wells, 2022b). Thus, elevated levels of fluoride in the surface water could be because of groundwater recharge into the streams.
Iron (Fe) was the only parameter exceeding the Malawi MPL for drinking water at the Mpoto Lagoon (2018 dry season); however, the Fe levels were within the Malawi MPL for drinking water during the wet season sampling (2013 and 2018). This was attributed to dilution as rainfall is prevalent during this period, as opposed to during the winter period where there is limited rainfall. Most of the parameters with set WHO/MPL standards were found to be within these two standards for all the surface water monitoring points.
| S-K 1300 Technical Report Summary on the Songwe Hill REE Project | Page 358 of 489 |
| |
Another sampling round was conducted in October 2021 to provide baseline water quality conditions for REEs in the surrounding natural water resources including Lake Chilwa, prior to the commencement of the Project. Under natural conditions, REEs are only available in small amounts from groundwater sources and the atmosphere.
| 17.2.3 | Flood Line Modelling |
Flood lines on river sections were analysed to evaluate the risks associated with the potential flooding or inundation of infrastructure and for the protection of water resources. Songwe Hill comprises several drainage lines emanating from the top of the hill, runoff from these drainages flow towards the Mpoto Lagoon which forms part of the Sombani River. Based on the hydrological assessment, the drainages emanating from the hill have little or no potential for flooding since these are located at the catchment origin. However, the Sombani River and/or Mpoto Lagoon have the potential to flood during very high rainfall events.
The flood line results indicate that all the proposed mine infrastructure, as well as the communities adjacent to the proposed mine and the Mpoto Lagoon, is located outside the modelled 1:50-year and 1:100-year flood-prone zones.
| 17.3 | Groundwater |
A groundwater assessment was conducted as part of the ESHIA process, and hydrogeological fieldwork commenced in March 2013 and was concluded in 2022. A total of 15 locations were visited, including 14 boreholes and a spring. Digby Wells updated the hydrocensus survey in November 2018 including visits to communal water supply boreholes, monitoring boreholes, springs, and hand dug wells. A total of 35 water sites were visited during the hydrocensus.
Groundwater is the main source of drinking water in the area surrounding the proposed mine. Water uses identified during the hydrocensus were the following:
| ● | Domestic uses, livestock watering, and irrigation for the local communities (14 sites, 13 boreholes and a spring) |
| ● | Water supply for the mine (1 borehole) |
The results show that groundwater contributes 51 % of the total flow of the Sombani River at Phaloni Hills. Aquifer tests were conducted by Mozagua Drilling Company (Pty). The aquifer transmissivity was found to range from 0.22 m²/d to 22.5 m²/d, and the sustainable yield ranges from 0.03 L/s to 3.29 L/s. The boreholes were drilled to depths between 18 mbgl and 75 mbgl. Only one borehole solely intersected the weathered aquifer; the other boreholes penetrated through the weathered aquifer into the deeper aquifer. Therefore, the aquifer properties presented are reflective of the cumulative properties of the shallow, weathered and deep aquifer.
| 17.3.1 | Groundwater Occurrence |
The streams from the Songwe Hill area contribute to the total flows of the Sombani River through groundwater contribution as baseflow and direct runoff. The daily data from the gauging station at Phaloni Hills was split into these two components (surface water and baseflow). The results show that groundwater contributes 51 % of the total flow.
| S-K 1300 Technical Report Summary on the Songwe Hill REE Project | Page 359 of 489 |
| |
| 17.3.2 | Groundwater Levels |
The following was concluded from previous studies:
| ● | Measured groundwater levels collected during the hydrocensus survey in 2013 were considered insufficient to define the groundwater flow direction with confidence; thus, further studies took place in 2018. |
| ● | Groundwater levels in boreholes drilled in 2018 ranged from 2.1 mbgl to 27.1 mbgl. |
| ● | The groundwater level in one monitoring location in 2018 was measured to be 46.4 mbgl; this anomalous deep groundwater level is related to its high topographical location. This monitoring location had a higher topographical elevation resulting in deeper water levels (from surface). |
| ● | Groundwater levels in boreholes drilled in 2020 were all less than ~2 mbgl, indicative of high groundwater levels expected for the alluvial plain. |
| 17.3.3 | Water Quality |
The baseline natural groundwater quality trends were assessed based on groundwater quality analysed in 2013 and 2018. A comparison of the groundwater was made against the WHO drinking water quality guideline limits (2017) and the Malawi Bureau of Standards MPLs (MS 733:2005).
Fluoride was seen to be the most prevalent groundwater contaminant, exceeding the WHO standards for most of the groundwater monitoring points, although within the Malawi Bureau of Standards MPLs. The excess of this constituent in the local groundwater is due to the volcanic nature of the rocks at the Project site.
Groundwater quality assessments conducted during 2013 and 2018 were shown to be relatively consistent; therefore, the baseline conditions have not had major alterations over the years. This indicates that agricultural activities undertaken by the local communities do not significantly affect groundwater quality (with the potential exception of one location with the highest topography).
| 17.4 | Geochemistry |
A waste classification study was carried out for the waste rock (Prime Resources, 2021) and tailings (SGS, 2022) materials. The study included all the major lithologies of waste rock selected from 125 boreholes. The report states that the principal lithologies that comprise the Songwe Hill complex are carbonatite, igneous rock that is predominantly of carbonate minerals (> 50 modal % – calcite, dolomite, ankerite, siderite and magnesite) along with lesser silicates, phosphate minerals, and oxides, fenite and breccia. The minerals identified as likely to exert a strong influence on the drainage chemistry of leachate arising from the waste rock are the following:
| ● | Calcite and dolomite (carbonate, neutralising minerals in high abundance) – Ca, Mg |
| ● | Goethite and hematite (oxy-hydroxide iron minerals, known to adsorb metals and metalloid onto their reactive surfaces) – Fe |
| ● | Halite (salt, readily soluble, also responsible for releasing trace metals that are within solid solution in the lattice) – Cl, Na |
| S-K 1300 Technical Report Summary on the Songwe Hill REE Project | Page 360 of 489 |
| |
| ● | Apatite (phosphate mineral, weathering is responsible for long term phosphate leaching from rock, uranium is often hosted within apatite and trace concentrations may be liberated) – P, phosphate, U |
| ● | Fluorite (soluble, alkaline conditions with the presence of carbonates tend to limit the mobility of released fluorine in the environment) – Ca, F |
| ● | Silicate minerals (slower to weather than the more reactive minerals discussed above, impacts long term water chemistry) |
The results of the waste rock analysis undertaken by Prime Resources (2021) were subsequently updated by SGS (2022). Six tailings residues, one barren liquid and one waste rock composite sample from the metallurgical test work were analysed. It is recommended that another campaign of tailings and waste rock analysis be undertaken during operations. This will provide an assessment of the actual tailings being produced during operations to account for any potential variability in the ore and processing.
The results of the SGS (2022) analysis have been summarised in the sections below.
| 17.4.1 | Tailings |
The six tailings streams characterised were
| ● | Gangue leach neutralisation precipitate |
| ● | Causticisation residue |
| ● | Rare earth leach residue |
| ● | Combined hydrometallurgical purification residue |
| ● | Combined front-and back-end hydrometallurgical tails |
| ● | Flotation tails |
The reactive minerals in the tailings were acid neutralising minerals, carbonates (1.5 % to 57 %), aluminosilicates (1.3 % to 17 %), and goethite (3.7 % to 4.1 %). The carbonate minerals were ankerite, brugnatellite, calcite, dolomite, and pyroaurite. The aluminosilicates were allanite, magnesium aluminium silicate, muscovite and palygorskite. These minerals contribute to the overall neutralisation potential (NP) of the tailings.
The tailings streams were acidic to alkaline (pH 4.4 to 13) in the short term. The acidic tailings streams were rare earth leach residue (pH 4.4) and combined hydrometallurgical purification residue (pH 4.9). Consistent with the mineralogy results, total sulphur in the tailings ranged from 0.14 % to 1.2 %. The sulphur occurred predominantly as sulphate (0.14 % to 1.0 %). Sulphide sulphur ranged from 0 to 0.2 %. The NAG pH ranged from pH 4.3 to 13. All the tailings streams will be NAF in the long term except for the rare earth leach residue and combined hydrometallurgical purification residue, which were inconclusive and classified as Uncertain.
The leachates from the tailings streams were highly alkaline (pH 9.1 to 13) except for the rare earth leach residue (pH 4.3) and combined hydrometallurgical purification residue (pH 4.7). The leachates are saline (total dissolved solids (TDS), 3,045 mg/L to 22,516 mg/L) except for the rare earth leach residue (TDS, 838 mg/L) and flotation tails (TDS, 230 mg/L). The potential parameters of concern in the tailings leachates were identified as alkalinity, arsenic (As), calcium (Ca), chloride (Cl), chromium (Cr), fluoride (F), sodium (Na), TDS, and zinc (Zn).
| S-K 1300 Technical Report Summary on the Songwe Hill REE Project | Page 361 of 489 |
| |
| 17.4.2 | Waste Rock |
One composite waste rock sample was characterised. The reactive minerals in the waste rock were acid neutralising minerals, carbonates (1.5 % to 44 %), aluminosilicates (2.4 % to 14 %), and goethite (4.1 %). The carbonate minerals were ankerite and calcite. The aluminosilicates were magnesium aluminium silicate, muscovite, microcline and palygorskite. These minerals contribute to the overall NP of the waste rock.
The waste rock was alkaline (pH 9.5) in the short term. Consistent with the mineralogy, total sulphur in the waste rock was 0.28 %, occurring as sulphates (0.16 %) and sulphides (0.12 %). The NAG pH was pH 9.3, indicating that the waste rock will be NAF in the long term.
The results confirm the Prime Resources (2021) assessment that predicted that the Songwe Hill waste rock is NAF due to the low sulphur content (< 0.2 %, predominantly as sulphate) and high neutralisation potential from calcite, dolomite and aluminosilicate minerals based on assay data.
The leachate from the waste rock was alkaline (pH 9.3) and non-saline (TDS, 291 mg/L). The constituents of concern in the leachate included alkalinity, Cr and F.
The Prime Resources (2021) assessment indicated that the leachates from the waste rock are alkaline (pH, 8.6 to 9.3 for the 1:20 leachate, and pH 8.7 to 9.1 for the 1:4 leachate). The leachate constituents were found to be within the IFC Effluent Standard for Mining, the Malawi Bureau of Standards drinking water specification (MS 214:2013), the Australian and New Zealand Environment and Conservation Council (ANZECC) drinking water for livestock (2000), New Zealand standard, Agriculture and Resource Management Council of Australia and New Zealand (ARMCANZ) 2000 water quality guidelines, and the United States Environmental Protection Agency (US EPA) maximum contaminant levels used to assess the leachate quality except for cerium (Ce), lanthanum (La) and neodymium (Nd). These rare earth constituents were not analysed in this report but should also be considered potential constituents of concern from the waste rock.
| 17.4.3 | Barren Liquid |
The rare earth carbonate barren liquid was very saline (TDS, 35,799 mg/L). The high salinity was mainly from chloride (24,000 mg/L), calcium (5,400 mg/L), sodium (600 mg/L) and zinc (0.045 mg/L to 360 mg/L), all of which exceed the Malawian water quality guidelines (MS 733:2005).
| 17.5 | Terrestrial Biodiversity |
| 17.5.1 | Flora |
A 2013 study revealed that the Songwe Hill area is rich in plant species diversity with 160 plant species identified within the surveyed area. During the 2018 studies, a total of 127 plant species were recorded. This included a complex mix of species on the plains (which are under cultivation) lying between Songwe Hill and Mpoto Lagoon.
Species distribution varies throughout the site with no noticeable species dominating the Project area. The average percentage vegetation cover of individual species was recorded to provide guidance on the areas vulnerable to disturbance and those more resilient to anthropogenic change.
| S-K 1300 Technical Report Summary on the Songwe Hill REE Project | Page 362 of 489 |
| |
Only five species of trees which are protected by Malawian legislation were directly observed at selected sampling sites during the dry and wet season surveys. The species included Pericopsis angolensis, Dalbergia melanoxylon, Pterocarpus angolensis, Cordyla africana, and Terminalia sericea. Two species, namely Dalbergia melanoxylon and Pterocarpus angolensis, are classified on the International Union for Conservation of Nature (IUCN) Red List as Near Threatened (NT) and Vulnerable (VU), respectively.
A comparison of plant species richness at all sites showed that the Nanzazi River has the highest plant species diversity. Both terrestrial (grasslands, savannah woodland, cultivated fields and a mosaic of shrubs and grass) and aquatic habitats (rivers and open water of Mpoto Lagoon) are the key habitats within and around the Project area. The proposed mining pit area is located in a grass patch within the savannah woodland on top of Songwe Hill.
| 17.5.2 | Fauna |
Fifteen species of mammals were recorded during the wet and dry season surveys. The results show that the highest number of specimens were encountered at the proposed open pit and the fewest at Changa hill. The proposed mining site is an area of the least disturbance and had good vegetation cover during the wet season compared to the Changa and Phindani hills. This is mainly due to extensive deforestation having taken place by local communities in the other hills. More species were recorded during the wet season compared to the dry season as a result of the increased ground cover and availability of food during the wet season.
Eleven mammal species were recorded during the wet season, with the highest number of specimens encountered at the proposed open pit and the lowest at Changa Hill. The mining site is an area of least disturbance and therefore provided good cover during the wet season. The results show that none of the mammal species recorded are listed on the IUCN Red List, and their conservation status is Least Concern (LC).
Only 16 species of birds were recorded in the transects that were conducted along the shoreline of Mpoto Lagoon in the wet season. Species were recorded mainly in the vegetation around the Lagoon and a few in flight above the Lagoon during the boat surveys. All species recorded were of Least Concern on the IUCN Red List. During the dry season, 46 bird species were recorded along the shoreline. Only the species Ardeola idae (Madagascar Pond Heron) was recorded as Endangered (EN) on the IUCN Red List. A martial eagle was observed during the surveys in in 2013 and in 2018 and is a species of global concern which is listed as Vulnerable (VU) on the IUCN Red List.
None of the amphibian or reptile species recorded in the field is listed by the IUCN and the Convention on International Trade in Endangered Species (CITES) as being endangered or requiring any special protection. The key sensitivities present in the Project area inform the IFC biodiversity values and critical habitat assessment. No Critical biodiversity areas were identified or delineated in the Project area. Lake Chilwa, the Chilwa Wetland Basin, and Mulanje Mountain Forest Reserve, are all located over 10 km away from the Project.
| S-K 1300 Technical Report Summary on the Songwe Hill REE Project | Page 363 of 489 |
| |
| 17.6 | Wetlands and Aquatic Biodiversity |
A single wetland ecological field assessment took place during the wet season (February to March 2018). The wetlands associated with the Project area are located within the Lake Chilwa catchment, with ephemeral streams and seasonal, temporary and permanent wetlands draining into the Mpoto Lagoon to the north of the Project area. During the field study, it was observed that soils near the Lagoon supported hydrophytic plants whilst soils near the edge of the wetland were dry and supported terrestrial vegetation. Six hydro-geomorphic units, as well as several ephemeral drainage lines, which cover over 2,617 ha in total, were identified in the vicinity of the proposed Project area. The valleys within the Project area have been heavily impacted because of agricultural activities (cultivation and livestock).
Across the two seasons (wet and dry), a total of 485 individual fish belonging to four families (Cichlidae, Clariidae, Nothobranchiidae and Cyprinidae) and eight species were sampled from the aquatic habitats of the Project area. The species include Clarias gariepinus, Oreochromis shiranus, Enteromius paludinosus, Enteromius trimaculatus, Astatotilapia calliptera, Coptodon rendalli, Nothobranchius kirki and Enteromius kerstenii. The most abundant species in number was the O. shiranus. Of these 21 fish species, 15 are classified as being of Least Concern (LC), five are classified as Not Evaluated (NE), while Nothobranchius kirki is regarded as Vulnerable (VU) under the IUCN Red list.
A total of 1,113 individual aquatic macro-invertebrates belonging to 38 families were sampled in the Project area. Of these invertebrate families, only six contributed over 5 % each to the total collection and together comprised approximately 58 % of the whole sample. Generally, the family Chironomidae (non-biting common midges) was the most, Libellulidae (common skimmers) 12 % of the collected samples, Notonectidae (backswimmers) 10 % of the sample, Aeshnidae (dragonfly nymphs) approximately 8 %, Atyidae (freshwater shrimps) 7 % of the sample, and Dytiscidae (predaceous diving beetles) 6 % of the sample. One species, Hirudino medicinalis, a species of leech, is Near Threatened on the IUCN Red List.
| 17.7 | Soils and Land Use |
A field survey to include a pedogenic description of representative soil profiles and horizons throughout the proposed mine footprint was carried out in September 2018. The main soil types present in the Project area according to the Food and Agricultural Organisation’s classification system include eutric fluvisols, eutric gleysols, eutric vertisols and leptosols. The sensitivity of the area to erosion is dependent on various factors such as land use, land cover, and climatic factors. Soils in the Mauze and Songwe Hills are more prone to erosion than the soils within the low-lying areas and wetlands. Anthropogenic activities in the area incite the erosion processes through cultivation on steep slopes, bush clearing, deforestation, and development.
The heavy metals in soil samples were analysed; however, none of the metals recorded was present in high proportions. All soil samples recorded heavy metal values of below the limit of detection, which is 0.01 ppm for As, indium (In), U, and tin (Sn).
The dominant land use units in the Project area include community areas made up of houses and plantations, drainage lines and watercourses, grassland, rainfed cultivation, rocky outcrops and hills, woodlands and open waterbodies, wetland areas used for rice cultivation, thin forest cover on the uplands and remnants of Brachystegia woodlands on the summit of the Mauze Hill.
| S-K 1300 Technical Report Summary on the Songwe Hill REE Project | Page 364 of 489 |
| |
| 17.8 | Radiation |
In 2018, a year-long campaign of passive radon monitoring and analysis of environmental media (groundwater, surface water, dust and soil samples) was completed. The aim was to establish the baseline site characteristics related to radionuclide exposure. The potential sources of radiation exposure associated with the Project are the TSF, WRD, Type 2 material stockpile, open pit, RWD, processing plant and the topsoil stockpiles. The most significant pathways through which members of the public may be exposed to radiation from the Project are defined as follows (International Atomic Energy Agency [IAEA], 2002):
| ● | Atmospheric pathways: radiation exposure through inhalation of airborne gases (e.g., radon, thoron and its progeny) and airborne radioactive particulates associated with the inhalable particulates (PM10 and external gamma radiation (cloud shine) |
| ● | Atmospheric and associated terrestrial pathways: radiation exposure from ingestion of contaminated soil and foodstuff, as well as external radiation following the deposition of airborne particulates (total suspended particles (TSP) and ground shine (radiation from radioactive material deposited on the ground i.e. dust particulates)) |
| ● | Aquatic pathways: radiation exposures through ingestion of contaminated surface water and groundwater, foods produced using contaminated irrigation water, fish, and other aquatic biota, food derived from animals drinking contaminated water, as well as external radiation (immersion) |
| 17.8.1 | Radiological Baseline |
The contaminants of concern are those naturally occurring radionuclides associated with the uranium and thorium decay series. Radionuclides that pose a significant risk to human health are identified from their dose conversion factors and reported half-lives. The analysis results of the environmental media were used to calculate the activity concentrations in a wider spectrum of environmental media using internationally accepted transfer or accumulation factors found in the literature as site-specific factors were not available. The results of the radiological site characterisation baseline are provided in the following sections.
| 17.8.1.1 | Airborne Radon Gas |
The environmental radon concentration in the air around the Project site was measured over a period of one year (2018–2019) in four campaigns of three months each. The potential radon inhalation dose observed at the monitoring points was calculated using the indoor and outdoor radon inhalation dose conversion factors (National Nuclear Regulator [NNR], 2013; International Commission on Radiological Protection [ICRP], 1996; IAEA, 2011; Eckermann et al., 1988). The results show that radon gas inhalation has the potential to make a significant contribution to the natural background radiation observed at the Project site.
| 17.8.1.2 | Surface Water |
The potential contribution from external gamma radiation (ground shine and water immersion) was determined to be insignificantly small, with the main contributors being the direct ingestion of water and fish. The total effective dose calculated from all exposure routes at all surface water monitoring points is less than 55 µSv.year-1 for all age groups. The public dose limit is 1,000 µSv.year-1.
| S-K 1300 Technical Report Summary on the Songwe Hill REE Project | Page 365 of 489 |
| |
The doses calculated from the surface water analysis data are relatively low and suggested that the surface waterbodies are largely unaffected by naturally occurring radionuclides in the Project area. The dose from fish consumption as a bioaccumulation factor from the water was also calculated and found to be relatively low. The total effective dose from all exposure routes at all surface water monitoring points is less than 160 µSv.year-1 for all age groups.
| 17.8.1.3 | Groundwater |
The doses calculated from the groundwater analysis are more significant than those calculated from the surface water; however, they are still relatively low. The results from the groundwater samples result in water ingestion doses of less than 120 µSv.year-1 for all age groups. This suggests that the groundwater is largely unaffected by naturally occurring radionuclides at present.
| 17.8.1.4 | Soil and Sediment |
The radionuclide activity concentration in the soil can be transferred to crops through root uptake processes. This can then be transferred to animal pasture, implicating animals and animal products, which can then be ingested by humans.
The results of the analysis campaign showed that most of the soil samples result in external gamma radiation doses of less than 100 µSv.year-1. The doses calculated from the soil analysis data resulted in significant doses, whether through external gamma radiation, direct ingestion or the transfer of radioactivity to crops and animal products. Sample SG12, in particular, located on top of the orebody, resulted in the most significant activity doses. The results illustrate the dominance of root and leafy vegetable ingestion and to a lesser extent fruit ingestion.
| 17.8.2 | Public Radiation Protection |
A Prospective RPSA was developed as part of the ESHIA process. The purpose of the radiation protection programme is to assess and present safety assessment findings that are consistent with the IAEA Safety Standards, the IFC PSs, as well as the available Atomic Energy Regulations of 2012 promulgated by the AERA in terms of the Atomic Energy Act (2011) in general. The radiological safety assessment is undertaken to provide confidence to stakeholders that an operation, facility or activity does not pose a radiological risk to relevant exposure groups, notably workers or members of the public.
Consistent with the source analysis, the main environmental pathways of concern are the atmospheric, surface water and groundwater pathways. Based on the baseline socio-economic indicators and the biophysical environment surrounding the Project, three general receptors were identified to determine their potential for radiation exposure.
The results showed that notwithstanding the close proximity of the receptor locations to the surface mining infrastructure, the total effective doses are still less than the dose limit for all age groups. The maximum contribution from the surface water samples calculated for a conservative set of conditions was less than 100 µSv.year-1. The maximum contribution from the groundwater samples calculated for a conservative set of conditions was less than 155 µSv.year-1. If either of these sources is added to the contribution of the atmospheric pathway, then the total dose is still in the order of 500 µSv.year-1. For all potential receptors the contribution of the Project during the operational period is less than the public dose limit of 1,000 µSv.year-1.
| S-K 1300 Technical Report Summary on the Songwe Hill REE Project | Page 366 of 489 |
| |
| 17.9 | Cultural Heritage |
A cultural heritage assessment was undertaken as part of the ESHIA process in February 2019 in line with the national Malawian legislative framework and IFC PS8: Cultural Heritage. A follow-up site visit by a cultural heritage specialist was undertaken in May 2021. The purpose of the in-field assessment was to identify previously unknown cultural heritage resources within the Project area that may be impacted and undertake informal consultation with informants living in the Project area and/or with involvement with local cultural practices.
During the pre-disturbance survey in 2019, the heritage team and a village headman recorded two cemeteries in proximity to the then Project layout. Several additional cemeteries were discovered, and the location of these were ground-truthed by the heritage team in 2021. These were expected to be impacted by the changes in the Project layout. The 12 cemeteries identified in and near the Project site include the following:
| ● | Nazazi Cemetery (BGG-001) – Chiefs and Group Village Heads |
| ● | Phindani Cemetery (BGG-022) – Village |
| ● | M’mwala Cemetery |
| ● | Chitsulo Family Cemetery |
| ● | Namalima Group Village Head/Chief Cemetery |
| ● | Mangazi Family Cemetery |
| ● | Namalima Village Cemetery |
| ● | Maloya Cemetery |
| ● | Maoni Royal Cemetery |
| ● | Maoni Cemetery |
| ● | Kathumba Royal Cemetery |
| ● | Muhowa Cemetery |
Within the Project area, 28 cultural heritage resources were identified. Occurrences or scatters of archaeological material representing the Iron Age and historical periods were the largest number of cultural heritage resources identified. One record of a natural feature associated with local oral traditions and two records of tangible material culture associated with intangible or living heritage practices by members of the local community were also found. Archaeological resources were open sites containing material not older than the Early Iron Age. The heritage resources with a High Cultural Significance included the 12 records of cemeteries, Site S13 (“The Road Junction”), which has ongoing cultural practices/living heritage, and Songwe Cave. Of Medium Cultural Significance were records of scattered large pot fragments and a historical iron-smelting site. The Project design included avoidance of cemeteries; however, two cemeteries could not be avoided and will need to be relocated through the development of a grave relocation plan in consultation with key stakeholders.
| S-K 1300 Technical Report Summary on the Songwe Hill REE Project | Page 367 of 489 |
| |
| 17.10 | Social and Community Health |
As part of the ESHIA, a socio-economic and health assessment was conducted and presents an overview of the conditions in the secondary study area (Phalombe District) and the primary study area (Nazombe and Kaduya Traditional Authorities (TAs)). Data on the secondary study area was obtained through desktop reviews, while data on the primary study area was obtained through a combination of desktop research, qualitative data collection, and a sample socio-economic survey.
The Phalombe District is located in the Southern Region of the Republic of Malawi, 81 km south of the commercial city of Blantyre, and is 1,323 km2 in size. The Project site is in TA Nazombe’s jurisdiction, specifically Group Village Headmen (GVH) Maoni and Namalima.
The district is vulnerable to floods, particularly in areas of TAs Chiwalo, Nazombe, Nkhulambe, Paramount Mkhumba, Kaduya and Jenala, and 73 % of the total district population is at risk of flooding each year.
The district is also prone to prolonged dry spells which affect all the TAs in the district but very severely affect TAs Chiwalo, Nazombe and Jenala. Approximately 95 % of the total district population is at risk of periods of drought each year.
| 17.10.1 | Socio-Economic Profile |
The primary study area is largely inhabited by Malawians (98.4 %) with only 1.6 % Mozambicans. The dominant tribe is the Lomwe tribe: 94.3 % are Lomwe, 5.1 % are Chewa, with the Yao and Ngoni represented by 0.3 %. All the survey respondents indicated that they are Christians by religion.
The average number of structures owned by households is three. The most common structures were kitchens, pit latrines, sleeping houses and in a few cases a structure for business, like a shop/grocery store.
There is no secondary or tertiary (university or technical college) school in the immediate area of the Project. As a result, only 7.6 % of the household members in surveyed households have completed secondary school education. Literacy in the area is low, with 26 % of the household members not able to read. This affects employment rates as nearly 90 % of the survey respondents did not have any employable skills. Building, driving and carpentry were the skills mentioned by 5 %, 2 % and 1.9 % of the respondents, respectively. The education infrastructures were recorded to be overwhelmed, with too many children compared to the number of teachers and classrooms.
The Phalombe District appears to have a large number of water access points, the majority (80 %) of the households in the Project area has a sanitation facility, with 98 % using a pit latrine and 2 % having a flush toilet. The major source of water for domestic use is underground water through boreholes, and surface water is mainly used for irrigation of crops and livestock. Although the water is sourced mainly from boreholes, only 18 % treat it before drinking.
| S-K 1300 Technical Report Summary on the Songwe Hill REE Project | Page 368 of 489 |
| |
| 17.10.2 | Health |
Malaria was the most common disease as reported by 61 % of the respondents, followed by coughs (28 %) and diarrhoea (20 %). The Project area is located close to Mpoto Lagoon, which is a habitat for mosquitoes.
The socio-economic profile also identifies cholera, HIV/AIDS, and pneumonia as some of the most common diseases in the district. However, just 7 % of the households reported experiencing pneumonia, and none reported cholera cases for the six months prior to the survey. The study has established that there is a high prevalence of respiratory tract diseases such as coughs, pneumonia, influenza and asthma in the Project area.
The average walking time to access health facilities was estimated to be 86 min, with a median of 2 h, and 90 % of the respondents indicated that they were able to obtain medicines prescribed to them for free.
| 17.10.3 | Socio-Economic Activities |
Farming is reported as the main income earner by a majority of the households, seconded by fishing. Some households (26 %) reported that they depend on accessing credit. Maize is, as the country’s staple food, grown by the majority of households. Other crops include millet, soya, tobacco and vegetables. Vegetables and soya are grown by the communities in the wetlands near Mpoto Lagoon. The wetlands provide for most of the year-round farming. For most households, farming is a supplementary source of food.
Most households have access to land. Only 2.9 % reported having no access to land. High percentages of households mentioned that they had access to improved seeds and fertilisers as a result of the government’s programmes.
The Mpoto Lagoon ecosystem is still believed to support livelihoods for a significant number of people as 30 active fishermen were encountered in the area during respective field surveys. The majority of the fish caught from Mpoto Lagoon is consumed at a household level and/or sold directly at local markets. Some of the households (54 %) reported that they owned livestock and poultry and have the land for grazing. The livestock included cattle, goats and pigs, the poultry included chickens and guinea fowl.
| 17.10.4 | Resettlement |
The Project implementation results in the requirement for physical and economic displacement of communities as well as relocation of cultural heritage resources and graves. Resettlement activities will follow IFC PS5 through the development of a Resettlement Action Plan (RAP) and concurrent stakeholder engagement through the establishment of a Resettlement Working Group composed of representatives of the impacted communities. In April 2022, a preliminary asset and socio-economic survey was undertaken of the Project-affected persons (PAPs) within the infrastructure areas and proposed exclusion zone.
| 17.10.4.1 | Displacement Impacts and Resettlement Principles |
Entitlements for compensation will be based on the eligibility criteria and the various categories of losses identified. Compensation will cover all the assets to be lost at replacement value and will replace any community infrastructure to maintain existing community services. MKAR will compensate the affected businesses, informal traders or enterprise for the cost of reestablishment at a new location. MKAR will seek to further mitigate the effects of the Project activities on PAPs by designing and implementing an LRP to ensure that the standard of living of PAPs after compensation and displacement is replaced at least to the standard prior to relocation. The RAP will be conducted in compliance with IFC PS5.
| S-K 1300 Technical Report Summary on the Songwe Hill REE Project | Page 369 of 489 |
| |
| 17.10.4.2 | Key Tasks for Resettlement Planning |
The key tasks required in a resettlement and compensation process are described in this section. These are critical for undertaking successful resettlement and ensuring best practice in the production of an RAP. These include the following:
| ● | Screening has been undertaken to provide an understanding of the extent of the resettlement as well as a preliminary analysis of the resettlement and to define the scope for the resettlement process. |
| ● | Consultation involved public participation through the ESHIA stakeholder engagement process. Engagement with the affected people and stakeholders will be continued throughout the resettlement process. This involves information exchange to build Project awareness, capacity building and education of the PAPs, promotion of active participation of the community to discuss their concerns, and discussion and negotiation of options for compensation alternatives. |
| ● | Household surveys were undertaken in 2018 and in April 2022. This included information on the socio-economic conditions of each PAP and was a preliminary census for a cut-off date, to provide a baseline assessment before the RAP document process is initiated. An asset inventory of all permanent or temporary structures likely to be lost due to the Project was also recorded at this time. |
| ● | Identification of host sites involved identifying and selecting potential resettlement host sites and included consultation with the affected households. This coincides with the development of an LRP, land use planning, and access to natural resources and social infrastructure. |
| ● | Entitlements and compensation include identifying the households, individuals and communities deemed to be entitled to compensation. The nature of the entitlement varies between each individual and household. The criteria will need to be approved and agreed with all the stakeholders, and an agreement will also need to be reached on the values for compensation. |
| ● | Resettlement planning, schedule, budget and responsibilities will be provided in the RAP. The planning includes the overall strategy for the resettlement, the phases and means of compensation. A detailed schedule for physical resettlement and payment compensation will be prepared to align with the overall Project phases. The management plan is used for planning, implementation, and monitoring of the overall resettlement process. The plan is released for public review, including affected households, local communities, and relevant authorities. It may be released in an abbreviated format that does not include information deemed to be sensitive to the Project or the people being affected. |
| S-K 1300 Technical Report Summary on the Songwe Hill REE Project | Page 370 of 489 |
| |
| 17.11 | Stakeholder Engagement |
Public consultation has been undertaken throughout the ESHIA process; however, Mkango and MKAR have also taken opportunities to provide regular updates on the status of the Project to the community throughout the pre-feasibility, feasibility and bankable feasibility studies.
Engagement was undertaken at the start of the ESHIA process to inform stakeholders of the proposed Project and the specialist studies that would be undertaken to understand the biophysical and socio-economic environment. Thereafter, engagement with communities was undertaken prior to undertaking any field activities between 2018 and 2022. Once the draft ESHIA had been finalised, extensive stakeholder engagement was undertaken at a national, regional, district and local level in March and April 2022. The purpose was to provide an update on the Project with details of the proposed activities, infrastructure requirements, schedule and status of the Project. It served to present the potential environmental and socio-economic impacts and the proposed mitigation and management measures as well as the residual impacts with the implementation of the Environmental, Social and Health Management Plan (ESHMP). Meetings were held at a local, district and national level and included separate meetings with the following:
| ● | District authorities |
| ● | Group village chiefs |
| ● | Traditional authorities |
| ● | Members of development committees |
| ● | Area executive committee |
| ● | Mothers and youth community-based organisations |
| ● | Mining action group |
| ● | Business community |
| ● | Religious leaders |
| ● | Phalombe business and religious leaders |
| ● | District non-governmental organisations (NGOs) and community-based organisations |
| ● | Phalombe District Council |
| ● | National NGOs |
| 17.12 | Potential Environmental Impacts |
The Project activities and their potential environmental impacts were assessed based on their biophysical and socio-economic baselines. Potential impacts associated with the proposed activities were identified through a systematic process whereby the activities were assessed for all phases (construction, operation, decommissioning, and closure) of the Project. The process identifies and evaluates the likely significance of potential impacts on key receptors and resources.
The Project will result in various potential environmental and socio-economic impacts due to the nature of the proposed activities. The most significant potential impacts associated with the Project include the following:
| ● | Alteration of the physical and chemical properties of soil resources and loss of topsoil due to increased erodibility, which in turn reduces the land’s agricultural potential. |
| S-K 1300 Technical Report Summary on the Songwe Hill REE Project | Page 371 of 489 |
| |
| ● | Alteration of the local natural hydrology as a result of stream diversions required for the establishment of infrastructure. |
| ● | Loss of natural habitat in terms of flora and fauna species, and consequently loss of general biodiversity as removal of vegetation and topsoil stripping occurs. This will cause erosion and sedimentation, changing the land use. |
| ● | Direct loss of wetlands as some infrastructure will be constructed directly on drainage lines and on the upper boundaries of the catchments. |
| ● | Groundwater drawdown as a result of abstraction of water from the wellfield at Project start-up for the process plant, thereafter decreasing as water recycling targets are met. |
| ● | Potential groundwater and surface water contamination from interaction with the WRD and potential seepage from the TSF. |
| ● | Potential exposure to radioactive waste from the mining and processing of REE-bearing ore. |
| ● | Direct and indirect impact on cultural heritage resources and graves. A grave relocation process will need to be undertaken to gain access to the Project area, resulting in a positive impact. |
| ● | Moderate visual impacts due to the establishment of infrastructure as the site changes from rural to industrial. |
| ● | Economic and physical displacement during the development of the Project as well as disruption of movement patterns and potential influx into the area, leading to increased social ills and increased pressure on available social infrastructure. |
In most cases, the negative impacts can be mitigated and will be discussed as part of the various management plans to be developed for the ESHIA. The mitigation measures proposed will reduce the severity of the Project impacts on the biophysical and socio-economic environment to an acceptable level with continuous management of these risks. Most of the potential impacts are major to moderate high and some have been reduced to moderate or minor with the implementation of proposed mitigation measures. However, not all the potential negative impacts identified can be avoided.
Positive impacts from the Project will include the continuation and expansion of community development programmes, employment opportunities, business and procurement opportunities, as well as royalties and taxes to the Malawian government. The potential positive impacts associated with the Project are the following:
| ● | Benefits to the community through job opportunities. |
| ● | Business opportunities through procurement and multiplier effects through purchase of supplies by the mine from local and national businesses. |
| ● | Establishment of a community development fund to assist with the expansion of community development programmes. |
| ● | Restoring the land to pre-mining conditions through the placement of topsoil and revegetation with indigenous species. This is possible through rehabilitation measures and monitoring. |
| 17.13 | Cumulative Impacts |
The development of a mine at Songwe Hill will trigger several other developments in the area, such as new access roads, transmission lines, and changes to the present land uses. There is also the potential for population influx putting pressure on the available land around the mine.
| S-K 1300 Technical Report Summary on the Songwe Hill REE Project | Page 372 of 489 |
| |
| 17.14 | Environmental Management and Recommendations |
Detailed environmental and social specialist studies have been undertaken for the ESHIA in compliance with the relevant Malawian Legislation, IFC and other best practice requirements.
| 17.14.1 | Management of Impacts and Issues |
An ESHMP was compiled for the Project to manage and mitigate identified adverse environmental impacts. The ESHMP is also used to enhance the possible benefits that can result from the development of the Project. Where potential negative impacts cannot be avoided, mitigation measures to reduce their significance were proposed along with the necessary environmental and social management and monitoring plans to be implemented.
All Mkango and MKAR employees, contractors and their associated personnel have a responsibility to ensure that good environmental performance is upheld during the undertaking of their duties. Ultimately, the General Manager of the mine will be responsible for ensuring the implementation of the ESHMP, with specific personnel responsible for environmental and social performance management.
A monitoring plan has been suggested to assist MKAR in ensuring that the mitigation and management measures outlined in the ESHIA are being met and are achieving their objectives. To verify the implementation of the ESHMP, regular ad hoc site inspections and internal and formal audits should be undertaken. The key environmental aspects which form the monitoring programme are the following:
| ● | Surface water (quality and quantity) |
| ● | Groundwater (quality and quantity) |
| ● | Air quality and dust |
| ● | Biodiversity |
| ● | Soils, land use, closure and rehabilitation |
| ● | Stockpile management |
| ● | Radiation |
| ● | Cultural heritage resources |
| ● | Waste |
Stakeholder engagement was undertaken during the ESHIA process, supporting an Informed Consultation and Participation (ICP) process that focuses on an in-depth exchange of views and information with affected communities.
Auditing of the ESHMP is imperative to ensure that activities are undertaken in accordance with the objectives and commitments set out in this plan.
| S-K 1300 Technical Report Summary on the Songwe Hill REE Project | Page 373 of 489 |
| |
| 17.14.2 | Rehabilitation and Closure Planning |
A Rehabilitation and Closure Plan (RCP) was compiled as part of the ESHIA process, which included a closure cost estimate (CCE). The RCP also complies with in-country legislation and World Bank criteria, namely the IFC Performance Standards and Equator Principles. It considered the following GIIP:
| ● | Tailings Management: Good Practice Guide (International Council on Mining and Metals [ICMM], 2021) |
| ● | Integrated Mine Closure: Good Practice Guide (ICMM, 2019) |
MKAR aims to establish a safe, stable, and non-polluting, post-mining landscape that is sustainable over the long term while achieving the desired end land use. The landscape must be able to be managed by likely land users after mining.
To support this vision, closure objectives were defined as well as likely, possible, and unlikely end land uses. Also considered in the development of the RCP were closure scenarios and actions, a preliminary mine closure schedule, and preliminary site relinquishment criteria. Monitoring, auditing, and reporting requirements were also detailed.
The initial proposed post-mining land use will consist of a mix of land capabilities that are aligned with the current land uses, including light cultivation, wildlife habitat, and light. A detailed Land Use Plan (LUP) should be developed to ensure a coherent approach to the rehabilitation and restoration of land uses aligned with and complementary to the surrounding land use. The final LUP should be shared with the relevant stakeholders to ensure that their inputs are included in the plan, where applicable, and to attain their buy-in, thereby avoiding potential conflict/misalignment with the surrounding land users after closure.
The RCP and CCE are based on the LOO closure scenario presented in Table 17.3 and the CCE is presented in Section 18.1.32.
| S-K 1300 Technical Report Summary on the Songwe Hill REE Project | Page 374 of 489 |
| |
Table 17.3: LOO Closure Scenario
| Closure Aspect | Year 1 Closure Scenario | Operational Rehabilitation | LOO Rehabilitation |
| Open Pit | N/A | ● Plan for the open pit to remain after closure. Apart from the required operational storm water management measures, no concurrent rehabilitation is foreseen.
● Start berm construction and associated water rerouting depression development once the pit perimeter has reached the planned limits.
|
● Plan for the open pit to remain after closure.
● Construct a berm around the pit perimeter beyond the anticipated breakback line as a barrier to access.
● Develop a dished depression on the outside of the barrier berm to reroute surface water runoff around the pit into the natural catchment and protect the berm against erosion.
|
| TSF | ● Rehabilitate the Phase 1 embankment.
● Remove the liner and rehabilitate the cleared area in the TSF basin.
● Remove the liner from the RWD, shape the basin to be free draining, and rehabilitate the disturbed footprint.
● Use the stockpiled topsoil for rehabilitation, and rehabilitate the cleared footprints once the stockpiled topsoil is removed.
|
Rehabilitate the embankment side slopes as the construction of each phase is competed. | ● Dismantle and remove the TSF ring feed pipelines.
● Dismantle and remove the return water pipeline.
● Pump and treat the pond remaining on the upper surface prior to final rehabilitation.
● Remove the floating barge and associated pipelines and power lines.
● Shape the upper surface to be free draining and to receive the final cover placement.
● Construct an engineered store-and-release cover to reduce oxygen and water ingress to the tailings body as far as possible. The cover should be an optimised configuration of compacted subsoils with a high clay content and final topsoil layer with vegetation establishment.
|
| WRD | N/A | ● Rehabilitate the side slopes that become available for concurrent rehabilitation and will not be further disturbed by operations.
● Construct additional storm water management measures aligned with the final landform design.
|
● Complete final rehabilitation of the upper benches and final upper surface at closure.
● Construct additional storm water management measures to design specifications.
|
| S-K 1300 Technical Report Summary on the Songwe Hill REE Project | Page 375 of 489 |
| |
| Closure Aspect | Year 1 Closure Scenario | Operational Rehabilitation | LOO Rehabilitation |
| Type 2 Material Stockpile | N/A | ● Recover and process the Type 2 material.
● Rehabilitate the infrastructure footprint according to the mine schedule. This could be done during operations.
|
Rehabilitate the remaining stockpile footprint. |
| Accommodation and camps | Dismantle and remove the construction camp, and rehabilitate the disturbed footprint. | Dismantle and remove the construction camp; rehabilitate all the related footprints. | Dismantle and remove the infrastructure related to the mine accommodation remaining at closure, and rehabilitate all footprints. |
| Plant infrastructure | N/A | N/A | Dismantle, decontaminate, and remove all the surface infrastructure related to the plant prior to final rehabilitation of the disturbed footprint. |
| Surface water management dams | Rehabilitate the disturbed footprint only (no surface water impoundments constructed yet). | N/A | Remove and rehabilitate all the surface water impoundments at the end of the LOO. |
| Linear infrastructure | ● Dismantle fencing.
● Rehabilitate gravel roads outside of disturbed footprints (no haul roads constructed yet).
|
N/A | Dismantle and remove the overland conveyor, related access roads, pipelines, power lines and fencing, and rehabilitate all the disturbed areas. |
| S-K 1300 Technical Report Summary on the Songwe Hill REE Project | Page 376 of 489 |
| |
| 17.14.3 | Environmental, Social and Health Management Plan |
The key recommendations and mitigation measures associated with the potential impacts as a result of the proposed Project activities are as follows:
| ● | Ensure continuous monitoring as per the monitoring programme. |
| ● | Develop storm water management structures to ensure effective clean and dirty water separation. |
| ● | Once operations begin, analyse samples of tailings and waste rock material to update the radiation management programme. |
| ● | Undertake training and environmental awareness of mine personnel, contractors and surrounding communities. |
| ● | Manage soil erosion and eradication of alien invasive plants timeously. |
| ● | Implement buffers around wetlands and cultural heritage resources remaining in situ. |
| ● | Undertake concurrent rehabilitation throughout the LOO where possible and maintain topsoil stockpiles for final rehabilitation. |
| ● | Conduct a 100 % socio-economic survey of the impacted households in the Project site to inform the RAP and LRP. |
| ● | Present the result of the ESHIA to stakeholders to obtain further comments and suggestions on the Project. |
| ● | Maintain relationships with stakeholders and implement a community development strategy focused on priority programmes, initiatives, and recruitment and employment policies. MKAR has received an approved (signed off) ESHIA certificate and Mining Development Agreement from the Government of Malawi. The ESHIA has been signed off by the Malawi Environmental Protection Authority. Regular visits and meetings take place with the Songwe Action Group, Chiefs, and community representatives in the area. |
| ● | Continue to implement the grievance mechanism and continuously update the Stakeholder Engagement Plan in line with the changing socio-economic environment. |
| ● | Report and record all monitoring data, which should be utilised to identify areas of potential improvements. Periodic internal and external audits of the ESHMP should be undertaken and amendments should be made where necessary in consultation with government authorities. |
| 17.15 | Waste Management |
The proposed mining and related activities will result in the generation of mineralised waste (TSF and WRDs) as well as non-mineralised waste (general and hazardous waste), which will require effective waste management.
| 17.15.1 | Tailings |
Approximately 20 Mt of tailings will be produced over the LOO and stored in the TSF. The 2022 DFS design process was based on the GISTM. The TSF will be constructed in phases over the LOO.
The TSF management measures will consist of
| ● | A 2,000 µm HDPE liner |
| S-K 1300 Technical Report Summary on the Songwe Hill REE Project | Page 377 of 489 |
| |
| ● | Decant water from the TSF will flow into an RWD with a capacity of 66,000 m3, lined with a 2,000 µm thick HDPE liner to prevent water loss |
| ● | There will be a slurry distribution pipeline along the TSF perimeter, which will measure 4 km |
| 17.15.1.1 | Tailings Deposition and Operational Methodology |
The proposed depositional methodology for the TSF is by conventional spigot/open-ended discharge behind a fully contained valley-type dam concept. This requires that each phase of the TSF embankment be built to its required height prior to commencing with that phase’s associated deposition. Tailings should be deposited into the basin of the TSF by means of open-ended deposition. Prior to the tailings reaching the various toe drains, coarse tailings should be used to cover and further protect the drains. Open-ended deposition shall continue above the covered toe drains to the final elevation of each phase.
Supernatant slurry water and storm water collected on the TSF will be decanted by a floating turret arrangement and pumped back to the plant for reuse as process water. As the pond migrates up the valley, so too does the floating turret. The operational target limit for the pond volume is approximately 5 d of slurry water or a sufficient pond depth (~1.5 m deep) to enable operating and management of the turret.
In the absence of the test work results, the Project decision to line the TSF with a single 2,000 µm HDPE liner was made in accordance with the GISTM.
| 17.15.1.2 | TSF Embankment Construction |
The TSF will be constructed from the waste rock made available from mining operations; therefore, the test work is relevant to the TSF design. The composite samples have insufficient sulphide present (below the limit of 0.3 %) to sustain long-term acid generation if oxidised. Material forming the embankment shall be compacted in layers to form durable embankments and fills of good, regular appearance with all cross sections having the minimum sizes detailed on drawings and having side slopes not steeper than specified. The sides of the embankments and fills must be compacted to hard durable faces.
| 17.15.1.3 | Return Water Dam |
Water from the settled tailings is siphoned off and pumped via return water pumps to the TSF RWD. The water in the RWD will be treated and pumped to the process plant for reuse. All drainage systems for the TSF will flow towards the RWD. Seepage water from the TSF will be collected in a sump and pumped to the RWD.
| 17.15.2 | Waste Rock Dump |
The area to the east of the TSF and northeast of the pit was identified as the preferred location for the WRD and Type 2 material stockpile. The material will be co-disposed on the same facility. The waste rock will be disposed of on the southern portion of the facility, with the Type 2 material on the northern portion. The Type 2 material will be placed up against the waste rock, and the interface marked and surveyed.
| S-K 1300 Technical Report Summary on the Songwe Hill REE Project | Page 378 of 489 |
| |
The WRD will cover a footprint (natural ground) of approximately 36 ha, with a final downstream height of 64 m.
The waste rock has been shown, from the laboratory testing conducted, to be non-acid generating, owing to the abundance of neutralising carbonate minerals and lack of sulphide minerals.
Geochemical recommendations for the disposal considerations of the Songwe Hill waste rock include the following:
| ● | The anticipated runoff arising from the waste rock is not considered to be of high risk due to its lack of acidity and low concentrations of regulated contaminants; however, there is a potential for the waste rock to release elevated alkaline discharges (high pH) with minor concentrations of REEs. Protection of groundwater resources should be prioritised due to their extensive use in the region. An engineered basal liner of compacted in-situ soil or similar is recommended to restrict potential contamination of groundwater. Civil design work will be required once the geotechnical properties of the selected WRD site(s) have been determined. |
| ● | Engineering measures may be necessary to control storm water runoff at the toe of the waste rock facility in catchment paddocks, to prevent uncontrolled runoff. Clean storm water diversion berms/channels will also be required to lead clean water away. |
| ● | Infiltration of rainwater and long residence times of rainwater interacting with waste rock should be avoided as the higher leaching ratio of rock to water leads to higher concentrations of potential contaminants (in particular, REEs). Therefore, pooling or ponding of water on top of the WRDs should be limited (for example, WRDs shaped to encourage rainwater runoff into the catchment paddocks below). |
| ● | If the intention is to release runoff from the WRDs to the environment, then runoff from the WRDs should first be contained and then be evaporated or analysed before release as part of the water monitoring measures to ensure that water runoff meets the regulatory water quality requirements. |
| ● | Should the waste rock be considered for use as acid-neutralising material off site, it is recommended that further kinetic leach testing take place to better understand the long-term contaminant-release profile of the material. |
| 17.15.3 | Type 2 Material Stockpile |
The Type 2 material storage configuration is such that the ore can be reclaimed in the future for processing, should it be deemed feasible at the time. The Type 2 material stockpile will cover a natural ground footprint of approximately 14.7 ha, with a final downstream height of 75 m. The storage capacity of the Type 2 material stockpile is of 7.45 Mm3 or 13.1 Mt of material.
Geochemical characterisation of the Type 2 material has shown that it is non-acid forming due to its low sulphur content (0.01 %) and high acid neutralisation capacity (380 kg CACO3/t).
| 17.15.4 | General Waste |
A 45 m3/h containerised sewage treatment plant will be provided for the treatment and disposal of the sewage generated by the process plant as well as the mining operations. Sewage reticulation piping and manholes will facilitate the flow of sewage under gravity to a collection manhole located adjacent to the sewage treatment plant. The sewage will be pumped via a submersible pump into the containerised treatment plant. The design is based on a standard activated sludge system, where biochemical oxygen demand is broken down using air and bacteria that grow in this medium. This system provides optimised nitrification and an effluent quality to a standard that complies with the requirements of the National Water Policy for the release of treated effluent back into the environment, in accordance with the Water Resources Act (2013).
| S-K 1300 Technical Report Summary on the Songwe Hill REE Project | Page 379 of 489 |
| |
All waste generated will be appropriately separated and stored prior to disposal or recycled where possible to prevent land and water contamination. For hazardous waste, additional measures such as the use of drip trays and ensuring that storage areas are bunded will be employed as a precautionary measure to prevent pollution where hazardous waste is handled. A waste yard facility is proposed within the Project site, located southwest of the TSF. Skips on site will be implemented and collected as and when required for the disposal of waste off site. Separation of waste will allow for the material to be recycled, reused or disposed of in the appropriate facilities.
| 17.15.5 | Management Measures |
An ESMP was created as part of the ESHIA process and provides a description of the mitigation and management options for the identified potential environmental and social impacts associated with the Project. The management measures associated with waste disposal, including control of fuel, chemical and hazardous waste are as follows:
| ● | All storage areas for fuels, paints, oils and other hazardous chemicals used at the construction camp and during construction activities should be appropriately bunded, and spill kits should be in place. |
| ● | Construction workers should be trained in the use of spill kits, to contain and immediately clean up any potential leakages or spills in timely clean-ups. Monitoring must take place at least for three months after the spill occurred to determine contamination, e.g. as a result of ore handling. |
| ● | Maintenance and refuelling of vehicles and machinery should only be undertaken at designated and appropriately designed areas and inspected regularly for leaks. |
| ● | Culverts, roads, conveyors, power lines and river crossings must be maintained, cleared and monitored. |
| ● | An SWMP should already be implemented. This should consider all the wetlands and other watercourses adjacent and downstream of the new developments/infrastructure, which should divert storm water and wastewater away from the surface infrastructure and back into the natural watercourses to maintain catchment yield as far as possible. The SWMP should also convey contaminated water to silt traps to limit contamination of the soils and groundwater |
| ● | Topsoil and subsoil stockpiles should be monitored and vegetated (if possible) to ensure no runoff, erosion, sedimentation and loss of soil fertility. Stockpiles should be on hardened surfaces to prevent leaching of contaminants into the soil and groundwater. |
| S-K 1300 Technical Report Summary on the Songwe Hill REE Project | Page 380 of 489 |
| |
| ● | Care must be taken to ensure that contamination of the receiving environment as a result of mining activities is minimised as far as possible. |
| ● | Chemicals, such as paints and hydrocarbons, should be used in an environmentally safe manner with correct storage as per each chemical’s specific storage descriptions. |
| ● | The TSF should be correctly designed to contain all the material safely, and maintenance should be done to ensure tailings do not enter watercourses or downslope areas. |
| ● | Monitoring boreholes should be installed to ensure that chemicals and contamination are not making their way into the groundwater and surface water systems. |
| ● | Construction of fuel storage facilities as per design requirements (bund walls, storage capacity etc). |
| ● | Emergency response plans need to be in place in the event of an accidental spill of fuel or hydrocarbon resulting in environmental pollution. |
| ● | Correct PPE should be provided with training of correct use. |
| S-K 1300 Technical Report Summary on the Songwe Hill REE Project | Page 381 of 489 |
| |
| 18 | Capital and Operating Costs |
| 18.1 | Capital Costs |
The purpose of this CAPEX estimate is to provide costs to an accuracy of ± 10 % that can be used for the economic analysis of the Songwe Hill REE Project. The CAPEX estimate has been revalidated and updated as of March 2025.
| 18.1.1 | Responsibilities |
The Project’s CAPEX estimate breakdown with associated responsibilities consists of the following:
| ● | Bara – Mining |
| ● | SENET – Process plant and on-site infrastructure and other supporting infrastructure |
| ● | Epoch – Tailings and mine waste management facility |
| ● | MKAR – Owner’s pre-production costs and logistics |
| ● | Digby Wells – Environmental management: resettlement, rehabilitation and closure |
| 18.1.2 | Escalation |
The initial CAPEX estimated as part of the 2022 DFS was priced between the end of 2021 and April 2022. The current CAPEX has been revalidated and updated as of March 2025 based on updated vendor quotations.
| 18.1.3 | Exclusions |
The following were not included in this CAPEX estimate:
| ● | Financing costs |
| ● | Taxes and duties |
| ● | Permits |
| ● | Currency fluctuations |
| 18.1.4 | Exchange Rates |
The costs of the Project are reported in the United States dollar. The exchange rates used in 2022 and 2025 are shown in Table 18.1: Exchange Rates.
Table 18.1: Exchange Rates
| Currency Conversion | Currency Code | Amount 2022 | Amount March 2025 |
| South African Rand to United States Dollar | ZAR/US$ | 15.00 | 18.20 |
| British Pound (GBP) to United States Dollar | £/US$ | 0.70 | 0.77 |
| Euro to United States Dollar | €/US$ | 0.80 | 0.92 |
| South African Rand to Euro | ZAR/€ | 17.00 | 19.68 |
| Canadian Dollar to United States Dollar | CAD/US$ | 1.2 | 1.43 |
| Australian Dollar to United States Dollar | AUD/US$ | 1.25 | 1.59 |
| S-K 1300 Technical Report Summary on the Songwe Hill REE Project | Page 382 of 489 |
| |
| Currency Conversion | Currency Code | Amount 2022 | Amount March 2025 |
| Chinese Yuan to United States Dollar | CNY/US$ | 6.45 | 7.25 |
| Malawian Kwacha to United States Dollar | MWK/US$ | 833 | 1,7199 |
| 18.1.5 | Scope of the Estimate |
The initial CAPEX estimate consists of the direct and indirect costs, including Owner’s costs and contingency costs, to be expended during the implementation phase, which shall extend from the approval by Mkango until the start of the commercial production.
The sustaining CAPEX estimate, which also consists of the direct and indirect costs and the Owner’s costs and contingency costs, covers all the costs to be expended during the period starting at commercial production and extending until the end of the LOO.
The CAPEX (initial and sustaining) qualifies as a Class 2 estimate as per the Association for the Advancement of Cost Engineering (AACE) Recommended Practice 47R-11, with an estimate accuracy of ± 10 %.
| 18.1.6 | Summary of Total CAPEX |
The total initial and sustaining CAPEX for the Songwe Hill Project is estimated to be US$416,974,438, which includes Project execution, engineering, procurement and construction management (EPCM) costs, contingency and sustaining CAPEX. The initial and sustaining CAPEX is summarised in Table 18.2.
Table 18.2: Total CAPEX Summary
| Description | CAPEX (US$) |
Contingency (US$) |
Total CAPEX (US$) |
| Earthworks | 8,151,015 | 776,287 | 8,927,303 |
| Civil Works – Plant | 19,667,422 | 1,873,088 | 21,540,510 |
| Civil Works – Infrastructure | 2,068,686 | 197,018 | 2,265,704 |
| Infrastructure | 2,918,556 | 138,979 | 3,057,535 |
| Structural Steel | 6,345,323 | 423,022 | 6,768,345 |
| Plate Work | 2,658,354 | 177,224 | 2,835,578 |
| Tankage | 4,322,050 | 322,047 | 4,654,097 |
| Machinery and Equipment | 52,477,378 | 2,894,436 | 55,371,814 |
| Piping | 5,404,822 | 557,332 | 5,962,154 |
| Valves | 1,708,249 | 176,150 | 1,884,399 |
| Electricals | 12,266,339 | 676,561 | 12,942,899 |
| Instrumentation | 4,887,810 | 504,019 | 5,391,829 |
| Transport | 5,354,754 | 600,116 | 5,954,870 |
| Electrical and Instrumentation (E&I) Installation | 7,513,682 | 715,589 | 8,229,270 |
| Structural, Mechanical, Plate Work and Piping (SMPP) Installation | 27,828,259 | 2,650,310 | 30,478,569 |
| S-K 1300 Technical Report Summary on the Songwe Hill REE Project | Page 383 of 489 |
| |
| Description | CAPEX (US$) |
Contingency (US$) |
Total CAPEX (US$) |
| TOTAL DIRECT FIELD COSTS | 163,395,391 | 12,869,485 | 176,264,875 |
| Commissioning Spares | 261,004 | 39,151 | 300,155 |
| Two-Year Operational Spares | 1,887,855 | 283,178 | 2,171,033 |
| Insurance and Critical Spares | 2,207,202 | 331,080 | 2,567,541 |
| Vendor Services | 3,102,209 | 465,331 | 3,567,541 |
| First Fills | 644,483 | 96,672 | 741,155 |
| TOTAL INDIRECT FIELD COSTS | 8,102,753 | 1,215,413 | 9,318,166 |
| TOTAL FIELD COST | 171,498,144 | 14,084,898 | 185,583,042 |
| Project Management (EPCM) | 24,438,573 | 3,665,786 | 28,104,359 |
| Insurances and Guarantees | 3,290,594 | 0 | 3,290,594 |
| TOTAL EPCM COSTS | 27,729,167 | 3,665,786 | 31,394,953 |
| TOTAL PROJECT COST | 199,227,311 | 17,750,684 | 216,977,994 |
| Mobile Plant and Equipment | 3,899,263 | 584,889 | 4,484,152 |
| Generator Plant | 7,229,334 | 328,606 | 7,557,940 |
| PV Solar Plant | 13,545,135 | 1,459,305 | 15,004,440 |
| Laboratory | 0 | 0 | 0 |
| Construction Camp | 3,150,217 | 472,533 | 3,622,749 |
| TSF Phase 1 and RWD | 43,814,395 | 4,381,439 | 48,195,834 |
| Mining Pre-Production | 14,428,214 | 2,164,232 | 16,592,446 |
| Other | 12,460,340 | 623,017 | 13,083,357 |
| TOTAL OTHER COST | 98,526,897 | 10,014,022 | 108,540,919 |
| TOTAL INITIAL COST | 297,754,208 | 27,764,705 | 325,518,913 |
| TSF Sustaining Capital – Phases 2 to 5 | 60,236,066 | 6,023,507 | 66,258,573 |
| Mining Sustaining Capital | 532,531 | 79,880 | 612,411 |
| Closure Cost | 16,675,138 | 1,026,618 | 17,701,756 |
| Owner’s Cost | 6,257,078 | 625,708 | 6,882,785 |
| TOTAL SUSTAINING COST | 83,699,813 | 7,755,712 | 91,455,525 |
| TOTAL COST | 381,454,021 | 35,520,417 | 416,974,438 |
| 18.1.7 | Basis of Estimate, Assumptions and Exclusions |
The CAPEX estimate for the Songwe Hill Project has been derived from information collated from the following technical design documents:
| ● | LOO pit production schedule, including stockpiling operations |
| S-K 1300 Technical Report Summary on the Songwe Hill REE Project | Page 384 of 489 |
| |
| ● | LOO processing plan |
| ● | Mine haul road designs and layouts |
| ● | Mining equipment lists |
| ● | Process plant design criteria |
| ● | General layouts of the process plant and related infrastructure |
| ● | Waste facility and surface water management development schedule and operations |
| ● | Process flow diagrams |
| ● | Process plant equipment data sheets and lists |
| ● | Process plant piping and instrumentation diagrams (P&IDs) |
| ● | Process plant line, valve, and instrument lists |
| ● | Electrical single-line diagrams (SLDs) and motor lists |
| ● | Electrical reticulation routes |
| ● | Various discipline material take-offs (MTOs) |
| ● | Quotations from vendors on mechanical and/or process equipment |
| ● | Quotations from vendors on main construction contracts |
| ● | EPCM schedule |
| ● | In-house historical databases |
The following assumptions were made in the preparation of this estimate:
| ● | The LOO is 18 years. |
| ● | There will be a smooth transition between the various Project implementation phases. |
| ● | Topography, Geotechnical and Materials: |
| o | A 2 m deep soil improvement was assumed below all the earthworks platforms. |
| o | All the required fill material was assumed to be available within a 2 km radius, from either necessary excavations or designated borrow pits. |
| o | No piling allowance has been included in the estimate. |
| o | For the intermediate and hard rock excavations, 20 % and 15 % of the bulk excavations volume was allowed for, respectively. |
| o | Allowance was made for grading of the PV plants to a maximum gradient of 14 %. This was done to allow for the axial movement of the panels. |
| o | The process water pond and events pond were considered to have double HDPE liner systems while the raw water pond was considered to have a single HDPE liner system. All the relevant geotextiles and installation of the systems were included. |
| o | The ROM wall was included as a mechanically stabilised earth wall with a gabion face. It was assumed that the gabion rock for that wall face would be locally available, either from site or from commercial sources. |
| o | Excavated material will be non-acid generating. |
| o | No additional topographical studies were made available; therefore, the structural design was not modified. |
| o | The structural design assumptions were not modified after reviewing the geotechnical report that became available after the initial assumptions had been made. |
| S-K 1300 Technical Report Summary on the Songwe Hill REE Project | Page 385 of 489 |
| |
| ● | Construction: |
| o | The various construction discipline work will be executed as an EPCM contract. |
| o | The Project schedule for the process plant is estimated to have a duration of 30 months from Project award. This excludes prior construction of the access roads and resettlement plan implementation. |
| o | There will be proper communication and cooperation by all the construction contractors. |
| o | There will be no shortage of skilled trades workers throughout the entire construction phase, including the early works phase. Hence, there is no provision for salary increases potentially necessary to attract skilled trades workers. |
| o | Labour considers the remoteness of the Songwe Hill Project, i.e. 60 h per week will be paid at regular time, the overtime hours per week will be paid at time and one half (× 1.5), and all public holiday overtime hours per week will be paid at double the base wage (× 2). |
| o | The construction contractors’ facilities will be located within a maximum of 30 min walking distance from any working point for the whole duration of the Songwe Hill Project implementation. |
| o | The construction site will be accessible 24 h/d and 7 d/week with adequate safety supervision. |
| o | There will be no work disruption resulting from inadequate accommodation and/or catering services. |
| o | All unskilled and semi-skilled workers will be recruited locally. |
| o | At least 50 % of the skilled workers will be recruited locally. |
| o | All workers accommodated in the construction camp will be provided with three meals per day. |
| o | All other workers will be provided with daily lunch while on site. |
| o | The construction contracts will be of the unit-rate type, cost-plus type, or lump-sum/turnkey type; the estimate does not allow for construction contracts of the time-and-material type. |
| o | All the contractors will provide their own administration offices for the full duration of the construction phase. |
| o | Power from the Escom grid will be made available at least three months before the start of commissioning, and the use of temporary fuel-powered generators will not be required. |
| o | There will be no rework to field-erected and installed equipment and material, resulting from a quality assurance/quality control (QA/QC) inspection. |
| ● | Design and Measurement: |
| o | The mine open-pit access consists of only one ramp. |
| o | Transfer of tailings to the waste facility will be via piping, and transfer of waste from the open pits will be via haul trucks. |
| o | Piping was measured from the P&IDs and plant layout drawings |
| o | Instruments were measured from the P&IDs. |
| ● | The fuel cost is US$1.124/L. |
| ● | The peak power cost is US$0.1827/kWh (from Escom). |
| S-K 1300 Technical Report Summary on the Songwe Hill REE Project | Page 386 of 489 |
| |
| ● | Transportation of people will be via commercial airlines, i.e. no chartered flights. |
The following are excluded from this estimate:
| ● | Taxes and duties (they form part of the financial model) |
| ● | Risk provision, including costs pertaining to mitigation plans |
| ● | Escalation beyond the March 2025 base date |
| ● | Work stoppage resulting from labour disputes |
| ● | Work stoppage resulting from community relations disputes |
| ● | Any and all scope changes |
| ● | Any and all costs beyond commissioning completion |
| ● | Delays resulting from the following: |
| o | Permitting issues |
| o | Certificate issues |
| o | Project financing |
| o | Project approval |
| o | Agreements with claims owners |
| 18.1.8 | Mining Capital Costs |
| 18.1.8.1 | Estimating Methodology |
The cost estimation for the Songwe Hill Project is based on designs, costs and information as of March 2025. All monetary values are presented in US dollars and in real money terms, free of escalation or inflation.
The CAPEX estimate has been determined through the application of enquiry quotations, budget quotations, database costs and estimated costs to bills of quantities, material take-offs and estimate quantities. Most of the CAPEX is related to the mine design and mine plan, the quantities of which were computationally modelled and scheduled in three-dimensional space. Other costs relate to specific engineering designs, for which drawings have been produced and quantities have been generated from these drawings. This strategy is applicable for a feasibility study.
Some of the budget prices were obtained in South African rands (ZAR). These were converted to USD at an exchange rate of 1 USD = 18.20 ZAR.
| 18.1.8.2 | Estimate Exclusions |
The CAPEX estimate does not make provision for any environmental or closure costs related to the infrastructure or mine plan. No provisions have been allowed for escalation of any costs.
| 18.1.8.3 | Mining Capital Cost Breakdown |
CAPEX has been defined as the cost of all infrastructure and constructions for the mining operation within the mine site. CAPEX is all the costs incurred from Project initiation to the commencement of ore mining.
| S-K 1300 Technical Report Summary on the Songwe Hill REE Project | Page 387 of 489 |
| |
| 18.1.8.3.1 | Infrastructure Capital Costs |
Table 18.3 is a summary of the mining infrastructure CAPEX.
Table 18.3: Mining Infrastructure Capital Costs
| Work Breakdown Structure (WBS) |
Mining Operations Infrastructure | CAPEX (US$) |
Comment |
| 1.1 | Contractors | 3,752,246 | Includes transportation contractor costs and monthly preliminary and general (P&G) costs for the established plant infrastructure contractors. |
| 1.2 | Site Preparation | 280,388 | Costs for the terracing for the Mining Contractor’s infrastructure area. |
| 1.3 | Prefabricated Buildings and Furniture | 377,212 | Costs for the various prefabricated mining-related buildings and furnishings. |
| 1.4 | Local Reticulation and Civil Works | 427,000 | Cost for power, water and wastewater reticulation within the MIA. |
| 1.5 | Workshop | 294,796 | Cost for the structural steel building with its civil works and 10 t overhead crane. |
| 1.6 | Wash bay | 84,071 | Cost for a wash bay with its ancillary items including tanks, oil skimmer, bio reactor and pumps. |
| 1.7 | Lubrication System | – | Included in Mining Contractor’s supply. |
| 1.8 | Parking | 11,622 | Parking with shade netting for light duty vehicles (LDVs). |
| 1.9 | Control Room | 5,916 | A container unit. |
| 1.10 | Brake Test Ramp | 10,516 | – |
| 1.11 | Emulsion Silo | 12,758 | Provision for civil works and fencing. Silo to be provided by Mining Contractor. |
| 1.12 | Control and Instrumentation, IT | 243,243 | Provision for server and computer equipment. |
| 1.13 | Explosives Bunker | 95,824 | Two fenced bunkers. |
| 1.14 | Surface Vehicles | – | Included in Mining Contractor’s supply. |
| 1.15 | Pit Dewatering | 484,402 | Dewatering from the pit into a tank located at the primary crusher. |
| 1.16 | Roads and Waste Dump | 2,944,529 | Truck haul roads from the mining pit to the waste dump, ROM tip, MIA and explosives bunker. Construction of the waste dump and low-grade stockpile foundations and ancillary works. |
| Total Cost | 9,024,524 |
| S-K 1300 Technical Report Summary on the Songwe Hill REE Project | Page 388 of 489 |
| |
| 18.1.8.3.2 | Direct Mining Capital Costs |
Table 18.4 summarises the direct mining CAPEX. This cost is made up of the Mining Contractor’s costs prior to the commencement of ore mining as well as the Owner’s team costs relating to the mining operation during this period.
Table 18.4: Summary of Direct Mining Capital Costs
| WBS | Area | CAPEX (US$) | Comment |
| 1.1 | Mining Contractor | ||
| 1.1.1 | Site Establishment | 1,570,405 | Contractor site establishment |
| 1.1.2 | Site Disestablishment | 532,531 | Contractor disestablishment at end of contract |
| 1.1.3 | Time-Related Costs | 407,210 | Contractor monthly fees |
| 1.1.4 | Clear and Grub | 490,770 | Clear and grub pit area |
| 1.1.5 | Waste Mining | ||
| 1.1.5.1 | Waste Drill and Blast | 381,629 | Pre-strip |
| 1.1.5.2 | Waste Haul | 1,058,610 | Pre-strip |
| 1.17 | Owner’s Cost | ||
| 1.17 | Manpower | 307,000 | Owner’s team cost prior to ore mining |
| 1.17 | Consumables | 60,000 | Owner’s team cost prior to ore mining |
| Total Mining CAPEX | 4,808,156 |
| 18.1.8.3.3 | Indirect Capital Costs |
EPCM costs were provided for by allowing for 12.5 % of the surface infrastructure CAPEX.
The indirect CAPEX is summarised in Table 18.5.
Table 18.5: Summary of Indirect Capital Costs
| Area | Cost (US$) |
| EPCM | 1,128,065 |
| Contingency | 2,244,112 |
| Total | 3,372,177 |
| 18.1.8.4 | Capital Cost Summary |
The total CAPEX related to mining and the mine support infrastructure is given in Table 18.6.
Table 18.6: Capital Cost Summary
| Item | Cost (US$) |
| Mining CAPEX | |
| Site establishment | 1,570,405 |
| Site disestablishment | 532,531 |
| Time-related costs | 407,210 |
| Clear and grub | 490,770 |
| Waste drill and blast | 381,629 |
| S-K 1300 Technical Report Summary on the Songwe Hill REE Project | Page 389 of 489 |
| |
| Item | Cost (US$) |
| Waste haul | 1,058,610 |
| Owner’s cost: | |
| Manpower | 307,000 |
| Consumables | 60,000 |
| Infrastructure Development | |
| Terraces | 2,648,240 |
| Civil works | 1,718,169 |
| Prefabricated buildings | 383,128 |
| Services | 526,243 |
| Workshops | 214,426 |
| Emulsion silo | 9,562 |
| Explosives storage | 95,824 |
| Surface mining roads | 219,828 |
| Pit dewatering infrastructure | 484,402 |
| Waste dump footprint and waterways | 2,724,701 |
| EPCM | 1,128,065 |
| Contingency | 2,244,112 |
| Total CAPEX | 17,204,856 |
| 18.1.8.5 | Capital Cost Cash Flow |
The CAPEX was scheduled according to the implementation schedule. Figure 18.1 shows the monthly CAPEX scheduled over time, where the orange bars indicate the monthly spend, and the blue bars indicate the cumulative cost.
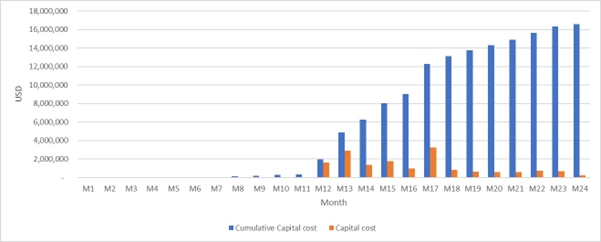
Figure 18.1: Scheduled Capital Cost
| S-K 1300 Technical Report Summary on the Songwe Hill REE Project | Page 390 of 489 |
| |
| 18.1.9 | Process Plant and Infrastructure Capital Costs |
As per the CAPEX summary in Section 18.1.6, the process plant and related infrastructure are subdivided into various CAPEX categories:
| ● | Main contracts, e.g. earthworks, civil works, SMPP and E&I |
| ● | Supply-only contracts, e.g. structural steel, plate work, machinery and equipment, piping, valves, instrumentation, and electrical equipment that will be procured by the EPCM Contractor on behalf of MKAR and free-issued to the respective main contractors for erection/installation |
| ● | Supply and install contracts, e.g. prefabricated buildings and assay laboratory |
| 18.1.10 | Main Contracts |
Main contracts mean contractors performing work on site and include the following:
| ● | Earthworks contract |
| ● | Civil works contract |
| ● | SMPP works contract |
| ● | E&I works contract |
All of the main contractors will be responsible for their own supply of construction power as the Escom grid main power switchyard will only be commissioned during the process plant commissioning phase.
| 18.1.10.1 | Earthworks Contract |
The main contract scope for the earthworks contract was derived from the calculated bill of quantities (BOQ). The quantities, in turn, were derived from earthworks terrace drawings and accompanying long sections. It should be noted that the geotechnical report was not available at the time of making the design assumptions. All the assumptions were however reviewed against the recommendations made in the report once it became available, and no changes were made because of the geotechnical report results.
The earthworks enquiry was reissued to the contractor selected during the 2022 DFS and includes the P&G costs and contractual conditions against which the contractor quoted. Fully inclusive updated wet rates and plant/labour histograms were received and adjudicated accordingly.
The earthworks quantities are summarised in Table 18.7.
Table 18.7: Earthworks Quantities
| Earthworks | Unit | Quantity |
| Area 1: Plant Platforms | ||
| Clearing and Stripping of Site | ha | 7 |
| Removal of Soil and Excavations | m³ | 268,906 |
| Fill and Soil Improvements | m³ | 162,303 |
| S-K 1300 Technical Report Summary on the Songwe Hill REE Project | Page 391 of 489 |
| |
| Earthworks | Unit | Quantity |
| Area 2: Crushing, Milling and Conveyor Lines | ||
| Clearing and Stripping of Site | ha | 1 |
| Removal of Soil and Excavations | m³ | 14,688 |
| Fill and Soil Improvements | m³ | 39,214 |
| Mechanically Stabilised Earth Wall | m2 | 975 |
| Area 3: PV Plants | ||
| Clearing and Stripping of Site | ha | 43 |
| Removal of Soil and Excavations | m³ | 99,747 |
| Fill and Soil Improvements | m³ | 5,397 |
| Road Sub-base | m³ | 1,943 |
| Area 4: Ponds, Storm Water Structures and Perimeter Fencing | ||
| Clearing and Stripping of Site | ha | 5 |
| Removal of Soil and Excavations | m³ | 32,980 |
| Fill and Soil Improvements | m³ | 10,653 |
| Area 5: Construction Camp, Fuel Depot and Roadways | ||
| Clearing and Stripping of Site | ha | 4 |
| Removal of Soil and Excavations | m³ | 56,777 |
| Fill and Soil Improvements | m³ | 52,527 |
| Road Sub-base | m³ | 3,676 |
| 18.1.10.2 | Civil Works Contract |
The main contract scope for the process plant and peripheral infrastructure civil works was based on a detailed BOQ derived from civil outline drawings, mechanical general arrangement drawings, and the site block plan.
The scope of work for the process plant on- and off-site infrastructure civil works includes the following:
| ● | Reinforced concrete foundations for the support of mechanical equipment, structural steelwork, and plate work |
| ● | Reinforced concrete surface beds and bund walls with trenches and sumps to contain spillages within the terraced areas |
| ● | Site storm water drainage including a network of concrete lined V-drains |
| ● | Reinforced concrete foundations for the containerised MCCs and other process electrical infrastructure |
| ● | Brickwork for transformer bay buildings |
| ● | Sewerage reticulation for the process plant |
All the civil materials of construction are included in the Civil Contractor’s scope of supply (cement, reinforcement, formworks, mesh, hold-down bolts, bricks, etc.).
| S-K 1300 Technical Report Summary on the Songwe Hill REE Project | Page 392 of 489 |
| |
The civil works enquiry was reissued to the contractor selected during the 2022 DFS and includes the P&G costs and contractual conditions against which the contractor quoted. Fully inclusive updated wet rates and plant/labour histograms were received and adjudicated accordingly.
The civil works quantities are summarised in Table 18.8.
Table 18.8: Civil Works Quantities
| Civil Works | Unit | Quantity |
| Process Plant and On-Site Infrastructure Civil Works | ||
| Excavation for Restricted Foundations | m³ | 18,235 |
| Import and Compact Backfill | m³ | 6,021 |
| 30 MPa Concrete Structures | m³ | 17,584 |
| 15 MPa Concrete and Blinding Layers | m³ | 580 |
| Reinforcement Steel | t | 1,342 |
| Mesh | m2 | 22,350 |
| Fencing | m | 4,525 |
| Peripheral (MIA) and Off-Site Infrastructure Civil Works | ||
| Excavation for Restricted Foundations | m³ | 4,315 |
| Import and Compact Backfill | m³ | 800 |
| 30 MPa Concrete Structures | m³ | 2,838 |
| 15 MPa Concrete and Blinding Layers | m³ | 96 |
| Reinforcement Steel | t | 160 |
| Mesh | m2 | 4,016 |
| Number of holes to be drilled (with a diameter of 350 mm and depth of 1,600 mm) for the installation of steel profiles and to be backfilled with concrete | 2,200 | |
| Number of steel profiles to be rammed to a depth of 1,500 mm | 6,931 | |
| Fencing | m | 13,685 |
| 18.1.10.3 | SMPP Works Contract |
The process plant and peripheral infrastructure SMPP works main contract scope was based on a detailed BOQ derived from general arrangement drawings, P&IDs, and details of the free-issue mechanical equipment.
The SMPP works enquiry was reissued to the contractor selected during the 2022 DFS. The enquiry included detailed P&G cost lists and contractual conditions against which the contractor quoted. Fully inclusive updated rates and plant/labour histograms were received and adjudicated accordingly. MKAR will provide accommodation for the expatriate workforce. This will include three meals and laundry services. It must be noted that only a limited number of beds are available and will be allocated proportionally to all the construction contractors. No accommodation will be provided to local employees.
| S-K 1300 Technical Report Summary on the Songwe Hill REE Project | Page 393 of 489 |
| |
| 18.1.10.4 | E&I Works Contract |
The process plant and peripheral infrastructure E&I works main contract scope was based on a detailed BOQ derived from the process plant and infrastructure layout drawings, process plant general arrangement drawings, electrical SLDs, MEL, and motor list.
The E&I works enquiry was reissued to the contractor selected during the 2022 DFS. SENET has its own team that performs site E&I construction work, referred to as SENET’s self-build option. The enquiry included P&G cost lists and contractual conditions against which the contractor quoted. Fully inclusive updated rates and plant/labour histograms were received and adjudicated accordingly. MKAR will provide accommodation for the expatriate workforce. This will include three meals and laundry services. It must be noted that only a limited number of beds are available and will be allocated proportionally to all the construction contractors. No accommodation will be provided to local employees.
The electrical supply reticulation to the respective infrastructure buildings is included in the electrical, control and instrumentation (E, C&I) contract.
| 18.1.11 | Supply-Only Contracts |
| 18.1.11.1 | Mechanical Equipment |
The mechanical equipment quantities were derived from the equipment lists and process flowsheets and datasheets. The mechanical scope of work for the Project is to supply the equipment as detailed in the MEL, mechanical data sheets, and mechanical drawings.
Enquiries were prepared, inclusive of equipment data sheets, and sent to equipment vendors/suppliers pre-approved by Mkango and selected during the 2022 DFS. The updated quotations were commercially and technically adjudicated.
| 18.1.11.2 | Structural Steel |
Quantities were established based on MTOs derived from plant general arrangement drawings produced during the 2022 DFS. Unit rates for supply and fabrication were obtained from fabricators and were applied to the MTOs.
The respective rates were applied to the bill of materials for the following equipment:
| ● | Structural steelwork |
| ● | Plate work |
| ● | Liners |
| ● | Grating and flooring |
| ● | Handrailing |
| ● | Sheeting |
| S-K 1300 Technical Report Summary on the Songwe Hill REE Project | Page 394 of 489 |
| |
Steelwork quantities are given in Table 18.9.
Table 18.9: Process Plant Steelwork Quantities
| SMPP Works | Material Grade | Unit | Quantity |
| Steelwork Structures – Light | S355JR | t | 908.07 |
| Steelwork Structures – Medium | S355JR | t | 367.15 |
| Steelwork Structures – Heavy | S355JR | t | 144.18 |
| Plate Work | S300JR | t | 327.88 |
| Take-Up Counterweight | S300JR | t | 20.78 |
| Liners | VRN500 | t | 233.25 |
| Grizzly | VRN500 | t | 15.53 |
| Liners | Rubber | m² | 400.53 |
| Handrailing | MS | m | 5,431.84 |
| Grating | MS | m² | 4,053.54 |
| Number of Stair Treads | MS | 1,517.73 | |
| Guards | Clearview | m² | 386.30 |
| Guards | VEM6318F | m² | 423.01 |
| Cladding – Roof | MS | m² | 2,185.67 |
| Cladding – Conveyor | MS | m² | 1,387.01 |
| Cladding – Conveyor (2.68 m long, dog house sheets) | MS | m | 780.47 |
| Cladding – Side | MS | m² | 4,159.50 |
| Structural Bolts | GR8.8 | t | 41.80 |
| Anchor Bolts | GR4.6 | t | 14.15 |
| 18.1.11.3 | Plate Work |
The plate work scope of work entails shop detailing, supply, manufacturing, inspection, and corrosion protection of plate work in the form of tanks as per the tank schedule. The updated unit rates for supply and fabrication were obtained from the fabricator selected during the 2022 DFS and were applied to the tank schedule to estimate the plate work cost.
The tank schedules (carbon steel, stainless-steel and fibreglass reinforced plastic (FRP)) were developed.
| 18.1.11.4 | Piping and Valves |
The piping and valves scope of work entails the supply, manufacturing, inspection, and corrosion protection of the piping and valves as per the BOQs. The updated unit rates for supply and fabrication were obtained from the fabricator selected during the 2022 DFS and were applied to estimate the piping and valves supply costs.
The piping, fittings and valves BOQs were developed.
| S-K 1300 Technical Report Summary on the Songwe Hill REE Project | Page 395 of 489 |
| |
| 18.1.11.5 | Electrical Equipment |
The process plant, mining and peripheral infrastructure electrical equipment detailed BOQ was derived from layout drawings, process plant general arrangement drawings, electrical SLDs, MEL, and motor lists.
The electrical equipment includes the following:
| ● | MV switchgear |
| ● | Step-down transformers |
| ● | MCCs |
| ● | LV and MV cables |
| ● | Cable racking, luminaires, and earthing |
| ● | Power factor correction units |
| ● | Emergency power system |
Electrical equipment supply enquiries were prepared, inclusive of equipment data sheets, and sent to equipment vendors/suppliers selected during the 2022 DFS. The quotations were commercially and technically adjudicated.
The electrical equipment BOQ was developed.
| 18.1.11.6 | Process Control (Control and Instrumentation (C&I)) |
The process plant includes the implementation of a process automation system (PAS). The PAS comprises a supervisory control and data acquisition (SCADA) system, programmable logic controllers (PLCs), and instrumentation. The SCADA and PLC equipment will be located in the plant control rooms and the equipment rooms located adjacent to the plant control rooms.
A security system, including CCTV cameras and access control to site, will also be provided.
The communications system, consisting of an office local area network (LAN), satellite link for Internet and email, telephone, and radio systems, will be provided by MKAR.
The PLC and SCADA costs were based on a typical plant configuration with full plant control from a central control room. Provision was also made for a sequel server for constant data logging and trending.
Instrumentation costs were based on instrument and valve lists. The instrumentation BOQ was developed from data derived from the P&IDs, as well as the instrument list and the instrumentation drawings.
Dedicated remote input/output (I/O) panels, located in the specific plant areas, are utilised to connect the field instruments to the PLC. Digital instruments are wired to the remote I/O panel via multipair cables. Analogue instruments are connected to the remote I/O panels via a Profibus PA network.
The C&I equipment BOQ was developed.
| S-K 1300 Technical Report Summary on the Songwe Hill REE Project | Page 396 of 489 |
| |
| 18.1.12 | Supply and Install Contracts |
The supply and install contracts include the following:
| ● | Prefabricated plant buildings |
| ● | Pre-engineered steel and cladded infrastructure buildings |
| ● | Mine/plant assay laboratory |
| ● | Prefabricated off-site infrastructure and camp buildings |
All of the supply and install contractors will be responsible for their own supply of construction power as the Escom grid main power switchyard will only be commissioned during the process plant commissioning phase.
| 18.1.12.1 | Prefabricated Plant Buildings |
The following infrastructure buildings will be supplied as prefabricated buildings:
| ● | On-site process plant infrastructure: |
| o | Change house building |
| o | Office buildings (two) |
| o | Gatehouse building |
| o | Weighbridge control room |
| o | Process plant control rooms (two) |
| o | Metallurgical and assay laboratory |
| o | Clinic |
| o | Ablution facility |
| ● | Off-site infrastructure: |
| o | Accommodation facility |
The prefabricated building package includes the supply and site installation of the buildings, including all the furniture, internal electrical reticulation and fittings, all internal water reticulation, plumbing, sanitary fittings, extraction, and air conditioning.
The Prefabricated Building Contractor has allowed for the relevant P&G costs for the installation of the buildings. MKAR will provide accommodation for the expatriate workforce. This will include three meals and laundry services. It must be noted that only a limited number of beds are available and will be allocated proportionally to all the construction contractors. No accommodation will be provided to local employees.
A supply and installation enquiry package was reissued to the vendor selected during the 2022 DFS to update their proposal for the prefabricated buildings. The proposal was adjudicated accordingly.
The CAPEX for the site clearance and terracing for the infrastructure buildings is included in the earthworks contract.
The CAPEX for the concrete foundations, floor slabs, sewer reticulation and drainage systems is included in the civil works contract.
| S-K 1300 Technical Report Summary on the Songwe Hill REE Project | Page 397 of 489 |
| |
The CAPEX for the electrical switchgear and MCCs is included in the electrical CAPEX.
The electrical supply reticulation to the respective infrastructure buildings is included in the E, C&I contract.
| 18.1.12.2 | Pre-Engineered Steel Buildings |
The following pre-engineered structural steel buildings will be supplied:
| ● | Workshop |
| ● | Main store |
| ● | Reagents store |
| ● | Final product store |
| ● | Air buildings |
| ● | Blower building |
The pre-engineered steel building package includes the design, fabrication, and supply of the steel buildings.
A design, fabrication and supply enquiry package was reissued to the vendor selected during the 2022 DFS to update their proposal for the pre-engineered steel buildings. The proposal was adjudicated accordingly.
The CAPEX for the site clearance and terracing for the pre-engineered steel building is included in the earthworks contract.
The CAPEX for the concrete foundations, floor slabs and drainage systems is included in the civil works contract.
The site installation of the structural steel buildings is included in the SMPP CAPEX.
The CAPEX for the electrical switchgear and MCCs, and all internal electrical reticulation, lighting and fittings is included in the electrical CAPEX.
The electrical supply reticulation to the respective infrastructure buildings is included in the E, C&I contract.
| 18.1.12.3 | Mine/Plant Assay Laboratory |
The assay laboratory package includes the supply, installation, and ultimately the operation of the assay laboratory. The supply includes all the laboratory equipment, furniture, and fixtures. This cost is reflected in the OPEX as a monthly allowance.
A second separate package includes the supply of the pre-populated modularised building arrangements. This building includes all internal electrical reticulation and fittings, all internal water reticulation, plumbing, sanitary fittings, and air conditioning. This is reflected in the CAPEX.
The concrete foundations and floor slab will be provided by the Civil Contractor.
The Assay Laboratory Contractor has allowed for the relevant P&G costs for supervision during erection of the contractor-supplied buildings.
| S-K 1300 Technical Report Summary on the Songwe Hill REE Project | Page 398 of 489 |
| |
The supply and install enquiry package was reissued to the vendor selected during the 2022 DFS to update their proposal for the assay laboratory. The proposal was adjudicated accordingly.
Electrical supply to the laboratory is included in the E, C&I contract.
| 18.1.12.4 | Prefabricated Off-Site Infrastructure and Camp Buildings |
The prefabricated building package includes the supply and site installation of the buildings, including all internal electrical reticulation and fittings, all internal water reticulation, plumbing, sanitary fittings, and air conditioning.
The concrete foundations, floor slab and connection to external sewerage reticulation and potable water will be provided by the Civil Contractor.
The Prefabricated Building Contractor has allowed for the relevant P&G costs for the installation of the buildings, including the supply of their own tented construction camp.
The supply and installation enquiry package was reissued to the vendor selected during the 2022 DFS to update their proposal for the prefabricated buildings. The proposal was adjudicated accordingly.
| 18.1.13 | Engineering, Procurement and Construction Management (EPCM) |
Engineering, project management and drawing office man-hours are based on the estimated number of man-hours required to complete the detailed design of the Project. Unit rates for man-hours represent actual rates currently being charged on similar projects.
Site construction management is based on a highly skilled team of engineers and site staff who will supervise the construction crew’s activities. This part of the estimate assumes that construction will be subcontracted to earthworks, civil works, SMPP and E&I construction companies. This, however, requires a higher level of supervision on the part of the EPCM Contractor and Owner’s representative.
| 18.1.14 | First Fills |
The first-fill costs for the ball and regrind mills were developed from first principles. These were defined as those costs incurred prior to commissioning in preparing the circuit to accept ore. These costs included the addition of steel balls (various sizes) to the ball mills and ceramic media to the regrind mill to design charge levels.
The costs for the first fills as required for the balance of the mechanical equipment are included in the respective machinery and equipment CAPEX.
The first-fill costs for the reagents and diesel for the mining fleet are included in the first three months’ OPEX allowance.
| S-K 1300 Technical Report Summary on the Songwe Hill REE Project | Page 399 of 489 |
| |
The first-fill costs for the project are summarised in Table 18.10.
Table 18.10: First-Fill Cost Summary
| Description | CAPEX (US$) |
Contingency (US$) |
Total
CAPEX (US$) |
| Ball Mill | 245,769 | 36,865 | 282,635 |
| Sulphuric Acid Plant | 38,500 | 5,775 | 44,275 |
| Sodium Hydroxide | 42,620 | 6,393 | 49,013 |
| Calcium Chloride | 19,513 | 2,927 | 22,440 |
| Fine Grind Mill | 298,080 | 44,712 | 342,792 |
| First-Fill Totals | 644,483 | 96,672 | 741,155 |
| 18.1.15 | Contingency |
A study accuracy, or contingency, analysis considered the confidence of the process design, engineering design, the quantities, and the rates for each discipline as shown in the capital estimate summary. An estimating confidence rating was applied with a corresponding percentage to each category mentioned.
An average contingency of 9.3 % has been allowed for to cover items that are included in the scope of work but that cannot be adequately defined at this stage due to the level of engineering conducted during the study and a subsequent absence of detailed design and procurement information.
The average contingency of 9.3 % was derived mathematically and is affected by the design and procurement confidence contingency values that were attributed to each of the respective CAPEX categories:
| ● | Structural steel, plate work and tankage: 7 % (steel price fluctuation) |
| ● | Mechanical equipment and electrical: 6 % (updated budget estimate quotations) |
| ● | Infrastructure: 5 % (updated budget estimate quotations) |
| ● | Earthworks, civil, piping, valves, instrumentation, E&I installation, and SMPP installation: 10 % (updated budget estimate quotations) |
| ● | Balance of the cost categories, including transport and civil: 11 % (infrastructure updated based on level of engineering) |
| 18.1.16 | Vendor Services |
The cost for vendor services includes all the items where the presence of the vendor is required during the construction phase in order for guarantees to be honoured. It also includes items where construction supervision is required, particularly for the installation of the large and/or critical equipment items. The updated costs are based on actual quotes obtained from the respective vendors.
| 18.1.17 | Freight |
The freight costs for the Project are based on the actual mass of the mechanical equipment, the mass of the structural steelwork as generated in the respective MTOs, and the calculated mass of piping and valves as contained in the respective BOQs. Updated quotes were obtained from local freight forwarders.
| S-K 1300 Technical Report Summary on the Songwe Hill REE Project | Page 400 of 489 |
| |
Most of the rates utilised in the freighting cost have been obtained from third-party service providers and statutory agencies involved in the management of shipments and documentation. Rates offered by these bodies are subject to change without notice and, therefore, cannot be held as fixed and firm. The contractor will have to negotiate these increases on an ad hoc basis with MKAR as and when they arise, fully supporting the application with documentary evidence of such increases.
| 18.1.18 | Power Plant |
The 132/11 kV switchyard and overhead transmission power line to the plant will be provided by the local Malawian grid power producer – Escom. This includes the switchyard inside the process plant area.
Site preparation of the required terrace area for the 132/11 kV switchyard to be built by others is accounted for in the earthworks CAPEX.
An outline of the electrical power demand is shown in Table 18.11, based on the MEL and plant infrastructure.
Table 18.11: Project Electrical Power Demand
| Project Load | Continuous Power Demand (kW) | Maximum Start-Up Demand (kW) |
| Process Plant | 20,201 | – |
| Off-Site Infrastructure | 1,447 | – |
| Camps | 418 | – |
| Ball Mill | 3,004 (3,400a) | 4,640 |
| Total | 25,071 | |
| a Rated | ||
In addition to the Malawian Escom national power grid, a PV plant will be installed as a secondary source of power. The Escom grid will predominantly be used during the night-time while the PV plant will be used when the solar conditions are favourable. More information on the PV plant is included in Section 15.
| 18.1.19 | Fuel Supply Depot |
The diesel fuel storage facilities will hold a 210 m3 total capacity, which will be operated by the Fuel Supply Contractor.
The CAPEX for the site clearance and fencing for the terrace for the diesel fuel farm and mining fleet refuelling station is included in the earthworks contract.
| S-K 1300 Technical Report Summary on the Songwe Hill REE Project | Page 401 of 489 |
| |
The CAPEX for the concrete foundations, floor slabs, catch pits and drainage systems is included in the civil works contract.
The CAPEX for the dispensing station control room prefabricated building, furniture, fixtures, internal electrical reticulation and electrical fittings, and the necessary fire protection foam systems, is included in the Fuel Supply Contractor’s Scope.
The CAPEX for the electrical switchgear and MCCs is included in the electrical CAPEX.
The electrical supply reticulation to the fuel depot is included in the E, C&I contract.
Erection of the fuel storage tanks and dispensing systems is included in the respective supply contracts. Raw and potable water will be supplied to a central point, and the reticulation thereof will be in the respective supply contracts’ scope of works.
| 18.1.20 | Spares |
Commissioning spares were allowed for in the CAPEX. The updated spares costs were obtained from vendor quotations.
Three categories of spares were considered and included in the initial CAPEX and OPEX:
| ● | Commissioning spares |
| ● | Two-year operating spares |
| ● | Insurance and critical spares |
| 18.1.21 | Insurances |
The EPCM Contractor will be responsible for the necessary insurance related to workmen’s compensation for their supervisory personnel on site.
The EPCM Contractor’s subcontractors for the SMPP installation, electrical services installation, and process control installation will be responsible for the workmen’s compensation insurance cover for their personnel in their respective engagements.
All risks insurance cover for materials and equipment on site during the execution phase is included in the CAPEX.
Third-party insurance and maintenance of vehicles supplied for use by the EPCM Contractor have been included in the insurances and guarantees portion of the overall CAPEX.
Professional Indemnity (PI) insurance cost allowances have been included in the insurances and guarantees portion of the overall CAPEX.
| 18.1.22 | TSF Costs |
The CAPEX associated with the TSF has been determined to a Class 2 AACE accuracy (+20 % to −15 %) based on quantities measured by Epoch in the 2022 DFS and rates sourced from earthworks and liner tender enquiries (Mota-Engil) undertaken and provided by SENET in 2025.
The estimated CAPEX has been determined for each phase of the development of the TSF, allowing for the costs to be allocated either to the initial CAPEX budget for the Project or to the sustaining CAPEX/OPEX as deemed necessary.
| S-K 1300 Technical Report Summary on the Songwe Hill REE Project | Page 402 of 489 |
| |
The estimated costs associated with each phase of the TSF, which represent the initial and sustaining TSF CAPEX that occurs over the LOO, are given in Table 18.12. An allowance of 10 % of the total measured works was made for contingencies if outstanding geochemical and geotechnical results and information warrant additional design measures. Additional changes made for the updated TR presented in this TRS include the following:
| ● | The rates for the TSF works, excluding the lining and geotextile supply and installation, sourced from Teichmann in 2021 were updated with rates provided by Mota-Engil in 2025. |
| ● | The rates for the lining and geotextile supply and installation sourced from Solmax in 2021 were updated with rates provided by Mota-Engil in 2025. |
| ● | In the estimate provided by Mota-Engil, the P&G costs were presented as a combined figure for both the TSF and the process plant. In contrast, the 2022 TR allocated these costs separately, amounting to an 80/20 split between the TSF and the process plant, respectively. For this TRS, this same 80/20 split has been applied, with 80 % of the total P&G cost attributed to the TSF. |
| ● | The LOO P&G cost was calculated by applying a fixed rate of 21 % to the total value of the measured works. |
Table 18.12: CAPEX for the Songwe Hill TSF
| Description | Amount (US$ million) | Percentage of Total Works (%) | |||||
| Phase 1 | Phase 2 | Phase 3 | Phase 4 | Phase 5 | RWD | ||
| Site Clearance | 1.13 | 0.16 | 0.13 | 0.09 | 0.06 | 0.06 | 1 |
| Earthworks and Excavations | 13.19 | 6.11 | 7.23 | 6.97 | 7.89 | 0.66 | 37 |
| Drainage | 4.64 | 0.22 | 0.22 | 1.03 | 1.09 | 0.26 | 7 |
| Concrete Structures | 1.02 | 0.99 | 0.99 | 0.99 | 0.99 | 0.02 | 4 |
| Pipe Work | 0.64 | 0.12 | 0.96 | 0.02 | 0.02 | 0.00 | 2 |
| Gabions | 0.31 | 0.31 | 0.31 | 0.31 | 0.31 | 1 | |
| Catwalk | 0.37 | 0.37 | 0.37 | 0.37 | 0.37 | 2 | |
| Warning Signage and Safety | 0.00 | 0.00 | 0.00 | 0.00 | 0.00 | 0 | |
| Miscellaneous | 0.38 | 0.38 | 0.00 | 0.50 | 0.00 | 1 | |
| Sum of Measured Works | 21.66 | 8.66 | 10.20 | 10.28 | 10.74 | 1.00 | 55 |
| P&G Costs (31.0 % of Measured Works) | 4.55 | 1.82 | 2.14 | 2.16 | 2.25 | 0.21 | 12 |
| Contingencies (10 % of Measured Works) | 2.17 | 0.87 | 1.02 | 1.03 | 1.07 | 0.10 | 6 |
| Total CAPEX per Phase | 28.38 | 11.35 | 13.36 | 13.47 | 14.06 | 1.30 | 73 |
| S-K 1300 Technical Report Summary on the Songwe Hill REE Project | Page 403 of 489 |
| |
| Description | Amount (US$ million) | Percentage of Total Works (%) | |||||
| Phase 1 | Phase 2 | Phase 3 | Phase 4 | Phase 5 | RWD | ||
| Liner and Geotextile Measured Works | 12.95 | 2.74 | 2.87 | 2.15 | 2.22 | 0.66 | 21 |
| P&G Costs (18.8 % of Measured Works) | 2.72 | 0.57 | 0.60 | 0.45 | 0.47 | 0.14 | 4 |
| Contingencies (10 % of Measured Works) | 1.29 | 0.27 | 0.29 | 0.22 | 0.22 | 0.07 | 2 |
| Total CAPEX per Phase | 16.96 | 3.59 | 3.76 | 2.82 | 2.91 | 0.87 | 27 |
| Total CAPEX per Phase | 45.34 | 14.93 | 17.12 | 16.29 | 16.98 | 2.17 | 100 |
| Total CAPEX of Final TSF |
112.83 | ||||||
| 18.1.23 | Other Supporting Infrastructure and Equipment Costs |
The proposed infrastructure will support the mining and plant operations and includes the following:
| ● | Raw water management and supply |
| ● | Pit dewatering |
| ● | Plant access and haul roads |
| ● | Plant support and operational vehicles |
| 18.1.24 | Raw Water Management and Supply |
The raw water management and supply philosophy was derived from the process plant and mining operational requirements as detailed in the process plant and mining water balances, respectively.
Raw water will be supplied to the plant from boreholes located in various areas mainly west of the process plant. This water will be pumped to a water collection tank central to the boreholes’ location and then pumped to the raw water pond at the process plant as well as to a collection tank at the accommodation facility for treatment as potable water. From the pond, a stream is filtered and pumped to the filtered raw water tank for the gland water service supply and reagent make-up. A second stream is treated in a reverse osmosis plant for use as potable water. A third stream is used as is for fire water, process water top-up, and crushing dust suppression.
The pumping and piping BOQs associated with these systems were compiled by measuring the relevant piping routes on the overall site plot plan, in conjunction with the Project P&IDs. These BOQs (along with the associated pump systems and WWTP) were subsequently reissued to the respective vendors via a formal enquiry to obtain rates for the fabrication and supply of the materials/equipment. The CAPEX for the raw water pumping, WWTP and piping is included in the process plant mechanical equipment, piping, and valves CAPEX.
| S-K 1300 Technical Report Summary on the Songwe Hill REE Project | Page 404 of 489 |
| |
Installation/erection for the raw water supply pumping, piping and WWTP is included in the SMPP contract.
The CAPEX for the site clearance and terracing for the raw water pumping station and WWTP is included in the earthworks contract.
The CAPEX for the concrete foundations, floor slabs, catch pits, sewer reticulation and drainage systems is included in the civil works contract.
The CAPEX for the ablution facility prefabricated building, fixtures, internal sewer reticulation and fittings is included in the infrastructure CAPEX.
The CAPEX for the electrical switchgear and MCCs is included in the electrical CAPEX.
The electrical supply reticulation to the raw water pumping station and WWTP is included in the E, C&I contract.
| 18.1.25 | Pit Dewatering |
The pumping requirements to dewater the pits from rainfall and groundwater inflows were estimated following completion of the mine and geohydrology designs. The pit dewatering systems from the pit will feature dedicated diesel pumps, which will pump the water to the highest point into a tank. The water will be gravity fed from that tank to another tank close to the primary crusher, from where it will be pumped to the raw water pond.
The pit dewatering mechanical equipment and all the associated piping to the tank are included in the mining initial CAPEX.
The pump, piping and electrical requirements are included in SENET’s initial CAPEX.
| 18.1.26 | Plant Access and Haul Roads |
The BOQs for the main site access road, the waste management facility perimeter road, and the mine haul roads were prepared using the topographical drawings, plant location, waste management facility location, and mine planning designs as a basis for measurement.
The tender documents drawn up during the 2022 DFS for the design, procurement and construction management of the access roads were reissued to the contractor selected during the 2022 DFS for pricing. The updated quotation was commercially and technically adjudicated.
The development costs for the access roads are included in the roads CAPEX.
Haul road development costs were derived from in-house database pricing and are included in the mining initial CAPEX (see Section 18.1.8).
| S-K 1300 Technical Report Summary on the Songwe Hill REE Project | Page 405 of 489 |
| |
| 18.1.27 | Plant Support and Operational Vehicles |
The CAPEX for the process plant workshop tools, light support vehicles, and the plant operational vehicles is based on the selected vendor’s quotation and is included in the tools and mobile equipment CAPEX.
The process plant light support and operational vehicles are summarised in Table 18.13.
Table 18.13: Plant Support and Operational Vehicles
| Description | Quantity |
| Light Plant Vehicles | 8 |
| Mobile Crane 80 t | 1 |
| Mobile Crane 20 t | 2 |
| Forklift | 2 |
| Skid-Steer Loader (Bobcat) | 2 |
| Front-End Loader | 2 |
| Tractor and Trailer | 1 |
| Lorry 10 t | 1 |
| Mobile rock breaker | 1 |
| Cherry picker | 1 |
| 16-seater combi | 3 |
| 32-seater bus | 1 |
| 18.1.28 | Owner’s Pre-Production Costs |
The Owner’s pre-production costs are based on costs that will be incurred from the start of the Project implementation phase up to the commissioning and handover to plant operation, including working capital.
The Owner’s pre-production costs were estimated at 4 % of the direct field cost. A 10 % contingency has been allowed for to cover items that cannot be adequately defined at this stage.
The Owner’s pre-production costs comprise the following:
| ● | General and administration salaries, including the Owner’s Project team; the health, safety and environmental (HSE) department; the finance department; the procurement department; and the HR department |
| ● | Mining department labour costs prior to commencement of pre-stripping |
| ● | Plant and laboratory labour costs prior to commencement of plant commissioning |
| ● | Costs associated with the administration of an off-site office |
| ● | Training package implementation and contractor engagement |
| ● | Vehicle running, insurance and maintenance costs |
| ● | Other administrative support costs |
| ● | Insurance costs |
| ● | Mine licence costs and reclamation bonds |
| S-K 1300 Technical Report Summary on the Songwe Hill REE Project | Page 406 of 489 |
| |
| 18.1.29 | Pre-Production Labour |
The pre-production labour cost for the 18-month construction period includes the following:
| ● | Pre-production labour salaries |
| ● | Pre-production labour flights |
| ● | Dedicated vehicle costs (diesel and maintenance) |
| ● | Recruitment costs |
| 18.1.30 | Other Pre-Production Costs |
The other pre-production costs for the 28-month construction period include the following, which were based on the general and administration costs:
| ● | Facilities maintenance |
| ● | Off-site offices and travel |
| ● | Supplies and spare parts |
| ● | Security |
| ● | Other administration |
| ● | Environmental and social |
| ● | Waste management |
| ● | Temporary ablution facilities |
| ● | Accommodation and messing facility management |
| ● | Potable and construction water supply |
| 18.1.31 | Working Capital |
The working CAPEX was defined as those fixed and variable costs incurred by the mine from commissioning to the point where the mine is cash flow positive, and the revenue from concentrate sales can pay for the mine’s operational costs.
The working CAPEX has been calculated from first principles, estimating a ramp-up period (period for plant to reach design production capacity) of four months. In this calculation, the following costs were considered:
| ● | OPEX for the whole operation, i.e. mining, process plant, and waste management facility |
| ● | General and administration costs |
| ● | Mining and process plant assay costs |
| ● | Stockholding costs |
| 18.1.32 | Environmental Management: Resettlement Costing and Rehabilitation and Closure Costs |
Mkango requested Digby Wells to estimate the funding required for the resettlement process that may be undertaken to manage the physical and economic displacement impacts associated with the development and operation of the Songwe Hill Project. It is expected that the cost associated with a resettlement process (i.e. implementation, monitoring and evaluation, and closeout of the resettlement process) of this nature will likely range between US$11,167,039 and US$16,596,545.
| S-K 1300 Technical Report Summary on the Songwe Hill REE Project | Page 407 of 489 |
| |
The costs are based on eligibility considerations and entitlement measures typically required for resettlement processes within Malawi undertaken in line with International Standards, in particular IFC PS5 on Land Acquisition and Involuntary Resettlement.
As part of the ESHIA, Digby Wells compiled a Rehabilitation and Closure Plan (RCP) and calculated the associated closure cost estimate (CCE) for the proposed Songwe Hill Project. This RCP was developed as a desktop study with input from specialists as part of fieldwork and additional verification surveys.
The closure measures set out in the RCP are based on a screening-level risk assessment undertaken for the Project, which is informed by the relevant biophysical information and available specialist studies. The closure measures developed are then costed in the Digby Wells closure costing model to determine the initial CCE for the Project.
A closure-related risk assessment was completed with the aim of informing the rehabilitation and closure measures required to meet the closure objectives and promote sustainable mine closure. The closure cost, including contingency, is estimated to be US$16,675,138 and is included in the sustaining CAPEX. Table 18.14 provides an overview of the CCE.
Table 18.14: Closure Cost Summary
| Area and Description | LOO 2038 Cost (US$) |
| Infrastructure Demolition | |
| Component 1: Plant, Mining and Related Infrastructures | 2,699,666 |
| Component 2: Pit Area | 0 |
| Component 3: Waste Rock Dump and Stockpiles | 365,324 |
| Component 4: Tailings Storage Facility | 0 |
| Component 5: Dams | 41,570 |
| Component 6: Linear Infrastructure | 108,965 |
| Subtotal | 3,215,624 |
| Rehabilitation | |
| Component 1: Plant, Mining and Related Infrastructures | 856,231 |
| Component 2: Pit Area | 88,034 |
| Component 3: Waste Rock Dump and Stockpiles | 1,001,883 |
| Component 4: Tailings Storage Facility | 4,289,665 |
| Component 5: Dams | 38,089 |
| Component 6: Linear Infrastructure | 50,782 |
| Subtotal | 6,324,685 |
| Total 1: Demolition and Rehabilitation | 9,540,309 |
| Monitoring and Maintenance | |
| Monitoring Costs (Groundwater and Surface Water) | 348,950 |
| S-K 1300 Technical Report Summary on the Songwe Hill REE Project | Page 408 of 489 |
| |
| Area and Description | LOO 2038 Cost (US$) |
| Monitoring Costs (Vegetation) | 25,897 |
| Maintenance Costs (Vegetation) | 1,430,419 |
| Specialist Studies (5 % of Total 1) | 477,015 |
| Plant Decontamination | 559,408 |
| Subtotal | 2,841,690 |
| P&G Cost (35 %) | 3,339,108 |
| Contingency (10 %) | 954,031 |
| Subtotal | 4,293,139 |
| GRAND TOTAL | 16,675,138 |
| 18.1.33 | Closure Framework and Objectives |
The initial closure objectives to support the overall closure vision are as follows:
| ● | Rehabilitate disturbed areas to a suitable land capability to ensure the constructive integration and alignment of the rehabilitated site with the surrounding land use mix. |
| ● | Ensure that contamination of surrounding areas by mine impacted water is limited as far as possible. Ensure that the mine water is contained or treated if the volume of contaminated water is significant and if it does not meet statutory water quality requirements. |
| ● | Remove mine infrastructure that cannot be used by a subsequent landowner or a third party. Where buildings can be used by a third party, arrangements will be made to ensure their long-term sustainable use. |
| ● | Clean up all stockpile footprint areas and loading areas and rehabilitate these to a land capability similar to that which existed prior to mining. |
| ● | Follow a process of closure that is progressive and integrated into the short- and long-term mine plans and that will assess the closure impacts proactively at regular intervals throughout the Project life. |
| ● | Rehabilitate the disturbed land to a state that facilitates compliance with applicable environmental quality objectives. |
| ● | Landscape the rehabilitated areas in alignment with the surrounding topography to prevent the unnecessary ponding of water and ensure all rehabilitated areas are free draining. |
| ● | Physically and chemically stabilise any remaining mining structures (i.e. TSF and WRD), where required, to minimise residual risk after closure. |
| ● | Leave a safe and stable environment for both humans and animals. |
| ● | Prevent any soil and surface/groundwater contamination by effectively managing water on site, and ensure clean/dirty water separation during the operational period to minimise post-closure contamination potential. |
| ● | Reduce the requirement for long-term monitoring and maintenance by establishing stable landforms. |
| ● | Comply with local and national regulatory requirements. |
| S-K 1300 Technical Report Summary on the Songwe Hill REE Project | Page 409 of 489 |
| |
The closure cost, including contingency, is estimated to be US$17,701,756 and is included in the sustaining CAPEX.
The closure measures can be refined or developed further in subsequent updates.
| 18.1.34 | Environmental and Social Forward Works Plan |
Various environmental and social activities need to be undertaken at the commencement of Project implementation. These have been detailed as part of the ESMP. Table 18.15 provides a summary of the key recommended tasks.
Table 18.15: Environmental and Social Forward Works Plan
| Aspect | Recommendation | Time Frame | Cost Estimate (US$) |
| Grave Relocation Process (GRP) | Implement the GRP for relevant areas (professional fees). | 8 to 12 months | 120,000 |
| Resettlement | Develop RAP (professional fees). | 8 to 12 months | 345,000 |
| Biodiversity | Conduct a pre-disturbance walk over to confirm ecological aspects. | 1 month | 20,000 |
| Groundwater | Update the impact assessment and numerical model. | 4 months | 45,000 |
| Groundwater | Undertake groundwater studies in support of the wellfield. | 6 months | 95,000 |
| Stakeholder Engagement | Update stakeholders on the Project’s way forward. | 2 months | 20,000 |
| 18.1.35 | Currency Split |
The currency split for the main contracts has been broken down per discipline and is shown in Table 18.16: Currency Split.
Table 18.16: Currency Split
| Description | EUR | USD | ZAR |
| Earthworks | 0 | 6,976,112 | 7,416,717 |
| Civil Works – Plant | 0 | 17,013,864 | 4,839,194 |
| Civil Works – Infrastructure | 0 | 1,717,576 | 0 |
| Infrastructure | 0 | 707,524 | 34,287,034 |
| Structural Steel | 0 | 0 | 93,589,009 |
| Plate Work | 0 | 0 | 40,491,125 |
| Tankage | 0 | 0 | 67,644,886 |
| Machinery and Equipment | 16,431,268 | 3,344,867 | 440,415,320 |
| Piping | 0 | 0 | 86,642,821 |
| Valves | 0 | 0 | 26,445,164 |
| S-K 1300 Technical Report Summary on the Songwe Hill REE Project | Page 410 of 489 |
| |
| Description | EUR | USD | ZAR |
| Electricals | 0 | 11,766,272 | 0 |
| Instrumentation | 0 | 0 | 77,677,339 |
| Transport | 0 | 0 | 65,840,588 |
| E&I Installation | 0 | 7,155,887 | 0 |
| SMPP Installation | 0 | 26,503,103 | 0 |
| Commissioning Spares | 32,143 | 16,891 | 2,873,954 |
| Two-Year Operational Spares | 143,190 | 70,664 | 36,129,649 |
| Insurance and Critical Spares | 35,798 | 10,750 | 29,567,654 |
| Vendor Services | 1,236,250 | 1,67,384 | 3,843,792 |
| First Fills | 0 | 101,761 | 6,851,901 |
| Project Management (EPCM) | 0 | 24,438,573 | 0 |
| Insurances and Guarantees | 0 | 3,290,594 | 0 |
| Mobile Plant and Equipment | 0 | 245,061 | 57,633,514 |
| Generator Plant | 0 | 6,572,122 | 0 |
| PV Solar Plant | 0 | 13,545,135 | 0 |
| Construction Camp | 0 | 265,044 | 49,535,023 |
| TSF Phase 1 and RWD | 0 | 43,814,395 | 0 |
| Mining Pre-Production | 0 | 14,428,214 | 0 |
| Other | 0 | 12,460,340 | 0 |
| TSF Sustaining Capital – Phases 2 to 5 | 0 | 60,235,066 | 0 |
| Mining Sustaining Capital | 0 | 532,531 | 0 |
| Closure Cost | 0 | 16,675,138 | 0 |
| Owner’s Cost | 0 | 6,257,078 | 0 |
| TOTAL | 17,878,648 | 279,411,946 | 1,127,880,891 |
| CURRENCY SPLIT IN PERCENTAGE | 5.1 % | 74.7 % | 20.1 % |
| 18.1.36 | Countries of Origin for Procurement Packages |
Table 18.17 shows the envisaged countries of origin for the main procurement packages, together with the value, in US dollars, of the respective packages.
| S-K 1300 Technical Report Summary on the Songwe Hill REE Project | Page 411 of 489 |
| |
Table 18.17: Countries of Origin for Procurement Packages
| Package No. |
Package
Description |
Value of Procurement Package (US$) | ||||||
| China | Germany | India | Italy | Malawi | South Africa | Turkey | ||
| CC100 | Civil Works | 21,361,869 | ||||||
| CC102 | Earthworks | 7,966,605 | ||||||
| CC103 | ROM Wall | 158,816 | ||||||
| CC104 | HDPE Lining | 99,769 | ||||||
| CC105 | Acid Proofing | 326,071 | ||||||
| CC107 | Fencing | 1,351,335 | ||||||
| CC108 | Pre-Engineered Buildings | 703,231 | ||||||
| CC109 | Erosion Control | 165,659 | ||||||
| CC199 | TSF | 104,049,461 | ||||||
| CC321 | Geotechnical Supervision | 87,021 | ||||||
| CON01 | Camp | 2,891,136 | ||||||
| DW001 | RAP Sustaining | 16,675,138 | ||||||
| DW | RAP | 12,460,340 | ||||||
| EE123 | E&I Installation | 7,448,241 | ||||||
| EE901 | Electrical | 207,399 | ||||||
| EE908 | Electrical | 53,481 | ||||||
| EE909 | Electrical | 1,757,669 | ||||||
| EE916 | Electrical | 612,944 | ||||||
| EE918 | Electrical | 2,763,912 | ||||||
| EE921 | Electrical | 4,652,716 | ||||||
| EE928 | Electrical | 335,345 | ||||||
| EE933 | Electrical | 1,188,591 | ||||||
| EE959 | Electrical | 194,211 | ||||||
| EP001 | EPCM | 24,438,573 | ||||||
| FF001 | First Fills | 644,482 | ||||||
| GG123 | Plate Work | 4,725 | ||||||
| I084 | Generator Plant | 6,572,121 | 6,572,121 | |||||
| I700 | Field Instruments | 1,048,610 | ||||||
| I721 | Pneumatic Equipment | 202,989 | ||||||
| I730 | Conveyor Protection | 347,552 | ||||||
| I740 | Control System | 1,434,131 | ||||||
| I750 | Instrument Cables | 336,320 | ||||||
| I765 | Security Systems | 488,527 | ||||||
| I790 | C&I Cable Racking | 830,414 | ||||||
| MM001 | Ball Mill | 4,039,815 | ||||||
| MM002 | Apron Feeder | 468,131 | ||||||
| MM003 | Primary Jaw Crusher | 464,202 | ||||||
| MM005 | Screens | 243,174 | ||||||
| MM006 | Vibrating Grizzly Feeder | 78,345 | ||||||
| MM007 | Rock Breaker | 169,906 | ||||||
| S-K 1300 Technical Report Summary on the Songwe Hill REE Project | Page 412 of 489 |
| |
| Package No. |
Package
Description |
Value of Procurement Package (US$) | ||||||
| China | Germany | India | Italy | Malawi | South Africa | Turkey | ||
| MM008 | Dust Suppression | 349,188 | ||||||
| MM009 | Tower Crane | 379,161 | ||||||
| MM011 | Cyclone Cluster | 121,036 | ||||||
| MM013 | Pan Feeder | 49,279 | ||||||
| MM014 | Agitators | 227,820 | ||||||
| MM015 | Hoists | 267,656 | ||||||
| MM016 | Float Cells | 6,002,373 | ||||||
| MM017 | Filter Press | 743,127 | ||||||
| MM018 | Samplers and Analysers | 1,380,597 | ||||||
| MM022 | Fine Grinding Cyclone Cluster | 220,912 | ||||||
| MM023 | Regrind Mill | 5,444,666 | ||||||
| MM024 | Air Compressor | 1,538,375 | ||||||
| MM025 | SMPP | 26,503,103 | ||||||
| MM027 | Concentrate Thickener | 471,522 | ||||||
| MM028 | Tails Thickener | 471,522 | ||||||
| MM029 | Flocculant Plant | 723,208 | ||||||
| MM031 | Water Treatment Plant | 455,449 | ||||||
| MM033 | Hydrometallurgical Thickeners | 3,395,842 | ||||||
| MM035 | Secondary Cone Crusher | 437,928 | ||||||
| MM036 | Tertiary Cone Crusher | 272,254 | ||||||
| MM039 | Hydrometallurgical Filters | 5,338,456 | ||||||
| MM041 | Plant Buildings | 796,643 | ||||||
| MM048 | Piping – Carbon Steel | 1,624,862 | ||||||
| MM051 | Piping – HDPE | 1,339,500 | ||||||
| MM058 | Piping – Stainless Steel | 464,095 | ||||||
| MM060 | Laboratory | 0 | ||||||
| MM061 | Evaporation Package | 3,665,161 | ||||||
| MM062 | Sulphuric Acid Plant | 11,905,376 | ||||||
| MM063 | Trash Screen | 44,024 | ||||||
| MM075 | Steam Boiler | 344,620 | ||||||
| MM076 | Off-Gas Scrubber | 144,695 | ||||||
| MM078 | Heat Exchanger | 222,238 | ||||||
| MM079 | Bagging and Drumming | 208,428 | ||||||
| MM081 | Ion Exchange Plant | 1,149,787 | ||||||
| MM083 | Water Filtration Plant | 2,483,516 | ||||||
| MM085 | Fire Protection | 1,756,022 | ||||||
| MM123 | Safety Shower | 50,682 | ||||||
| MM457 | Pumps | 2,668,039 | ||||||
| MM500 | Conveyor Belting | 156,122 | ||||||
| MM501 | Conveyor Pulley | 30,751 |
| S-K 1300 Technical Report Summary on the Songwe Hill REE Project | Page 413 of 489 |
| |
| Package No. |
Package
Description |
Value of Procurement Package (US$) | ||||||
| China | Germany | India | Italy | Malawi | South Africa | Turkey | ||
| MM502 | Conveyor Idlers | 255,760 | ||||||
| MM503 | Drives | 421,428 | ||||||
| MM504 | Belt Scrapers | 85,423 | ||||||
| MM505 | Take-Ups | 3,098 | ||||||
| MM506 | Belt Scale | 246,099 | ||||||
| MM507 | Magnets | 79,039 | ||||||
| MM696 | Mining Pre-Production | 14,428,213 | ||||||
| MM | Sustaining Capital | 532,531 | ||||||
| SEN001 | Magnets | 11,813 | ||||||
| SEN002 | Flame Arresters | 14,766 | ||||||
| SEN145 | Tools and Mobile | 3,899,262 | ||||||
| SS042 | Steel and Plate | 8,570,205 | ||||||
| TRIK | Hydrosphere | 60,200 | ||||||
| TT044 | Tanks – Carbon Steel | 1,425,695 | ||||||
| TT045 | Tanks – Stainless Steel | 974,316 | ||||||
| TT065 | Tanks – FRP | 1,755,432 | ||||||
| VV059 | Valves | 1,638,608 | ||||||
| (blank) | Collector Substation | 194,212 | ||||||
| PV Plant | Inverters | 1,599,651 | ||||||
| PV Plant | Plant Controller | 143,559 | ||||||
| PV Plant | PV Cable | 730,006 | ||||||
| PV Plant | PV Modules | 2,585,348 | ||||||
| PV Plant | PV Solar | 2,463,035 | ||||||
| PV Plant | Surveillance System | 314,964 | ||||||
| PV Plant | Trackers | 2,825,252 | 2,825,252 | |||||
| GEN | Weather Station | 83,510 | ||||||
| GEN | Various smaller items | 1,162,788 | ||||||
| TOTAL | 33,697,397 | 9,397,373 | 49,279 | 421,428 | 134,100,481 | 183,868,328 | 468,131 | |
| S-K 1300 Technical Report Summary on the Songwe Hill REE Project | Page 414 of 489 |
| |
| 18.1.37 | Capital Cost Outflow Forecast |
The CAPEX outflow was scheduled according to the implementation schedule. Figure 18.2 shows the monthly CAPEX outflow forecast over time including contingency.
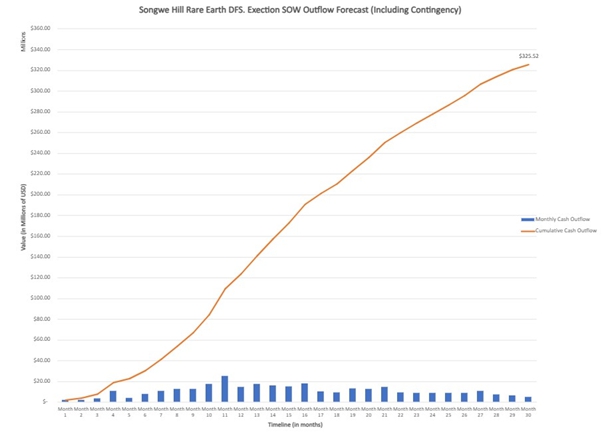
Figure 18.2: Capital Cost Outflow Forecast
| S-K 1300 Technical Report Summary on the Songwe Hill REE Project | Page 415 of 489 |
| |
| 18.2 | Operating Costs |
| 18.2.1 | Summary of Operating Costs |
The purpose of this OPEX estimate is to provide operating costs, and the associated general and administration (G&A) costs, to an accuracy of ± 10 % that can be used for the economic analysis of the Songwe Hill REE Project.
The Project’s annual OPEX estimate for the first five years of production consists of the following:
| ● | Mining OPEX estimated by Bara |
| ● | Process plant OPEX estimated by SENET |
| ● | TSF OPEX estimated by Epoch |
The OPEX for the first five years of production for the Songwe Hill Project is summarised in Table 18.18, with the cost distribution shown in Figure 18.3.
Table 18.18: First Five Years of Production OPEX Summary
| Description | Cost | Cost Distribution | |||
| US$ /a | US$/t ROM | US$/t REE | US$/t REO | % | |
| Mining | 32,308,320 | 32.31 | 6,357.03 | 5,426.23 | 24.5 |
| General and Administration | 11,099,892 | 11.10 | 2,184.03 | 1,864.24 | 8.4 |
| Reagents and Consumables | 64,155,703 | 64.16 | 12,623.36 | 10,775.05 | 48.7 |
| Power | 17,198,278 | 17.20 | 3,383.96 | 2,888.48 | 13.1 |
| Maintenance/Spares | 3,157,232 | 3.16 | 621.22 | 530.26 | 2.4 |
| Personnel | 854,788 | 0.85 | 168.19 | 143.56 | 0.6 |
| Site Laboratory | 1,054,104 | 1.05 | 207.41 | 177.04 | 0.8 |
| Product Transport | 1,231,960 | 1.23 | 242.40 | 206.91 | 0.9 |
| TSF | 650,000 | 0.65 | 127.89 | 109.17 | 0.5 |
| TOTAL | 131,710,278 | 131.71 | 25,915.48 | 22,120.94 | 100 |
| S-K 1300 Technical Report Summary on the Songwe Hill REE Project | Page 416 of 489 |
| |
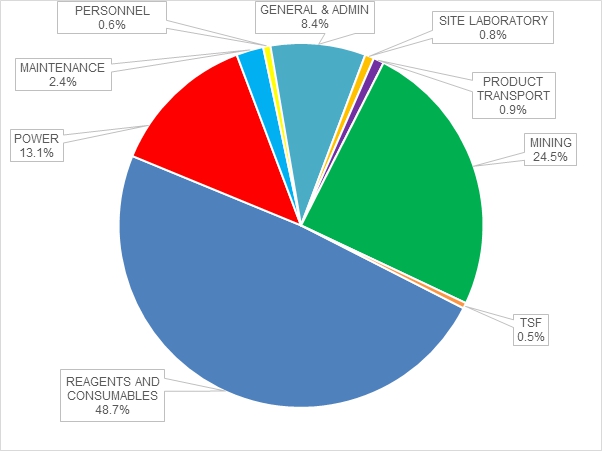
Figure 18.3: OPEX Distribution
The following is a summary of the production over the LOO and for the first five years:
| ● | TREO production: |
| o | LOO: 4,633.54 t/a |
| o | First five years: 5,954.1 t/a |
| ● | Carbonate production (dry): |
| o | LOO: 8,424.65 t/a |
| o | First five years: 10,825.7 t/a |
| ● | Carbonate production (wet – to be transported): |
| o | LOO: 111,232.9 t/a |
| o | First five years: 14,434.2 t/a |
Due to the distinction made between the production profile in the first five years of operation versus the LOO production rates, the OPEX numbers reflect the costs that are expected during the first five years. Due to the fact that varying feed characteristics influence the OPEX, several time-varied inputs have been evaluated over the life of the plant. The OPEX for the entire life of the processing plant given in Section 15 uses an averaged OPEX that differs from that given here for the first five years.
| S-K 1300 Technical Report Summary on the Songwe Hill REE Project | Page 417 of 489 |
| |
| 18.2.2 | Exchange Rates |
The costs of the Project are reported in US dollars. The exchange rates used are shown in Table 18.1: Exchange Rates.
| 18.2.3 | Escalation |
No escalation has been allowed for in the OPEX estimate.
| 18.2.4 | Exclusions |
The following items were excluded from the OPEX estimate:
| ● | Schedule delays, such as those caused by |
| o | Scope changes |
| o | Labour disputes |
| ● | Receipt of information beyond SENET’s control |
| ● | Currency fluctuations |
| ● | Force majeure |
| ● | Contingencies |
| 18.2.5 | Mining Operating Costs |
| 18.2.5.1 | Definition of Mining Operating Cost |
OPEX has been defined as the costs of all ongoing mining from the time that ore is mined and includes the following:
| ● | The cost of mining the ore and waste material from the open pit, including the cost of manpower and consumables |
| ● | The costs of maintaining the surface infrastructure |
The OPEX excludes, among other things, the following:
| ● | The cost of processing the ore to saleable products, including the cost of manpower, consumables and bulk supply |
| ● | The cost of shared services for the support of the operation, including the cost of on-site labour, infrastructure, camp costs and bulk supply |
| S-K 1300 Technical Report Summary on the Songwe Hill REE Project | Page 418 of 489 |
| |
| ● | The cost of maintaining the tailings dam |
| ● | The cost of bulk supply items including power and water |
| 18.2.5.2 | Open-Pit Mining Operating Cost |
The mine OPEX is based on the use of a mining contractor to conduct the open-pit mining. During the initial study in 2022, an enquiry was distributed to a number of potential mining contractors. Contractors were requested to cost the first five years of open-pit mining in detail. Conforming submissions were received from three contractors. Two of the submissions, which were the lowest cost estimates, proposed total costs which were within 1 % of each other. One of these submissions was selected for use as the basis of costing. As part of the 2025 report update, the selected contractor submitted a revised cost estimate.
The pricing schedule submitted by the contractor is shown in Table 18.19. The rates as shown in the table were applied to the final mining physical schedule to determine the mining cost per period. For the period beyond the first five years, the average rates over the first five years were applied.
In addition to the contractor’s cost, costs were estimated for the Owner’s team. These costs include the following:
| ● | Management and administration including contract management |
| ● | Technical services related to the mining operation |
| ● | Allowance for contractors and consultants – this cost includes the grade control drilling contractor |
| ● | Infrastructure costs – cost of maintaining the infrastructure provided to the contractor, but for which the mine retains responsibility |
The Owner’s team manpower and consumables costs were estimated and applied per period (month) in the OPEX estimate.
| S-K 1300 Technical Report Summary on the Songwe Hill REE Project | Page 419 of 489 |
| |
Table 18.19: Mining Contractor Rates for First Five-Year Mining Period
| Item | Description | Year 1 | Year 2 | Year 3 | Year 4 | Year 5 | Year 1 to 5 | ||||||
| Quantity | Rate | Quantity | Rate | Quantity | Rate | Quantity | Rate | Quantity | Rate | Quantity | Total Cost | ||
| Each | US$ | Each | US$ | ||||||||||
| 1.0 | Fixed charges | ||||||||||||
| 1.1 | Establishment | ||||||||||||
| 1.1.1 | Mobilisation of Equipment and Employees | 1 | 986,574 | 1 | 986,574 | ||||||||
| 1.1.2 | Site Infrastructure and Facilities | 1 | 449,960 | 1 | 449,960 | ||||||||
| 1.1.3 | Risk Management Systems | 1 | 29,271 | 1 | 29,271 | ||||||||
| 1.1.4 | Site Setup | 1 | 104,600 | 1 | 104,600 | ||||||||
| Months | US$ | Months | US$ | Months | US$ | Months | US$ | Months | US$ | Months | US$ | ||
| 2.0 | Time-Related Charges | 12 | 112,331 | 12 | 112,331 | 12 | 112,331 | 12 | 112,331 | 12 | 112,331 | 60 | 6,739,877 |
| 2.1 | Management and Wages | 12 | 55,958 | 12 | 55,958 | 12 | 55,958 | 12 | 55,958 | 12 | 55,958 | 60 | 3,357,459 |
| 2.2 | Drilling and Blasting Services | 12 | 37,333 | 12 | 37,333 | 12 | 37,333 | 12 | 37,333 | 12 | 37,333 | 60 | 2,239,973 |
| 2.3 | Safety, Health, Environment, and Quality | 12 | 56,173 | 12 | 56,173 | 12 | 56,173 | 12 | 56,173 | 12 | 56,173 | 60 | 3,370,370 |
| 2.4 | Accommodation and Transport | 12 | 13,586 | 12 | 13,586 | 12 | 13,586 | 12 | 13,586 | 12 | 13,586 | 60 | 815,147 |
| 2.5 | Pit Dewatering | 12 | 47,798 | 12 | 47,798 | 12 | 47,798 | 12 | 47,798 | 12 | 47,798 | 60 | 2,867,865 |
| 2.6 | General Running Costs | 12 | 72,717 | 12 | 72,717 | 12 | 72,717 | 12 | 72,717 | 12 | 72,717 | 60 | 4,363,024 |
| 2.7 | Pit Services | 12 | 11,315 | 12 | 11,315 | 12 | 11,315 | 12 | 11,315 | 12 | 11,315 | 60 | 678,912 |
| Total Mining Contractor cost | 26,535,564 | ||||||||||||
| S-K 1300 Technical Report Summary on the Songwe Hill REE Project | Page 420 of 489 |
| |
| 18.2.5.3 | Summary of Mining Operating Costs |
The mining OPEX has been updated based on the planned movements and the selected Mining Contractor’s budgetary offer.
The mining OPEX estimate includes the following items:
| ● | Mining Contractor’s costs |
| ● | Mining Contractor’s overhead costs and charges |
| ● | Fuel costs |
| ● | Grade control drilling costs |
| ● | Mine Owner’s team manpower costs |
| 18.2.5.4 | Basis of Estimate |
| 18.2.5.4.1 | Mining Contractor’s Costs |
Bara was commissioned by Mkango to complete the mining and mining infrastructure aspects relating to the 2022 DFS and the 2022 TR report. The scope of work remained unchanged for the updated TR presented in this TRS.
Bara’s scope of work comprised the following:
| ● | Project management of mining scope |
| ● | Geotechnical analysis and excavation design |
| ● | Mine design |
| ● | Mine layout and production scheduling |
| ● | Waste dump designs |
| ● | Mine services infrastructure |
| ● | CAPEX estimates for mining |
| ● | OPEX estimates for mining |
| ● | Project scheduling |
| ● | Reporting |
| ● | Mineral Reserve statement |
| 18.2.5.4.2 | Manpower – Owner’s Team |
Bara estimated the full complement of skilled and semi-skilled workers. The summary and split between personnel employed by the Project owner and the contractor are shown in Table 18.20. The Paterson job grading system has been used.
Table 18.20: Summary of Manpower Categories by Employer
| Employer | Complement |
| Mine Owner | 21 |
| Skilled (Paterson Band C and above) | 15 |
| Semi-skilled (Paterson Band A and B) | 6 |
| Contractor | 129 |
| Skilled (Paterson Band C and above) | 48 |
| Semi-skilled (Paterson Band A and B) | 81 |
| Total | 150 |
| S-K 1300 Technical Report Summary on the Songwe Hill REE Project | Page 421 of 489 |
| |
Table 18.21 shows the personnel estimated to be employed by the mine (MKAR). Bara’s estimates excluded the manpower costs associated with whichever mining contractor is ultimately responsible for building the mine.
Table 18.21: Mining Manpower OPEX
| Description | Shifts
per Day |
Complement per Shift |
Cost to Company (US$/month) |
| Contract Manager | 1 | 1 | 15,000 |
| Technical Manager | 1 | 1 | 15,000 |
| Surveyor | 1 | 1 | 7,500 |
| Surveyor Assistant | 1 | 1 | 1,000 |
| Senior Geologist | 1 | 1 | 12,000 |
| Geologist | 1 | 2 | 7,500 |
| Geological/Grade Control Technician | 2 | 2 | 3,000 |
| Geotechnical Engineer | 1 | 1 | 12,000 |
| Geotechnician | 1 | 2 | 3,000 |
| Mine Planner | 1 | 2 | 7,500 |
| General Worker (Cleaner, Water Pump Attendant, Surveyor) | 1 | 5 | 1,000 |
| Total | 0 | 21 | 20,109,000 |
| Total cost (US$/t processed over LOO) | 1.11 |
| 18.2.6 | Process Plant Operating Costs |
| 18.2.6.1 | Summary of Process Plant Operating Costs |
The process plant OPEX is summarised in Table 18.22, and the distribution of the costs is shown in Figure 18.4.
Table 18.22: Process Plant OPEX Summary
| Description | Cost | |||
| US$/a | US$/t ROM | US$/t REE | US$/t REO | |
| Personnel | 854,788 | 0.85 | 168.19 | 143.56 |
| Power | 17,198,278 | 17.20 | 3,383.96 | 2,888.48 |
| Maintenance/Spares | 3,157,232 | 3.16 | 621.22 | 530.26 |
| Reagents and Consumables | 64,155,703 | 64.16 | 12,623.36 | 10,775.05 |
| Site Laboratory | 1,054,104 | 1.05 | 207.41 | 177.04 |
| TOTAL | 86,420,106 | 86.42 | 17,004.13 | 14,514.39 |
| S-K 1300 Technical Report Summary on the Songwe Hill REE Project | Page 422 of 489 |
| |
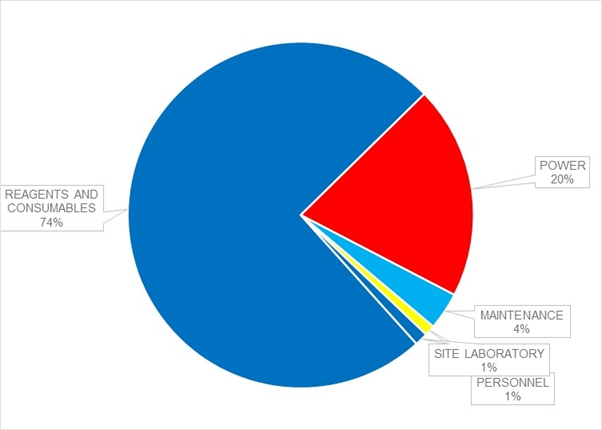
Figure 18.4: Plant OPEX Distribution
| 18.2.6.2 | Basis of Estimate |
The process plant OPEX was compiled from a variety of sources, notably
| ● | Reagent consumptions calculated from first principles where required |
| ● | Test work data regarding reagent consumptions and operating conditions |
| ● | Supplier quotations on reagents and consumables |
| ● | SENET’s in-house experience and database where applicable |
| ● | Client input |
The following are the main cost elements of the process plant:
| ● | Reagents and consumables |
| ● | Power (includes fuel farm) |
| ● | Plant operating and maintenance labour |
| ● | Maintenance parts and supplies |
| 18.2.6.2.1 | Reagents and Consumables |
The reagents and consumables costs were calculated by using vendor supply costs together with the consumptions of the respective reagents or consumables calculated by a mass balance that was based upon test work results. The reagents and consumables supply costs are shown in Table 18.23. The large quantities of reagents make this section of the OPEX sensitive to transport costs. Fixing long-term reagent supply and transport contracts will be critical to decreasing the OPEX. The current reagent and transport costs are high; however, compared to the 2022 base case, there is a noticeable reduction of US$9,125,340 following the stability of reagent flows.
| S-K 1300 Technical Report Summary on the Songwe Hill REE Project | Page 423 of 489 |
| |
Table 18.23: Reagents and Consumables Supplied Costs
| Consumable | Requirement (t/a) |
Cost |
Freight Cost (US$/t) |
Cost per Annum (US$/a) |
| Concentrator Plant | ||||
| Primary Jaw Crusher Liner | 11,900 | 35,700 | ||
| Secondary Cone Crusher Liner | 10,000 | 20,000 | ||
| Tertiary Cone Crusher Liner | 10,000 | 20,000 | ||
| Ball Mill Liner | 481,565 | |||
| Grinding Media | 14,500 | 137 | 358,155 | |
| Fine Grinding Media | 4,288 | 267 | 247,787 | |
| Flotation Reagents | 3,122.98 | 267 | 19,237,458 | |
| Flocculant | 50.00 | 2,320 | 267 | 151,281 |
| Concentrator Total | 20,551,945 | |||
| Hydrometallurgical Plant | ||||
| Sulphur | 16,585.41 | 152 | 238 | 6,463,735 |
| Hydrated Lime | 16,111.11 | 145 | 132 | 4,462,778 |
| Sodium Hydroxide | 19,102.02 | 872 | 16,654,096 | |
| Calcium Chloride | 26,338.52 | 166 | 273 | 11,233,832 |
| Ammonium Bicarbonate | 10,513.35 | 117 | 273 | 4,102,745 |
| Barium Chloride | 400.52 | 428 | 267 | 278,192 |
| Ammonium Sulphate | 780.00 | 135.00 | 267 | 313,694 |
| Sodium Sulphide | 13.43 | 441.00 | 267 | 9,516 |
| Flocculants | 33.08 | 2,307.63 | 267 | 85,169 |
| Hydrometallurgy Total | 43,603,758 | |||
| TOTAL CONSUMABLES COST | 64,155,703 | |||
Crusher Liners
The primary, secondary and tertiary crusher liner costs were escalated from costing received for the 2022 DFS and TR. Annual costs were calculated by estimating the number of liner changes per annum using the abrasion indices obtained from metallurgical tests and the expected liner life for a given throughput. The estimated delivered costs were received from liner suppliers.
| S-K 1300 Technical Report Summary on the Songwe Hill REE Project | Page 424 of 489 |
| |
Mill Liners
The ball mill liner costs were based on estimating the liner consumption by using the abrasion index results obtained from test work. Equipment suppliers used the test work data to simulate the expected wear rates. Annual costs were calculated by assuming a mill reline every eight months. The current pricing for a set of rubber liners for the ball mill was obtained from a liner supply vendor and used in the cost estimate based on the number of liner changes per annum for a given throughput. The delivered costs were received from liner suppliers.
Mill Grinding Media
The grinding media costs were obtained by estimating the consumption in the ball mill based on Bond’s estimating method and using the standard method abrasion index results that were obtained from laboratory tests. Mill suppliers used the test work data to estimate the expected mill grinding media consumptions. In addition, the mill throughputs and quotations for 100 mm balls were obtained from suppliers. Quotations obtained from reagent suppliers, together with the consumption, were then used to estimate the grinding media costs.
Fine Grinding Media
The fine grinding mill media consumption was estimated by the equipment supplier using fine grinding test work, ore properties, and design parameters.
Flotation Reagents
The flotation regime was determined and optimised during bench-scale and pilot plant testing campaigns, and reagent consumptions for optimal flotation performance were established and documented.
Pricing was obtained for all the flotation reagents from local and international suppliers, including suppliers that were identified by Mkango’s consultant Pendant Holdings. The best prices were selected, and the cost of transport to site was estimated from information supplied by reagent suppliers and specialist logistics companies.
Flocculant
Flocculant consumption was determined by test work during the flotation piloting campaigns, and market pricing was used to calculate the total cost. SENET compared the cost of Chinese flocculant supply to the database pricing from previous projects, and it was in line with what was expected. The cost of transport to site was estimated from information supplied by reagent suppliers and specialist logistics companies.
Sulphur
The consumption of sulphur was calculated from the amount of sulphuric acid required by the acid regeneration process in the SENET mass balance and confirmed by the ANSTO test work. The hydrochloric acid requirement in the gangue and rare earth leaches drove the demand for sulphuric acid in acid regeneration. Suppliers of acid plants who were approached provided efficiencies of sulphur use, after which the final sulphur requirement per annum was estimated. Pricing was estimated from quotations received from suppliers, and the transport costs to site were estimated from information supplied by reagent suppliers and specialist logistics companies.
| S-K 1300 Technical Report Summary on the Songwe Hill REE Project | Page 425 of 489 |
| |
Hydrated Lime
Hydrated lime is consumed in several unit operations in the hydrometallurgical plant. The consumption was calculated from the SENET mass balance and confirmed with test work. An estimation was made from first principles on the lime requirement for the hydrometallurgical tails neutralisation. Pricing was estimated from quotations received from suppliers, also considering product availability. Transport costs to site were estimated from information supplied by reagent suppliers and specialist logistics companies.
Sodium Hydroxide
Sodium hydroxide is used both in the flotation plant and in the hydrometallurgical plant. The base-case process design has been used for the purposes of this OPEX. The sodium hydroxide requirement is heavily dependent on three variables:
| 1. | Mass loss in gangue leach |
| 2. | Sodium hydroxide addition rate per unit mass of dry feed to caustic conversion |
| 3. | The percentage of the bleed stream taken from the caustic conversion thickener overflow to remove impurities |
The current base case includes sodium hydroxide consumption to offset a bleed stream of approximately 25 % to 30 % of the solution overflowing from the caustic conversion thickener.
It is important to note that potential process changes could significantly impact the sodium hydroxide consumption. Sodium hydroxide consumption has been the focus of numerous test work campaigns. Test work results on both the caustic conversion process and the subsequent regeneration processes were incorporated into the SENET mass balance to determine annual consumptions. Meetings with international reagent supply chain experts indicated that sodium hydroxide pricing has recently entered a period of steep increase, likely due to global market imbalances and supply chain constraints. Enquiries were submitted to the market nevertheless, and transport costs were estimated from information supplied by reagent suppliers and specialist logistics companies to produce the final annual cost.
It must, however, be emphasised that most of the reagent prices and transport costs are stabilising. Furthermore, the current process is immensely sensitive to sodium hydroxide pricing due to the high concentrations required to drive the caustic conversion process.
Calcium Chloride
Calcium chloride is used with sulphuric acid to make the acid regeneration process work. Sulphuric acid is added to supply the acid, and calcium chloride is added to balance the sulphate and calcium in solution. Calcium chloride consumption was calculated from the SENET mass balance and confirmed with test work. Pricing was estimated from quotations received from suppliers; however, concerns have been raised by several global suppliers about the quantity of reagent required by the process. This is something that will require investigation as the reliable supply of calcium chloride will have to be ensured. Transport costs were estimated from information supplied by reagent suppliers and specialist logistics companies.
| S-K 1300 Technical Report Summary on the Songwe Hill REE Project | Page 426 of 489 |
| |
Ammonium Bicarbonate
Ammonium bicarbonate is used to precipitate the rare earth product. Consumption was determined by test work and incorporated into the SENET mass balance. Pricing was estimated from quotations received from suppliers. Transport costs were estimated from information supplied by reagent suppliers and specialist logistics companies.
Barium Chloride
Barium chloride is used to remove radium from the rare earth leach solution. Consumption was determined via test work and incorporated into the SENET mass balance. Pricing was estimated from quotations received from suppliers for use in the OPEX. Transport costs were estimated from information supplied by reagent suppliers and specialist logistics companies.
Ammonium Sulphate
Ammonium sulphate is also added as a reagent to remove radium from solution, by acting as a source of sulphate. Consumption was determined by test work and incorporated into the SENET mass balance. Pricing was estimated from quotations received from suppliers for use in the OPEX. Transport costs were estimated from information supplied by reagent suppliers and specialist logistics companies.
Sodium Sulphide
Sodium sulphide is used to remove lead and zinc from the rare earth leach solution. Consumption was determined by test work and incorporated into the SENET mass balance. Pricing was estimated from quotations received from suppliers for use in the OPEX. Transport costs were estimated from information supplied by reagent suppliers and specialist logistics companies.
| 18.2.6.2.2 | Power |
The average continuous fixed power consumption was determined by taking into account the installed power rating of each of the equipment in the plant and infrastructure, excluding standbys, and the projected running times. The fixed power draw includes the absorbed operating loads associated with the process plant equipment as detailed in the MEL and on-site infrastructure, including the following buildings:
| ● | Sewage Treatment Plant |
| ● | Fuel Farm |
| ● | Change House |
| ● | Plant Offices |
| ● | Laboratory |
| ● | Administration Building |
| ● | Weighbridge |
| ● | Control Room |
| ● | Gatehouse |
| S-K 1300 Technical Report Summary on the Songwe Hill REE Project | Page 427 of 489 |
| |
| ● | Warehouse |
| ● | Reagents Stores |
| ● | Ball Storage and Bunker |
| ● | Workshop |
The Songwe Hill process design is energy intensive due to the need to elevate temperatures in several unit operations. Flotation is operated at 50 °C, gangue leach at 80 °C, caustic conversion at 90 °C to 100 °C, and the caustic evaporation requires large amounts of saturated steam. The thermal load of the processing plant is approximately 10 MW, including all the thermal recovery systems such as heat exchangers. Electrical energy is used to power an arrangement of steam boilers that provide low-pressure saturated steam for heating purposes.
The Songwe Hill Project will have access to the Malawian national grid and solar PV as a secondary source. The grid (approximately 25 MW) will be predominantly in use during night-time and in the event that the conditions for solar PV are insufficient. Furthermore, in the event that the grid is not available, there are provisions for six 1.6 MW (five running and one standby, equal to 8 MW) backup generators to supply only the essential load during this scenario.
Power Supply Options
Three power supply options have been evaluated for the Songwe Hill Project:
| 1. | Grid only |
| 2. | Grid and PV |
| 3. | Grid, PV and Wind Turbines |
The use of solar PV has been proven to offer a lower OPEX for projects by reducing the power purchased from the grid. Furthermore, the renewable energy component significantly reduces the carbon footprint of the mine.
The addition of wind energy could also be considered, which can further decrease the cost of energy and Scope 2 grid emissions.
A wind energy yield assessment was undertaken based on mesoscale meteorological data, which has been used to estimate the long-term energy production for the proposed wind turbines at Songwe Hill. The wind energy yield assessment is, however, still subject to high uncertainty as no site-measured data is available for analysis.
It is recommended that a detailed energy yield analysis and uncertainty assessment be conducted following the collection of a sufficient period of high-quality on-site data. On-site measurement is required for at least 12 months.
A comparison of the energy balance and the cost of energy is shown in Figure 18.5 and Figure 18.6, respectively, for the three different power supply options. This report’s cost of energy is based on grid with PV. By adding the wind energy component, the overall excess energy at 6.8 % is a marginal increase of 4.2 % compared to the grid with the PV excess energy of 2.6 %. The overall grid energy consumption, however, further decreases by an average of 15 % (16 % during the off-peak time and 13 % during the peak time, using the relevant tariffs for these periods), resulting in a further 19.8 % reduction in the cost of energy from US$0.138/kWh for a grid with PV to US$0.111/kWh for a grid with PV and wind energy.
| S-K 1300 Technical Report Summary on the Songwe Hill REE Project | Page 428 of 489 |
| |
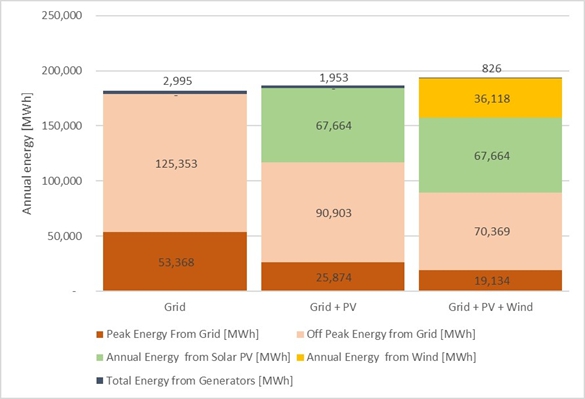
Figure 18.5: Energy Balance for the Three Different Energy Options

Figure 18.6: Cost of Energy and Initial CAPEX for the Three Different Energy Options
| S-K 1300 Technical Report Summary on the Songwe Hill REE Project | Page 429 of 489 |
| |
A trade-off between the three options was done, considering annual diesel cost, electricity cost, and initial CAPEX. Option 2 has been chosen as the base-case option to be presented in the OPEX, and Option 3 has been included as a potential opportunity although further detailed investigation is required.
Table 18.24 shows the trade-off between the three optimised power options evaluated by SENET and the SENERGY business unit. The base case used in the overall power cost is Option 2, comprising grid energy and a solar plant. Option 3 is potentially more economical over the life of the Project but requires further detailed study to determine the cost of wind turbines with a higher degree of accuracy.
Table 18.24: Power Options Trade-Off
| Option | Levelised Cost of Power (US$/kWh) |
Diesel Cost
|
Electrical Power Cost (US$/a) |
Total Power Cost
|
| 1: Grid | 0.177 | 828,100 | 31,877,694 | 32,705,794 |
| 2: Grid + PV | 0.138 | 554,878 | 16,824,037 | 17,198,278 |
| 3: Grid + PV + Wind | 0.111 | 255,695 | 20,254,718 | 20,510,413 |
Thermal Generation
A fuel farm with emergency diesel generator sets has been sized for an assumed duration of grid power unavailability. The diesel cost in Malawi has been determined from TOTAL to be US$1.124/L of fuel.
The backup diesel generators are configured to operate in a prime operating mode. Six backup generators have been allocated to allow for an n+1 redundancy.
The diesel generator parameters are provided in Table 18.25.
Table 18.25: Diesel Generator Sets
| Item | Description |
| Prime Rated Power | 2,000 kVA/1,600 kWe at 0.8 pf |
| Total Generation Capacity | 8.0 MW/10 MVA at 0.8 pf, Prime |
| Rated Voltage | 11 kV |
| Fuel Consumption, 100 % Load | 0.248 L/kWh |
| Fuel Consumption, 75 % Load | 0.251 L/kWh |
Table 18.26 shows the summary for the power draw per plant area.
Table 18.26: Power Draw Summary
| Plant Area | Description | Operating Power (kW) |
| 1000 | Administration, Mining, Buildings, Workshop, Canteen, Stores | 2,357 |
| 2100 | Primary Crushing | 148 |
| 2200 | Secondary Crushing | 186 |
| 2300 | Tertiary Crushing | 281 |
| 2400 | Milling and Classification | 3,731 |
| S-K 1300 Technical Report Summary on the Songwe Hill REE Project | Page 430 of 489 |
| |
| Plant Area | Description | Operating Power (kW) |
| 2500 | Fine Grinding and Classification | 1,358 |
| 3100 | Pre-Float Rougher Flotation | 517 |
| 3200 | Pre-Float Cleaner Flotation | 39 |
| 3300 | Rougher Flotation | 923 |
| 3400 | Cleaner Flotation | 377 |
| 3500 | Scavenger Flotation | 407 |
| 3600 | Cleaner Scavenger Flotation | 397 |
| 3700 | Concentrate Thickening and Filtration | 121 |
| 3800 | Tails Thickening and Filtration | 592 |
| 3900 | Tailings Storage Facility and Return Water | 48 |
| 4100 | Gangue Leach | 202 |
| 4200 | Caustic Conversion | 174 |
| 4300 | Cerium Oxidation | 385 |
| 4400 | Rare Earth Leach | 106 |
| 4500 | PLS Purification | 119 |
| 4600 | Uranium Ion Exchange | 417 |
| 4700 | Rare Earth Carbonate Precipitation | 221 |
| 4800 | Hydrometallurgical Tails Neutralisation | 117 |
| 5100 | Gangue Leach Liquor Neutralisation | 131 |
| 5200 | Acid Regeneration | 138 |
| 5300 | Caustic Evaporation | 1,186 |
| 5400 | Causticisation | 164 |
| 5500 | Scrubbing | 5 |
| 6100 | Caustic Make-Up | 48 |
| 6100 | Modifier M7 | 35 |
| 6100 | Modifier M4P | 36 |
| 6200 | Frother | 16 |
| 6300 | Collector | 37 |
| 6300 | PAX | 3 |
| 6400 | Flocculant | 30 |
| 7100 | Lime Make-Up | 49 |
| 7200 | Sodium Sulphide | 15 |
| 7200 | Barium Chloride | 15 |
| 7200 | Calcium Sulphate | 17 |
| 7300 | Ammonium Bicarbonate | 22 |
| 7400 | Calcium Chloride | 20 |
| 7600 | Steam Plant | 2,236 |
| S-K 1300 Technical Report Summary on the Songwe Hill REE Project | Page 431 of 489 |
| |
| Plant Area | Description | Operating Power (kW) |
| 7600 | Hot Water | 7 |
| 8100 | Air Services | 669 |
| 8400 | Process Water | 76 |
| Process Water RO Plant | 380 | |
| 8500 | Raw Water | 158 |
| 8500 | Gland Water | 15 |
| 8600 | Potable Water | 116 |
| TOTAL | 18,845 |
| 18.2.6.2.3 | Plant Operating and Maintenance Labour |
The annual plant operating and maintenance labour cost was estimated at US$854,788. The cost was derived from first principles where the actual labour complement for each plant area and maintenance function was identified, and the required number of personnel and their levels were established. The complement derived was then benchmarked against other operations of similar size and complexity.
The operating and maintenance labour cost was broken down as follows:
| ● | Operations/production |
| ● | Maintenance |
| ● | Metallurgy |
| ● | Laboratory |
The following costs were excluded as they will be included in the G&A OPEX:
| ● | Management |
| ● | Finance and administration |
| ● | Health, safety, security, environment and community |
| ● | Camp food and catering facility |
| ● | Expatriate travel |
| ● | Safety supplies |
| ● | Training |
| ● | Consultants’ fees |
The labour schedule was developed assuming a six-weeks-on and three-weeks-off roster for expatriate personnel and two 12-hour, two-shift cycles for Malawian national personnel.
| S-K 1300 Technical Report Summary on the Songwe Hill REE Project | Page 432 of 489 |
| |
The salaries for expatriate personnel and Malawian national personnel were based on remuneration rates in line with market rates internationally and in Malawi, considering the scenario of both qualified and unqualified labour availability in the mine locale. Expatriate personnel will be employed in some managerial and supervisory positions. The rest of the positions will be occupied by Malawi nationals local to the mine site.
Table 18.27 shows the labour cost summary.
Table 18.27: Process Plant Labour Cost Summary
| Description | Concentrator Plant Employees |
Hydrometallurgical Plant Employees |
Total Cost (US$/a) |
| Subtotal Operations/Production | 44 | 44 | 491,528 |
| Subtotal Maintenance | 25 | 23 | 173,892 |
| Subtotal Metallurgy | 6 | 5 | 189,368 |
| Total Labour | 75 | 72 | 854,788 |
| 18.2.6.2.4 | Maintenance Parts and Supplies |
The plant maintenance parts and supplies annual costs for the Songwe Hill Project were estimated at US$3,028,520. Plant maintenance and supplies costs refer to the costs of operating spares, lubricants and other maintenance-related consumables for the plant. It has been assumed that the plant will experience a moderate amount of wear. An average annual cost was calculated using the maintenance cost factors as shown in Table 18.28 for the various commodities. The annual maintenance cost is estimated by multiplying the total initial CAPEX with a maintenance factor that has been determined by previous projects and observations on running plants. The total maintenance, parts and supplies OPEX is shown in Table 18.29.
Table 18.28: Plant Maintenance Cost Factors
| Description | Maintenance Factor (%) |
| Mechanical Equipment Cost | 5.0 |
| Piping and Valves | 2.5 |
| Electricals | 2.5 |
| Instrumentation | 1.0 |
Table 18.29: Plant Maintenance, Parts and Supplies OPEX
| Description | Unit | Quantity |
| Machinery and Equipment | ||
| Mechanical Equipment CAPEX | US$ | 52,477,378 |
| Factor | % | 5 |
| Total Annual Cost | US$ | 2,623,869 |
| Piping and Valves | ||
| Piping and Valves CAPEX | US$ | 7,113,071 |
| Factor | % | 2.5 |
| Total Annual Cost | US$ | 177,827 |
| S-K 1300 Technical Report Summary on the Songwe Hill REE Project | Page 433 of 489 |
| |
| Description | Unit | Quantity |
| Electricals | ||
| Electrical Infrastructure CAPEX | US$ | 12,266,339 |
| Factor | % | 2.5 |
| Total Annual Cost | US$ | 306,658 |
| Instrumentation | ||
| Instrumentation CAPEX | US$ | 4,887,810 |
| Factor | % | 1 |
| Total Annual Cost | US$ | 48,878 |
| Maintenance Parts and Supplies Cost | US$/a | 3,157,232 |
| Maintenance Parts and Supplies Cost | US$/t ROM | 3.16 |
| 18.2.7 | TSF Operating Costs |
The OPEX associated with the TSF has been estimated at US$14.10 million over the LOO, based on typical full containment operational costs sourced from tailings dam management companies.
The OPEX of US$0.67 to US$0.83 million per annum comprises the following:
| ● | US$0.52 million per annum for operational management (an estimate provided by Paragon tailings operators for the TSF tonnage and LOO), comprising a team leader/manager, a supervisor, unskilled labour and a spares workshop. This team shall be responsible for the following: |
| o | Day-to-day depositional management |
| o | Maintenance of the pond wall |
| o | Maintenance of and repairs to the slurry delivery pipeline and valves |
| o | Monitoring and cleaning of the drains |
| o | Monitoring of the seepage collection sump pump |
| o | General maintenance (cleaning trenches) |
| o | Monitoring of various components (freeboard, drain flows, water returns, rainfall, tonnes deposited, etc.) |
| ● | US$0.03 million per annum for site establishment of the operations team at the start of the contract |
| ● | US$0.024 million per annum for site disestablishment at the end of the contract |
| ● | US$0.05 to US$0.21 million per annum for pipeline and valve replacement costs and maintenance, depending on the pipeline length per phase of construction |
| ● | US$0.072 million per annum for quarterly inspections, monitoring and quarterly reports by the design engineer |
The total LOO cost associated with the TSF is estimated at a present value of US$131 million at a zero-discount rate. In addition to the costs described above, this includes the detailed design of the TSF, supplementary studies and investigations, and construction supervision during the construction of the various TSF phases (a total of US$4.15 million). Rehabilitation and closure of the TSF and post-closure monitoring costs have been assessed by Digby Wells.
| S-K 1300 Technical Report Summary on the Songwe Hill REE Project | Page 434 of 489 |
| |
| 19 | Economic Analysis |
| 19.1 | Cautionary Statement |
The results of the economic analysis depend on inputs that are subject to a number of known and unknown risks, uncertainties, and other factors that may cause actual results to differ materially from those presented herein. Forward-looking information includes the following:
| ● | Assumed commodity prices and exchange rates |
| ● | Proposed plant throughput |
| ● | Projected process recovery rates |
| ● | Sustaining costs and proposed operating costs |
| ● | Assumptions about closure costs and closure requirements |
| ● | Assumptions about environmental, permitting, and social risks |
Additional risks to the forward-looking information include the following:
| ● | Changes to costs of production |
| ● | Unrecognised environmental risks |
| ● | Unanticipated reclamation expenses |
| ● | Unexpected variations in process throughput, grade or recovery rates |
| ● | Failure of plant, equipment or processes to operate as anticipated |
| ● | Changes to assumptions as to the availability of electrical power and the power rates used in the operating cost estimates and financial analysis |
| ● | Ability to maintain the social licence to operate |
| ● | Accidents, labour disputes and other risks of the industry |
| ● | Changes to interest rates |
| ● | Changes to tax rates |
The Project years used in the financial analysis are provided for conceptual purposes only. Permits must still be obtained in support of operations, and approval to proceed is still required from MKAR’s Board of Directors.
| 19.2 | Overview |
A discounted cash flow (DCF) model prepared by MKAR was reviewed by SENET and a third party. This model incorporates the LOO plan figures, economic assumptions as to the US inflation rates, and the REO and carbonate prices as outlined in outlined in Section 16.1.14. The escalation/de-escalation technique has been employed to ensure that the quantum and timing of any taxes payable are calculated correctly. The financial evaluation has been undertaken on an after-tax, unleveraged basis.
For the purposes of this financial analysis, it is assumed that the MREC produced at Songwe Hill will be purchased by Mkango’s associated proposed Puławy separation plant in Poland at a 15 % discount to the contained TREO value. This differs from the general market assumption of a 25 % discount applied in the Adamas report, reflecting the integrated development strategy and transfer pricing approach adopted for this Project. More information relating to the proposed Puławy separation is summarised in Section 21.3.3.
| S-K 1300 Technical Report Summary on the Songwe Hill REE Project | Page 435 of 489 |
| |
A range of discount rates were used to determine the NPV; the NPVs are set at 30 June 2025.
A sensitivity analysis shows the impact on the NPV and internal rate of return (IRR) to changes in the metal prices, CAPEX, and OPEX.
The economic analysis applies a 10% nominal discount rate for post-tax NPV calculations to discount projected post-tax cash flows. The discount rate is a MKAR management assumption, applied consistently with the Company’s prior disclosures and with discount rates typically used to value the projected cash flows of mining projects.
| 19.3 | Sale of Gypsum By-Product |
The acid regeneration process in the hydrometallurgical plant flowsheet involves reacting calcium chloride with sulphuric acid to regenerate hydrochloric acid. Calcium sulphate (gypsum) is produced as a by-product in this process. As per SENET’s mass balance, for every 1 Mt/a of processed ore, 77,000 t/a of calcium sulphate (dihydrate) residue is produced. Based on ANSTO’s chemical analyses, the gypsum grade as CaSO4·2H2O exceeds the grade of +90 %, which is a very high-quality grade. The composition of the gypsum by-product produced during ANSTO’s pilot campaign is given in Table 19.1. This grade is suitable for cement manufacturing.
Table 19.1: Composition of Gypsum By-Product
| Element | Concentration (wt%) |
| Al | 0.002 |
| Ba | 0.003 |
| Ca | 23.6 |
| F | 0.0167 |
| Fe | < 0.003 |
| Mg | < 0.003 |
| Mn | < 0.003 |
| Na | 0.03 |
| Pb | < 0.0003 |
| S | 19.4 |
| Si | < 0.01 |
| Sr | 1.02 |
| Th | < 0.0003 |
| U | < 0.0003 |
| Zn | < 0.0005 |
| La | < 0.0003 |
| Ce | < 0.0003 |
| Pr | < 0.0003 |
| Nd | < 0.0003 |
| Y | < 0.0003 |
| HCl | 0.1 |
Most regional gypsum requirements are met through imports. By supplying gypsum directly to cement manufacturers and the agricultural sector, MKAR can undercut importers and establish a nearby, domestic source. In August 2025, Mkango obtained a delivered-to-Blantyre quote from Kemcore for 25,000 t of gypsum dihydrate at US$210/t. Applying a 28 % discount yields an assumed selling price of US$150/t for MKAR’s by-product.
| S-K 1300 Technical Report Summary on the Songwe Hill REE Project | Page 436 of 489 |
| |
| 19.4 | Rare Earth Price Assumptions |
Base case long-term rare earth price assumptions were derived from Adamas’ base case pricing scenario outlined in Section 16.1.14.
One additional pricing scenario was also analysed, based on Adamas’ upside case.
| 19.5 | Malawian Fiscal Regime |
Malawi follows a tax concession regime. The prevailing taxation regime for mining companies in Malawi includes the following provisions, which were incorporated into the financial model where applicable:
| ● | MKAR agrees that the provisions of the Tax Legislation (Taxation Act, 1963 (Act No. 46 of 1963) shall apply. |
| ● | The following benefits shall be conferred upon MKAR by the State: |
| o | Special permits or certificates required to enable MKAR to benefit from investment incentives offered under the Customs and Excise Act, 1969 (Act No. 13 of 1969), the Taxation Act, and the Value Added Tax Act, 2005 (Act No. 7 of 2005) |
| o | A period of stability equal to the Stability Period during which no Change in Tax Law that materially impairs or interferes with the Business or that materially and adversely affects the value of the Business shall affect MKAR |
| o | Upon expiry of the Stability Period, protection from any Change in Law that would specifically discriminate against MKAR or Affiliates of MKAR in respect of any matter, including any fiscal matter, vis-à-vis other companies in the mining industry |
| ● | MKAR shall pay to the State a royalty of 5 % of the gross revenue at the Mine Gate. The royalty base will be calculated as the proceeds that MKAR receives through the sale of the Mine Product into the spot market or contract as appropriate for each sale, net of the post-Mine Gate costs. |
| ● | In calculating the royalty base, MKAR shall be entitled to the following arm’s-length deductions in determining the full commercial value at the Mine Gate: |
| o | Directly related discounts, commissions and marketing costs |
| o | Costs of compliance with international safeguard requirements |
| o | Transport, logistics and associated costs incurred in transporting the Mine Product from the Mine Gate to the Point of Sale, including transport costs to the port of loading; port, handling and storage charges at the port of loading; ocean freight, shipping agency fees and demurrage charges incurred after loading and at port of discharge; marine insurance; port, handling and storage charges at the port of discharge; weighing, sampling, assaying, inspection and representation costs incurred on discharge or delivery; import taxes payable in the country of the port of discharge; any transport costs or expenses imposed on MKAR by a country which the Mine Product is transported through or exported from; and any other costs incurred by MKAR (including relevant costs charged by way of management fees) related to the transport and sale of the Mine Product. |
| S-K 1300 Technical Report Summary on the Songwe Hill REE Project | Page 437 of 489 |
| |
| ● | In the market the Mine Product will be sold into, it is customary to enter into term contracts of varying length which may involve fixing prices at the time the contract is entered into, using market-related prices, which may include a price ceiling and a floor or other market standard pricing mechanisms. Such contracted prices might not resemble the quoted spot price at the time of sale. The State acknowledges this and accepts that the full commercial value of the Mine Product at the Mine Gate will be the gross revenue after deducting the costs referred to above. |
| ● | For the purpose of determining the Royalty payable in respect of any sale of the Mine Product, MKAR shall take reasonable steps (either by the certificate of a competent independent party acceptable to the Commissioner General or otherwise to the Commissioner General’s satisfaction) to satisfy the State as to the correctness of all relevant weights, assays and analyses for the purposes of the Royalty calculation and shall give due regard to any objection or representation made by the Commissioner General as to any weight, assay or analysis affecting the Royalty calculation. The gross sum realised and any claimed deduction with respect to the calculation of the Royalty shall be supported by such information as the Commissioner General may reasonably require and any claimed deduction may be subject to audit by the Commissioner General. |
| ● | Where there is a change in effective control, capital gains tax shall be charged where a gain has been realised by MKAR, which is the reporting company in Malawi, and capital gains tax is otherwise payable under the Taxation Act. |
| ● | MKAR shall sell all the Mine Product on arm’s-length terms. Where MKAR does not sell the Mine Product to a third party but rather to an Affiliate, it shall provide details of such sales in its Accounts, including the terms thereof. The State shall be free to object to any such terms of sale within 36 months of its receipt of such Accounts; where the State objects within such time period, the matter shall be referred to an Expert and any reduction or additional Tax, together with interest thereon, shall be paid or reimbursed, as the case may be. |
| ● | Where MKAR has made an application to the Commissioner General for a refund in respect of Tax and verily believes, on the basis of legal advice, that it is owed a refund, rebate, release, credit or other form of Tax benefit or payment by the State, and if the refund is not effected within a period of 90 days from the date of the application, MKAR may, in lieu of payment, offset any Tax or other payment due to the State against the Tax Refund until the Tax Refund is fully offset. MKAR shall notify the State of any reliance upon this. Where any offset has been made and the Dispute is ultimately determined in favour of the State, MKAR shall, within 90 days of the date of the determination, pay to the State any portion of the Tax Refund, together with interest, that was held not to be owing to MKAR. |
| ● | MKAR shall maintain a Thin Capitalisation Ratio of no more than 3:1. |
| ● | MKAR will provide a list of goods and services (including the materials, equipment and consumables) that might be required to be procured for purposes of the Business. The State shall ensure that MKAR enjoys the benefit of the fiscal regime under the Taxation Act and under the Mining Development Agreement. |
| S-K 1300 Technical Report Summary on the Songwe Hill REE Project | Page 438 of 489 |
| |
| ● | MKAR may import goods specifically and exclusively for use in the Business, free of import duty, value-added tax and other applicable Taxes, including materials (e.g. pipe, steel), consumables (e.g. reagents, fuel, lubricants, spare parts), plant and equipment (e.g. yellow goods, vehicles). When a Permit is needed therefor, the State shall, upon application, which application shall specify the nature of the goods to be imported, grant the Permit in a timely manner. When importing goods to be used in the Business, the State shall provide certificates of exemption from pre-shipment inspections, where applicable. |
| ● | MKAR shall be free to transport, export and market the Mine Product free of duty and other Taxes. MKAR shall also be entitled to export capital goods free of Taxes. Should MKAR require a Permit for such purpose, then such permit shall be granted, for a maximum term permissible by Law, promptly upon application being made therefor. |
| ● | Subject to MKAR making such applications as required under applicable Laws, MKAR |
| o | Shall remit Foreign Currency including all export proceeds into Malawi in accordance with the Foreign Exchange Act, 2025 (Bill No. 19 of 2025) |
| o | May repatriate Foreign Currency from Malawi in accordance with the Foreign Exchange Act |
| o | May maintain one or more Foreign Currency accounts outside of Malawi, subject to approval by the Reserve Bank, to meet MKAR’s Foreign Currency obligations to the Project Lenders for the entire period of the loan |
| o | May retain a Foreign Currency account within Malawi and maintain in such account amounts arising from all verifiable sources associated with the Business |
| ● | Subject to approval by the Reserve Bank, any person engaged by MKAR may invoice and be paid by MKAR in foreign currency. |
| ● | MKAR shall submit to the Reserve Bank, within 30 days of the end of each Quarter, |
| o | A statement of Foreign Currency amounts remitted into Malawi within the previous Quarter from Foreign Currency accounts outside of Malawi |
| o | A statement of the balance of MKAR’s Foreign Currency accounts at the end of the previous Quarter both within and outside of Malawi and itemised transactions through its Foreign Currency accounts outside of Malawi |
| o | Audited financial statements within four months following the end of the relevant financial period |
| o | Any other information or reports as may reasonably be requested by the Reserve Bank |
| ● | MKAR shall remit into Malawi all Foreign Currency proceeds from the sale of the Mine Product; shall not engage in Speculative Currency Transactions; and, upon approval, shall be allowed to export capital goods originally purchased and brought into Malawi with Foreign Currency, provided that the State shall first be given the option to purchase the said capital goods at Fair Market Value. |
| S-K 1300 Technical Report Summary on the Songwe Hill REE Project | Page 439 of 489 |
| |
| ● | Subject to the Foreign Exchange Act, MKAR shall have access to the free transfer of funds related to MKAR’s investment, namely |
| o | The initial contribution to capital or any addition thereof related to the maintenance or expansion of the Project |
| o | The income directly related to the Project |
| o | The proceeds of sale or total or partial liquidation of the investment |
| o | The repayments of any loan, including interest thereon, relating directly to the Project |
| o | The amount of compensation, in the case of expropriation or temporary use of the investment of MKAR by the State or an agent of the State |
| o | Dividends paid by MKAR |
| o | Management fees payable by MKAR |
| ● | In satisfaction of the Mines and Minerals Act, the State agrees to exercise its right to a free equity ownership interest within the time period specified in the Mines and Minerals Act (or shall be deemed to have waived such benefit). Where it so elects, the State agrees to accept Class B Shares in any and all Mineral Holders that hold a Mining Licence pertaining to the Property, which shall entitle the holder to exercise 10 % of the voting rights of the Mineral Holder; receive 10 % of all the dividends of the Mineral Holder if and when declared; and, for so long as the State holds all the Class B Shares referred to herein, appoint one member to the board of directors of MKAR; without any obligation to make capital contributions of any kind and notwithstanding the contribution of further equity made by MKAR in respect of any share capital other than the Class B Shares. |
| 19.6 | Mineral Resource and Mineral Reserve Estimates |
The Feasibility Study for the Songwe Hill Rare Earth Project based on the NI 43-101 Mineral Resource Estimate prepared by MSA entitled “NI 43-101 Technical Report – 23 January 2019 Mineral Resource Estimate” was filed on 3 February 2020. The Mineral Resource was originally reported with an effective date of 23 January 2019. Since then, various studies have been completed that have affected the assumptions used to demonstrate reasonable prospects for economic extraction. An updated Mineral Resource statement has been issued with an effective date of 30 June 2025 in order to incorporate the revised assumptions; however, as no exploration drilling or other mining activity has been completed since 2018, the block model used to report the 23 January 2019 Mineral Resource remains valid. The current Mineral Resource estimates are stated in Section 11.
This report also supports the declaration of a Mineral Reserve Estimate for the Project as summarised below and outlined in Sections 12.3.3 and 12.5.
The work reported in this report has demonstrated that a portion of the resources stated in the Mineral Resource statement can be viably mined, processed and sold and will support a sustainable mining and processing operation.
Applying the mining modifying factors, process recovery, OPEX and product prices, the Project is shown to be profitable and viable. This work supports the declaration of Mineral Reserves in accordance with the S-K 1300 definitions.
Although the QP was not responsible for the completion of the processing, tailings storage, environmental and financial modelling sections of this report, the QP has relied on the specialists in these fields for completion of their respective sections. The QP has reviewed the sections completed by others and has found no reason not to accept their work. The results of the 2022 DFS have shown that the mining inventory included in the study, which is derived from only Measured and Indicated Mineral Resources, can be viably mined based on the techno-economic assumptions documented in this report.
| S-K 1300 Technical Report Summary on the Songwe Hill REE Project | Page 440 of 489 |
| |
In estimating the Mineral Reserves, only material from the Measured and Indicated Mineral Resources has been included in the inventory. Mineral Reserves resulting from Measured Mineral Resources have been considered as Proven Mineral Reserves, while those generated from Indicated Mineral Resources are categorised as Probable Mineral Reserves. Table 19.2 shows a summary of the total Mineral Reserves.
Table 19.2: Mineral Reserve Summary as at 30 April 2025
| Category | Tonnage (Mt) | TREO (%) | TREO (t) |
| Proven Mineral Reserves | 8.160 | 1.28 | 104,183 |
| Probable Mineral Reserves | 9.988 | 1.07 | 106,801 |
| Total Mineral Reserves | 18.147 | 1.16 | 210,984 |
|
NOTE: Totals might not add up due to rounding. Mineral Reserves are stated as tonnages and grades delivered to the processing plant and are inclusive of dilution and mining losses expected during mining. The Mineral Reserve estimate is reported on a 100 % ownership basis. The Mineral Reserve is stated at a cut-off grade of 0.6 % TREO, which was supported by metal prices stated in Table 12.3. Ore tonnages are stated at an average in-situ density of 2.76 t/m3. | |||
NOTE:
| ● | Type 2 material, which is mineralised material with a grade above the cut-off grade but with an Mn:Mg ratio of greater then 3.5, is stockpiled on site for possible future processing. This material is excluded from both the ROM ore inventory and any Mineral Reserve estimate. |
| ● | Inferred Resources are not considered as ore in the mine plan and as such are treated as waste and not included in the ROM ore inventory. |
The following modifying factors were used to convert the Mineral Resource Estimate to the Mineral Reserve Estimate:
| ● | Mining recovery: | 95 % | |
| ● | Mining dilution: | 3 % | |
| ● | TREO recovery: | 39.6 % | |
| ● | Product price: | US$40.86/kg TREO recovered in carbonate | |
| ● | Product price: | US$16.18/kg TREO mined |
Indicated Mineral Resources are stated exclusive of Mineral Reserves. Mineral Resources that are not Mineral Reserves do not have demonstrated economic viability. The financial valuation is based on the mining of the ROM Type 1 ore (high grade and medium grade), 18,246,334 t of estimated Mineral Reserves only.
| 19.7 | Mining and Processing Assumptions |
The mining and processing inputs to the financial model are based on those outlined in Section 13.6 and summarised below. Table 19.3 to Table 19.5 are sourced from the Songwe Hill financial model.
| S-K 1300 Technical Report Summary on the Songwe Hill REE Project | Page 441 of 489 |
| |
The active mining period is 12 years and 4 months, with the first tonnage being mined in June 2029.
Table 19.3: Summary of Mining and Processing Inputs and Results – Average over First Five Years
| Item | Unit | Value |
| Mining | ||
| Average yearly ore mined | kt | 2,186 |
| Average TREO grade mined | % | 1.19 |
| Average yearly waste mined | kt | 3,667 |
| Average strip ratio (waste to ore) | 1.68 | |
| Processing | ||
| Average yearly flotation plant feed | kt | 1,000.8 |
| Average head TREO grade | % | 1.50 |
| Flotation TREO concentrate grade | % | 15.05 |
| Average TREO recovery to concentrate | % | 74.10 |
| Average yearly flotation concentrate feed to hydrometallurgical plant | kt | 74.06 |
| Average NdPr oxide hydrometallurgical recovery to carbonate | % | 85.26 |
| Average Ce oxide hydrometallurgical recovery to carbonate | % | 20.88 |
| Average yearly TREOs in carbonate product | kt | 5,954 |
| Average carbonate TREO grade | % | 55 |
| Average yearly carbonate production | t/a | 10,826 |
| NOTE: The first five years refer to the 60 months from the start of processing in January 2030. Mining excludes the first five months of mined and stockpiled ore prior to the start of processing (819,437 t above 1.00 % TREO). | ||
Table 19.4: Summary of Mining and Processing Inputs and Results – LOO
| Item | Unit | Value |
| LOO | Years | 18 |
| Mining | ||
| Average yearly ore mined | kt | 1,481.5 |
| Average TREO grade mined | % | 1.16 |
| Average yearly waste mined | kt | 3,310.5 |
| Average strip ratio (waste to ore) | 2.2 | |
| Processing | ||
| Average yearly flotation plant feed | kt | 1,000.80 |
| Average head TREO grade | % | 1.16 |
| Flotation TREO concentrate grade | % | 11.64 |
| Average TREO recovery to concentrate | % | 74.10 |
| Average yearly flotation concentrate feed to hydrometallurgical plant | kt | 74.06 |
| Average NdPr oxide hydrometallurgical recovery to carbonate | % | 85.26 |
| Average Ce oxide hydrometallurgical recovery to carbonate | % | 20.88 |
| Average yearly TREOs in carbonate product | t | 4,633.56 |
| Average carbonate TREO grade | % | 55.00 |
| Average yearly carbonate production (dry basis) | t | 8,424.65 |
| S-K 1300 Technical Report Summary on the Songwe Hill REE Project | Page 442 of 489 |
| |
Table 19.5: Summary of Mining and Processing Inputs and Results – Total LOO
| Item | Unit | Value |
| Mining | ||
| Total LOO ore production | kt | 18,147.8 |
| Waste mined | kt | 40,553.9 |
| Strip ratio (waste to ore) | 2.2 | |
| Total LOO plant feed | kt | 18,127.0 |
| Average yearly plant feed | kt | 982.0 |
| Processing | ||
| Tonnes to hydrometallurgical plant | kt | 1,341.4 |
| Contained REOs in carbonate product | kt | 83.4 |
| Total carbonate production (dry basis) | t | 151,644 |
| 19.8 | Capital and Operating Costs |
The CAPEX and OPEX inputs to the financial model (see Table 19.6 to Table 19.8) are outlined in Section 18.
Table 19.6: Capital Costs
| Item | Unit | Value |
| Total real development capital | US$ million | 297.8 |
| Contingency | US$ million | 27.8 |
| Total Real Development Capital Including Contingency | US$ million | 325.5 |
| Sustaining capital and reclamation | US$ million | 91.5 |
| Total Real CAPEX | US$ million | 417.0 |
Table 19.7: Operating Costs – Average over First Five Years
| Item | Unit | Value |
| Mining | US$/kg TREO | 5.4 |
| Beneficiation – Milling and Flotation | US$/kg TREO | 9.1 |
| Hydrometallurgical Plant | US$/kg TREO | 5.2 |
| G&A and Other | US$/kg TREO | 2.5 |
| Total OPEX | US$/kg TREO | 22.3 |
| S-K 1300 Technical Report Summary on the Songwe Hill REE Project | Page 443 of 489 |
| |
Table 19.8: Operating Costs – Average over LOO
| Item | Unit | Value |
| Mining | US$/kg TREO | 4.4 |
| Beneficiation – Milling and Flotation | US$/kg TREO | 11.6 |
| Hydrometallurgical Plant | US$/kg TREO | 6.8 |
| G&A and Other | US$/kg TREO | 3.2 |
| Total OPEX | US$/kg TREO | 26.1 |
| 19.9 | Discounted Cash Flow Valuation Analysis |
Based on the preceding assumptions, the DCF valuation analysis for the base case gave the following results:
| ● | NPV at 10 % (nominal) (7.3 % real) of US$339 million as at 30 June 2025 |
| ● | IRR of 24.32 % (nominal) (21.28 % real) |
Table 19.9 and Table 19.10 summarise selected financial inputs and the corresponding results. All costs are quoted in real July 2025 US dollars.
Table 19.9: Summary of Selected Financial Inputs and Corresponding Results – Post-Tax Valuation
| Item | Unit | Value |
| Post-Tax Project cash flow (nominal) (including royalty) | US$ million | 1,554.0 |
| Payback period from Project start | Years | 5.9 |
| Payback period from start of production | Years | 3.4 |
| Post-tax NPV at 10 % (nominal) discount rate | US$ million | 339.5 |
| Post-tax IRR (nominal) | % | 24.32 |
| S-K 1300 Technical Report Summary on the Songwe Hill REE Project | Page 444 of 489 |
| |
Table 19.10: NPVs of Songwe Hill Project1
| Financial
Evaluation |
Nominal
Discount Rate (%) |
Real Discount Rate (%) |
Adamas
Base Case Post-Tax NPV (US$ million) |
Adamas
Upside Case Post-Tax NPV (US$ million) |
| Upside Case | 8.0 | 5.37 | 461.2 | 644.8 |
| Base Case | 10.0 | 7.32 | 339.5 | 488.5 |
| Low side Case | 12.0 | 9.27 | 247.3 | 369.8 |
| Nominal IRR | 24.32 % | 29.30 % | ||
| Real IRR | 21.28 % | 26.14 % | ||
| 1 As at 30 June 2025 | ||||
| 19.10 | Sensitivity Analysis |
The sensitivity chart (see Figure 19.1) shows the base case NPV at a 20% variation from the base case due to changes in revenue, CAPEX and OPEX, holding all other inputs constant. The Project is most sensitive to metal prices and more sensitive to OPEX than to CAPEX. The revenue sensitivity assumes that all rare earth metal prices change by the same percentage and that the tolling rate does not change with rare earth prices.

Figure 19.1: NPV at 20% Nominal Sensitivity Analysis
| S-K 1300 Technical Report Summary on the Songwe Hill REE Project | Page 445 of 489 |
| |
Figure 19.2 shows the nominal annual cash flows over the life of the Project.
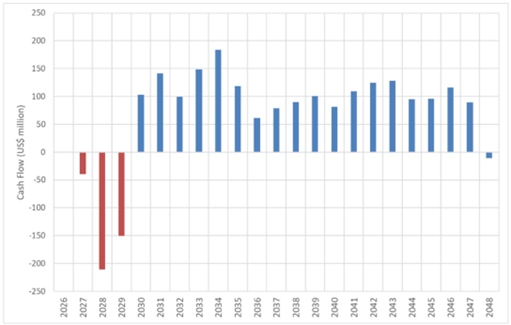
Figure 19.2: Annual Cash Flow (Nominal)
The maximum negative cash flow of US$211 million (nominal) occurs in 2028 as shown in Figure 19.2. The cumulative annual cash flow (nominal) is shown in Figure 19.3.
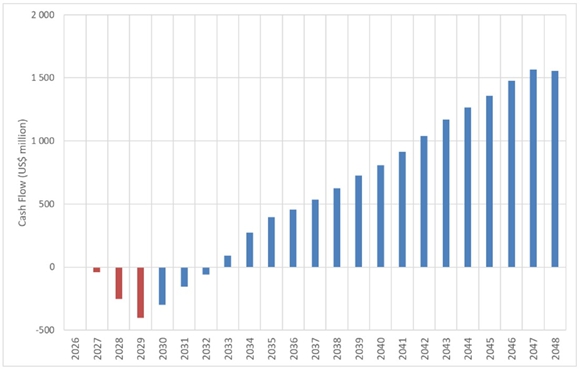
Figure 19.3: Cumulative Annual Cash Flow (Nominal)
| S-K 1300 Technical Report Summary on the Songwe Hill REE Project | Page 446 of 489 |
| |
Table 19.11 to Table 19.13 show the matrices of the NPV for percentage variations in revenue (all metals), OPEX and CAPEX.
Table 19. 11: Sensitivity of NPV (Nominal) to Changes in Metal Prices (All Metals)
| Revenue | ||||||||
| NPV (US$ million) | ||||||||
| Nominal Discount Rate: --> | 0.0 % | 9.0 % | 10.0 % | 11.0 % | 12.0 % | 13.0 % | 14.0 % | |
| Change in Metal Prices |
20 % | 2,241.91 | 629.04 | 549.51 | 480.13 | 419.46 | 366.27 | 319.53 |
| 15 % | 2,069.94 | 570.93 | 497.15 | 432.81 | 376.58 | 327.31 | 284.04 | |
| 10 % | 1,897.97 | 512.76 | 444.72 | 385.42 | 333.63 | 288.28 | 248.48 | |
| 5 % | 1,726.00 | 454.51 | 392.21 | 337.96 | 290.61 | 249.18 | 212.86 | |
| 0 % | 1,554.03 | 396.04 | 339.47 | 290.26 | 247.34 | 209.83 | 176.98 | |
| −5 % | 1,382.06 | 337.10 | 286.26 | 242.07 | 203.57 | 169.98 | 140.60 | |
| −10 % | 1,210.09 | 278.10 | 232.97 | 193.81 | 159.74 | 130.06 | 104.15 | |
| −15 % | 1,038.12 | 219.03 | 179.62 | 145.48 | 115.84 | 90.07 | 67.64 | |
| −20 % | 866.15 | 159.77 | 126.08 | 96.95 | 71.74 | 49.89 | 30.93 | |
Table 19.12: Sensitivity of NPV (Nominal) to Changes in OPEX
| OPEX | ||||||||
| NPV (US$ million) | ||||||||
| Nominal Discount Rate: --> | 0.0 % | 9.0 % | 10.0 % | 11.0 % | 12.0 % | 13.0 % | 14.0 % | |
| Change in OPEX |
20 % | 1,193.82 | 268.61 | 223.88 | 185.08 | 151.34 | 121.97 | 96.35 |
| 15 % | 1,283.88 | 300.47 | 252.78 | 211.37 | 175.34 | 143.93 | 116.51 | |
| 10 % | 1,373.93 | 332.32 | 281.68 | 237.67 | 199.34 | 165.90 | 136.67 | |
| 5 % | 1,463.98 | 364.18 | 310.58 | 263.96 | 223.34 | 187.86 | 156.82 | |
| 0 % | 1,554.03 | 396.04 | 339.47 | 290.26 | 247.34 | 209.83 | 176.98 | |
| −5 % | 1,644.09 | 427.69 | 368.16 | 316.34 | 271.12 | 231.57 | 196.92 | |
| −10 % | 1,734.14 | 459.19 | 396.68 | 342.24 | 294.72 | 253.13 | 216.66 | |
| −15 % | 1,824.19 | 490.68 | 425.20 | 368.15 | 318.32 | 274.69 | 236.41 | |
| −20 % | 1,914.24 | 522.18 | 453.73 | 394.06 | 341.92 | 296.25 | 256.16 | |
Table 19.13: Sensitivity of NPV (Nominal) to Changes in CAPEX
| CAPEX | ||||||||
| NPV (US$ million) | ||||||||
| Nominal Discount Rate: --> | 0.0 % | 9.0 % | 10.0 % | 11.0 % | 12.0 % | 13.0 % | 14.0 % | |
| Change in CAPEX |
20 % | 1,457.21 | 334.39 | 280.19 | 233.17 | 192.29 | 156.69 | 125.64 |
| 15 % | 1,481.41 | 349.80 | 295.01 | 247.44 | 206.05 | 169.98 | 138.47 | |
| 10 % | 1,505.62 | 365.21 | 309.83 | 261.71 | 219.81 | 183.26 | 151.31 | |
| 5 % | 1,529.83 | 380.62 | 324.65 | 275.98 | 233.58 | 196.54 | 164.15 | |
| 0 % | 1,554.03 | 396.04 | 339.47 | 290.26 | 247.34 | 209.83 | 176.98 | |
| −5 % | 1,578.24 | 411.45 | 354.29 | 304.53 | 261.10 | 223.11 | 189.82 | |
| −10 % | 1,602.45 | 426.86 | 369.12 | 318.80 | 274.86 | 236.40 | 202.66 | |
| −15 % | 1,626.65 | 442.27 | 383.94 | 333.08 | 288.62 | 249.68 | 215.49 | |
| −20 % | 1,650.86 | 457.68 | 398.76 | 347.35 | 302.38 | 262.97 | 228.33 | |
| S-K 1300 Technical Report Summary on the Songwe Hill REE Project | Page 447 of 489 |
| |
Table 19.14 shows the effect on the NPV at 10 % of a two-way variation in OPEX and CAPEX.
Table 19.14: Sensitivity of NPV at 10 % (Nominal) to Two-Way Variation in OPEX and CAPEX
| NPV at 10 % (Nominal) (US$ million) | ||||||||||
| Change in OPEX | ||||||||||
| 20.00 % | 15.00 % | 10.00 % | 5.00 % | 0 % | −5.00 % | −10.00 % | −15.00 % | −20.00 % | ||
| Change
in CAPEX |
20 % | 164.60 | 193.50 | 222.39 | 251.29 | 280.19 | 308.88 | 337.40 | 365.92 | 394.44 |
| 15 % | 179.42 | 208.32 | 237.22 | 266.11 | 295.01 | 323.70 | 352.22 | 380.74 | 409.26 | |
| 10 % | 194.24 | 223.14 | 252.04 | 280.93 | 309.83 | 338.52 | 367.04 | 395.56 | 424.08 | |
| 5 % | 209.06 | 237.96 | 266.86 | 295.76 | 324.65 | 353.34 | 381.86 | 410.38 | 438.90 | |
| 0 % | 223.88 | 252.78 | 281.68 | 310.58 | 339.47 | 368.16 | 396.68 | 425.20 | 453.73 | |
| −5 % | 238.70 | 267.60 | 296.50 | 325.40 | 354.29 | 382.99 | 411.51 | 440.03 | 468.55 | |
| −10 % | 253.53 | 282.42 | 311.32 | 340.22 | 369.12 | 397.81 | 426.33 | 454.85 | 483.37 | |
| −15 % | 268.35 | 297.24 | 326.14 | 355.04 | 383.94 | 412.63 | 441.15 | 469.67 | 498.19 | |
| −20 % | 283.17 | 312.06 | 340.96 | 369.86 | 398.76 | 427.45 | 455.97 | 484.49 | 513.01 | |
A schedule sensitivity was also evaluated. Advancing the start of commercial production by 12 months, such that the first full month of production occurs in January 2029 rather than January 2030, reduces the base case NPV by US$4 million, equivalent to a 1.2 % decrease.
| 19.11 | Free Cash Flow Forecasts |
Table 19.15 shows the DCF model for the Songwe Hill Project in nominal terms.
| S-K 1300 Technical Report Summary on the Songwe Hill REE Project | Page 448 of 489 |
| |
Table 19.15: Cash Flow Model – Songwe Hill Project
| Item | Unit | Total | 2026 | 2027 | 2028 | 2029 | 2030 | 2031 | 2032 | 2033 | 2034 | 2035 | 2036 | 2037 | 2038 | 2039 | 2040 | 2041 | 2042 | 2043 | 2044 | 2045 | 2046 | 2047 | 2048 |
| Mining
and Processing Plan |
, | ||||||||||||||||||||||||
| Total Mined | t | 58,701,712 | 0 | 0 | 0 | 5,193,999 | 7,281,875 | 5,855,997 | 5,582,458 | 5,475,001 | 5,067,231 | 3,660,000 | 3,650,000 | 3,650,001 | 3,650,000 | 3,660,000 | 3,650,000 | 2,325,152 | 0 | 0 | 0 | 0 | 0 | 0 | 0 |
| Waste | t | 40,553,931 | 0 | 0 | 0 | 4,349,608 | 4,285,962 | 3,309,696 | 3,868,016 | 3,468,889 | 3,399,898 | 3,207,240 | 3,154,895 | 2,919,806 | 2,195,636 | 2,812,030 | 2,286,505 | 1,295,751 | 0 | 0 | 0 | 0 | 0 | 0 | 0 |
| Type 1 Ore | t | 18,147,781 | 0 | 0 | 0 | 844,391 | 2,995,913 | 2,546,301 | 1,714,442 | 2,006,112 | 1,667,333 | 452,760 | 495,105 | 730,195 | 1,454,364 | 847,970 | 1,363,495 | 1,029,401 | 0 | 0 | 0 | 0 | 0 | 0 | 0 |
| Stripping Ratio | 2.23 | na | na | na | 5.15 | 1.43 | 1.30 | 2.26 | 1.73 | 2.04 | 7.08 | 6.37 | 4.00 | 1.51 | 3.32 | 1.68 | 1.26 | na | na | na | na | na | na | na | |
| Type
1 Ore Processed |
t | 18,127,011 | 0 | 0 | 0 | 79,230 | 1,000,800 | 1,000,800 | 1,000,800 | 1,000,800 | 1,000,800 | 1,000,800 | 1,000,800 | 1,000,800 | 1,000,800 | 1,000,800 | 1,000,800 | 1,000,800 | 1,000,800 | 1,000,800 | 1,000,800 | 1,000,800 | 1,000,800 | 1,000,800 | 33,381 |
| Grade
Processed |
% | 1.16 | na | na | na | 1.49 | 1.48 | 1.44 | 1.49 | 1.54 | 1.58 | 1.13 | 1.02 | 1.00 | 1.07 | 1.11 | 1.12 | 1.10 | 1.09 | 1.09 | 1.01 | 0.88 | 0.88 | 0.88 | 0.88 |
| REO
Entering Processing |
t | 210,672 | 0 | 0 | 0 | 1,180 | 14,778 | 14,407 | 14,867 | 15,368 | 15,778 | 11,279 | 10,241 | 9,978 | 10,730 | 11,125 | 11,165 | 10,980 | 10,928 | 10,928 | 10,154 | 8,831 | 8,831 | 8,831 | 295 |
| REO
in Flotation Concentrate |
t | 156,095 | 0 | 0 | 0 | 874 | 10,950 | 10,675 | 11,015 | 11,387 | 11,690 | 8,357 | 7,588 | 7,393 | 7,951 | 8,243 | 8,272 | 8,136 | 8,097 | 8,097 | 7,524 | 6,543 | 6,543 | 6,543 | 218 |
| REO
in Mixed Chemical Carbonate |
t | 83,404 | 0 | 0 | 0 | 467 | 5,851 | 5,704 | 5,886 | 6,084 | 6,246 | 4,465 | 4,054 | 3,950 | 4,248 | 4,404 | 4,420 | 4,347 | 4,326 | 4,326 | 4,020 | 3,496 | 3,496 | 3,496 | 117 |
| REO
Value in Carbonate (Nominal) |
|||||||||||||||||||||||||
| Total | US$ | 7,183,724,393 | 0 | 0 | 0 | 23,644,745 | 313,685,220 | 351,378,551 | 412,334,345 | 494,092,286 | 567,449,427 | 388,402,670 | 339,637,240 | 337,618,801 | 371,303,260 | 393,658,619 | 404,952,998 | 408,208,072 | 416,413,685 | 426,824,027 | 406,525,828 | 362,390,709 | 371,450,477 | 380,736,739 | 13,016,694 |
| Carbonate
Basket Discount (Nominal) |
US$ | 1,077,558,659 | 0 | 0 | 0 | 3,546,712 | 47,052,783 | 52,706,783 | 61,850,152 | 74,113,843 | 85,117,414 | 58,260,401 | 50,945,586 | 50,642,820 | 55,695,489 | 59,048,793 | 60,742,950 | 61,231,211 | 62,462,053 | 64,023,604 | 60,978,874 | 54,358,606 | 55,717,572 | 57,110,511 | 1,952,504 |
| Total
Revenue After Discount (Nominal) |
US$ | 6,106,165,734 | 0 | 0 | 0 | 20,098,033 | 266,632,437 | 298,671,768 | 350,484,193 | 419,978,443 | 482,332,013 | 330,142,270 | 288,691,654 | 286,975,981 | 315,607,771 | 334,609,826 | 344,210,049 | 346,976,861 | 353,951,632 | 362,800,423 | 345,546,954 | 308,032,103 | 315,732,906 | 323,626,228 | 11,064,190 |
| Royalty | US$ | 304,445,434 | 0 | 0 | 0 | 1,000,069 | 13,271,094 | 14,874,580 | 17,463,320 | 20,935,980 | 24,051,980 | 16,460,919 | 14,392,640 | 14,307,934 | 15,736,440 | 16,684,927 | 17,164,774 | 17,303,872 | 17,652,825 | 18,095,265 | 17,235,759 | 15,365,436 | 15,750,476 | 16,145,142 | 552,003 |
| Gypsum
By-Product Revenue (Nominal) |
US$ | 294,464,026 | 0 | 0 | 0 | 1,010,106 | 13,078,219 | 13,405,175 | 13,740,304 | 14,083,812 | 14,435,907 | 14,796,804 | 15,166,725 | 15,545,893 | 15,934,540 | 16,332,904 | 16,741,226 | 17,159,757 | 17,588,751 | 18,028,469 | 18,479,181 | 18,941,161 | 19,414,690 | 19,900,057 | 680,347 |
| Net
Revenue (Nominal) |
US$ | 6,096,184,325 | 0 | 0 | 0 | 20,108,070 | 266,439,562 | 297,202,363 | 346,761,177 | 413,126,275 | 472,715,940 | 328,478,155 | 289,465,739 | 288,213,940 | 315,805,871 | 334,257,803 | 343,786,500 | 346,832,746 | 353,887,558 | 362,733,628 | 346,790,376 | 311,607,828 | 319,397,119 | 327,381,143 | 11,192,533 |
| OPEX
(REAL) |
|||||||||||||||||||||||||
| Mining OPEX | |||||||||||||||||||||||||
| TSF Costs | US$ | 11,754,167 | 0 | 0 | 0 | 0 | 650,000 | 650,000 | 650,000 | 650,000 | 650,000 | 650,000 | 650,000 | 650,000 | 650,000 | 650,000 | 650,000 | 650,000 | 650,000 | 650,000 | 650,000 | 650,000 | 650,000 | 650,000 | 54,167 |
| Mining
Cost (Bara) |
US$ | 369,055,380 | 0 | 0 | 0 | 25,707,805 | 39,184,469 | 31,062,579 | 31,583,020 | 30,906,751 | 28,804,781 | 24,487,471 | 24,520,960 | 24,120,917 | 23,346,650 | 23,913,804 | 23,140,307 | 17,558,660 | 3,036,714 | 3,036,714 | 3,276,549 | 3,686,801 | 3,686,801 | 3,686,801 | 306,830 |
| Milling/Flotation
OPEX |
|||||||||||||||||||||||||
| Milling/Flotation
Total |
US$ | 566,371,558 | 0 | 0 | 0 | 2,644,239 | 31,254,877 | 31,254,877 | 31,254,877 | 31,254,877 | 31,254,877 | 31,254,877 | 31,254,877 | 31,254,877 | 31,254,877 | 31,254,877 | 31,254,877 | 31,254,877 | 31,254,877 | 31,254,877 | 31,254,877 | 31,254,877 | 31,254,877 | 31,254,877 | 1,139,527 |
| Hydro- metallurgical Plant OPEX |
|||||||||||||||||||||||||
| Hydro- metallurgical Plant Total |
US$ | 967,733,330 | 0 | 0 | 0 | 4,469,768 | 54,279,828 | 54,177,808 | 54,304,153 | 54,441,975 | 54,554,690 | 53,317,291 | 53,031,731 | 52,959,384 | 53,166,428 | 53,274,928 | 53,285,945 | 53,235,128 | 53,220,695 | 53,220,695 | 53,007,936 | 52,644,000 | 52,644,000 | 52,644,000 | 1,852,947 |
| Total Processing | US$ | 1,534,104,888 | 0 | 0 | 0 | 7,114,007 | 85,534,706 | 85,432,685 | 85,559,030 | 85,696,853 | 85,809,567 | 84,572,168 | 84,286,608 | 84,214,262 | 84,421,306 | 84,529,805 | 84,540,823 | 84,490,005 | 84,475,572 | 84,475,572 | 84,262,813 | 83,898,877 | 83,898,877 | 83,898,877 | 2,992,474 |
| G&A/Other
(Real) |
|||||||||||||||||||||||||
| G&A | US$ | 214,227,916 | 0 | 1,109,989 | 3,329,968 | 9,989,903 | 11,099,892 | 11,099,892 | 11,099,892 | 11,099,892 | 11,099,892 | 11,099,892 | 11,099,892 | 11,099,892 | 11,099,892 | 11,099,892 | 11,099,892 | 11,099,892 | 11,099,892 | 11,099,892 | 11,099,892 | 11,099,892 | 11,099,892 | 11,099,892 | 0 |
| Concentrate
Transport |
US$ | 17,257,045 | 0 | 0 | 0 | 96,646 | 1,210,558 | 1,180,175 | 1,217,803 | 1,258,849 | 1,292,417 | 923,898 | 838,853 | 817,307 | 878,969 | 911,282 | 914,563 | 899,429 | 895,130 | 895,130 | 831,767 | 723,380 | 723,380 | 723,380 | 24,128 |
| S-K 1300 Technical Report Summary on the Songwe Hill REE Project | Page 449 of 489 |
| |
| Item | Unit | Total | 2026 | 2027 | 2028 | 2029 | 2030 | 2031 | 2032 | 2033 | 2034 | 2035 | 2036 | 2037 | 2038 | 2039 | 2040 | 2041 | 2042 | 2043 | 2044 | 2045 | 2046 | 2047 | 2048 |
| Community
Development Agreement (0.45 %) |
US$ | 19,877,625 | 0 | 0 | 0 | 81,935 | 1,060,489 | 1,158,947 | 1,326,826 | 1,551,131 | 1,737,976 | 1,160,580 | 990,112 | 960,222 | 1,030,267 | 1,065,656 | 1,069,493 | 1,051,795 | 1,046,769 | 1,046,769 | 972,671 | 845,924 | 845,924 | 845,924 | 28,215 |
| Total
G&A and Other Costs |
US$ | 270,599,983 | 0 | 1,109,989 | 3,329,968 | 10,344,168 | 14,425,043 | 14,493,118 | 14,698,624 | 14,963,976 | 15,184,389 | 14,238,474 | 13,982,961 | 13,931,525 | 14,063,232 | 14,130,934 | 14,138,052 | 14,105,220 | 14,095,895 | 14,095,895 | 13,958,434 | 13,723,300 | 13,723,300 | 13,723,300 | 140,185 |
| Total
Cash OPEX (Real) |
US$ | 2,185,514,417 | 0 | 1,109,989 | 3,329,968 | 43,165,980 | 139,794,218 | 131,638,382 | 132,490,674 | 132,217,580 | 130,448,737 | 123,948,113 | 123,440,529 | 122,916,704 | 122,481,188 | 123,224,543 | 122,469,182 | 116,803,885 | 102,258,181 | 102,258,181 | 102,147,796 | 101,958,978 | 101,958,978 | 101,958,978 | 3,493,655 |
| Cash
Costs (Nominal) |
US$ | 3,022,780,260 | 0 | 1,166,182 | 3,586,011 | 47,647,165 | 158,164,327 | 152,660,165 | 157,489,777 | 161,094,282 | 162,912,597 | 158,664,063 | 161,964,671 | 165,309,301 | 168,841,671 | 174,113,053 | 177,371,892 | 173,396,023 | 155,597,915 | 159,487,863 | 163,298,594 | 167,071,657 | 171,248,448 | 175,529,659 | 6,164,941 |
| Earnings
before Interest, Taxes, Depreciation, and Amortisation |
US$ | 3,073,404,065 | 0 | -1,166,182 | -3,586,011 | -27,539,095 | 108,275,235 | 144,542,198 | 189,271,400 | 252,031,993 | 309,803,342 | 169,814,092 | 127,501,067 | 122,904,638 | 146,964,200 | 160,144,749 | 166,414,609 | 173,436,723 | 198,289,642 | 203,245,764 | 183,491,782 | 144,536,171 | 148,148,671 | 151,851,483 | 5,027,593 |
| % margin | % | na | na | na | -137 | 41 | 48 | 54 | 60 | 64 | 51 | 44 | 43 | 47 | 48 | 48 | 50 | 56 | 56 | 53 | 47 | 47 | 47 | 45 | |
| Earnings
before Interest and Taxes |
US$ | 2,524,943,550 | 0 | -19,774,489 | -113,402,538 | -94,523,515 | 99,215,567 | 135,254,244 | 178,753,004 | 241,248,517 | 298,747,962 | 158,479,782 | 114,137,948 | 109,204,321 | 132,917,886 | 145,743,344 | 148,988,918 | 155,570,224 | 179,970,430 | 184,461,336 | 158,404,704 | 118,810,513 | 121,764,287 | 117,164,819 | -46,193,713 |
| CAPEX (Including Sustaining CAPEX) |
|||||||||||||||||||||||||
| Total
Development CAPEX (Real) |
US$ | 416,974,295 | 0 | 36,451,140 | 192,705,617 | 103,328,310 | 27,837 | 27,837 | 14,276,392 | 27,837 | 27,837 | 27,837 | 17,293,733 | 27,837 | 27,837 | 27,837 | 16,556,160 | 27,837 | 27,837 | 27,837 | 18,243,636 | 27,837 | 27,837 | 8,878,715 | 8,878,715 |
| Total CAPEX (Real) |
US$ | 408,640,962 | 0 | 36,451,140 | 184,372,284 | 103,328,310 | 27,837 | 27,837 | 14,276,392 | 27,837 | 27,837 | 27,837 | 17,293,733 | 27,837 | 27,837 | 27,837 | 16,556,160 | 27,837 | 27,837 | 27,837 | 18,243,636 | 27,837 | 27,837 | 8,878,715 | 8,878,715 |
| Total CAPEX (Nominal) |
US$ | 484,134,454 | 0 | 38,296,478 | 207,522,872 | 114,055,120 | 31,495 | 32,282 | 16,970,143 | 33,916 | 34,764 | 35,634 | 22,690,876 | 37,437 | 38,373 | 39,333 | 23,978,257 | 41,324 | 42,357 | 43,416 | 29,165,192 | 45,614 | 46,754 | 15,285,341 | 15,667,475 |
| Depreciation
(Real) |
US$ | 416,974,295 | 0 | 17,711,654 | 101,975,563 | 60,684,578 | 8,007,427 | 8,008,973 | 8,848,761 | 8,850,501 | 8,852,357 | 8,854,345 | 10,184,632 | 10,186,952 | 10,189,482 | 10,192,266 | 12,031,839 | 12,035,319 | 12,039,296 | 12,043,935 | 15,692,662 | 15,699,622 | 15,708,901 | 20,148,258 | 29,026,973 |
| Depreciation
(Nominal) |
US$ | 3,073,404,065 | 0 | -1,166,182 | -3,586,011 | -27,539,095 | 108,275,235 | 144,542,198 | 189,271,400 | 252,031,993 | 309,803,342 | 169,814,092 | 127,501,067 | 122,904,638 | 146,964,200 | 160,144,749 | 166,414,609 | 173,436,723 | 198,289,642 | 203,245,764 | 183,491,782 | 144,536,171 | 148,148,671 | 151,851,483 | 5,027,593 |
| Cash
Flow (Nominal – with Inflation) |
US$ | 1,554,034,019 | 0 | -39,410,831 | -211,001,335 | -150,324,105 | 102,623,417 | 141,509,276 | 99,471,138 | 148,582,630 | 184,054,900 | 118,985,526 | 61,428,485 | 78,357,427 | 90,072,196 | 100,877,055 | 81,432,129 | 109,442,210 | 124,522,084 | 127,967,865 | 95,259,953 | 95,958,629 | 115,750,862 | 89,114,391 | -10,639,882 |
| Cash
Flow (Real – without Inflation) |
US$ | 1,057,498,964 | 0 | -37,511,796 | -195,935,715 | -136,186,220 | 90,704,147 | 122,023,005 | 83,681,610 | 121,948,684 | 147,377,978 | 92,951,302 | 46,817,399 | 58,263,126 | 65,340,206 | 71,393,435 | 56,226,081 | 73,723,001 | 81,835,298 | 82,048,632 | 59,587,741 | 58,560,763 | 68,916,476 | 51,763,401 | -6,029,592 |
| S-K 1300 Technical Report Summary on the Songwe Hill REE Project | Page 450 of 489 |
| |
| 19.12 | Conclusions |
A DCF model prepared by MKAR was reviewed by SENET and a third party and incorporates the LOO plan figures, economic assumptions as to the US inflation rates, and the REO and carbonate prices as outlined in Section 16.1.14. The escalation/de-escalation technique has been employed to ensure that the quantum and timing of any taxes payable are calculated correctly. The financial evaluation has been undertaken on an after-tax, unleveraged basis.
A range of discount rates were used to determine the NPV; the NPVs are set at 30 June 2025.
The prevailing taxation regime for mining companies in Malawi was incorporated into the financial model where applicable.
This report supports the declaration of a Mineral Reserve Estimate for the Project as summarised below and outlined in Sections 12.3.3 and 12.5.
The work reported in this report has demonstrated that a portion of the Mineral Resources converted to Mineral Reserves can be viably mined, processed and sold and will support a sustainable mining and processing operation.
Applying the mining modifying factors, process recovery, OPEX and product prices, the Project is shown to be profitable and viable. This work supports the declaration of Mineral Reserves in accordance with S-K 1300 definitions.
In estimating the Mineral Reserves, only material from the Measured and Indicated Mineral Resources has been included in the inventory. Mineral Reserves resulting from Measured Mineral Resources have been considered as Proven Mineral Reserves, while those generated from Indicated Mineral Resources are categorised as Probable Mineral Reserves. Table 19.2 shows a summary of the total Mineral Reserves.
The following modifying factors were used to convert the Mineral Resource Estimate to the Mineral Reserve Estimate:
| ● | Mining recovery: 95 % |
| ● | Mining dilution: 3 % |
| ● | TREO recovery: 39.6 % |
| ● | Product price: US$40.86/kg TREO recovered |
| ● | Product price: US$16.18/kg TREO mined |
Mineral Resources that are not Mineral Reserves do not have demonstrated economic viability. The financial valuation is based on the mining of the ROM Type 1 ore (high grade and medium grade), 18,246,334 t of estimated Mineral Reserves only.
The DCF valuation analysis for the base case gave the following results:
| ● | NPV at 10 % (nominal) (7.3 % real) of US$339 million as at 30 June 2025 |
| ● | IRR of 24.32 % (nominal) (21.28 % real) |
The economic analysis applies a 10% nominal discount rate for post-tax NPV calculations to discount projected post-tax cash flows. The discount rate is a MKAR management assumption, applied consistently with the Company’s prior disclosures and with discount rates typically used to value the projected cash flows of mining projects. The sensitivity of NPV to the discount rate is presented in Section 19.10.
Selected financial inputs and the corresponding results are summarised in Table 19.9 and Table 19.10.
| S-K 1300 Technical Report Summary on the Songwe Hill REE Project | Page 451 of 489 |
| |
| 20 | Adjacent Properties |
There are no adjacent properties relevant to the Project.
| 21 | Other Relevant Data and Information |
| 21.1 | Project Schedule |
The Project implementation schedule has been compiled to ensure that the engineering, procurement and construction management activities are aligned for successful project execution.
| 21.1.1 | Schedule Basis – Source Information |
The Songwe Hill execution schedule was developed based on the scope of work, deliverables list, SENET register, and the Procurement Operating Plan (POP) used during the 2022 DFS.
All the available Construction Contractor, MKAR and vendor schedule information has been incorporated into the execution schedule.
Outcomes from schedule reviews, planning workshops and experience from the 2022 DFS schedule history have been incorporated. The logic for activity relationships in the schedule is based on a joint consultation process between all the discipline engineers and other relevant parties on the Project.
| 21.1.2 | Schedule Levels and Structure |
The Songwe Hill execution schedule is a Level 4 detailed schedule, which is structured by project phase, process area, and engineering discipline.
| 21.1.3 | Project Key Dates/Milestones |
The Project schedule assumes that there will be a seamless advancement between the various phases of the Project evolution. It is also recognised that this is a moderately aggressive schedule and that it will require diligent progress monitoring and coordination of all the parties involved. The overall Songwe Hill execution schedule duration is 30 months (615 d).
The Project milestones are given in Table 21.1.
Table 21.1: Overall Project Key Dates
| Milestone Description | Month |
| Project Start | Month 1 |
| Escom Power Grid and Switchyard Installation Completed | Month 23 |
| Concentrator Plant Construction and Commissioning Phase Completed | Month 22 |
| Hydrometallurgical Plant Construction and Commissioning Phase Completed | Month 30 |
| TSF Construction Completed | Month 16 |
| PV Modules Order Placed | Month 6 |
| PV Modules Mounting Completed | Month 19 |
| Final PV Modules Testing Completed | Month 23 |
| Project Completed | Month 30 |
| S-K 1300 Technical Report Summary on the Songwe Hill REE Project | Page 452 of 489 |
| |
| 21.1.4 | Long-Lead Equipment |
Placing the purchase orders for the long-lead equipment is crucial not only to ensure that the equipment is on site in time to allow for a seamless construction sequence and a successful project execution but also to obtain the certified information from the supply vendors on their equipment to complete the detailed engineering phase of the Project. The long-lead equipment has been identified for the Project and is as follows:
| ● | Concentrator plant: |
| o | Ball mill |
| o | Apron feeder |
| o | Primary jaw crusher |
| o | Primary mill cyclone cluster |
| o | Agitators |
| o | Flotation cells |
| o | Secondary cyclone cluster |
| o | Fine grinding mills |
| ● | Hydrometallurgical plant: |
| o | Filter press |
| o | Caustic evaporators |
| o | Sulphuric acid plant |
| o | Uranium ion exchange plant |
| S-K 1300 Technical Report Summary on the Songwe Hill REE Project | Page 453 of 489 |
| |
| 21.1.5 | Project Execution Schedule Summary |
The Project execution schedule has been developed, and a summary Project execution schedule is shown in Figure 21.1.
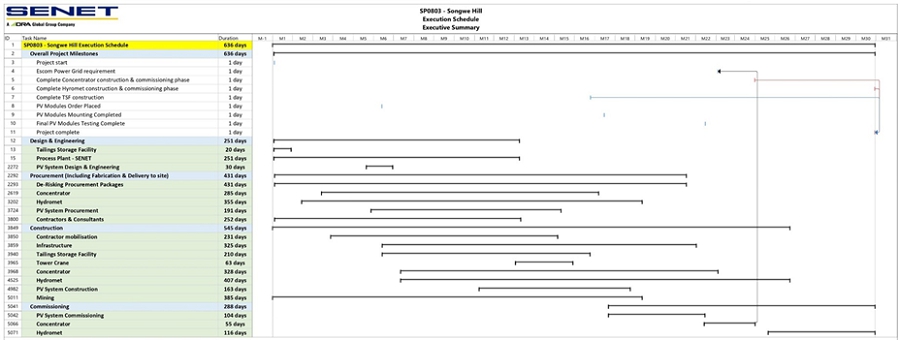
Figure 21.1: Project Schedule Summary
| S-K 1300 Technical Report Summary on the Songwe Hill REE Project | Page 454 of 489 |
| |
| 21.1.6 | Schedule Assumptions |
The following assumptions have been made in developing the schedule:
| ● | All the test work will be completed and no additional test work will be required. |
| ● | Various de-risking procurement packages will have been identified to ensure that no undue risk is placed on the Project due to the long-lead mechanical items. |
| ● | The construction work permit application (by MKAR) will be approved prior to the start of bulk earthworks construction. |
| ● | Relocation of protected trees and plants (by MKAR) will be completed prior to the start of bulk earthworks construction. |
| ● | Grave relocations will be completed prior to the start of bulk earthworks in the respective areas. |
| ● | All the MKAR information will be available as scheduled. |
| ● | Squad check will allow for one round of reviews. Where documents are rejected, the rework of documents has not been catered for in the schedule. |
| ● | Decisions to be made by MKAR shall be forthcoming, in accordance with the dates as scheduled, where activities require MKAR’s approval/consent/direction. |
| ● | Integrated change management procedures will be adhered to. |
| 21.1.7 | Rainfall |
The rainfall period is estimated to last for six months from November to April. The most rainfall experienced during a 31 d period was recorded in January with a total accumulation of 210 mm. The assumption is that a total of 17 d will be lost due to rain during the construction phase of the Project.
| 21.2 | Risks |
The purpose of conducting the project risk assessment was to identify and evaluate the risks associated with the Songwe Hill Project as presented in this report. The risk assessment addresses project implementation issues including any external factors such as political risk, resource risk, financial risk (including taxation and revenues), and government legislation risk that might have an impact on the success of the Project.
The risk assessment is based on the SENET Project Risk Management Plan and, in addition to highlighting and quantifying areas of risk, it establishes the baseline upon which measures that are installed to eliminate, mitigate or transfer risk, can be evaluated. Risks were assessed as follows:
| ● | Identification and analysis of risk |
| ● | Evaluation of the likelihood of specific risks occurring |
| ● | Evaluation of the consequences of risk occurrence |
| ● | Selection of a risk rating using the risk scoring definitions given in Table 21.2 |
| ● | Production of risk assessment tables by likelihood and severity as shown in Table 21.3 |
| S-K 1300 Technical Report Summary on the Songwe Hill REE Project | Page 455 of 489 |
| |
Table 21.2: Risk Scoring Definitions
| Score | Description | Definition |
|
High 5
|
Likelihood | An event that is extremely or very likely to occur. |
| Severity | The occurrence of this event will impact the project’s cost (and/or schedule), cause sustained production interruption or delay/reduction in cash flow that leads to negative cash flow. | |
|
Medium 3–4
|
Likelihood | An event that has a 50-50 chance of occurring. |
| Severity | The occurrence of this event will cause noticeable cost (and/or schedule) increases and substantial reduction in production, resulting in reduced, but adequate cash flow for project/plant production costs. | |
|
Low 1–2
|
Likelihood | An event that is unlikely or very unlikely to occur. |
| Severity | The occurrence of this event will cause small or no cost (and/or schedule) increases that, in most cases, can be absorbed by the project, minor delays in production, or a reduction in cash flow that is easily recoverable within the next operating month. |
Table 21.3: Risk Scoring Matrix
| Risk Level is at the intersection of Likelihood and Severity | Severity (Impact) | ||||
| Very Low | Low | Medium | High | ||
| Likelihood (Probability) | High | ||||
| Medium | |||||
| Low | |||||
| Very Low | |||||
A Hazard and Operability (HAZOP) Study Stage 1 was completed in May 2021, and a HAZOP Study Stage 2 was completed in July 2021.
| 21.2.1 | General Risks |
The general risks associated with the Songwe Hill Project are listed in Table 21.4.
Table 21.4: General Risks
| Risk | Description | Severity | Likelihood | Mitigating Factor |
| Currency Exchange Rate Fluctuations | Specifically related to the strength of the euro and US dollar, the currencies in which commodity prices are generally quoted. Risk of these currencies gaining or losing value, which will affect commodity prices and Project CAPEX and OPEX. | Medium | High | Possible purchase of forward cover and hedging. |
| S-K 1300 Technical Report Summary on the Songwe Hill REE Project | Page 456 of 489 |
| |
| Risk | Description | Severity | Likelihood | Mitigating Factor |
| Rare Earth Metals Price Fluctuations | Risk of the low-value overproduced rare earth metals price decreasing in value, which will have a negative effect on the Project economics | Medium | Low |
The Project has shown favourable economics. The sensitivity of the rare earth metals price is investigated in detail in the financial section (Section 19).
The economics of using REEs is robust, and these segments will continue to fuel strong demand growth into the foreseeable future.
|
| Country Risk | Specifically including political unrest, economic policy changes, legislative and fiscal changes | Medium | Low | Political risk insurance on all loans. |
| Logistics |
● The Songwe Hill Project is remotely located, with some limitations to road accesses during the rainy season. The control of the logistics and the cost implications will be fundamental in maintaining a reasonable OPEX. ● The import of project equipment and essential commodities, such as diesel fuel, explosives materials, plant reagents and consumables, is highly dependent on an efficient logistics system.
|
Medium | Medium |
· MKAR has a project implementation plan that considers the potential logistics challenges such as the rainy season. A construction period of 23 months has been estimated and is considered adequate with respect to logistics. MKAR will appoint a reputable transporter with experience in mine projects and operations to ensure minimal logistics problems during construction and the operation of the mine. · MKAR will have one month’s worth of reagents and consumables, ensuring enough of a buffer to mitigate any logistics challenges.
|
| Fuel price fluctuations and supply |
● Specifically related to diesel: the risk of the fuel price increasing would affect the OPEX. ● The large quantities of fuel required for the mining fleet and emergency power plant pose a potential risk of supply shortages.
|
High | Medium |
· Close liaison with selected fuel supplier is envisaged. · Possibility of using two fuel suppliers to reduce the risk of supply shortage. The fuel storage capacity also ensures a buffer for any potential supply shortages.
|
| Raw water supply | Risk of insufficient raw water supply to the plant from the boreholes in the wellfield because of, for example, flow dynamics of the underground river system from which the borehole water is pumped. | Low | Low | The plant will use the tailings return water and reuse most of the filtrate water in the hydrometallurgical process as part of the raw and process water supply. |
| S-K 1300 Technical Report Summary on the Songwe Hill REE Project | Page 457 of 489 |
| |
| 21.2.2 | Mineral Resource Risks |
The Mineral Resource risks associated with the Songwe Hill Project are listed in Table 21.5.
Table 21.5: Resource Risks
| Risk | Description | Severity | Likelihood | Mitigating Factor |
| Geological and domain interpretation | Small-scale lithological variation makes it difficult to accurately distinguish the different rock types through visual assessment. | Low | Low |
● Assessment of the relationship between calcium grade and rare earths grade has shown that the application of a 15 % calcium threshold in the resource estimation provides a reasonable distinction between carbonatite (> 15 % Ca, high RE grade) and non-carbonatite (< 15 % Ca, low RE grade) domains. This geochemical distinction makes visual assessment redundant. ● The 3D-modelled carbonatite domain shows a good match with the geological map in terms of observed carbonatite at surface, supporting the veracity of the geological model that informs the block model.
|
| Tonnage risk | Risk of rock density variation not being adequately understood due to complex lithological variation. | Low | Low |
● During Stage 3 resource drilling (2018), the density of every sample of drill core was measured. ● The density of drill core samples from Stages 1 and 2 (2011–2012) was re-measured to check the results and to ensure that the density measurement methodology was homogenised across Stages 1 to 3 of the resource drilling. ● The density block model shows that appreciable differences in density generally occur between broad zones, not over short distances.
|
| Tonnage Risk | Known cavities in Songwe Hill are likely due to karst-type dissolution of matrix carbonate in the host carbonatite. There is a risk of the volume of void spaces in the Mineral Resource impacting the tonnage. Drilling recovery indicates 2.5% cavity losses although the proportion of losses is uncertain and could be higher or lower. | Low | Medium | ● No mitigating factor such as a discount was applied to the Mineral Resource. Mineral Reserve conversion includes 5% mining losses. |
| S-K 1300 Technical Report Summary on the Songwe Hill REE Project | Page 458 of 489 |
| |
| Risk | Description | Severity | Likelihood | Mitigating Factor |
| Assumptions used in the assessment of reasonable prospects for economic extraction | Assumed cost and revenue drivers could change, which could affect the cut-off grade and the extent of the pit shell used for Mineral Resource reporting. | Medium | High |
● TR completed, which includes a marketing study. ● Reasonable prospects for economic extraction are based on the TR inputs at the upside REO price.
|
| 21.2.3 | Mining Risks |
The mining risks associated with the Songwe Hill Project are listed in Table 21.6.
Table 21.6: Mining Risks
| Risk | Description | Severity | Likelihood | Mitigating Factor |
| Low or variable ROM grade from mining operation | Low ROM grade from mining operation from excessive dilution | Medium | Medium |
● Ensure sound design of mining method. ● Plan based on industry average performance, not best in class. ● Carry out trial mining and correct equipment selection.
|
| Grade control system not implemented properly or ineffectual in controlling ROM grade | Medium | Medium |
● Ensure sound design of mining method. ● Plan based on industry average performance, not best in class. ● Apply industry-appropriate grade control standards. ● Ensure that grade control is the responsibility of Mine Owner and not contractor. ● Incentivise operational staff (contractor) appropriately.
| |
| Loss of production from open pit | Lost days due to bad weather | Low | High |
● Design for additional mining capacity to allow for lost days. ● Negotiate additional capacity with the Mining Contractor.
|
| Pit slope failure | High | Low |
● Ensure sound geotechnical design of pit. ● Re-assess slope design during development of mine, incorporating all newly available geotechnical data.
| |
| Pit flooding, ingression of groundwater or rainwater | Medium | Low |
● Ensure sound storm water design. ● Ensure sound design of pit dewatering systems. ● Complete detailed groundwater study as part of the front-end engineering design (FEED), to determine pit inflows over time.
| |
| Poor contractor performance | Medium | Medium |
● Consider relevant experience and competence of contractor during contractor selection. ● Ensure good contract management and early detection of issues. ● Involve Mine Management in short- and medium-term planning.
| |
| Waste dump stability | Slope failure on waste dump or stockpile | Medium | Low | Complete engineering geotechnical work during FEED programme and revise designs based on field data and laboratory test results. |
| S-K 1300 Technical Report Summary on the Songwe Hill REE Project | Page 459 of 489 |
| |
| 21.2.4 | Process Plant Risks |
The process plant risks associated with the Songwe Hill Project are listed in Table 21.7.
Table 21.7: Process Plant Risks
| Risk | Description | Severity | Likelihood | Mitigating Factor |
| Freight costs | The process consumes large quantities of reagents that are sourced internationally. Disturbances in international logistics can severely impact the overall OPEX. | High | Medium |
● Enter into long-term contracts with transport companies. ● Ensure that the financial model is robust.
|
| Availability of electrical power | The process consumes large quantities of electrical energy for the heating of process streams and evaporation. The local electrical grid has experienced shortages before. | High | Medium |
● SENET has included the efficient recycle of energy in the process design, as well as a solar plant to supplement grid power during daytime. ● Diesel emergency power generation is available if neither the solar nor the grid power is available. The emergency diesel power plant capacity is however only enough to operate essential plant and equipment.
|
| Reagent costs | Due to the high consumption of reagents such as sodium hydroxide and calcium chloride, a change in reagent costs or consumptions would have a significant impact on the financials. | High | Medium |
● Contracts with suppliers would mitigate price fluctuations. ● Proper process analysis and control would optimise reagent consumption.
|
| Build-up of impurities in the process | The maximum amount of water and reagents are reused/recycled on the plant, but a gradual build-up of impurities would negatively impact process performance. | Medium | Medium |
● SENET has included purification steps and water treatment packages to mitigate the risk of unwanted impurity build-up. ● There is a bleed stream of sodium hydroxide to protect the integrity of the caustic conversion and rare earth leach process. ● During further studies, options will be evaluated for the treatment of barren rare earth carbonate precipitation liquor to produce reusable or saleable by-products.
|
| Poor flotation performance | The Songwe Hill ore can be divided into two types: Type 1 ore is amenable to flotation whilst Type 2 material exhibits poor flotation performance. | Medium | Low | An optimised flotation regime for Type 1 ore has been developed in conjunction with a mine plan that selectively targets Type 1 ore areas for processing, whilst stockpiling Type 2 material. |
| Geotechnical report received from Zutari and the related earthworks and civil works quantities for the CAPEX |
● Recommendations to increase the base sizes for the hydrometallurgical filtration area and flotation ring beams would result in an increase in concrete quantities ● Recommendations for the raft foundations to be completely rigid, or if not possible, that piling be used, would have cost implications. ● Possible potential on-site borrow pits for material sourcing exist. These will require further investigation and might not yield the required quality or volumes for the engineered fill; thereby requiring the possible importation of material from commercial sources.
|
Low | Low |
● The Zutari report is comprehensive. Borrow pit testing and investigation completed. ● Zutari recommended that future geotechnical studies be undertaken.
|
| S-K 1300 Technical Report Summary on the Songwe Hill REE Project | Page 460 of 489 |
| |
| 21.2.5 | TSF Risks |
The TSF risks associated with the Songwe Hill Project are listed in Table 21.8.
Table 21.8: TSF Risks
| Risk | Description | Severity | Likelihood | Mitigation or Management Measures |
| Geotechnical test work on soils from geotechnical site investigation | Design assumptions may prove to be non-conservative and fail to satisfy minimum slope stability criteria of the tailings dam. | Medium | Low |
● Use the geotechnical laboratory test work on the samples from the geotechnical site investigation to validate and confirm the design assumptions used in the 2022 DFS. ● If warranted, flatten the side slopes accordingly to increase slope stability.
|
| Geotechnical test work on tailings | The design assumption for dry density may differ from the test results and implicate the storage capacity of the TSF. | Medium | Low |
● Use the geotechnical laboratory test work on the tailings to validate and confirm the design assumptions used in the 2022 DFS. ● If warranted, TSF storage capacity can be increased by repositioning the TSF main embankment.
|
| Geochemical test work | The design assumption for the TSF lining system may prove to be inadequate. | Low | Low | Geochemical and radionuclide test work is required to provide a more accurate assessment of any risk posed by the tailings. |
| TSF and embankment failure due to external, side slope erosion | Side slope surface erosion due to surface water runoff. | High | Low | The TSF shall be rehabilitated during the LOO, which should mitigate erosion of the embankment outside slopes. |
| Overtopping due to non-compliance with the operating procedures | The TSF pond spilling over the crest of the embankment wall. | High | Low | Adequate freeboard and emergency spillways have been incorporated into the design. |
| S-K 1300 Technical Report Summary on the Songwe Hill REE Project | Page 461 of 489 |
| |
| 21.2.6 | Sustainable Development Risks |
The sustainable development risk assessment identified the key risks and the measures that can be implemented to mitigate or reduce each risk. These are outlined in Table 21.9.
Table 21.9: Sustainable Development Risks
| Risk | Description | Severity | Likelihood | Mitigation
or Management Measures |
| Licence and permitting | The environmental permitting process is ongoing and needs to be completed before the environmental permit can be issued by the authorities. | Medium | Medium | Ensure regular interaction with the authorities to identify and address any potential issues throughout the permitting process. |
| Water contamination | The transportation of sediment and contaminated water from dirty water areas of the Project area (i.e. WRD, Type 2 material stockpile and open pit) into the natural environment impacting wetland areas and aquatic systems including the Mpoto Lagoon. | High | Medium | ● Implement the SWMP.
● Direct all contaminated water into the SWCDs to avoid discharge into the environment.
● Implement industry best management practices.
● Conduct regular monitoring of storm water management structures and biomonitoring of the natural environment.
|
| Air quality and noise | Air quality and noise exceeding Malawi and WHO guidelines, respectively | High | Medium | ● Implement a minimum buffer between the mining operations and any sensitive receptor locations to protect the health of residents of nearby villages. Households within the fence line will be relocated, reducing the number of receptors surrounding the Project.
● Put into place a Blasting Assessment and Management Plan.
|
| Geochemical test work | Available test work for the waste rock determined the contamination potential to be low and largely inert. | Low | Low | Continue undertaking analysis of waste rock and tailings material throughout the operation to determine any changes in the geochemistry of the waste material. |
| Decantation | It is unlikely that the open pit will decant due to its position on the hill. | Low | Medium | ● Place additional boreholes around the pit to determine any changes in water levels and impacts from pit dewatering. The groundwater table is unlikely to be intersected until the last two years of mining.
● Conduct a detailed geochemical pit lake quality study to calculate the long-term water qualities in the pit.
|
| S-K 1300 Technical Report Summary on the Songwe Hill REE Project | Page 462 of 489 |
| |
| Risk | Description | Severity | Likelihood | Mitigation
or Managemen t Measures |
| Socio-economic studies and resettlement | The establishment of the Project will result in the physical and economic displacement of 451 households, impacting land availability and livelihoods. | High | Medium | ● Socio-economic baseline studies have been completed, as well as a preliminary asset survey of the communities within the proposed exclusion zone.
● Develop and implement an RAP.
● Continue engagement with community members (local and traditional leaders) as well as implementation of the grievance mechanism.
|
| Radiation | Potential to liberate radionuclides associated with RE ore. Deposition of waste products in the WRD and TSF could mobilise radionuclides and could impact community health. | Medium | Medium | ● Continue with baseline radon and thoron monitoring prior to construction activities.
● Implement concurrent rehabilitation of the WRD and side walls of the TSF to reduce dust mobilisation.
● Implement the closure plan to provide a cover over the TSF and WRD.
● Undertake a radionuclide deportment campaign every two years to determine changes to the baseline.
● Update the public radiation protection report with any updated information on the TSF and groundwater plume migration study.
|
| Biodiversity | Baseline wet and dry season surveys have been undertaken in the Project area. However, vegetation clearing will be required for the establishment of Project infrastructure as well as diversion of a stream for construction of the process plant. | Medium | Low | ● Limit vegetation clearing to designated areas only.
● Implement the SWMP.
● Monitor alien invasive plant establishment on site.
● Conduct biomonitoring of the Project area with a focus on the Mpoto Lagoon.
|
| Pressure on social infrastructure | Increased pressure on social infrastructure due to an influx of people and potential conflict due to competition for resources. | Medium | Medium | Develop and implement influx management measures. |
| S-K 1300 Technical Report Summary on the Songwe Hill REE Project | Page 463 of 489 |
| |
| Risk | Description | Severity | Likelihood | Mitigation or Management Measures |
| Community expectations | Public consultation required to document community expectations and implementation of the Community Development Plan. | High | Medium | ● Ongoing consultation and interaction with communities and stakeholders.
● Management of community expectations through clear communication on plans to improve livelihoods of the people.
|
| Occupational and community health | Increase in social ills during construction and operations | Medium | Medium | Develop and implement Community and Occupational Health Impact Management Plan. |
| Climate change | Climate change may affect a wide range of aspects associated with the Project, such as reliable water supply, storm water management, disruption of operations, food supply, worker health and safety, as well as community health and safety. | High | Medium | ● Develop and implement a climate-change adaptation strategy for MKAR.
● Undertake vulnerability risk assessments at all MKAR’s operations and host communities.
● Develop and implement plans that respond to material climate risks.
● Improve efficiencies in the use of natural resources (energy and water).
● Implement community awareness and resilience strategies.
● Undertake a climate change risk assessment of the Project.
|
| Blasting | Blasting in the open pit will result in noise and air quality impacts on nearby receptors. A minimum 500 m blast radius has been implemented as part of the Project design. | High | Low | Implement controlled blast technology to reduce the negative effects of blasting. |
| S-K 1300 Technical Report Summary on the Songwe Hill REE Project | Page 464 of 489 |
| |
| 21.2.7 | Independent Review and Key Financial Risks Identified |
SENET commissioned an independent review of the DCF model prepared by MKAR, which underpins the economic analysis presented in Section 19. Fraser McGill conducted an assessment focused on SK-1300 disclosure requirements, internal consistency, transparency, and the reasonableness of the key economic drivers and sensitivities.
The review concluded that the model captures the principal revenue and cost components required to generate project cash flows, and that the economic outputs reported are internally coherent within the stated assumptions. No material deficiencies or major red flags were identified that would undermine the economic conclusions. However, the review highlighted several value-driving risk areas, which are summarised in Table 21.10.
Reference the Songwe Hill Financial Model Review document completed by Fraser McGill, Mining & Minerals Advisory, dated 29th of January 2026.
Table 21.10: Financial Analysis Risks – Fraser McGill Review
| Risk | Detail | Comments Received or Recommendations Made |
| Discount rate | A high-level bottom-up calculation was done to determine the real and nominal WACC. Based on current assumptions, this is higher than the current discount rate. | The discount rate ultimately remains the decision of the project team, but should be justified in the TRS report |
| Sustaining Capex | Currently, the sustaining capex seems to be on the low end of typical projects, at 22% of total capex (typically between 20% to 40%), with the bulk being for TSF expansion. It is suggested that this be increased to accommodate for Plant and infrastructure refurbishment | To be investigated. Recommended toinclude plant and infrastructure sustaining capital |
| Removal of Additional revenue | Due to the level of detail regarding the gypsum sales in the TRS report, it might be excluded from the cash flows upon review | Based on feedback received, there is a high probability of success based on market interest and work done to date. This decision will ultimately be made by the reviewer. |
| Starting date of Mining and Processing | There is a six-month difference in the TRS report and the financial model with regard to the start date of mining activities. | It is recommended that either the TRS report or model be updated to reflect the same start date of activities. |
| Mining operational costs | Due to the hard-coded nature of the mining Opex, there are additional costs that run past the end of mining to the end of processing, and limited transparency on how monthly costs are calculated. | Costing was done by Bara and is assumed to be correct. The reason for the long tail is due to the care and maintenance activities of the mine till end of processing |
| Payabilities and Deduction | Currently, a 15% deduction is applied, with typical projects being between 15% to 30%. | An LOI exists with the Poland facility that confirms the 15% deduction applied is justified and reasonable. |
| Processing Plant Commissioning period | Typically, a plant ramp-up schedule is between 12 and 18 months due to the complexity of the processes. The model currently assumes 3 months | The design and ramp-up of the processing plant have been done indetail, ramp up schedule is to be justified. |
| Working Capital Calculation Update | Concerns were raised regarding the working capital calculation | A separate working capital sheet was developed based on the current financial model structure |
| S-K 1300 Technical Report Summary on the Songwe Hill REE Project | Page 465 of 489 |
| |
| 21.3 | Opportunities |
The opportunities that have been identified for the Songwe Hill Project are outlined in Table 21.11.
Table 21.11: Opportunities
| Opportunity | Description |
| Inferred Resources | During the 2022 DFS, a pit optimisation that included Inferred resources was conducted. This exercise demonstrated that the ore tonnage could be increased from 18 Mt to 28 Mt by including Inferred resources in the ore stream. Infill drilling could allow some, or all, of these Inferred resources to be upgraded to Measured or Indicated resources and support the inclusion of this material in the mine plan. |
| Underground Mine | The Songwe Hill deposit is open at depth, and desktop study work has been completed for a potential underground mine. This presents an opportunity for the life of the Songwe Hill Project to be extended beyond the life of viable open-pit mining. |
| Optimisation of sodium hydroxide bleed stream | Further test work would confirm the percentage of the caustic conversion thickener overflow solution that must be bled out of the process to prevent impurity build-up. This could significantly decrease the fresh sodium hydroxide consumption. Refer to Section 21.3.1. |
| Equipment supplier package deals | Original equipment manufacturers should be approached to negotiate package deals that offer cost savings. Using a single supplier for all the equipment needs will streamline the purchasing process by simplifying the supply chain and decreasing the risk of disruptions. Choosing a trusted supplier can potentially also improve the safety standards of the equipment. In addition, new equipment can boost productivity and efficiency, leading to cost savings and increased output. |
| Regenerating sodium hydroxide with membrane technology | Currently, sodium hydroxide is being regenerated by evaporation and causticisation. Replacing this system with an electrolytic membrane process could significantly decrease process complexity, reagent consumption, OPEX and CAPEX. A detailed investigation is required to weigh membrane technology against the current evaporation/causticisation design. |
| Producing ammonium and calcium/sodium salts from barren rare earth carbonate precipitation liquor | There is an opportunity to treat the barren rare earth carbonate precipitation liquor, which contains sulphate, ammonium and chloride, to produce reusable or saleable salts of ammonium and chloride by steam stripping. There are several options for doing this, but a trade-off needs to be done on the potential benefit versus the additional costs. |
| Simplifying the flotation circuit to exclude cleaning and cleaner-scavenger flotation | Test work has shown that the recovery of REEs in the flotation circuit could be increased by accepting a lower rare earth grade in the flotation concentrate. Currently, the target is to have a high-grade flotation concentrate, sacrificing recovery. This is a potential opportunity to optimise the flotation circuit towards a higher-recovery philosophy. |
| Decreasing power consumption | The Songwe Hill plant consumes large amounts of energy, primarily to heat up process streams. Further optimisation of the flotation circuit to achieve the target grade and recovery at a lower temperature would decrease the plant power consumption considerably. |
| Decreasing OPEX | There is an opportunity to decrease the OPEX through the sale of gypsum to cement manufacturers in the subregion. |
| There is also an opportunity to decrease the OPEX by changing the evaporator type from multiple effect evaporation to mechanical vapour recompression. The LOM OPEX reduction as a result of using mechanical vapour recompression should be compared with the CAPEX of mechanical vapour recompression. | |
| Decreasing reagent costs | The OPEX is extremely sensitive to reagent consumptions and reagent costs. Several reagents dominate the overall consumables section of the OPEX, such as the flotation collector, sulphur, sodium hydroxide and calcium chloride. Decreasing the collector consumption in the flotation circuit, and decreasing the sulphuric acid, sodium hydroxide and calcium chloride consumption (or regenerating it as previously discussed) will have a significant impact on the OPEX. |
| Upgrading the Songwe Hill site access gravel road to a tar road | The Songwe Hill Project is remotely located, with some limitations to road accesses during the rainy season. With the high volume of traffic expected to site daily, it might be cost effective to consider tarring the 15 km gravel road to ensure that heavy vehicles can reach the site during the rainy season and eliminate potential delays. |
| Ensuring that Escom grid power is available on site as early as possible during construction | Although all the contractors are responsible for supplying their own diesel generators during the construction phase, having grid power available would mean cost savings. It would also minimise noise and air pollution. |
| S-K 1300 Technical Report Summary on the Songwe Hill REE Project | Page 466 of 489 |
| |
| Opportunity | Description |
| Optimising the construction schedule | Ordering long-lead items as early as is practically possible, even prior to detailed engineering, could improve the Project schedule. |
| Wind energy opportunity | Refer to Section 21.3.2. |
| Proposed Puławy Separation Project opportunity | Developing the proposed Puławy separation plant alongside Songwe Hill creates a fully integrated mine-to-refinery value chain. The plant can process all the Songwe Hill MREC and benefits from favourable transfer pricing, generating strong stand-alone and combined NPVs. Optimising this integration could include aligning feed supply schedules, refining the transfer-pricing structure, and assessing the 100 % NdPr separation and expanded capacity options to enhance the overall project value. Refer to Section 21.3.3. |
| 21.3.1 | Caustic Bleed Stream Reduction Opportunity |
Mkango has completed bench-scale optimisation work with ANSTO (hydrometallurgy) and Chimerical Technology (Pty) Ltd (membrane-assisted caustic recovery). The results of this work are encouraging but not yet supported by locked-cycle/pilot evidence; accordingly, these results have been excluded from the 2022 DFS base-case production schedule and cash flow model. This section summarises the work completed to date, indicative technical findings, and the possible economic ramifications should the results be confirmed by the planned locked-cycle and pilot programmes. The primary goals of the workstreams are to demonstrate that the 30 % to 35 % caustic bleed stream can be reduced as assumed in the 2022 DFS.
| 21.3.1.1 | Workstreams and Methods |
The work completed to date consists of the following:
| ● | ANSTO Phase 1 (bench scale): |
| o | Parameter studies on caustic conversion, rare earth leach and carbonate precipitation using pilot-derived solids and liquors |
| o | Standard ICP/XRF assay analytics |
| ● | Chimerical Phase 1 (bench screening): |
| o | Nanofiltration of synthetic caustic conversion liquor (≈11 wt% NaOH) at 60 °C/60 bar |
| o | Testing of 400/200/100 Da membranes |
| o | Selection of a candidate membrane for spiral-module pilot |
| 21.3.1.2 | Key Technical Findings |
The key technical findings to date are as follows:
| ● | Caustic conversion regime: Operating at a ~34 wt% concentration of regenerated NaOH with ≤ 5 % fresh caustic addition demonstrated a ~92 % Nd + Pr recovery with bench-scale tests (> 3 % higher than the pilot recoveries quoted in the 2022 DFS). Lowering the NaOH concentration below ~31 wt% to 33 wt% depressed the Nd extraction. | |
| ● | Impurity tolerance/bleed: Single-addition tests with 100 % regenerated caustic (Al ≈1.7 g/L; F ≈0.33 g/L) achieved a ~92 % Nd extraction when coupled with a brief pH 2 repulp wash, indicating that the 35 % fresh caustic addition used in the pilot can be reduced. The minimum fresh fraction requires locked-cycle confirmation. |
| S-K 1300 Technical Report Summary on the Songwe Hill REE Project | Page 467 of 489 |
| |
| ● | NaOH dose sensitivity: A 15 % reduction in the stoichiometric NaOH dose caused an ~8 pp drop in Nd extraction, supporting the retention of the higher dose adopted in the 2021 ANSTO pilot campaign and 2022 DFS. | |
| ● | Leach practice and ammonia recycle: At a pH of 2, with ~25 wt% solids and a duration of 1.5 h to 2 h, the Nd extraction stabilised at ~91 % to 93 %. Ammonia wastewater recycle is manageable with a simple repulp wash. | |
| ● | Carbonate precipitation: The rare earth carbonate quality and waters of crystallisation vary with temperature/ageing. Further work is planned to tighten product quality control. | |
| ● | Membrane Option 1 (selected for pilot): A 100 Da nanofiltration achieved an impurity rejection of ≥ 80 % to 90 % (e.g. Al ~88 %, Ca ~85 %, F ~78 %) at an ~80 % single-pass caustic recovery. An overall recovery of ≥ 85 % is projected with recycle/causticisation. Options involving caustic concentration and/or purification of concentrated caustic streams were discarded due to limited benefit and/or membrane degradation. |
| 21.3.1.3 | Indicative Economic Ramifications (not in Base Case) |
Table 21.11 summarises the indicative annual impacts if the above technical improvements are confirmed. Values reflect the bench-scale results and internal scoping estimates and will be updated following locked-cycle and pilot work.
Table 21.12: Indicative Annual Impacts of Technical Improvements
| Assumption | Indicative
Annual Impact |
Basis/Notes |
| Reduce fresh caustic addition from 35 % to 25 %. | OPEX
reduction of US$3.5 million to US$4.0 million |
A reduction of ~4.3 kt/a NaOH at ~US$900/t; ancillary logistics/handling not included. |
| Reduce fresh caustic addition to ≤ 5 % (subject to membrane and locked-cycle confirmation). | OPEX
reduction of US$9.0 million to US$13.5 million |
A reduction of up to ~10 kt/a NaOH; range reflects price/consumption sensitivity. |
| Increase rare earth recovery by +3 pp (89 % to 92 %) in leach. | An
increase in revenue of US$10 million to US$15 million |
NdPr uplift in Mkango price deck (Adamas base case forecast; 2030 prices assumed) |
| Decrease evaporator duty by 10 % to 20 % due to lower impurities in evaporator feed | OPEX reduction of US$0.5 million to US$1.0 million | Reduced scaling/steam use; magnitude contingent on final cut-points and recycle strategy. |
| S-K 1300 Technical Report Summary on the Songwe Hill REE Project | Page 468 of 489 |
| |
| 21.3.1.4 | Optimisation Work – Status, Requirements for Validation, Risks and Mitigation Measures |
The status of the optimisation work and the requirements for its validation as well as the associated risks and mitigation measures are presented in Table 21.12.
Table 21.13: Optimisation Work – Status, Requirements for Validation, Risks and Mitigation Measures
| Description | Status | Requirements | Risks | Mitigation
Measures |
| Locked Cycle | ANSTO
Phase 2, Q3 2025 to Q1 2026 |
Establish steady-state minimum fresh caustic addition/bleed. | Membrane durability and fouling
● Sulphate
build-up/
● Carbonate precipitation variability
● Scale-up fidelity from bench scale to continuous operation
● Materials selection for high pH/temperature
|
Controlled purge strategies
● Locked-cycle confirmation
● Membrane fouling control strategies
|
| Spiral-Module Pilot | Chimerical,
August to September 2025 |
● Use 100 Da nanofiltration.
● Ensure a continuous ~100 h run using converter liquor.
● Verify the following:
o Flux stability
o Impurity rejection
o Corrosion/materials
o Energy consumption
|
| 21.3.2 | Wind Energy Opportunity |
The addition of wind energy would further decrease the cost of energy and Scope 2 grid emissions.
A wind energy yield assessment was undertaken based on mesoscale meteorological data, which has been used to estimate the long-term energy production for the proposed wind turbines at Songwe Hill. The wind energy yield assessment is, however, still subject to high uncertainty as no site measured data is available for analysis.
A comparison of the energy balance and the cost of energy is shown in Figure 21.2 and Figure 21.3, respectively, for three different power supply options. This report’s cost of energy is based on grid with PV. By adding the wind energy component, the overall excess energy at 6.8 % is a marginal increase of 4.2 % compared to the grid with PV excess energy of 2.6 %. The overall grid energy consumption, however, further decreases by an average of 15 % (16 % during the off-peak time and 13 % during the peak time, using the relevant tariffs for these periods), resulting in a further 19.8 % reduction in cost of energy from US$0.138/kWh for a grid with PV to US$0.111/kWh for a grid with PV and wind energy.
| S-K 1300 Technical Report Summary on the Songwe Hill REE Project | Page 469 of 489 |
| |
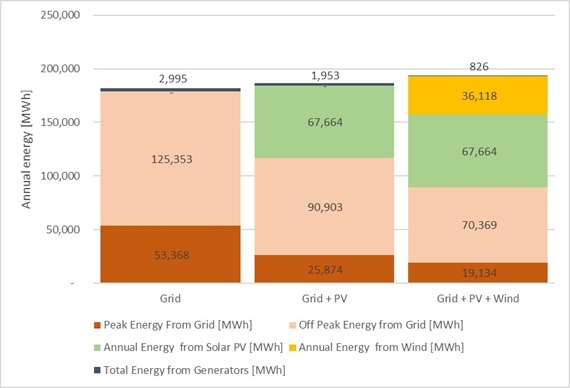
Figure 21.2:Energy Balance for Three Different Energy Options
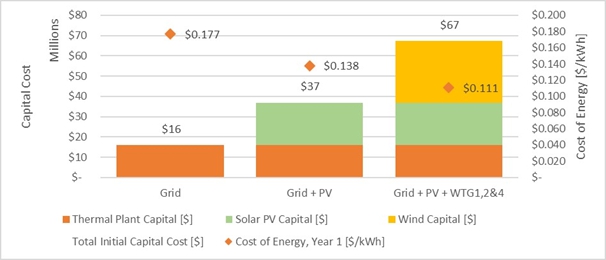
Figure 21.3: Cost of Energy and Initial CAPEX for Three Different Energy Options
| 21.3.3 | Proposed Puławy Separation Project Opportunity |
The proposed Puławy Rare Earth Separation Project, located adjacent to Grupa Azoty Puławy’s large-scale fertiliser and chemicals complex in Poland, is being developed by Mkango Polska, a subsidiary of Mkango. A PFS (±10 % OPEX, ±20 % CAPEX) was completed by Carester in 2022, and a PFS update with the objective of updating the CAPEX and OPEX estimate was undertaken by PRODEO Consulting (Pty) Ltd (PRODEO) in 2025 (PRODEO, 2025). PRODEO also completed a trade-off study assessing a double-capacity configuration, the inclusion or removal of the NdPr separation circuit, and an option to increase NdPr separation capacity to 100 %, applied to both the base case and the expanded configuration.
| S-K 1300 Technical Report Summary on the Songwe Hill REE Project | Page 470 of 489 |
| |
The proposed Puławy Project is designed to process approximately 10,500 kt/a (dry basis) of MREC feed grading ~55 % TREO, producing high-purity neodymium oxide, praseodymium oxide, didymium oxides, a mixed heavy REE carbonate, and a lanthanum cerium (LaCe) carbonate by-product. The proposed Puławy plant has sufficient capacity to process all of Songwe Hill’s expected MREC output. The Carester tests on the ANSTO pilot-scale Songwe Hill carbonate confirmed that its composition and impurity profile are well suited to downstream separation at the proposed Puławy plant. The plant is therefore expected to purchase Songwe Hill MREC as its primary feedstock.
For the financial analysis, it is assumed that Mkango Polska will purchase Songwe Hill’s MREC at a price equivalent to 85 % of its contained REO value (a 15 % discount to the forecasted basket value derived from Adamas’ pricing scenarios), with any shortfall covered by market-sourced MREC purchased at a 25 % discount. This internal transfer-pricing assumption reflects a commercially reasonable arm’s-length arrangement between related entities, providing Mkango Polska with sufficient margin to cover separation and refining costs while ensuring a stable offtake and revenue stream for the Songwe Hill Project.
The assumed pricing mechanism is consistent with industry practice for linked mine-to-refinery operations and supports the economic integration of MKAR’s upstream and downstream assets, as well as the European Union’s CRMA objectives by localising separation capacity within the EU.
| 21.3.3.1 | Combined NPV Including Proposed Puławy Separation Project |
A separate DCF evaluation of the proposed Puławy Rare Earth Separation Project (PFS level, based on the PRODEO PFS update completed in 2025) indicates a post-tax NPV at a 10 % nominal discount rate of US$167 million under the Adamas base case and US$202 million under the upside case. The Puławy evaluation applies the same transfer pricing assumption used in the Songwe Hill model (Puławy purchasing the Songwe Hill MREC at a 15 % discount to the contained TREO value), with any shortfall covered by market-sourced MREC purchased at a 25 % discount.
On a combined basis, the integrated Songwe Hill and proposed Puławy projects yield aggregate post-tax NPVs at a 10 % nominal discount rate of US$506 million under the Adamas base case (US$339 million Songwe Hill plus US$167 million Puławy) and US$691 million under the upside case (US$489 million Songwe Hill plus US$202 million Puławy).
PRODEO’s trade-off study assessing full (100 %) NdPr separation shows post-tax NPVs at a 10 % nominal discount rate of US$224 million and US$702 million for the expanded (double capacity) configuration under the Adamas base-case pricing scenario. When combined with the Songwe Hill NPV of US$339 million, the integrated Songwe-Puławy NPVs for these 100 % NdPr separation cases are US$563 million and US$1,041 million for the expanded configuration.
| S-K 1300 Technical Report Summary on the Songwe Hill REE Project | Page 471 of 489 |
| |
| 21.4 | Human Resource Element |
| 21.4.1 | Introduction |
The MKAR human resource element is a vital component of ensuring the operational success of the Songwe Hill Project. Significant consideration has been given in the recruitment strategy to ensure a seamless transition between commissioning and normal operation. MKAR also recognises the necessity for the operation to employ a sustainable localisation plan within the Songwe Hill mine area and nationally, and as such part of the policy is to recruit locally as far as practicable and implement a skills development plan for nationals with focus on those local to the mine site.
In order to effectively manage the operations at Songwe Hill, a labour schedule was drawn up to include labour for mining, process plant and administration duties. This section will describe the labour complement that will be required for the Songwe Hill Project, inclusive of expatriates, African national employees, and local Malawian employees.
| 21.4.2 | Overall Mine Management Structure |
Figure 21.4 shows the overall management structure proposed for the Songwe Hill Project. The mine management will be structured into five main departments: the process plant; mining; finance and administration; health, safety, security, environmental and community (HSSEC); and the maintenance departments. All the respective departmental managers will report to a general manager, who will be responsible for the mine’s overall operation.
The department managers will have the overall responsibility for managing the technical and non-technical business disciplines within the mine. The general mine management labour complement is shown in Figure 21.4.
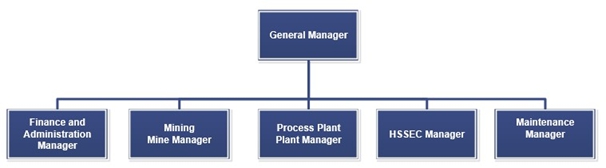
Figure 21.4: Overall Mine Management Structure
The process plant department will include a labour complement for the following:
| ● | Process plant production |
| ● | Assay laboratory |
The mining department will include a labour complement for the following:
| ● | Mining operations |
| ● | Mining technical services |
| S-K 1300 Technical Report Summary on the Songwe Hill REE Project | Page 472 of 489 |
| |
The finance and administration department will include a labour complement for the following:
| ● | Human resources |
| ● | Finance and accounting management |
| ● | Procurement and logistics |
| ● | Information technology (IT) and control |
| ● | Facilities engineering |
The HSSEC department will include a labour complement for the following:
| ● | Health and safety |
| ● | Security |
| ● | Environment |
| ● | Community relations |
The maintenance department will include a labour complement for the following:
| ● | Mechanical (concentrator and hydrometallurgical plants) |
| ● | Electrical, and control and instrumentation (concentrator and hydrometallurgical plants) |
| ● | Planning |
| ● | Riggers, mobile and tower cranes |
Table 21.13 gives a summary of the total labour complement, while Figure 21.5 shows the overall labour distribution as a percentage per department.
Table 21.14: Total Labour
| Department | Number of Employees | Distribution (%) |
| Mining | 150 | 35 |
| Process Plant – Production | 98 | 23 |
| Process Plant – Laboratory | 39 | 9 |
| Finance and Administration | 82 | 19 |
| HSSEC | 9 | 2 |
| Maintenance | 49 | 12 |
| Total | 427 | 100 |
| S-K 1300 Technical Report Summary on the Songwe Hill REE Project | Page 473 of 489 |
| |
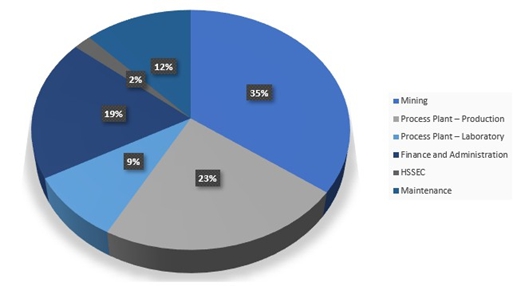
Figure 21.5: Total Labour Distribution
| 21.4.3 | Department Structure |
Each department will be headed by an experienced manager, with line managers reporting to them. A total of 299 people will be employed directly by MKAR or an affiliate on behalf of MKAR. The mining contractor will employ 128 people. The people directly employed by MKAR or its affiliate will comprise 192 national staff members and 107 international expatriate staff members.
In developing the manpower requirements for the Songwe Hill Project, the following assumptions were made:
| ● | Mining labour and supervisory staff will work on a two 12-hour shift operation per day, seven days a week. Technical and maintenance staff for mining will work the day shift only and will be on standby after hours on a rotational basis. |
| ● | Local process plant operators and supervisory staff will work on a two 12-hour shift operation per day, seven days a week. Technical and maintenance staff for the process plant will work a 12-hour day shift only and will be on standby after hours on a rotational basis. |
| ● | Management, general and administration staff will work on a 9-hour shift operation per day, five days a week. |
| ● | Expatriates will work on an eight-weeks-on and three-weeks-off work cycle. |
| S-K 1300 Technical Report Summary on the Songwe Hill REE Project | Page 474 of 489 |
| |
| 22 | Interpretation and Conclusions |
Since Mkango and MKAR have become involved in the Songwe Hill Project, considerable effort has been made and expenditure has been incurred to certify what is now a significant rare earth resource and reserve at Songwe Hill. This report confirms the extensive amount of exploration, tests and study work carried out on the Project. It is believed that the level of accuracy used herein is sufficient to consider this TRS to be definitive with its demonstration of a viable rare earth resource at Songwe Hill that will exploit the current reserve over an 18-year LOO.
| 22.1 | Mineral Resource |
On behalf of MKAR, MSA has completed a Mineral Resource estimate for Songwe Hill.
The mineralisation is associated with a steep-sided carbonatite intrusion-breccia complex. The REEs are mainly associated with the carbonatite, although mineralisation also occurs in the brecciated and fenite-type rocks, but at a lower grade.
The Mineral Resource was estimated based on the results of exploration programmes completed by Mkango. The drilling was on an average grid of approximately 30 m by 30 m in the areas with closely spaced drilling, approximately 50 m by 50 m away from the core of the deposit, and wider than a 50 m grid close to the extents of the deposit.
The drilling exploration and sampling were guided by comprehensive standard operating procedures, and in the opinion of the relevant QPs, conform to good exploration practice.
Mineral Resources have been classified in accordance with the S-K 1300 definitions, which are consistent with the CIM (2014) definitions. The Mineral Resource is classified into the Measured, Indicated and Inferred categories and is summarised in Table 22.1 for the Mineral Resource reported excluding the resources converted to Mineral Reserves and in Table 22.2 for the Mineral Resource reported including the resources converted to Mineral Reserves.
The Mineral Resource is reported at a base case TREO cut-off grade of 0.55 % from within an optimised pit shell, which the QP considers will satisfy reasonable prospects for economic extraction.
| S-K 1300 Technical Report Summary on the Songwe Hill REE Project | Page 475 of 489 |
| |
Table
22.1: Songwe Hill, Exclusive Mineral Resources above 0.55 % TREO Grade,
30 June 2025
| Category | Tonnes (Mt) |
TREO (%) |
TREO
Tonnes (kt) |
| Measured | 0.7 | 0.98 | 7 |
| Indicated | 3.4 | 1.05 | 36 |
| Total Measured and Indicated | 4.1 | 1.04 | 43 |
| Inferred | 55.9 | 1.05 | 589 |
NOTES: 1. Mineral Resources have been classified in accordance with the S-K 1300 definitions, which are consistent with the CIM (2014) definitions. 2. All tabulated data has been rounded, and as a result minor computational errors may occur. 3. Mineral Resources, which are not Mineral Reserves, have no demonstrated economic viability. 4. The Mineral Resource estimate is reported on a 100 % ownership basis. 5. Mineral Resources are reported from within an optimised pit shell. 6. For the purposes of assessing reasonable prospects for economic extraction and cut-off grade, metallurgical recoveries were applied to individual rare earth oxides. The average total rare earth oxide metallurgical recovery is 39.6 %. 7. Mineral Resources exclude the portion converted to Mineral Reserves. 8. Mineral Resources are reported on an in-situ basis without applying modifying factors. 9. A mean density of 2.73 t/m3 was applied for Measured, 2.67 t/m3 for Indicated and 2.77 t/m3 for Inferred Resources. TREO = La2O3, CeO2, Pr6O11, Nd2O3, Sm2O3, Eu2O3, Gd2O3, Tb4O7, Dy2O3, Ho2O3, Er2O3, Tm2O3, Yb2O3, Lu2O3, and Y2O3 | |||
Inclusive Mineral Resources are presented in order to be consistent with those reported by Mkango under the NI 43-101 standards and are not compliant with the S-K 1300 reporting standards.
Table
22.2: Songwe Hill, Inclusive Mineral Resources above 0.55 % TREO Grade,
30 June 2025
| Category | Tonnes (Mt) |
TREO (%) |
TREO
Tonnes (kt) |
| Measured | 13.6 | 1.27 | 173 |
| Indicated | 24.4 | 1.08 | 264 |
| Total Measured and Indicated | 38.1 | 1.15 | 437 |
| Inferred | 55.9 | 1.05 | 589 |
NOTES: 1. Mineral Resources have been classified in accordance with the S-K 1300 definitions, which are consistent with the CIM (2014) definitions. 2. All tabulated data has been rounded, and as a result minor computational errors may occur. 3. Mineral Resources, which are not Mineral Reserves, have no demonstrated economic viability. 4. The Mineral Resource estimate is reported on a 100 % ownership basis. 5. Mineral Resources are reported from within an optimised pit shell. 6. For the purposes of assessing reasonable prospects for economic extraction and cut-off grade, metallurgical recoveries were applied to individual rare earth oxides. The average total rare earth oxide metallurgical recovery is 39.6 %. 7. Mineral Resources include the portion converted to Mineral Reserves. 8. Mineral Resources are reported on an in-situ basis without applying modifying factors. 9. A mean density of 2.73 t/m3 was applied for Measured, 2.67 t/m3 for Indicated and 2.77 t/m3 for Inferred Resources. TREO = La2O3, CeO2, Pr6O11, Nd2O3, Sm2O3, Eu2O3, Gd2O3, Tb4O7, Dy2O3, Ho2O3, Er2O3, Tm2O3, Yb2O3, Lu2O3, and Y2O3 | |||
| S-K 1300 Technical Report Summary on the Songwe Hill REE Project | Page 476 of 489 |
| |
The MSA QP is of the opinion that with consideration of the recommendations summarised in Sections 23 of this TRS, any issues relating to technical and economic factors likely to influence the prospect of economic extraction can be resolved with further work.
| 22.2 | Mineral Reserve |
Table 22.3 shows a summary of the total Mineral Reserve Estimate.
Table 22.3: Mineral Reserve Summary as at 30 April 2025
| Category | Tonnage (Mt) | TREO (%) | TREO (t) |
| Proven Mineral Reserves | 8.160 | 1.28 | 104,183 |
| Probable Mineral Reserves | 9.988 | 1.07 | 106,801 |
| Total Mineral Reserves | 18.147 | 1.16 | 210,984 |
NOTE: Totals might not add up due to rounding. Mineral Reserves are stated as tonnages and grades delivered to the processing plant and are inclusive of dilution and mining losses expected during mining. The Mineral Reserve estimate is reported on a 100 % ownership basis. The Mineral Reserve is stated at a cut-off grade of 0.6 % TREO, which was supported by metal prices stated in Table 12.3. Ore tonnages are stated at an average in-situ density of 2.76 t/m3. A weighted average process recovery to carbonate of 40 % has been used to determine revenue from Mineral Reserves used | |||
This TRS has demonstrated that, based on the operating and pricing outlook assumed in the 2022 DFS, the Songwe Hill REE deposits can be economically mined using the open-pit method and processed using flotation and hydrometallurgy processes at an annual rate of approximately 1 Mt/a with a view to producing an average of 5,954 t of TREO in MREC per year for the first five years and 4,081 t of TREO in MREC per year in Years 6 to 18.
The TRS is based on selling the MREC rather than the separate products. For the financial analysis, it is forecasted that MKAR will sell the MREC to its proposed Puławy separation plant in Poland. As a result, a 15 % discount was applied to the forecasted value of the rare earths contained in the MREC (discount equivalent to approximately US$9.26/kg (real 2025 US dollars) of TREO in the MREC for the first five years of production to reflect the discount that would be applied for the MREC product versus the value of the underlying separate REOs). It is also assumed that 77,000 t/a of gypsum by-product from the hydrometallurgical plant will be sold at a rate of US$150/kg (real 2025 US dollars).
This report indicates a US$339 million post-tax NPV, using a 10 % nominal discount rate, and a 24.32 % post-tax IRR for 100 % of the Songwe Hill production.
| 22.3 | Environmental |
Detailed environmental and social specialist studies were undertaken for the ESHIA, and these comply with Malawian legislation and IFC best practice requirements. Environmental and social baseline studies commenced in 2018 and have been updated alongside updates to the Project design and placement of infrastructure. Environmental studies included detailed wet and dry season fieldwork, providing a comprehensive understanding of the current environmental and social baseline of the Project area.
| S-K 1300 Technical Report Summary on the Songwe Hill REE Project | Page 477 of 489 |
| |
Social studies included household surveys, comprising questionnaires completed by the community surrounding Songwe Hill, to establish a socio-economic and health baseline for the area. Updated socio-economic and asset surveys were undertaken of the households within the proposed exclusion zone in April 2022 as part of the initial work which will form part of the RAP.
Dust monitoring has been in place since 2016, providing an uninterrupted record of the dust fallout regime of the area. A weather station was installed on site in August 2014 providing on-site, local data for input into the ESHIA. After the significant amount of work completed on the environmental and social aspects, the environmental risks and current legislative environment are well understood.
A Stakeholder Engagement Plan and grievance mechanism are in place on site to record and document engagement activities with the community and any grievances that may arise as a result of Project activities. Communication and stakeholder management are essential for building sustainable relationships based on transparency and trust. Stakeholder consultations have been taking place regularly since November 2014, and in March 2022, the results of the ESHIA process were shared with stakeholders through comprehensive engagement at local, district and national levels which included community members, government authorities and NGOs.
Environmental and social risks exist but these can be managed through comprehensive consultation especially around resettlement and heritage impacts associated with the Project. A number of recommendations (see Section 23) should be undertaken as part of the Project’s implementation to ensure that the Project is socially and environmentally acceptable and complies with international good practice guidelines. The ESHIA was undertaken to comply with IFC Performance Standards to ensure that the process is acceptable to the developer, authorities, and other key stakeholders. The Project has the potential to provide benefits to the local community, industry, and the country if positive impacts are enhanced and potential negative impacts are mitigated. The Project is committed to ensuring environmental and social compliance, and leaving a positive legacy.
| S-K 1300 Technical Report Summary on the Songwe Hill REE Project | Page 478 of 489 |
| |
| 23 | Recommendations |
SENET recommends undertaking a front-end engineering design (FEED) study prior to the commencement of the Project execution stage. The current schedule anticipates initiating the FEED study during the first half of 2026.
Through a well-defined and executed FEED phase, the following can be achieved:
| ● | Reduced technical, schedule and cost risks |
| ● | Faster plant/process start-up, commissioning and handover |
| ● | Reduced EHS and compliance risks |
| ● | Improved risk identification and mitigation |
| ● | Finalised orders of long-lead items |
| ● | Receipt of vendor drawings and data, taking the detailed design to the next level of accuracy |
The following early works activities should be completed before the site construction activities start in order to minimise potential delays:
| ● | Complete additional geotechnical studies as per the Zutari recommendation. |
| ● | Commission sufficient water boreholes in the wellfield to supply water to the accommodation camp, site offices and facilities as well as the water required for construction purposes. |
| ● | Construct the accommodation camp and facilities prior to construction start date. |
| ● | Identify aggregate source. |
| ● | Complete the RAP and specifically the relocation of households prior to construction start date. |
| 23.1 | Geology |
The geology of the Songwe Hill deposit is well understood. The geology model will be refined with additional exposure during mining and continual geological mapping, as typically occurs during mining operations.
| 23.2 | mineral Resources |
No further exploration for Mineral Resource definition is warranted aside from targeted risk mitigation drilling that may be required to ensure that the Project is operationally ready. This would be in the form of advanced grade control drilling, which is a normal operational requirement for selective open-pit mining.
| 23.3 | Environmental and Social Studies, Plans and Resettlement |
The following are recommendations related to the environmental and social aspects of the Project for MKAR to integrate throughout the Project:
| ● | Ensure continuous engagement and two-way dialogue with communities in the vicinity of the Project and other key stakeholders, including government and administrative authorities, traditional authorities, group village heads, local chiefs, and community-based organisations, as well as international and local NGOs. |
| S-K 1300 Technical Report Summary on the Songwe Hill REE Project | Page 479 of 489 |
| |
| ● | Ensure management of waste by engineering and constructing waste facilities in compliance with good international industry practice. Infrastructure has been sited and designed to mitigate potential negative impacts from dust, radiation, noise and water pollution. Design measures to manage contaminants and waste include clean and dirty water diversion berms, trenches, dams, HDPE lining of the TSF, and other technological measures that together contribute to the reduction of potential negative impacts. Monitoring of these measures through the ESMP must be undertaken throughout the Project lifecycle to ensure that they are fit for purpose and appropriately manage any potential negative environmental and social risk. |
| ● | Design a wellfield in the alluvial material around the Project for water provisioning for the Project. Surface water runoff and precipitation during the wet season will also be captured, stored and used to contribute to the mine’s water demands. This, alongside the Project’s aim to achieve high recycling rates, will alleviate the potential impacts on groundwater abstraction. |
| ● | Ensure that the resettlement activities as a result of the physical and economic displacement of communities required by the Project will follow the IFC PS5 through the development of an RAP and concurrent stakeholder engagement. |
| ● | Ensure that the relocation of cultural heritage resources will follow the IFC PS8. |
The radiation protection programme assessed and presented radiological baseline and safety assessment findings consistent with the IAEA Safety Standards, the IFC PSs, as well as the available Malawi Atomic Energy Regulations of 2012 promulgated by the AERA in terms of the Atomic Energy Bill (Act No. 16 of 2011).
| 23.4 | Infrastructure |
| 23.4.1 | Project Site Infrastructure – Process Plant |
Further geotechnical investigations and an update of the geotechnical report are planned prior to the commencement of the detailed design phase. This will address areas in the current report that were inconclusive. All design assumptions will be reviewed and updated as necessary once the revised report is available.
An investigation to identify potential borrow pits in the area for G5, G6, and fill material still needs to be undertaken.
MKAR intends to source electricity from an IPP to reduce upfront capital costs. Three options have been considered; however, these require further investigation and finalisation.
| 23.4.2 | Project Off-Site Infrastructure |
A camp and catering facility should be constructed during the very early stages of the project execution phase to ensure availability throughout the construction phase.
Geotechnical site investigation samples collected by Geoconsult were tested by Zutari; however, suitable samples for triaxial testing were not available. Therefore, a geotechnical engineer must be appointed to retrieve adequate samples from on-site test pits prior to the detailed design phase, enabling completion of the triaxial test campaign on in-situ materials.
| S-K 1300 Technical Report Summary on the Songwe Hill REE Project | Page 480 of 489 |
| |
| 23.4.3 | TSF |
The following TSF recommendations are proposed:
| ● | Prior to the commencement of the detailed design, a geotechnical engineer should be appointed to retrieve appropriate samples from test pits on site for the triaxial test work of the in-situ material. |
| ● | For consideration and evaluation during the detailed design of the TSF, |
| o | The possible further optimisation of the TSF drainage system should be assessed. |
| o | The validity of the basin geotextile should be assessed. |
| o | A more comprehensive detailed dam break analysis should be undertaken to more accurately define the potential inundation extent of the TSF |
| 23.5 | Operating Costs |
It is recommended that opportunities to reduce reagent consumptions and negotiate prices with reliable reagent suppliers or distributors with long-term contracts be investigated in order to optimise the OPEX and mitigate price fluctuations.
It is also recommended that a detailed energy yield analysis and uncertainty assessment be conducted to further optimise the energy requirements.
Furthermore, it is recommended that the PV solar and backup generation plant design be reassessed for optimisation as the technology in this field is constantly changing and improving.
| 23.6 | QP Opinion |
It is the opinion of SENET, responsible and acting as the QP for the Project, that the recommendations made are appropriate and that the Project should proceed with execution readiness activities.
| S-K 1300 Technical Report Summary on the Songwe Hill REE Project | Page 481 of 489 |
| |
| 24 | References |
A. Nxumalo, S.S. 2022. Geotechnical Interpretative Report Songwe Hill – Rare Earth, Pretoria: Zutari (Pty) Ltd.
Anon. 2022. Geotechnical Investigation, Lilongwe: Geoconsult Pty Ltd.
ANZECC and ARMCANZ. 2000a. Australian and New Zealand Guidelines for Fresh and Marine Water Quality. Volume 1: The Guidelines. National Water Quality Management Strategy Paper No. 4. Canberra, ACT: Environment Australia.
ANZECC and ARMCANZ. 2000b. Australian and New Zealand Guidelines for Fresh and Marine Water Quality. Volume 3: Primary Industries. National Water Quality Management Strategy Paper No. 4. Australian and New Zealand Environment and Conservation Council. Canberra, ACT: Environment Australia.
Bieniawski, Z.T. 1989. Engineering rock mass classifications. New York: Wiley.
Broom-Fendley, S., Brady, A.E., Wall, F., Gunn, G. and Dawes, W. 2016a. REE minerals at the Songwe Hill carbonatite, Malawi: HREE-enrichment in late-stage apatite. Ore Geology Reviews, 81: 23-41.
Broom-Fendley, S., Heaton, T., Wall, F., Gunn, G. 2016b. Tracing the fluid source of heavy REE mineralisation in carbonatites using a novel method of oxygen-isotope analysis in apatite: The example of Songwe Hill, Malawi. Chemical Geology, 440: 275-287.
Broom-Fendley, S., Brady, A.E., Horstwood, M.S.A., Woolley, A.R., Mtegha, J., Wall, F., Dawes, W., Gunn, G. 2017. Geology, geochemistry and geochronology of the Songwe Hill carbonatite, Malawi. Journal of African Earth Sciences, 134: 10-23.
Canadian Institute of Mining, Metallurgy and Petroleum (CIM). 2014. CIM Definition Standards for Mineral Resources & Mineral Reserves. Prepared by the CIM Standing Committee on Reserve Definitions. Adopted by CIM Council, 19 May 2014.
Canadian Institute of Mining, Metallurgy and Petroleum (CIM). 2019. CIM Estimation of Mineral Resources & Mineral Reserves Best Practice Guidelines. Prepared by the CIM Mineral Resource & Mineral Reserve Committee. Adopted by CIM Council, 29 November 2019.
Canadian Securities Administrators (CSA). 2011. National Instrument 43-101 – Standards of Disclosure for Mineral Projects (NI 43-101). Effective date 30 June 2011
Castor, S.B. 2008: The Mountain Pass rare-earth carbonatite and associated ultrapotassic rocks, California. Canadian Mineralogist, v. 46, 779-806.
Canadian Dam Association (CDA). 2013. Dam Safety Guidelines 2007. 2013 edition ed. CDA.
Canadian Dam Association (CDA). 2019. Application of Dam Safety Guidelines to Mining Dams. CDA.
Chakhmouradian, A. and Zaitsev, A.N. 2012. Rare Earth Mineralization in Igneous Rocks: Sources and Processes. Elements, 8: 347-353.
| S-K 1300 Technical Report Summary on the Songwe Hill REE Project | Page 482 of 489 |
| |
Chao, E.C.T., Back, J.M., Minkin, J.A., and Yinchen, R. 1992. Host-rock controlled epigenetic hydrothermal metasomatic origin of the Bayan Obo REE-Fe-Nb ore deposit, Inner Mongolia. P.R.C. Applied Geochemistry, 7: 443-458.
Chapola, L. S. 2001. Seismology in Malawi. Bulletin of the International Institute of Seismology and Earthquake Engineering, 35:57-69.
Chindandali, P. R. 2016. Seismic Observation and Seismicity of Malawi. Seismology Section, Geological Survey Department of Malawi.
CITES. “Convention on International Trade in Endangered Species of Wild Fauna and Flora” 2013 http://www.cites.org/eng/resources/pub/checklist11/Appendices.pdf.
Committee of State Road Authorities, 1985. Guidelines for road construction materials.
Digby Wells Environmental. 2021. Digby Wells Type 2 Ore characterisation 2021, Songwe SP0803 Type 2 material ABA and Sulphur specification.
Digby Wells Environmental. 2022a. Environmental, Social and Health Impact Assessment of the Songwe Hill Rare Earth Elements Project. MKA5076. May 2022.
Digby Wells Environmental. 2022b. Environmental, Social and Health Impact Assessment for the Songwe Hill Rare Earth Project, Malawi, Groundwater Impact Assessment, prepared by Digby Wells Environmental, dated July 2022.
Dixey, F., Campell Smith, W. and Bissett, C.B. 1937 (revised edition 1955). The Chilwa Series of Southern Nyasaland. Bulletin, Geological Survey Department, Nyasaland, 5, 1-71.
Doroshkevich, A.G., Viladkar, S., Ripp, G.S., Burtseva, M.V. 2009. Hydrothermal REE Mineralization in the Amba Dongar Carbonatite Complex, Gujarat, India. Canadian Mineralogist, 47: 1105-1116.
Department of Water Affairs and Forestry (DWAF) South Africa. 2005. A practical field procedure for identification and delineation of wetlands and riparian areas. DWAF Pretoria.
Eby, G.N., Roden-Tice, M., Krueger, H.L., Ewing, W., Faxon, E.H., and Woolley, A.R. 1995. Geochronology and cooling history of the northern part of the Chilwa Alkaline Province, Malawi. Journal of African Earth Sciences, 20: 257-288.
Eckermann, K.F., Wolbarst, A.B. and Richardson, A.C.B. 1988. Federal Guidance Report No 11, Limiting Values of Radionuclide Intake and Air Concentrations and Dose Conversion Factors for Inhalation, Submersion and Ingestion, Oak Ridge National Laboratories, Oak Ridge, Tennessee.
Equator Principles. 2020. The Equator Principles. https://equator-principles.com/app/uploads/The-Equator-Principles_EP4_July2020.pdf
Garson, M.S. 1962. The Tundulu carbonatite ring-complex in southern Nyasaland. Memoir of the Geological Survey of Malawi, 2.
| S-K 1300 Technical Report Summary on the Songwe Hill REE Project | Page 483 of 489 |
| |
Garson, M.S. 1965. Carbonatites in southern Malawi. Bulletin of the Geological Survey of Malawi, 15: 1-128.
Garson, M.S. 1966. Carbonatites in Malawi. In: Tuttle, O.F. and Gittins, J. (Eds.), Carbonatites. John Wiley, New York, 33-71
Garson, M.S. and Walshaw, R.D. 1969. The geology of the Melanje area. Bulletin of the Geological Survey of Malawi, 21: 1-157.
Giere, R. 1996. Formation of rare earth minerals in hydrothermal systems. In Rare Earth Minerals: Chemistry Origin and Ore Deposits. In Jones, A.P., Wall, F., and Williams, C.T., (Eds.). Rare Earth Minerals: Chemistry Origin and Ore Deposits. Chapman and Hall. 105-150.
Hall, M. and Swinden, S. 2012. The MSA Group. NI43-101 Technical Report and Mineral Resource Estimate for the Songwe Hill REE Project, Phalombe District, Republic of Malawi.
Holley et al. 2006. Geotechnical design for open pits at Tanjianshan, China.
Hornig-Kjarsgaard, I. 1998. Rare earth elements in sovitic carbonatites and their mineral phases. Journal of Petrology, 39: 2105-2121.
Hunting Geology and Geophysics Limited. 1985. Airborne Geophysical Survey: Government of Malawi: Report on Field Operations and Processing. Hunting Geology and Geophysics Limited.
International Atomic Energy Agency (IAEA). 2002. Monitoring and Surveillance of Residue from the Mining and Milling of Uranium and Thorium, Safety Report Series No.27, IAEA, Vienna.
International Atomic Energy Agency (IAEA). 2011. Radiation Protection and Safety of Radiation Sources: International Basic Safety Standards: General Safety Requirements, IAEA Safety Standards Series No. GSR Part 3 (Interim), IAEA, Vienna.
International Commission on Radiological Protection (ICRP). 1996. Age-Dependent Doses to Members of the Public from Intake of Radionuclides: Part 5 Compilation of Ingestion and Inhalation Dose Coefficients. ICRP Publication 72 Volume 26 No. 1, Pergamon Press, Oxford.
International Council on Mining and Metal (ICMM). 2019. Integrated Mine Closure: Good Practice Guide (2nd Edition). ICMM, London.
International Council on Mining and Metal (ICMM). 2021. Tailings Management: Good Practice Guide. ICMM, London.
International Council on Mining and Metals, United Nations Environment Programme, and Principles for Responsible Investment. 2020. Global Industry Standard on Tailings Management. August. Available at: Download Global Industry Standard on Tailings Management PDF.
| S-K 1300 Technical Report Summary on the Songwe Hill REE Project | Page 484 of 489 |
| |
International Electrotechnical Commission. IEC 60034-30-1, Rotating electrical machines – Part 30-1: Efficiency classes of line operated AC motors (IE code).
International Electrotechnical Commission. IEC 60076 (All Parts), Power Transformers.
International Electrotechnical Commission. IEC 61215 (All Parts), Terrestrial photovoltaic (PV) modules – Design qualification and type approval.
International Electrotechnical Commission. IEC 61439-2, Low-voltage switchgear and controlgear assemblies – Part 2: Power switchgear and controlgear assemblies.
International Electrotechnical Commission. IEC 61730 (All Parts), Photovoltaic (PV) module safety qualification.
International Finance Corporation. 2007a. Environmental, Health and Safety General Guidelines. IFC, World Bank Group. https://www.ifc.org/content/dam/ifc/doc/2000/2007-general-ehs-guidelines-en.pdf
International Finance Corporation. 2007b. Environmental, Health and Safety Guidelines: Occupational Health and Safety. IFC, World Bank Group. https://www.ifc.org/content/dam/ifc/doc/2000/2007-general-ehs-guidelines-occupational-health-and-safety-en.pdf
International Finance Corporation. 2007c. Environmental, Health and Safety Guidelines: Waste Management Facilities. IFC, World Bank Group. https://www.ifc.org/content/dam/ifc/doc/2000/2007-waste-management-facilities-ehs-guidelines-en.pdf
International Finance Corporation. 2012. IFC Performance Standards on Environmental and Social Sustainability. IFC, World Bank Group. https://www.ifc.org/content/dam/ifc/doc/mgrt/ifc-performance-standards.pdf
International Organization for Standardization. ISO 9001:2015, Quality management systems – Requirements.
International Organization for Standardization. ISO/TS 9002:2015, Quality management systems — Guidelines for the application of ISO 9001:2015.
International Organization for Standardization/International Electrotechnical Commission. ISO/IEC 17025:2017: General requirements for the competence of testing and calibration laboratories.
Japan International Cooperation Agency and Metal Mining Agency of Japan. 1989. Report on the Cooperative Mineral Exploration in the Chilwa Alkaline Area Republic of Malawi, Phases I (March 1987), II (March 1988), III (March 1989), Consolidated Report (March 1989).
Kallaste, A., Kilk, A., Belahcen, A., Vaimann, T., & Janson, K. 2012. Demagnetization in permanent magnet slotless generator using halbach array. In Proceedings of the 13th International Scientific Conference Electric Power Engineering 2012, EPE 2012 (Vol. 2, pp. 1053-1057). Brno University of Technology.
| S-K 1300 Technical Report Summary on the Songwe Hill REE Project | Page 485 of 489 |
| |
Kjarsgaard, B.A., and Hamilton, D.L. 1989. The genesis of carbonatites by immiscibility. In: Bell, K. (Editor), Carbonatites: Genesis and Evolution. Unwin Hyman, London, pp. 388-404.
Kijko, A. 2021. Deterministic and Probabilistic Seismic Hazard Analysis Songwe Hill Mine, Centurion: Natural Hazard Assessment Consultancy CC.
Le Bas, M.J. 1987. Carbonatite magmas. Mineralogical Magazine, 44: 133-40
Lebbos, P. 2022. Rheology Measurements for Western Geotechnical. Central Chemical Consulting. Malaga, published March 2022
Lehmann, B., Nakai, S., Höhndorf, A., Brinckmann, J., Dulski, P., Hein, U.F. and Masuda, A. 1994. REE mineralization at Gakara, Burundi: Evidence for anomalous upper mantle in the western Rift Valley. Geochimica et Cosmochimica Acta, 58: 985-992
Lewis, T.A. 1953. Geological report on Songwe ring-structure (E.P.L.2/1952). London Nyasaland Mining Corporation, Ltd. (unpublished)
Malawi. 2012. UN Map of Malawi (Map No. 3858 Rev4), published April 2012
Malawi Bureau of Standards. MS 214:2013, Drinking water – specification.
Malawi Bureau of Standards. MS 733:2005, Borehole and shallow well water quality – Specification.
Mariano, A.N. 1989. Nature of economic mineralization in carbonatites and related rocks. In Bell, K., (Ed), Carbonatites: Genesis and Evolution. Unwin Hyman, London. 149-176.
Middindi Consulting. 2019. Geotechnical Characterisation and Open Pit Slope Design for the Songwe Hill REE Project, Definitive Feasibility Study (DFS)
Mitchell, R.H. 2005. Carbonatites and Carbonatites and Carbonatites. The Canadian Mineralogist, 43, 2049-2068.
National Nuclear Regulator (NNR). 2013. Regulatory Guide: Safety Assessment of Radiation Hazards to members of the Public from NORM Activities, edited, NNR, Pretoria.
Prime Resources. 2021. Waste Classification of Waste Rock for the Songwe Rare Earth Elements Project, Malawi.
PRODEO Consulting (Pty) Ltd. 2025. PCP-1046 PFS Update Report.
Read, J., and Stacey, P. 2009. Guidelines for open pit slope design. CRC Press. Balkema.
Remote Exploration Services Ltd. 2010. Results Report: Songwe Geophysical Surveys, Songwe Hill, Malawi. Unpublished Report for Mkango Resources Ltd.
Remote Exploration Services Ltd. 2011. Updated Songwe digital elevation model and geophysical investigation. Unpublished Report for Mkango Resources Ltd.
Rocscience RocData 4.0. User’s Manual (https://www.rocscience.com/help/rsdata/overview)
Rocscience Dips User’s Manual (https://www.rocscience.com/help/dips/documentation)
| S-K 1300 Technical Report Summary on the Songwe Hill REE Project | Page 486 of 489 |
| |
South African Institution of Civil Engineering (SAICE). 2010. Site Investigation Code of Practice. 1st ed. SAICE – Geotechnical Division.
SENET. 2022a. Mkango Resources Limited, NI 43-101 Technical Report on the Songwe Rare Earth Element Project in Malawi.
SENET. 2022b. Mkango Resources Limited, Songwe Hill Rare Earth Element Project, Malawi, Definitive Feasibility Study Report.
SGS. 2021. Analytical Report, Songwe SP0803 Geochemical Analysis, PE156030 R0.
SGS. 2022. Analytical Report, Songwe SP0803 Geochemical Analysis, PE156275 R1.
Shedlock, K.M., Giardini, D., Grünthal, G., Zhang, P. 2000. The GSHAP global seismic hazard map. Seismological Research Letters, 71: 679-689.
Smith, M.P., and Henderson, P. 2000: Preliminary fluid inclusion constraints on fluid evolution in the Bayan Obo Fe-REE-Nb deposit, Inner Mongolia, China. Economic Geology, 95. 1371-1388.
South African Bureau of Standards. SANS 1507 (All Parts), Electric cables with extruded solid dielectric insulation for fixed installations (300/500 V to 1 900/3 300 V).
South African Bureau of Standards. SANS 10142-1, The wiring of premises – Part 1: Low-voltage installations.
The MSA Group. 2015. Mkango Resources Limited, Songwe REE Project, Malawi NI 43-101 Pre-Feasibility Report.
The MSA Group. 2020, Songwe Hill Rare Earth Element (REE) Project, Phalombe District, Republic of Malawi, NI 43-101 Technical Report – 23 January 2019 Mineral Resource Estimate.
Thompson, R., Peroni, R., & Visser, A. 2019. Mining Haul Roads: Theory and Practice (1st ed.). CRC Press. https://doi.org/10.1201/9780429491474
Wall, F. and Mariano, A.N. 1996. Rare earth minerals in carbonatites: a discussion on the Kangankunde Carbonatite, Malawi. In: Jones, A.P., Wall, F., and Williams, C.T., (Eds.) Rare Earth Minerals: Chemistry, Origin and Ore Deposits. Chapman and Hall, 193-225.
Wallace, M.E. and Green, D.H. 1988. An experimental determination of primary carbonatite magma composition. Nature, 335, 343-346.
Watkinson, D.H., and Wyllie, P.J. 1971. Experimental study of the join NaAlSiO 4-CaCO3-H2O and the genesis of alkalic rock-carbonatite complexes. Journal of Petrology, 12, 357-378.
| S-K 1300 Technical Report Summary on the Songwe Hill REE Project | Page 487 of 489 |
| |
Woolley, A.R. and Garson, M.S. 1970. Petrochemical and tectonic relationship of the Malawian carbonatite-alkaline province and the Lupata-Lebombo volcanics. In: T.N. Clifford and I.G. Gass (Eds.), African Magmatism and Tectonics. Oliver and Boyd, Edinburgh. 237-262.
Woolley, A.R. 1987. Lithosphere metasomatism and petrogenesis of the Chilwa Province of alkaline igneous rocks and carbonatites, Malawi. Journal of African Earth Sciences, 6, 891
Woolley, A.R. and Jones, G.C. 1987. The petrochemistry of the northern part of the Chilwa alkaline province, Malawi. Geological Society, London, Special Publications, 30, 335.
Woolley, A.R. and Kempe, D.R.C. 1989. Carbonatites: nomenclature, average chemical compositions, and element distribution. In: Bell, K. (Editor), Carbonatites: Genesis and Evolution. Unwin Hyman, London, pp1–14.
Woolley, A.R. 1991. The Chilwa Alkaline Igneous Province of Malawi: a review. In: Kampunzu, A.B. and Lubala, R.T. (Eds.), Magmatism in Extensional Structural Settings: the Phanerozoic African Plate. Springer-Verlag, Berlin, 377-409.
Woolley, A.R. 2001. Alkaline Rocks and Carbonatites of the World Part 3: Africa. The Geological Society, London. 372 pp.
Woolley, A.R., and Kjarsgaard, B.A. 2008. Paragenetic types of carbonatite as indicated by the diversity and relative abundances of associated silicate rocks: evidence from a global database. Canadian Mineralogist, 46 (4), 741-752.
World Health Organization (WHO). 2017. Guidelines for Drinking-Water Quality: fourth edition incorporating the first addendum. Geneva: WHO.
| S-K 1300 Technical Report Summary on the Songwe Hill REE Project | Page 488 of 489 |
| |
| 25 | Reliance on Information Provided by the Registrant |
This report has been prepared exclusively for the Registrant and for the purpose of complying with SEC Regulation S-K 1300. The QPs have reviewed for reasonableness the information provided to them by the Registrant and other third-party sources; however, such information has not been independently verified in all cases. This report may only be used for its intended purpose and may not be reproduced or distributed without the QPs’ written consent. The QPs assume no responsibility or liability for use of this report outside of its intended purpose.
Certain statements in this TRS constitute forward-looking information, including estimates of Mineral Resources and Mineral Reserves, production forecasts, operating cost projections, capital cost estimates, economic evaluations and development pans. These statements are based on assumptions believed to be reasonable at the time of preparation of the TRS; however, actual results may differ materially due to geological, technical, operational, financial, market, regulatory, environmental or other uncertainties that the QPs are unable to influence or predict.
Mineral Resource and Mineral Reserve estimates are subject to inherent geological uncertainty. Mining, processing, and metallurgical performance may vary from the estimates contained in this TRS. The QPs provide no warranty or guarantee, whether express or implied, that production, recovery, or economic outcomes will be achieved.
The QPs and their respective personnel shall not be liable for any losses, damages, or claims arising from the use, interpretation, or application of this report, except to the extent required by law.
The information, conclusions, opinions, and estimates contained in this report are based on the following:
| ● | Information available at the time of preparation of this report |
| ● | Assumptions, conditions, and qualifications as set forth in this report |
| ● | Data, reports, and other information as supplied by Mkango, MKAR and other third-party sources. |
For the purpose of this TRS, SENET, responsible and acting as the QP for the Project, has relied on ownership information provided by MKAR. In the consideration of all the legal aspects relating to the Songwe Hill REE Project, the authors have relied on MKAR and assumed that the information relating to the legal aspects and the status of surface and mineral rights is accurate.
For the purposes of estimating and reporting Mineral Reserves Bara has relied on MKAR for input on the following issues which have an impact on the modifying factors applied in converting Mineral Resources to Mineral Reserves:
| ● | Macroeconomic trends, data, and assumptions |
| ● | Marketing information and plans within the control of the registrant |
| ● | Legal matters outside the expertise of the QP |
| ● | Environmental matters outside the expertise of the QP |
| ● | Governmental factors outside the expertise of the QP |
| ● | Commitments or plans to accommodate local individuals or groups |
According to MKAR, there are no known litigations potentially affecting the Songwe Hill REE Project.
| S-K 1300 Technical Report Summary on the Songwe Hill REE Project | Page 489 of 489 |