Shareholder Report
|
12 Months Ended |
|
Oct. 31, 2025
USD ($)
Holding
|
|---|
| Shareholder Report [Line Items] |
|
|
| Document Type |
N-CSR/A
|
|
| Amendment Flag |
true
|
|
| Amendment Description |
The Registrant is filing this amendment to its Form N-CSR for the period ended October 31, 2025, originally filed with the Securities and ExchangeCommission on January 5, 2026 (Accession Number 0001580642-26-000038). The purpose of this amendment is to revise the “Costs paid as a percentage of a $10,000investment” from 0.82% to 0.92% on the Tailored Shareholder Report for the Slow Capital Growth Fund (Series Identifier S000088949). Except as set forth above, thisamendment does not amend, update or change any other items or disclosures found in the original Form N-CSR filing.
|
|
| Registrant Name |
VALUED ADVISERS TRUST
|
|
| Entity Central Index Key |
0001437249
|
|
| Entity Investment Company Type |
N-1A
|
|
| Document Period End Date |
Oct. 31, 2025
|
|
| Shareholder Report Annual or Semi-Annual |
Annual Shareholder Report
|
|
| C000205825 |
|
|
| Shareholder Report [Line Items] |
|
|
| Class Name |
Institutional Class
|
|
| Trading Symbol |
ESGIX
|
|
| Annual or Semi-Annual Statement [Text Block] |
This annual shareholder report contains important information about Dana Epiphany Equity Fund for the period of November 1, 2024 to October 31, 2025.
|
|
| Shareholder Report Annual or Semi-Annual |
Annual Shareholder Report
|
|
| Additional Information [Text Block] |
You can find additional information about the Fund at https://funddocs.filepoint.com/dana/. You can also request this information by contacting us at (855) 280-9648.
|
|
| Additional Information Phone Number |
(855) 280-9648
|
|
| Additional Information Website |
https://funddocs.filepoint.com/dana/
|
|
| Expenses [Text Block] |
What were the Fund’s costs for the last year?(based on a hypothetical $10,000 investment) Class Name | Costs of a $10,000 investment | Costs paid as a percentage of a $10,000 investment |
|---|
Institutional | $94 | 0.85% |
|---|
|
|
| Expenses Paid, Amount |
$ 94
|
|
| Expense Ratio, Percent |
0.85%
|
|
| Performance Past Does Not Indicate Future [Text] |
The Fund's past performance is not a good predictor of how the Fund will perform in the future.
|
|
| Average Annual Return [Table Text Block] |
Average Annual Total Returns | 1 Year | 5 Years | 10 Years |
|---|
Dana Epiphany Equity Fund - Institutional | 21.27% | 13.60% | 11.11% |
|---|
S&P 500® Index | 21.45% | 17.64% | 14.64% |
|---|
The Fund's past performance is not a good predictor of how the Fund will perform in the future. The graph and table do not reflect the deduction of taxes that a shareholder would pay on fund distributions or redemption of fund shares. |
|
| No Deduction of Taxes [Text Block] |
The graph and table do not reflect the deduction of taxes that a shareholder would pay on fund distributions or redemption of fund shares.
|
|
| AssetsNet |
$ 76,373,687
|
|
| Holdings Count | Holding |
48
|
|
| Advisory Fees Paid, Amount |
$ 342,745
|
|
| InvestmentCompanyPortfolioTurnover |
40.00%
|
|
| Additional Fund Statistics [Text Block] |
Net Assets | $76,373,687 |
|---|
Number of Portfolio Holdings | 48 |
|---|
Advisory Fee (net of waivers) | $342,745 |
|---|
Portfolio Turnover | 40% |
|---|
|
|
| Holdings [Text Block] |
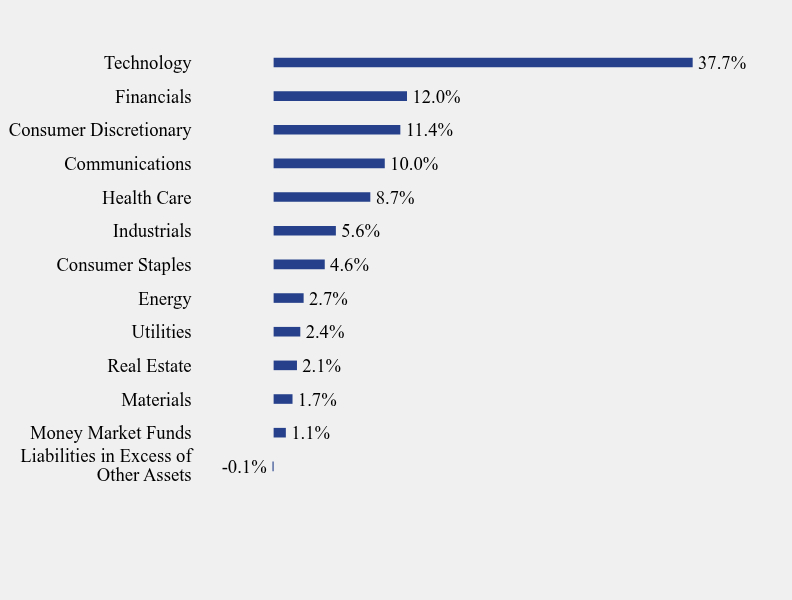
Sector Weighting (% of net assets)Value | Value |
|---|
Liabilities in Excess of Other Assets | -0.1% | Money Market Funds | 1.1% | Materials | 1.7% | Real Estate | 2.1% | Utilities | 2.4% | Energy | 2.7% | Consumer Staples | 4.6% | Industrials | 5.6% | Health Care | 8.7% | Communications | 10.0% | Consumer Discretionary | 11.4% | Financials | 12.0% | Technology | 37.7% |
Top 10 Holdings (% of net assets)Holding Name | % of Net
Assets |
|---|
NVIDIA Corp. | 8.2% |
|---|
Apple, Inc. | 6.7% |
|---|
Microsoft Corp. | 6.4% |
|---|
Alphabet, Inc., Class A | 4.2% |
|---|
Amazon.com, Inc. | 3.8% |
|---|
Lam Research Corp. | 3.2% |
|---|
Broadcom, Inc. | 2.9% |
|---|
Meta Platforms, Inc., Class A | 2.3% |
|---|
Bank of America Corp. | 2.3% |
|---|
Bank of New York Mellon Corp. (The) | 2.2% |
|---|
|
|
| C000161987 |
|
|
| Shareholder Report [Line Items] |
|
|
| Class Name |
Institutional Class
|
|
| Trading Symbol |
DSCIX
|
|
| Annual or Semi-Annual Statement [Text Block] |
This annual shareholder report contains important information about Dana Epiphany Small Cap Equity Fund for the period of November 1, 2024 to October 31, 2025.
|
|
| Shareholder Report Annual or Semi-Annual |
Annual Shareholder Report
|
|
| Additional Information [Text Block] |
You can find additional information about the Fund at https://funddocs.filepoint.com/dana/. You can also request this information by contacting us at (855) 280-9648.
|
|
| Additional Information Phone Number |
(855) 280-9648
|
|
| Additional Information Website |
https://funddocs.filepoint.com/dana/
|
|
| Expenses [Text Block] |
What were the Fund’s costs for the last year?(based on a hypothetical $10,000 investment) Class Name | Costs of a $10,000 investment | Costs paid as a percentage of a $10,000 investment |
|---|
Institutional | $99 | 0.95% |
|---|
|
|
| Expenses Paid, Amount |
$ 99
|
|
| Expense Ratio, Percent |
0.95%
|
|
| Performance Past Does Not Indicate Future [Text] |
The Fund's past performance is not a good predictor of how the Fund will perform in the future.
|
|
| Average Annual Return [Table Text Block] |
Average Annual Total Returns | 1 Year | 5 Years | Since Inception (November 3, 2015) |
|---|
Dana Epiphany Small Cap Equity Fund - Institutional | 9.41% | 13.35% | 7.26% |
|---|
S&P 500® Index | 21.45% | 17.64% | 14.48% |
|---|
S&P SmallCap 600® Index | 5.51% | 12.17% | 9.04% |
|---|
Morningstar US Small Core Index | 5.38% | 12.85% | 8.83% |
|---|
The primary index was changed from S&P Small Cap 600 to S&P 500 Total Return because the latter is a broader-based market index. S&P Small Cap 600 is now used as a secondary benchmark, because the Adviser believes it represents the portion of the market in which the Fund invests. The Fund is not sponsored, endorsed, sold or promoted by Morningstar, Inc. or any of its affiliates (all such entities, collectively, “Morningstar Entities”). The Morningstar Entities make no representation or warranty, express or implied, to individuals who invest in the Fund or any member of the public regarding the advisability of investing in equity securities generally or in the Fund in particular or the ability of the Fund to track the Morningstar Indices or general equity market performance. THE MORNINGSTAR ENTITIES DO NOT GUARANTEE THE ACCURACY AND/OR THE COMPLETENESS OF THE FUND OR ANY DATA INCLUDED THEREIN AND MORNINGSTAR ENTITIES SHALL HAVE NO LIABILITY FOR ANY ERRORS, OMISSIONS, OR INTERRUPTIONS THEREIN. The Fund's past performance is not a good predictor of how the Fund will perform in the future. The graph and table do not reflect the deduction of taxes that a shareholder would pay on fund distributions or redemption of fund shares. |
|
| Performance Inception Date |
Nov. 03, 2015
|
|
| No Deduction of Taxes [Text Block] |
The graph and table do not reflect the deduction of taxes that a shareholder would pay on fund distributions or redemption of fund shares.
|
|
| AssetsNet |
$ 32,465,642
|
|
| Holdings Count | Holding |
59
|
|
| Advisory Fees Paid, Amount |
$ 63,610
|
|
| InvestmentCompanyPortfolioTurnover |
55.00%
|
|
| Additional Fund Statistics [Text Block] |
Net Assets | $32,465,642 |
|---|
Number of Portfolio Holdings | 59 |
|---|
Advisory Fee (net of waivers) | $63,610 |
|---|
Portfolio Turnover | 55% |
|---|
|
|
| Holdings [Text Block] |
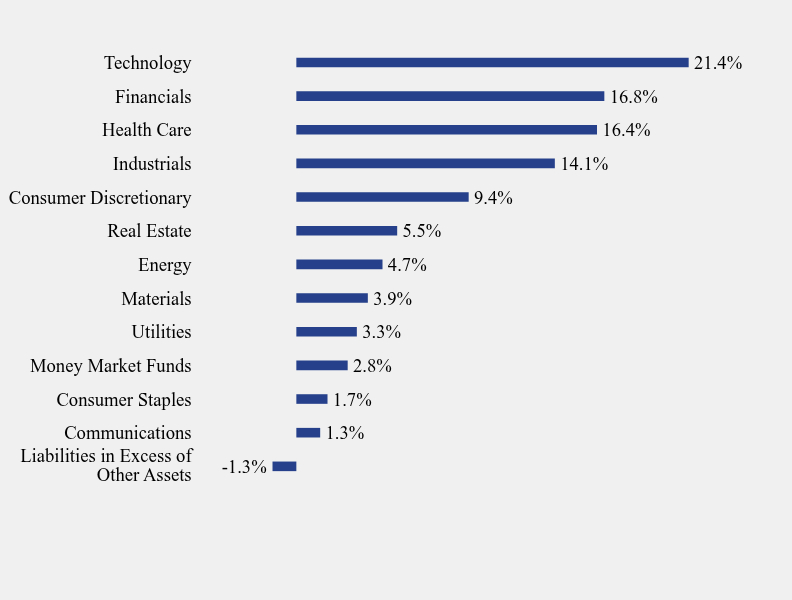
Sector Weighting (% of net assets)Value | Value |
|---|
Liabilities in Excess of Other Assets | -1.3% | Communications | 1.3% | Consumer Staples | 1.7% | Money Market Funds | 2.8% | Utilities | 3.3% | Materials | 3.9% | Energy | 4.7% | Real Estate | 5.5% | Consumer Discretionary | 9.4% | Industrials | 14.1% | Health Care | 16.4% | Financials | 16.8% | Technology | 21.4% |
Top 10 Holdings (% of net assets)Holding Name | % of Net Assets |
|---|
Fidelity Investments Money Market Government Portfolio, Institutional Class | 2.8% |
|---|
Lumentum Holdings, Inc. | 2.4% |
|---|
PDF Solutions, Inc. | 2.3% |
|---|
SPX Technologies, Inc. | 2.2% |
|---|
CSG Systems International, Inc. | 2.2% |
|---|
Agilysys, Inc. | 2.2% |
|---|
Powell Industries, Inc. | 2.2% |
|---|
MYR Group, Inc. | 2.2% |
|---|
Insmed, Inc. | 2.0% |
|---|
Enpro, Inc. | 2.0% |
|---|
|
|
| C000131830 |
|
|
| Shareholder Report [Line Items] |
|
|
| Fund Name |
Dana Large Cap Equity Fund
|
|
| Class Name |
Institutional Class
|
|
| Trading Symbol |
DLCIX
|
|
| Annual or Semi-Annual Statement [Text Block] |
This annual shareholder report contains important information about Dana Large Cap Equity Fund for the period of November 1, 2024 to October 31, 2025.
|
|
| Shareholder Report Annual or Semi-Annual |
Annual Shareholder Report
|
|
| Additional Information [Text Block] |
You can find additional information about the Fund at https://funddocs.filepoint.com/dana/. You can also request this information by contacting us at (855) 280-9648.
|
|
| Material Fund Change Notice [Text Block] |
This report describes changes to the Fund that occurred during the reporting period.
|
|
| Additional Information Phone Number |
(855) 280-9648
|
|
| Additional Information Website |
https://funddocs.filepoint.com/dana/
|
|
| Expenses Paid, Amount |
$ 83
|
|
| Expense Ratio, Percent |
0.75%
|
|
| Performance Past Does Not Indicate Future [Text] |
The Fund's past performance is not a good predictor of how the Fund will perform in the future.
|
|
| No Deduction of Taxes [Text Block] |
The graph and table do not reflect the deduction of taxes that a shareholder would pay on fund distributions or redemption of fund shares.
|
|
| AssetsNet |
$ 72,250,337
|
|
| Holdings Count | Holding |
48
|
|
| Advisory Fees Paid, Amount |
$ 259,964
|
|
| InvestmentCompanyPortfolioTurnover |
33.00%
|
|
| C000237915 |
|
|
| Shareholder Report [Line Items] |
|
|
| Fund Name |
Kovitz Core Equity ETF
|
|
| Trading Symbol |
EQTY
|
|
| Annual or Semi-Annual Statement [Text Block] |
This annual shareholder report contains important information about Kovitz Core Equity ETF (the "Fund") for the period of November 1, 2024 to October 31, 2025.
|
|
| Shareholder Report Annual or Semi-Annual |
Annual Shareholder Report
|
|
| Additional Information [Text Block] |
You can find additional information about the Fund at https://www.kovitz.com/eqty. You can also request this information by contacting us at (877) 714-2327.
|
|
| Additional Information Phone Number |
(877) 714-2327
|
|
| Additional Information Website |
https://www.kovitz.com/eqty
|
|
| Expenses [Text Block] |
What were the Fund’s costs for the last year?(based on a hypothetical $10,000 investment) Fund Name | Costs of a $10,000 investment | Costs paid as a percentage of a $10,000 investment |
|---|
Kovitz Core Equity ETF | $105 | 0.99% |
|---|
|
|
| Expenses Paid, Amount |
$ 105
|
|
| Expense Ratio, Percent |
0.99%
|
|
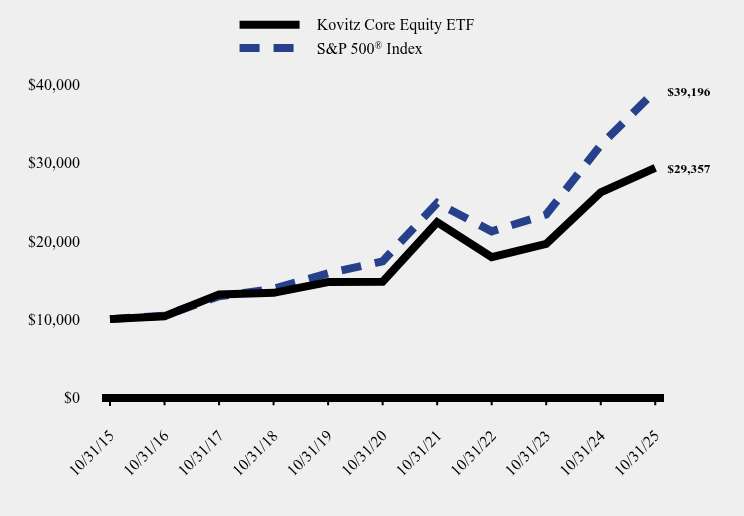
| Factors Affecting Performance [Text Block] |
How did the Fund perform during the reporting period? MARKET AND PERFORMANCE SUMMARY For the 12-month period ended October 31, 2025, the Fund achieved a total return of 12.19% while the benchmark S&P500® Index (“S&P 500”) gained 21.45%. At the six-month mark, the Fund’s performance was ahead of the S&P 500’s, but over the second six months of the period, the index enjoyed a total return that was 9.51% ahead of the Fund’s. Performance variability to the S&P 500 is expected over shorter time periods given the Fund’s concentration. Bloomberg analytics software informs us that, relative to the S&P 500, the Fund was underweight stocks characterized at momentum stocks for each month in the second half of the performance period. Further, the Bloomberg Market Surveillance Factors to Watch shows that momentum stocks were the second-best performing factor driving U.S. stock market returns for the six month period to October 31, 2025. We believe the portfolio’s underweight to momentum stocks accounts for a large portion of the performance difference over the period. We recommend this factor construct as the best way to understand the performance difference between the Fund and its benchmark. Our strategic intent remains that the Fund outperforms the S&P 500 over a full market cycle. PORTFOLIO ACTIVITY During the Fund’s fiscal year, we initiated new positions in Ashtead Group PLC ADR, Adobe, Alcon AG, Cooper Companies, Floor & Décor, Microsoft, Ryan Specialty, Thermo Fisher Scientific, and Waters. At the time of the purchases, we anticipated good returns in these stocks over the next several years. We exited Diageo ADRs and Fiserv, Hasbro, JP Morgan, Motorola Solutions, Oracle, and PPG stocks. We sold and repurchased Analog Devices stock during the period. We also added to and trimmed from existing positions to improve the expected return of the aggregate portfolio. Thank you for your continued support and trust in our ability to manage your investment in the Fund. |
|
| Performance Past Does Not Indicate Future [Text] |
The Fund's past performance is not a good predictor of how the Fund will perform in the future.
|
|
| Line Graph [Table Text Block] |
| Kovitz Core Equity ETF | S&P 500® Index |
|---|
10/31/15 | $10,000 | $10,000 |
|---|
10/31/16 | $10,365 | $10,451 |
|---|
10/31/17 | $13,166 | $12,921 |
|---|
10/31/18 | $13,364 | $13,870 |
|---|
10/31/19 | $14,746 | $15,857 |
|---|
10/31/20 | $14,780 | $17,397 |
|---|
10/31/21 | $22,401 | $24,862 |
|---|
10/31/22 | $17,918 | $21,230 |
|---|
10/31/23 | $19,615 | $23,383 |
|---|
10/31/24 | $26,221 | $32,272 |
|---|
10/31/25 | $29,357 | $39,196 |
|---|
|
|
| Average Annual Return [Table Text Block] |
| 1 Year | 5 Years | 10 Years |
|---|
Kovitz Core Equity ETF - NAV
| 11.96% | 14.71% | 11.37% |
|---|
S&P 500® Index | 21.45% | 17.64% | 14.64% |
|---|
|
|
| No Deduction of Taxes [Text Block] |
The graph and table do not reflect the deduction of taxes that a shareholder would pay on fund distributions or redemption of fund shares.
|
|
| AssetsNet |
$ 1,274,359,947
|
|
| Holdings Count | Holding |
37
|
|
| Advisory Fees Paid, Amount |
$ 12,071,014
|
|
| InvestmentCompanyPortfolioTurnover |
36.00%
|
|
| Additional Fund Statistics [Text Block] |
Net Assets | $1,274,359,947 |
|---|
Number of Portfolio Holdings | 37 |
|---|
Advisory Fee | $12,071,014 |
|---|
Portfolio Turnover | 36% |
|---|
|
|
| Holdings [Text Block] |
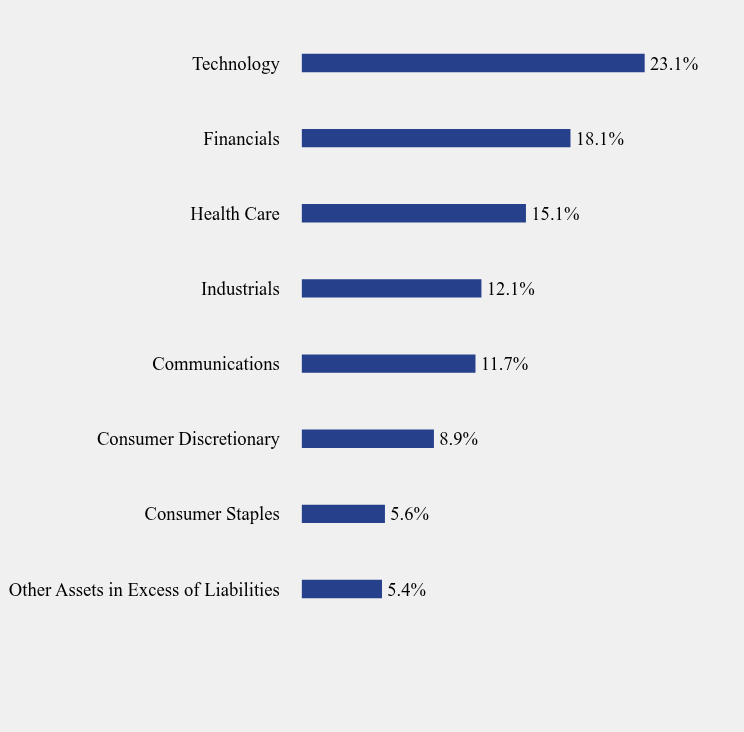
Sector Weighting (% of net assets)Value | Value |
|---|
Other Assets in Excess of Liabilities | 5.4% | Consumer Staples | 5.6% | Consumer Discretionary | 8.9% | Communications | 11.7% | Industrials | 12.1% | Health Care | 15.1% | Financials | 18.1% | Technology | 23.1% |
|
|
| C000255350 |
|
|
| Shareholder Report [Line Items] |
|
|
| Fund Name |
Slow Capital Growth Fund
|
|
| Trading Symbol |
SLWGX
|
|
| Annual or Semi-Annual Statement [Text Block] |
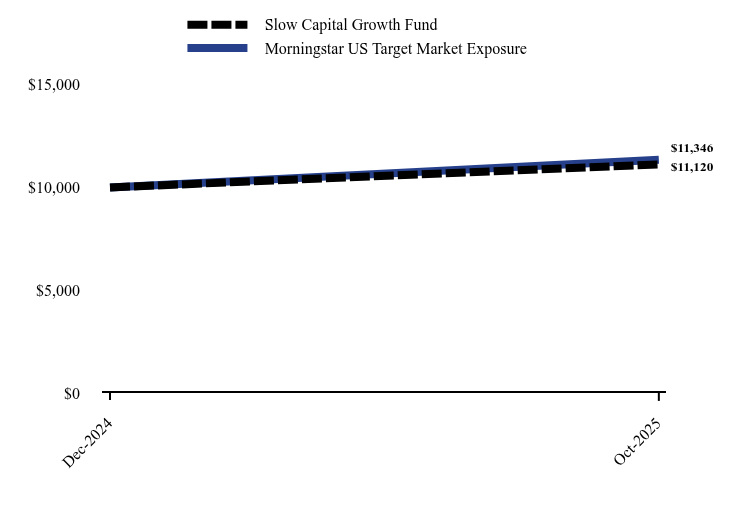
This annual shareholder report contains important information about Slow Capital Growth Fund (the “Fund”) for the period of December 6, 2024 to October 31, 2025.
|
|
| Additional Information [Text Block] |
You can find additional information about the Fund at https://slowcapitalfunds.com/literature. You can also request this information by contacting us at 833-377-2715.
|
|
| Additional Information Phone Number |
833-377-2715
|
|
| Additional Information Website |
https://slowcapitalfunds.com/literature
|
|
| Expenses [Text Block] |
What were the Fund’s costs for the last year?(based on a hypothetical $10,000 investment) Table SummaryFund Name | Costs of a $10,000 investment | Costs paid as a percentage of a $10,000 investment |
|---|
Slow Capital Growth Fund | $87Footnote Reference* | 0.92% |
|---|
| Footnote | Description | Footnote* | The reporting period is less than a full annual reporting period. Expenses paid for a full annual reporting period would be
higher. |
|
|
| Expenses Paid, Amount |
$ 87
|
[1] |
| Expense Ratio, Percent |
0.92%
|
|
| Factors Affecting Performance [Text Block] |
How did the Fund perform during the reporting period? From inception through October 31, 2025, the Fund (SLWGX) returned 11.20% compared to the Morningstar US Target Market Exposure Index return of 13.46%. The period belonged to AI infrastructure. Hyperscalers deployed hundreds of billions of dollars in building capacity, creating extraordinary demand for specialized semiconductors and cloud services. While momentum dominated headlines, we focused on companies we believed had durable competitive advantages in this transforming landscape; Companies that are not just riding the wave, but also building the infrastructure beneath it. Top Contributors: Broadcom 500 bps: Custom AI chips and VMware integration drove 20% revenue growth as hyperscalers accelerated buildouts. Alphabet 240 bps: First $100 billion quarterly revenue. Cloud grew by 34%, with the backlog reaching $155 billion, as AI integration expanded enterprise adoption. Nvidia 210 bps: Data center revenue surged 56% on Blackwell GPU demand, maintaining dominant 90%+ market share in AI accelerators. Top Detractors: HubSpot -129 bps: Growth decelerated to mid-teens as OpenAI's competing tools highlighted AI disruption risks for traditional SaaS business models. Regeneron -90 bps: Late-stage itepekimab COPD trial failure and continued Eylea biosimilar erosion. ON Semiconductor -83 bps: Automotive chip weakness, particularly in China, with management guiding 25% sequential revenue decline as EV adoption slowed. Technology 597 bps and Communications 528 bps sectors led, reflecting concentrated AI exposure. Consumer Discretionary 248 bps and Industrials 93 bps sectors contributed positively. Health Care -155 bps and Consumer Staples -83 bps sectors detracted. We seek companies the Adviser believes have the potential for above-average growth of capital and sustained high rates of return. This period's performance reflects patient, bottom-up selection rather than thematic momentum chasing. |
|
| Line Graph [Table Text Block] |
Table Summary | Slow Capital Growth Fund | Morningstar US Target Market Exposure |
|---|
Dec-2024 | $10,000 | $10,000 |
|---|
Oct-2025 | $11,120 | $11,346 |
|---|
|
|
| Average Annual Return [Table Text Block] |
Table Summary | Since Inception (December 6, 2024) |
|---|
Slow Capital Growth Fund | 11.20% |
|---|
Morningstar US Target Market Exposure | 13.46% |
|---|
|
|
| Performance Inception Date |
Dec. 06, 2024
|
|
| AssetsNet |
$ 87,132,884
|
|
| Holdings Count | Holding |
32
|
|
| Advisory Fees Paid, Amount |
$ 276,863
|
|
| InvestmentCompanyPortfolioTurnover |
2.00%
|
|
| C000123870 |
|
|
| Shareholder Report [Line Items] |
|
|
| Fund Name |
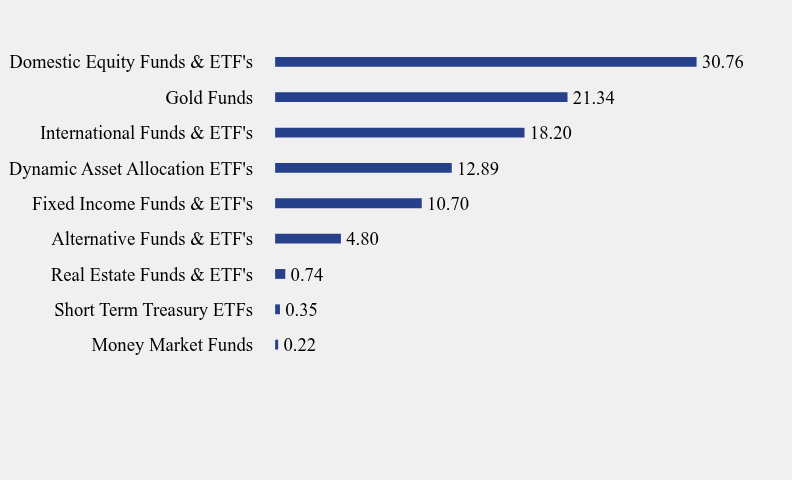
SMI Dynamic Allocation Fund
|
|
| Trading Symbol |
SMIDX
|
|
| Annual or Semi-Annual Statement [Text Block] |
This annual shareholder report contains important information about SMI Dynamic Allocation Fund for the period of November 1, 2024 to October 31, 2025.
|
|
| Shareholder Report Annual or Semi-Annual |
Annual Shareholder Report
|
|
| Additional Information [Text Block] |
You can find additional information about the Fund at https://funddocs.filepoint.com/smi/. You can also request this information by contacting us at (877) 764-3863.
|
|
| Material Fund Change Notice [Text Block] |
This report describes changes to the Fund that occurred during the reporting period.
|
|
| Additional Information Phone Number |
(877) 764-3863
|
|
| Additional Information Website |
https://funddocs.filepoint.com/smi/
|
|
| Expenses [Text Block] |
What were the Fund’s costs for the last year?(based on a hypothetical $10,000 investment) Fund Name | Costs of a $10,000 investment | Costs paid as a percentage of a $10,000 investment |
|---|
SMI Dynamic Allocation Fund | $144 | 1.30% |
|---|
|
|
| Expenses Paid, Amount |
$ 144
|
|
| Expense Ratio, Percent |
1.30%
|
|
| Performance Past Does Not Indicate Future [Text] |
The Fund's past performance is not a good predictor of how the Fund will perform in the future.
|
|
| Average Annual Return [Table Text Block] |
Average Annual Total Returns | 1 Year | 5 Years | 10 Years |
|---|
SMI Dynamic Allocation Fund | 21.46% | 7.31% | 5.43% |
|---|
S&P 500 Index TR | 21.45% | 17.64% | 14.64% |
|---|
Bloomberg U.S. Aggregate Bond Index | 6.16% | -0.24% | 1.90% |
|---|
Weighted Index* | 15.29% | 10.37% | 9.63% |
|---|
* The Weighted Index for the SMI Dynamic Allocation Fund is comprised of 60% S&P 500 and 40% Bloomberg U.S. Aggregate Bond Index. The Fund's past performance is not a good predictor of how the Fund will perform in the future. The graph and table do not reflect the deduction of taxes that a shareholder would pay on fund distributions or redemption of fund shares. |
|
| No Deduction of Taxes [Text Block] |
The graph and table do not reflect the deduction of taxes that a shareholder would pay on fund distributions or redemption of fund shares.
|
|
| AssetsNet |
$ 77,795,141
|
|
| Holdings Count | Holding |
24
|
|
| Advisory Fees Paid, Amount |
$ 723,152
|
|
| InvestmentCompanyPortfolioTurnover |
200.00%
|
|
| Additional Fund Statistics [Text Block] |
Net Assets | $77,795,141 |
|---|
Number of Portfolio Holdings | 24 |
|---|
Advisory Fee (net of waivers) | $723,152 |
|---|
Portfolio Turnover | 200% |
|---|
|
|
| Holdings [Text Block] |
Sector Weighting (% of net assets)Value | Value |
|---|
Money Market Funds | 0.22 | Short Term Treasury ETFs | 0.35 | Real Estate Funds & ETF's | 0.74 | Alternative Funds & ETF's | 4.80 | Fixed Income Funds & ETF's | 10.70 | Dynamic Asset Allocation ETF's | 12.89 | International Funds & ETF's | 18.20 | Gold Funds | 21.34 | Domestic Equity Funds & ETF's | 30.76 |
Top 10 Holdings (% of net assets)Holding Name | % of Net Assets |
|---|
Sprott Physical Gold Trust | 21.3% |
|---|
BNY Mellon US Large Cap Core Equity ETF | 20.0% |
|---|
SMI 3Fourteen Real Asset Allocation ETF | 12.9% |
|---|
iShares MSCI Emerging Markets ex China ETF | 8.9% |
|---|
Invesco QQQ Trust, Series 1 | 8.2% |
|---|
iShares MSCI EAFE ETF | 7.3% |
|---|
iShares iBoxx $ Investment Grade Corporate Bond ETF | 2.9% |
|---|
Schwab Long-Term U.S. Treasury ETF | 2.6% |
|---|
Schwab High Yield Bond ETF | 2.2% |
|---|
AQR Diversifying Strategies Fund, Class I | 1.9% |
|---|
|
|
| C000123869 |
|
|
| Shareholder Report [Line Items] |
|
|
| Fund Name |
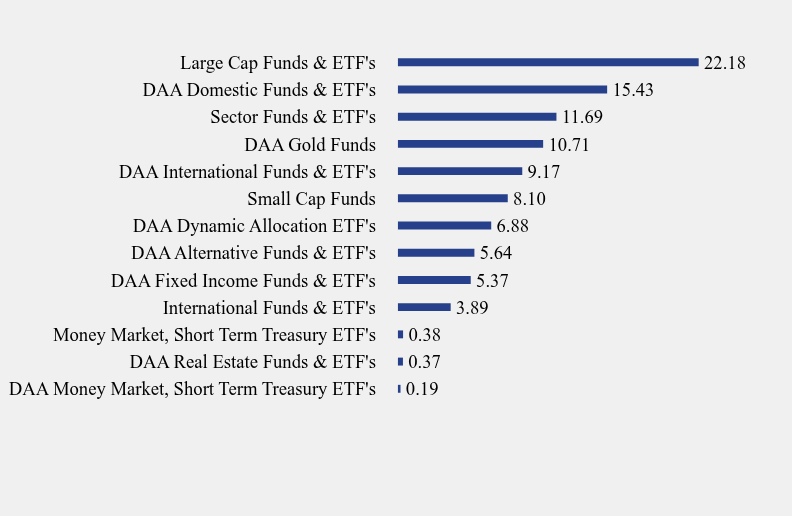
SMI Multi-Strategy Fund
|
|
| Trading Symbol |
SMILX
|
|
| Annual or Semi-Annual Statement [Text Block] |
This annual shareholder report contains important information about SMI Multi-Strategy Fund for the period of November 1, 2024 to October 31, 2025.
|
|
| Shareholder Report Annual or Semi-Annual |
Annual Shareholder Report
|
|
| Additional Information [Text Block] |
You can find additional information about the Fund at https://funddocs.filepoint.com/smi/. You can also request this information by contacting us at (877) 764-3863.
|
|
| Material Fund Change Notice [Text Block] |
This report describes changes to the Fund that occurred during the reporting period.
|
|
| Additional Information Phone Number |
(877) 764-3863
|
|
| Additional Information Website |
https://funddocs.filepoint.com/smi/
|
|
| Expenses [Text Block] |
What were the Fund’s costs for the last year?(based on a hypothetical $10,000 investment) Fund Name | Costs of a $10,000 investment | Costs paid as a percentage of a $10,000 investment |
|---|
SMI Multi-Strategy Fund | $136 | 1.27% |
|---|
|
|
| Expenses Paid, Amount |
$ 136
|
|
| Expense Ratio, Percent |
1.27%
|
|
| Performance Past Does Not Indicate Future [Text] |
The Fund's past performance is not a good predictor of how the Fund will perform in the future.
|
|
| Average Annual Return [Table Text Block] |
Average Annual Total Returns | 1 Year | 5 Years | 10 Years |
|---|
SMI Multi-Strategy Fund | 14.18% | 8.60% | 7.02% |
|---|
S&P 500 Index TR | 21.45% | 17.64% | 14.64% |
|---|
Bloomberg U.S. Aggregate Bond Index | 6.16% | -0.24% | 1.90% |
|---|
Weighted Index* | 15.29% | 10.37% | 9.63% |
|---|
* The Weighted Index for the SMI Multi-Strategy Fund is comprised of 60% S&P 500 and 40% Bloomberg U.S. Aggregate Bond Index. The Fund's past performance is not a good predictor of how the Fund will perform in the future. The graph and table do not reflect the deduction of taxes that a shareholder would pay on fund distributions or redemption of fund shares. |
|
| No Deduction of Taxes [Text Block] |
The graph and table do not reflect the deduction of taxes that a shareholder would pay on fund distributions or redemption of fund shares.
|
|
| AssetsNet |
$ 54,116,148
|
|
| Holdings Count | Holding |
45
|
|
| Advisory Fees Paid, Amount |
$ 436,341
|
|
| InvestmentCompanyPortfolioTurnover |
187.00%
|
|
| Additional Fund Statistics [Text Block] |
Net Assets | $54,116,148 |
|---|
Number of Portfolio Holdings | 45 |
|---|
Advisory Fee (net of waivers) | $436,341 |
|---|
Portfolio Turnover | 187% |
|---|
|
|
| Holdings [Text Block] |
Top 10 Holdings (% of net assets)Holding Name | % of Net Assets |
|---|
Sprott Physical Gold Trust | 10.7% |
|---|
SMI 3Fourteen Full-Cycle Trend ETF | 10.6% |
|---|
BNY Mellon US Large Cap Core Equity ETF | 10.0% |
|---|
iShares Russell 1000 Growth ETF | 7.0% |
|---|
SMI 3Fourteen Real Asset Allocation ETF | 6.8% |
|---|
Aegis Value Fund, Inc., Institutional Class | 4.7% |
|---|
iShares MSCI Emerging Markets ex China ETF | 4.5% |
|---|
Morgan Stanley Growth Portfolio, Institutional Class | 4.4% |
|---|
USCF SummerHaven Dynamic Commodity Strategy No K-1 Fund | 4.1% |
|---|
Invesco QQQ Trust, Series 1 | 4.1% |
|---|
Sector Weighting (% of net assets)Value | Value |
|---|
DAA Money Market, Short Term Treasury ETF's | 0.19 | DAA Real Estate Funds & ETF's | 0.37 | Money Market, Short Term Treasury ETF's | 0.38 | International Funds & ETF's | 3.89 | DAA Fixed Income Funds & ETF's | 5.37 | DAA Alternative Funds & ETF's | 5.64 | DAA Dynamic Allocation ETF's | 6.88 | Small Cap Funds | 8.10 | DAA International Funds & ETF's | 9.17 | DAA Gold Funds | 10.71 | Sector Funds & ETF's | 11.69 | DAA Domestic Funds & ETF's | 15.43 | Large Cap Funds & ETF's | 22.18 |
|
|
| C000123868 |
|
|
| Shareholder Report [Line Items] |
|
|
| Fund Name |
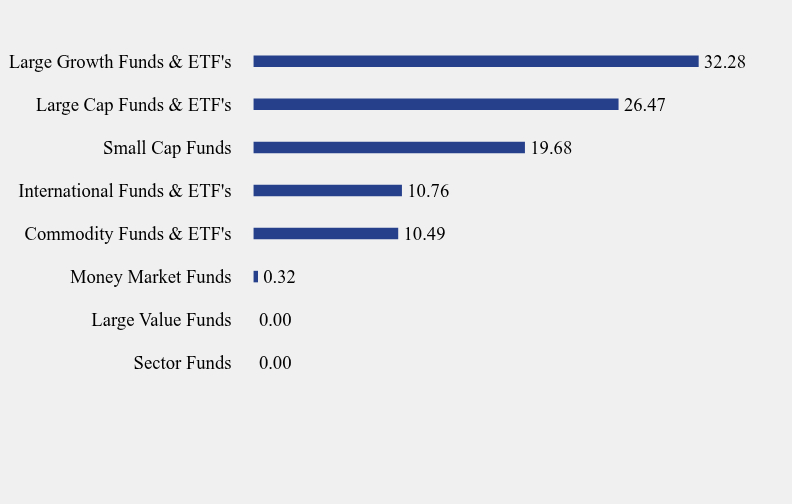
Sound Mind Investing Fund
|
|
| Trading Symbol |
SMIFX
|
|
| Annual or Semi-Annual Statement [Text Block] |
This annual shareholder report contains important information about Sound Mind Investing Fund for the period of November 1, 2024 to October 31, 2025.
|
|
| Shareholder Report Annual or Semi-Annual |
Annual Shareholder Report
|
|
| Additional Information [Text Block] |
You can find additional information about the Fund at https://funddocs.filepoint.com/smi/. You can also request this information by contacting us at (877) 764-3863.
|
|
| Material Fund Change Notice [Text Block] |
This report describes changes to the Fund that occurred during the reporting period.
|
|
| Additional Information Phone Number |
(877) 764-3863
|
|
| Additional Information Website |
https://funddocs.filepoint.com/smi/
|
|
| Expenses [Text Block] |
What were the Fund’s costs for the last year?(based on a hypothetical $10,000 investment) Fund Name | Costs of a $10,000 investment | Costs paid as a percentage of a $10,000 investment |
|---|
Sound Mind Investing Fund | $113 | 1.10% |
|---|
|
|
| Expenses Paid, Amount |
$ 113
|
|
| Expense Ratio, Percent |
1.10%
|
|
| Performance Past Does Not Indicate Future [Text] |
The Fund's past performance is not a good predictor of how the Fund will perform in the future.
|
|
| Average Annual Return [Table Text Block] |
Average Annual Total Returns | 1 Year | 5 Years | 10 Years |
|---|
Sound Mind Investing Fund | 4.72% | 9.30% | 7.78% |
|---|
S&P 500 Index TR | 21.45% | 17.64% | 14.64% |
|---|
SMI Custom Index* | 18.95% | 14.08% | 11.06% |
|---|
* The SMI Custom Index for the Sound Mind Investing Fund is comprised of 20 Russell 1000® Value Index, 20% Russell 1000® Growth Index, 20% Russell 2000® Value Index, 20% Russell 2000® Growth Index and 20% MSCI EAFE Index. The Fund's past performance is not a good predictor of how the Fund will perform in the future. The graph and table do not reflect the deduction of taxes that a shareholder would pay on fund distributions or redemption of fund shares. |
|
| No Deduction of Taxes [Text Block] |
The graph and table do not reflect the deduction of taxes that a shareholder would pay on fund distributions or redemption of fund shares.
|
|
| AssetsNet |
$ 96,291,537
|
|
| Holdings Count | Holding |
39
|
|
| Advisory Fees Paid, Amount |
$ 864,284
|
|
| InvestmentCompanyPortfolioTurnover |
118.00%
|
|
| Additional Fund Statistics [Text Block] |
Net Assets | $96,291,537 |
|---|
Number of Portfolio Holdings | 39 |
|---|
Advisory Fee (net of waivers) | $864,284 |
|---|
Portfolio Turnover | 118% |
|---|
|
|
| Holdings [Text Block] |
Sector Weighting (% of net assets)Value | Value |
|---|
Sector Funds | 0.00 | Large Value Funds | 0.00 | Money Market Funds | 0.32 | Commodity Funds & ETF's | 10.49 | International Funds & ETF's | 10.76 | Small Cap Funds | 19.68 | Large Cap Funds & ETF's | 26.47 | Large Growth Funds & ETF's | 32.28 |
Top 10 Holdings (% of net assets)Holding Name | % of Net Assets |
|---|
SMI 3Fourteen Full-Cycle Trend ETF | 26.5% |
|---|
iShares Russell 1000 Growth ETF | 19.9% |
|---|
Morgan Stanley Institutional Fund, Inc., Institutional Class | 12.5% |
|---|
Aegis Value Fund, Inc., Institutional Class | 11.7% |
|---|
Cambria Global Value ETF | 10.7% |
|---|
USCF SummerHaven Dynamic Commodity Strategy No K-1 Fund | 10.5% |
|---|
Morgan Stanley Institutional Fund, Inc., Inception Portolio, Class I | 8.0% |
|---|
Fidelity Investments Money Market Government Portfolio, Institutional Class | 0.3% |
|---|
Delaware Ivy Large Cap Growth Fund, Class I | 0.0% |
|---|
Lord Abbett Developing Growth Fund, Inc., Institutional Class | 0.0% |
|---|
|
|
|
|