Shareholder Report
|
6 Months Ended |
|
Mar. 31, 2026
USD ($)
Holding
|
|---|
| Shareholder Report [Line Items] |
|
|
| Document Type |
N-CSRS
|
|
| Amendment Flag |
false
|
|
| Registrant Name |
Northern Lights Fund Trust III
|
|
| Entity Central Index Key |
0001537140
|
|
| Entity Investment Company Type |
N-1A
|
|
| Document Period End Date |
Mar. 31, 2026
|
|
| Shareholder Report Annual or Semi-Annual |
Semi-Annual Shareholder Report
|
|
| C000159719 |
|
|
| Shareholder Report [Line Items] |
|
|
| Fund Name |
Pinnacle Multi-Strategy Core Fund
|
|
| Class Name |
Class A
|
|
| Trading Symbol |
APSHX
|
|
| Annual or Semi-Annual Statement [Text Block] |
This semi-annual shareholder report contains important information about Pinnacle Multi-Strategy Core Fund for the period of October 1, 2025 to March 31, 2026.
|
|
| Additional Information [Text Block] |
You can find additional information about the Fund at pinnacledynamicfunds.com/document-center/. You can also request this information by contacting us at (888) 985-9830.
|
|
| Additional Information Phone Number |
(888) 985-9830
|
|
| Additional Information Website |
pinnacledynamicfunds.com/document-center/
|
|
| Expenses [Text Block] |
What were the Fund’s costs for the last six months?(based on a hypothetical $10,000 investment) Table SummaryClass Name | Costs of a $10,000 investment | Costs paid as a percentage of a $10,000 investment |
|---|
Class A | $70 | 1.37%Footnote Reference* |
|---|
| Footnote | Description | Footnote* | Annualized |
|
|
| Expenses Paid, Amount |
$ 70
|
|
| Expense Ratio, Percent |
1.37%
|
[1] |
| AssetsNet |
$ 29,192,160
|
|
| Holdings Count | Holding |
10
|
|
| Advisory Fees Paid, Amount |
$ 37,705
|
|
| InvestmentCompanyPortfolioTurnover |
206.00%
|
|
| Additional Fund Statistics [Text Block] |
Table SummaryNet Assets | $29,192,160 |
|---|
Number of Portfolio Holdings | 10 |
|---|
Advisory Fee (net of waivers) | $37,705 |
|---|
Portfolio Turnover | 206% |
|---|
|
|
| Holdings [Text Block] |
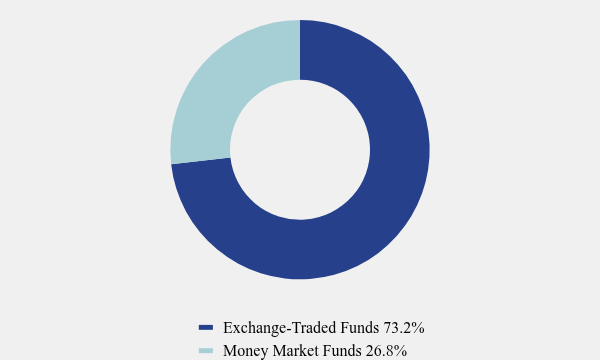
Asset Weighting (% of total investments)Table SummaryValue | Value |
|---|
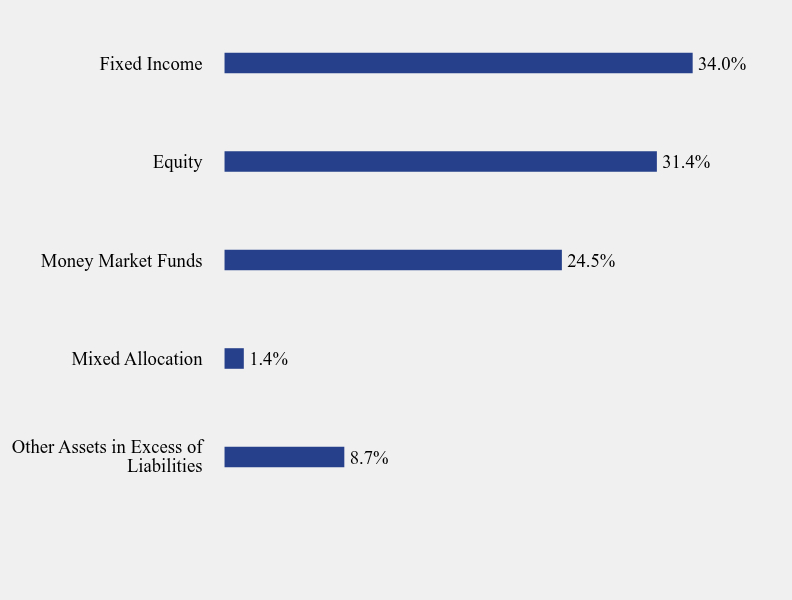
Exchange-Traded Funds | 73.2% | Money Market Funds | 26.8% | Asset Weighting (% of net assets)Table SummaryValue | Value |
|---|
Other Assets in Excess of Liabilities | 8.7% | Mixed Allocation | 1.4% | Money Market Funds | 24.5% | Equity | 31.4% | Fixed Income | 34.0% | Top 10 Holdings (% of net assets)Table SummaryHolding Name | % of Net Assets |
|---|
State Street SPDR Bloomberg 1-3 Month T-Bill ETF | 34.1% |
|---|
First American Government Obligations Fund, Class X | 24.5% |
|---|
Pinnacle Focused Opportunities ETF | 18.3% |
|---|
State Street SPDR S&P 500 ETF Trust | 8.3% |
|---|
First Trust Morningstar Dividend Leaders Index Fund | 1.4% |
|---|
Arrow Dow Jones Global Yield ETF | 1.3% |
|---|
State Street SPDR S&P Oil & Gas Exploration & Production ETF | 1.0% |
|---|
State Street Energy Select Sector SPDR ETF | 0.9% |
|---|
State Street Utilities Select Sector SPDR ETF | 0.9% |
|---|
VanEck Semiconductor ETF | 0.6% |
|---|
|
|
| C000159720 |
|
|
| Shareholder Report [Line Items] |
|
|
| Fund Name |
Pinnacle Multi-Strategy Core Fund
|
|
| Class Name |
Class C
|
|
| Trading Symbol |
CPSHX
|
|
| Annual or Semi-Annual Statement [Text Block] |
This semi-annual shareholder report contains important information about Pinnacle Multi-Strategy Core Fund for the period of October 1, 2025 to March 31, 2026.
|
|
| Additional Information [Text Block] |
You can find additional information about the Fund at pinnacledynamicfunds.com/document-center/. You can also request this information by contacting us at (888) 985-9830.
|
|
| Additional Information Phone Number |
(888) 985-9830
|
|
| Additional Information Website |
pinnacledynamicfunds.com/document-center/
|
|
| Expenses [Text Block] |
What were the Fund’s costs for the last six months?(based on a hypothetical $10,000 investment) Table SummaryClass Name | Costs of a $10,000 investment | Costs paid as a percentage of a $10,000 investment |
|---|
Class C | $109 | 2.12%Footnote Reference* |
|---|
| Footnote | Description | Footnote* | Annualized |
|
|
| Expenses Paid, Amount |
$ 109
|
|
| Expense Ratio, Percent |
2.12%
|
[2] |
| AssetsNet |
$ 29,192,160
|
|
| Holdings Count | Holding |
10
|
|
| Advisory Fees Paid, Amount |
$ 37,705
|
|
| InvestmentCompanyPortfolioTurnover |
206.00%
|
|
| Additional Fund Statistics [Text Block] |
Table SummaryNet Assets | $29,192,160 |
|---|
Number of Portfolio Holdings | 10 |
|---|
Advisory Fee (net of waivers) | $37,705 |
|---|
Portfolio Turnover | 206% |
|---|
|
|
| Holdings [Text Block] |
Asset Weighting (% of total investments)Table SummaryValue | Value |
|---|
Exchange-Traded Funds | 73.2% | Money Market Funds | 26.8% | Asset Weighting (% of net assets)Table SummaryValue | Value |
|---|
Other Assets in Excess of Liabilities | 8.7% | Mixed Allocation | 1.4% | Money Market Funds | 24.5% | Equity | 31.4% | Fixed Income | 34.0% | Top 10 Holdings (% of net assets)Table SummaryHolding Name | % of Net Assets |
|---|
State Street SPDR Bloomberg 1-3 Month T-Bill ETF | 34.1% |
|---|
First American Government Obligations Fund, Class X | 24.5% |
|---|
Pinnacle Focused Opportunities ETF | 18.3% |
|---|
State Street SPDR S&P 500 ETF Trust | 8.3% |
|---|
First Trust Morningstar Dividend Leaders Index Fund | 1.4% |
|---|
Arrow Dow Jones Global Yield ETF | 1.3% |
|---|
State Street SPDR S&P Oil & Gas Exploration & Production ETF | 1.0% |
|---|
State Street Energy Select Sector SPDR ETF | 0.9% |
|---|
State Street Utilities Select Sector SPDR ETF | 0.9% |
|---|
VanEck Semiconductor ETF | 0.6% |
|---|
|
|
| C000159721 |
|
|
| Shareholder Report [Line Items] |
|
|
| Fund Name |
Pinnacle Multi-Strategy Core Fund
|
|
| Class Name |
Class I
|
|
| Trading Symbol |
IPSHX
|
|
| Annual or Semi-Annual Statement [Text Block] |
This semi-annual shareholder report contains important information about Pinnacle Multi-Strategy Core Fund for the period of October 1, 2025 to March 31, 2026.
|
|
| Additional Information [Text Block] |
You can find additional information about the Fund at pinnacledynamicfunds.com/document-center/. You can also request this information by contacting us at (888) 985-9830.
|
|
| Additional Information Phone Number |
(888) 985-9830
|
|
| Additional Information Website |
pinnacledynamicfunds.com/document-center/
|
|
| Expenses [Text Block] |
What were the Fund’s costs for the last six months?(based on a hypothetical $10,000 investment) Table SummaryClass Name | Costs of a $10,000 investment | Costs paid as a percentage of a $10,000 investment |
|---|
Class I | $57 | 1.11%Footnote Reference* |
|---|
| Footnote | Description | Footnote* | Annualized |
|
|
| Expenses Paid, Amount |
$ 57
|
|
| Expense Ratio, Percent |
1.11%
|
[3] |
| AssetsNet |
$ 29,192,160
|
|
| Holdings Count | Holding |
10
|
|
| Advisory Fees Paid, Amount |
$ 37,705
|
|
| InvestmentCompanyPortfolioTurnover |
206.00%
|
|
| Additional Fund Statistics [Text Block] |
Table SummaryNet Assets | $29,192,160 |
|---|
Number of Portfolio Holdings | 10 |
|---|
Advisory Fee (net of waivers) | $37,705 |
|---|
Portfolio Turnover | 206% |
|---|
|
|
| Holdings [Text Block] |
Asset Weighting (% of total investments)Table SummaryValue | Value |
|---|
Exchange-Traded Funds | 73.2% | Money Market Funds | 26.8% | Asset Weighting (% of net assets)Table SummaryValue | Value |
|---|
Other Assets in Excess of Liabilities | 8.7% | Mixed Allocation | 1.4% | Money Market Funds | 24.5% | Equity | 31.4% | Fixed Income | 34.0% | Top 10 Holdings (% of net assets)Table SummaryHolding Name | % of Net
Assets |
|---|
State Street SPDR Bloomberg 1-3 Month T-Bill ETF | 34.1% |
|---|
First American Government Obligations Fund, Class X | 24.5% |
|---|
Pinnacle Focused Opportunities ETF | 18.3% |
|---|
State Street SPDR S&P 500 ETF Trust | 8.3% |
|---|
First Trust Morningstar Dividend Leaders Index Fund | 1.4% |
|---|
Arrow Dow Jones Global Yield ETF | 1.3% |
|---|
State Street SPDR S&P Oil & Gas Exploration & Production ETF | 1.0% |
|---|
State Street Energy Select Sector SPDR ETF | 0.9% |
|---|
State Street Utilities Select Sector SPDR ETF | 0.9% |
|---|
VanEck Semiconductor ETF | 0.6% |
|---|
|
|
|
|