Shareholder Report
Mar. 31, 2026
USD ($)
Holding
This report describes changes to the Fund that occurred during the reporting period.
Fund Expenses
(Based on a hypothetical $10,000 investment)
| Fund (Class) | Costs of a $10,000 investment | Costs paid as a percentage of a $10,000 investment |
| Astoria Real Assets ETF (PPI) |
$71 | 0.58% |
Management's Discussion of Fund Performance
SUMMARY OF RESULTS
The Astoria Real Assets ETF (PPI) returned 44.86% during the 1-year period ending 3/31/2026, while its benchmark (70% MSCI All Country World Index, 20% Bloomberg Commodity Index, and 10% Bloomberg US TIPS 1-3 Year) Index returned 21.11%. The ETF was incepted on 12/29/2021 and is an actively managed strategy.
Equities positively contributed to the lion's share of the ETF's return, while commodities also notably contributed to the ETF's performance. Our fixed income positions marginally contributed to the ETF's return.
Equities
The largest contributors were Vertiv Holdings Co. Class A, Rolls-Royce Holdings plc, and AngloGold Ashanti PLC, which added 2.52%, 2.36%, and 2.06%, respectively, to the Fund's performance.
The largest detractors were Siemens Energy AG, VICI Properties Inc, and Occidental Petroleum Corporation, which subtracted 0.34%, 0.28%, and 0.27%, respectively, from the ETF's return.
Commodities
The SPDR Gold MiniShares Trust (GLDM) contributed 3.97% to the Fund's performance, while the Aberdeen Physical Silver Shares ETF (SIVR) and the Aberdeen Physical Precious Metals Basket Shares ETF (GLTR) increased the ETF's return by 1.59% and 0.34%, respectively.
Fixed Income
TIPS (Treasury Inflation-Protected Securities) also positively contributed to the Fund's performance as the Schwab US TIPS ETF (SCHP), iShares 0-5 Year TIPS Bond ETF (STIP), and the F/m Ultrashort Treasury Inflation-Protected Security ETF (RBIL) added 0.13%, 0.10%, and 0.03%, respectively.
Fund Performance
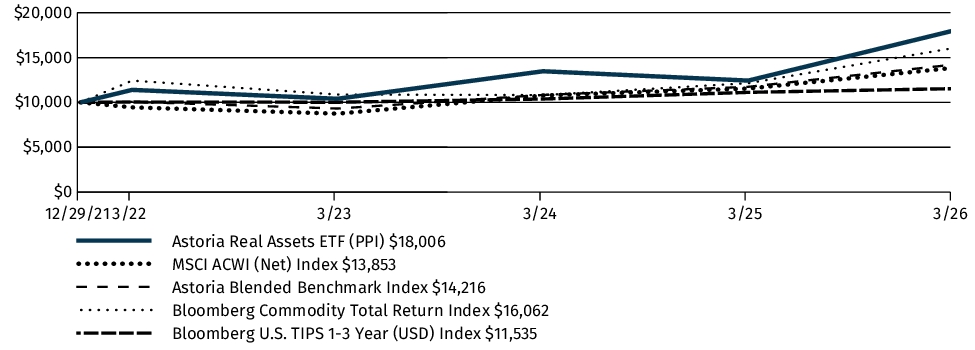
The following graph and chart compare the initial and subsequent account values at the end of each of the most recently completed 10 fiscal years of the Fund or for the life of the Fund, if shorter. It assumes a $10,000 initial investment at the beginning of the first fiscal year in an appropriate, broad-based securities market index for the same period.
GROWTH OF $10,000
| AVERAGE ANNUAL TOTAL RETURN | 1 Year | Since Inception1 |
| Astoria Real Assets ETF (PPI) | 44.86% | 14.83% |
| MSCI ACWI (Net) Index | 20.01% | 7.97% |
| Astoria Blended Benchmark Index | 21.11% | 8.62% |
| Bloomberg Commodity Total Return Index | 32.29% | 11.79% |
| Bloomberg U.S. TIPS 1-3 Year (USD) Index | 3.72% | 3.41% |
|
1
|
The Fund commenced operations on December 29, 2021. Since Inception return is cumulative if time since inception is less than one year.
|
The graph and table do not reflect the deduction of taxes that a shareholder would pay on Fund distributions or redemption of Fund shares.
Visit www.axsinvestments.com/ppi/#performance-section for the most recent performance information.
Key Fund Statistics
The following table outlines key fund statistics that you should pay attention to.
| Fund net assets | $140,461,659 |
| Total number of portfolio holdings | 81 |
| Total advisory fees paid (net) | $433,629 |
| Portfolio turnover rate as of the end of the reporting period | 115% |
Graphical Representation of Holdings
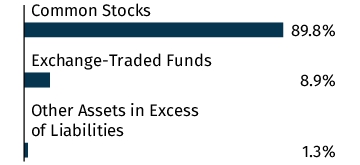
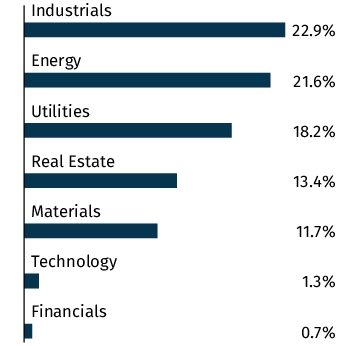
The tables below show the investment makeup of the Fund, representing percentage of the total net assets of the Fund. The Top Ten Holdings and Sector Allocation exclude short-term holdings, if any. The Sector Allocation chart represents Common Stocks of the Fund.
Top Ten Holdings
| SPDR Gold MiniShares Trust | 7.0% |
| Shell PLC - ADR | 3.0% |
| Exxon Mobil Corp. | 2.7% |
| Engie S.A. | 2.6% |
| GE Vernova, Inc. | 2.5% |
| E.ON S.E. | 2.2% |
| Lockheed Martin Corp. | 2.2% |
| ABB Ltd. | 2.0% |
| Siemens Energy A.G. | 1.9% |
| Simon Property Group, Inc. | 1.9% |
Asset Allocation
Sector Allocation
Top Ten Holdings
| SPDR Gold MiniShares Trust | 7.0% |
| Shell PLC - ADR | 3.0% |
| Exxon Mobil Corp. | 2.7% |
| Engie S.A. | 2.6% |
| GE Vernova, Inc. | 2.5% |
| E.ON S.E. | 2.2% |
| Lockheed Martin Corp. | 2.2% |
| ABB Ltd. | 2.0% |
| Siemens Energy A.G. | 1.9% |
| Simon Property Group, Inc. | 1.9% |
Material Fund Changes
Effective July 1, 2025, the Advisor reduced its management fee from 0.70% to 0.55%.
This is summary of changes to the Fund since April 1, 2025. For more complete information, you may review the Fund's prospectus, which is dated July 31, 2025 as amended December 10, 2025 at www.axsinvestments.com/ppi/#literature.
Changes in and Disagreements with Accountants
There were no changes in or disagreements with the Fund's accountants during the reporting period.
Fund Expenses
(Based on a hypothetical $10,000 investment)
| Fund (Class) | Costs of a $10,000 investment | Costs paid as a percentage of a $10,000 investment |
| AXS Green Alpha ETF (NXTE) |
$116 | 1.00% |
Management's Discussion of Fund Performance
SUMMARY OF RESULTS
For the 12-month period ending March 31, 2026, the AXS Green Alpha ETF (NXTE) generated a total return of 31.96%. The Fund primarily invested in common stocks and American Depository Receipts ("ADRs").
TOP PERFORMANCE CONTRIBUTORS
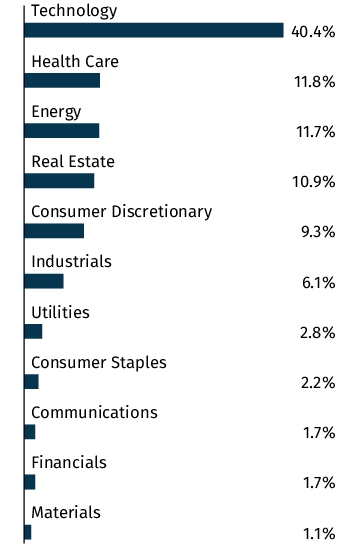
Technology | Technology companies represented the most significant sector weighting during the period, and the Fund's selections in this sector contributed positively with a 22.78% contribution to Fund returns. These holdings had a total return of 75.43%.
Energy | The Fund's holdings in the Energy sector were the second largest contributor to performance during the period, adding 6.43% to Fund returns. Companies in this sector demonstrated strong performance with a total return of 97.94%.
Taiwan Semiconductor Manufacturing Company Ltd (ADR) | The Fund's position in Taiwan Semiconductor (Technology sector) provided the most significant individual contribution to NXTE's performance over the 1-year period, contributing 7.41% to Fund returns, on a total return of 106.06%.
TOP PERFORMANCE DETRACTORS
Real Estate | The Fund's exposure to Real Estate companies was the largest detractor from performance, negatively impacting Fund returns by -4.08%. Real Estate sector holdings experienced macro headwinds, resulting in a total return of -25.43%R.
Consumer Staples | Investments in the Consumer Staples sector detracted -1.85% from the Fund's returns. These holdings faced headwinds from market volatility and sector-specific challenges, generating a total return of -45.80%.
Hudson Pacific Properties Inc. | The Fund's position in Hudson Pacific Properties provided the worst individual contribution to NXTE's performance over the 1-year period detracting -2.98%, on a total return of -71.38%.
Data as of 3/31/2026, Bloomberg Finance LP.
Fund Performance
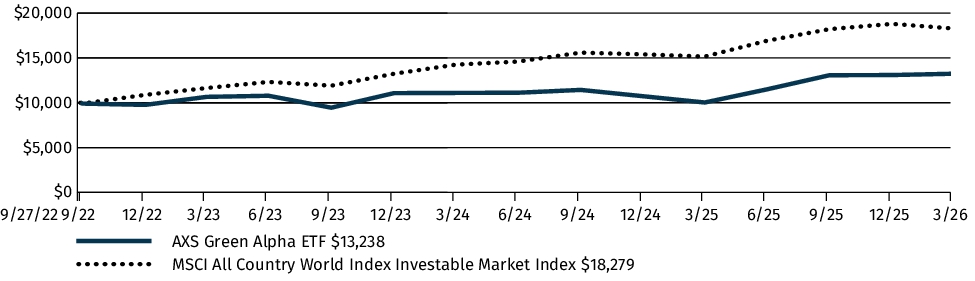
The following graph and chart compare the initial and subsequent account values at the end of each of the most recently completed 10 fiscal years of the Fund or for the life of the Fund, if shorter. It assumes a $10,000 initial investment at the beginning of the first fiscal year in an appropriate, broad-based securities market index for the same period.
GROWTH OF $10,000
| AVERAGE ANNUAL TOTAL RETURN | 1 Year | Since Inception1 |
| AXS Green Alpha ETF (NXTE) | 31.96% | 8.33% |
| MSCI All Country World Index Investable Market Index | 20.64% | 18.77% |
|
1
|
The Fund commenced operations on September 27, 2022. Since Inception return is cumulative if time since inception is less than one year.
|
The graph and table do not reflect the deduction of taxes that a shareholder would pay on Fund distributions or redemption of Fund shares.
Visit www.axsinvestments.com/nxte-data/ for the most recent performance information.
Key Fund Statistics
The following table outlines key fund statistics that you should pay attention to.
| Fund net assets | $43,235,720 |
| Total number of portfolio holdings | 53 |
| Total advisory fees paid (net) | $434,635 |
| Portfolio turnover rate as of the end of the reporting period | 12% |
Graphical Representation of Holdings
The tables below show the investment makeup of the Fund, representing percentage of the total net assets of the Fund. The Top Ten Holdings and Sector Allocation exclude short-term holdings, if any. The Sector Allocation chart represents Common Stocks of the Fund.
Top Ten Holdings
| Taiwan Semiconductor Manufacturing Co., Ltd. - ADR | 11.2% |
| ASML Holding N.V. | 5.8% |
| SK hynix, Inc. | 5.3% |
| Contemporary Amperex Technology Co., Ltd. - Class A | 5.0% |
| International Business Machines Corp. | 4.9% |
| Vestas Wind Systems A/S | 4.5% |
| Applied Materials, Inc. | 3.7% |
| Lam Research Corp. | 3.7% |
| CRISPR Therapeutics A.G. | 3.4% |
| Nextpower, Inc. - Class A | 3.2% |
Asset Allocation
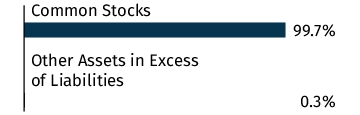
Sector Allocation
Top Ten Holdings
| Taiwan Semiconductor Manufacturing Co., Ltd. - ADR | 11.2% |
| ASML Holding N.V. | 5.8% |
| SK hynix, Inc. | 5.3% |
| Contemporary Amperex Technology Co., Ltd. - Class A | 5.0% |
| International Business Machines Corp. | 4.9% |
| Vestas Wind Systems A/S | 4.5% |
| Applied Materials, Inc. | 3.7% |
| Lam Research Corp. | 3.7% |
| CRISPR Therapeutics A.G. | 3.4% |
| Nextpower, Inc. - Class A | 3.2% |
Material Fund Changes
The Fund did not have any material changes that occurred since the beginning of the reporting period.
Changes in and Disagreements with Accountants
There were no changes in or disagreements with the Fund's accountants during the reporting period.
Fund Expenses
(Based on a hypothetical $10,000 investment)
| Fund (Class) | Costs of a $10,000 investment | Costs paid as a percentage of a $10,000 investment |
| AXS Esoterica NextG Economy ETF (WUGI) |
$87 | 0.78% |
Management's Discussion of Fund Performance
SUMMARY OF RESULTS
For the 12-month period ended March 31, 2026, the Fund had positive performance (+22.44%). The Fund primarily invested in the technology sector such as semiconductors, software and Internet, etc.
TOP PERFORMANCE CONTRIBUTORS
Contributor #1: TSMC , contributed 7.78%. The company benefited from strong demand as AI development has been taking shape globally.
Contributor #2: Broadcom, contributed 5.53%. The company benefited from strong demand of AI Compute.
Contributor #3:Nvidia, contributed 4.78%. The company benefited from strong demand of AI Compute.
TOP PERFORMANCE DETRACTORS
Detractor #1: Meituan, detracted 1.12%. Suffered from renewed competition in the local services in China.
Detractor #2: Cadence Design System, detracted 0.78%. The company was negatively impacted by the trade war between China and the U.S. and the technology control.
Detractor #3: Robinhood Markets, detracted 0.67%. Suffered from demand loss due to weakness of crypto markets.
Fund Performance
The following graph and chart compare the initial and subsequent account values at the end of each of the most recently completed 10 fiscal years of the Fund or for the life of the Fund, if shorter. It assumes a $10,000 initial investment at the beginning of the first fiscal year in an appropriate, broad-based securities market index for the same period.
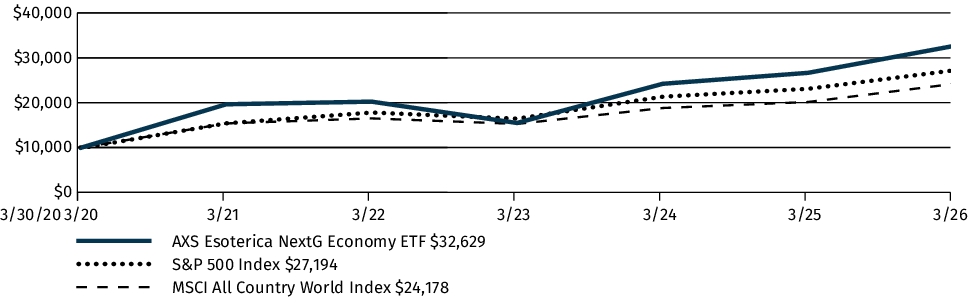
GROWTH OF $10,000
| AVERAGE ANNUAL TOTAL RETURN | 1 Year | 5 Years | Since Inception1 |
| AXS Esoterica NextG Economy ETF (WUGI) | 22.44% | 10.69% | 21.78% |
| S&P 500 Index | 17.80% | 12.06% | 18.14% |
| MSCI All Country World Index | 20.01% | 9.49% | 15.84% |
|
1
|
The Fund commenced operations on March 30, 2020. Since Inception return is cumulative if time since inception is less than one year.
|
The graph and table do not reflect the deduction of taxes that a shareholder would pay on Fund distributions or redemption of Fund shares.
Visit www.axsinvestments.com/wugi-data/ for the most recent performance information.
Key Fund Statistics
The following table outlines key fund statistics that you should pay attention to.
| Fund net assets | $26,248,330 |
| Total number of portfolio holdings | 31 |
| Total advisory fees paid (net) | $42,913 |
| Portfolio turnover rate as of the end of the reporting period | 48% |
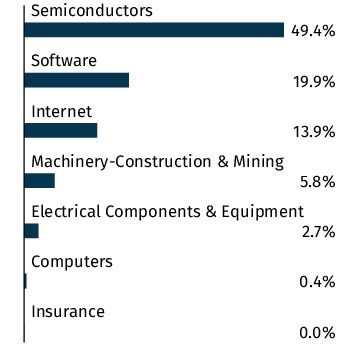
Graphical Representation of Holdings
The tables below show the investment makeup of the Fund, representing percentage of the total net assets of the Fund. The Top Ten Holdings and Industry Allocation exclude short-term holdings, if any. The Industry Allocation chart represents Common Stocks of the Fund.
Top Ten Holdings
| NVIDIA Corp. | 18.2% |
| Taiwan Semiconductor Manufacturing Co., Ltd. - ADR | 15.7% |
| Broadcom, Inc. | 8.7% |
| Synopsys, Inc. | 6.2% |
| Meta Platforms, Inc. - Class A | 4.8% |
| Amazon.com, Inc. | 3.7% |
| Cadence Design Systems, Inc. | 3.3% |
| Siemens Energy A.G. | 3.0% |
| Snowflake, Inc. - Class A | 2.9% |
| KraneShares CSI China Internet ETF | 2.9% |
Asset Allocation
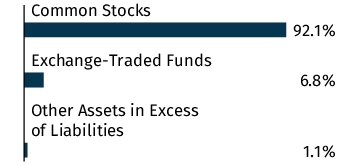
Industry Allocation
Top Ten Holdings
| NVIDIA Corp. | 18.2% |
| Taiwan Semiconductor Manufacturing Co., Ltd. - ADR | 15.7% |
| Broadcom, Inc. | 8.7% |
| Synopsys, Inc. | 6.2% |
| Meta Platforms, Inc. - Class A | 4.8% |
| Amazon.com, Inc. | 3.7% |
| Cadence Design Systems, Inc. | 3.3% |
| Siemens Energy A.G. | 3.0% |
| Snowflake, Inc. - Class A | 2.9% |
| KraneShares CSI China Internet ETF | 2.9% |
Material Fund Changes
The Fund did not have any material changes that occurred since the beginning of the reporting period.
Changes in and Disagreements with Accountants
There were no changes in or disagreements with the Fund's accountants during the reporting period.
Fund Expenses
(Based on a hypothetical $10,000 investment)
| Fund (Class) | Costs of a $10,000 investment | Costs paid as a percentage of a $10,000 investment |
| AXS Knowledge Leaders ETF (KNO) |
$82 | 0.75% |
Management's Discussion of Fund Performance
SUMMARY OF RESULTS
Over the last year, the AXS Knowledge Leaders ETF was up 17.77% based on NAV return. The fund invests primarily in mid-large cap stocks in Developed World.
TOP PERFORMANCE CONTRIBUTORS
The top contributors to performance for the year were:
1) Micron Technology (35.4% of the gains)
2) TE Connectivity (7.1% of the gains)
3) Suncor Energy (5.5% of the gains)
TOP PERFORMANCE DETRACTORS
The top detractors for performance for the year were:
1) Boston Scientific Corp (21.5% of the losses)
2) Constellation Software (14.4% of the losses)
3) SAP SE (10.1% of the losses)
Asset Allocation Contributions
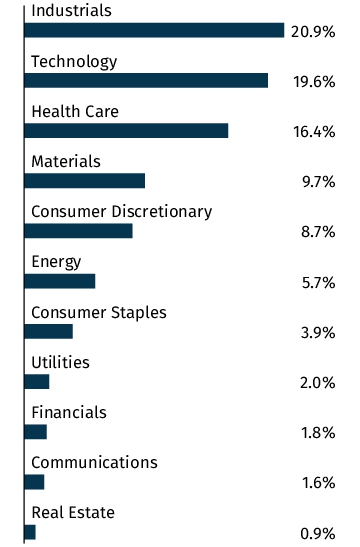
From an asset allocation perspective, the following sectors contributed the most positively to performance: 1) Technology (26.9% of the gains), 2) Industrial (26.3% of the gains) and 3) Energy (9.7% of the gains). The following sectors subtracted the most from performance: 1) Consumer Staples (13.7% of the losses), 2) Consumer Discretionary (9.4% of the losses) and 3) Communications (4.7% of the losses).
From a country perspective, the biggest contributors were: 1) United States (25.0% of the gains), 2) Japan (16.0% of the gains) and 3) Ireland (15.5% of the gains). The biggest detractors were: 1) Germany (7.4% of the losses), 2) Australia (3.7% of the losses) and 3) Netherlands (2.4% of the losses).
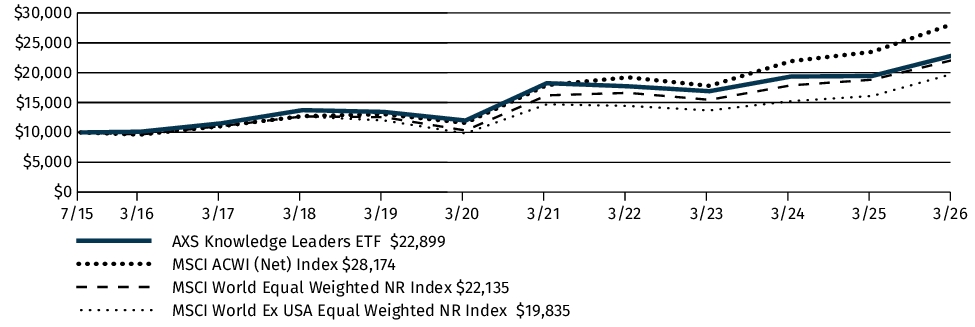
Fund Performance
The following graph and chart compare the initial and subsequent account values at the end of each of the most recently completed 10 fiscal years of the Fund or for the life of the Fund, if shorter. It assumes a $10,000 initial investment at the beginning of the first fiscal year in an appropriate, broad-based securities market index for the same period.
GROWTH OF $10,000
| AVERAGE ANNUAL TOTAL RETURN | 1 Year | 5 Years | 10 Years |
| AXS Knowledge Leaders ETF (KNO) | 17.77% | 4.66% | 8.51% |
| MSCI ACWI (Net) Index | 20.01% | 9.49% | 11.33% |
| MSCI World Equal Weighted NR Index | 17.63% | 6.44% | 8.66% |
| MSCI World Ex USA Equal Weighted NR Index | 23.21% | 6.17% | 7.47% |
The graph and table do not reflect the deduction of taxes that a shareholder would pay on Fund distributions or redemption of Fund shares.
Visit www.axsinvestments.com/kno-data/for the most recent performance information.
Key Fund Statistics
The following table outlines key fund statistics that you should pay attention to.
| Fund net assets | $37,385,081 |
| Total number of portfolio holdings | 65 |
| Total advisory fees paid (net) | $305,222 |
| Portfolio turnover rate as of the end of the reporting period | 0% |
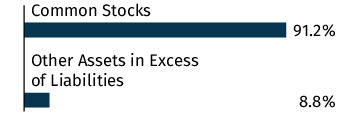
Graphical Representation of Holdings
The tables below show the investment makeup of the Fund, representing percentage of the total net assets of the Fund. The Top Ten Holdings and Sector Allocation exclude short-term holdings, if any. The Sector Allocation chart represents Common Stocks of the Fund.
Top Ten Holdings
| Micron Technology, Inc. | 8.6% |
| TE Connectivity PLC | 3.7% |
| Trane Technologies PLC | 3.1% |
| Garmin Ltd. | 2.9% |
| Labcorp Holdings, Inc. | 2.6% |
| Suncor Energy, Inc. | 2.6% |
| Stryker Corp. | 2.3% |
| CNH Industrial N.V. | 2.1% |
| GE HealthCare Technologies, Inc. | 2.0% |
| Kyocera Corp. | 1.9% |
Asset Allocation
Sector Allocation
Top Ten Holdings
| Micron Technology, Inc. | 8.6% |
| TE Connectivity PLC | 3.7% |
| Trane Technologies PLC | 3.1% |
| Garmin Ltd. | 2.9% |
| Labcorp Holdings, Inc. | 2.6% |
| Suncor Energy, Inc. | 2.6% |
| Stryker Corp. | 2.3% |
| CNH Industrial N.V. | 2.1% |
| GE HealthCare Technologies, Inc. | 2.0% |
| Kyocera Corp. | 1.9% |
Material Fund Changes
The Fund did not have any material changes that occurred since the beginning of the reporting period.
Changes in and Disagreements with Accountants
There were no changes in or disagreements with the Fund's accountants during the reporting period.