Shareholder Report
Mar. 31, 2026
USD ($)
Holding
Fund Expenses
(Based on a hypothetical $10,000 investment)
| Fund (Ticker) | Costs of a $10,000 investment | Costs paid as a percentage of a $10,000 investment |
||
| AXS FTSE Venture Capital Return Tracker Fund (Class I/LDVIX) |
$64 | 1.50%1 |
|
1
|
Annualized.
|
Key Fund Statistics
The following table outlines key fund statistics that you should pay attention to.
| Fund net assets | $71,152,726 |
| Total number of portfolio holdings | 145 |
| Portfolio turnover rate as of the end of the reporting period | 17% |
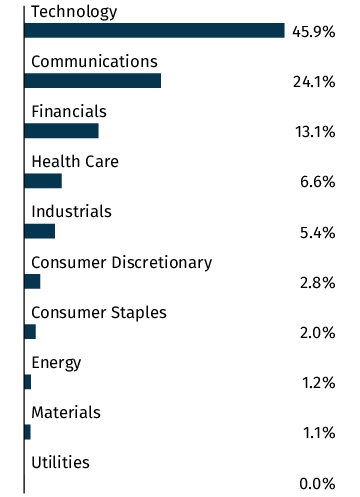
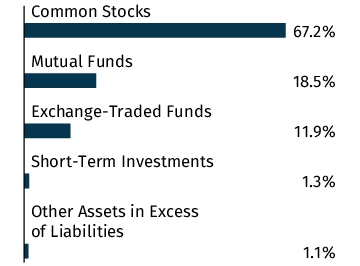
Graphical Representation of Holdings
The tables below show the investment makeup of the Fund, representing percentage of the total net assets of the Fund. The Top Ten Holdings and Sector Allocation exclude short-term holdings, if any. The Sector Allocation chart represents Common Stocks of the Fund.
Top Ten Holdings
| Palantir Technologies, Inc. - Class A | 5.1% |
| Netflix, Inc. | 4.8% |
| Mastercard, Inc. - Class A | 4.6% |
| Oracle Corp. | 4.6% |
| Microsoft Corp. | 4.5% |
| Alphabet, Inc. - Class A | 4.5% |
| Meta Platforms, Inc. - Class A | 4.2% |
| International Business Machines Corp. | 3.8% |
| Salesforce, Inc. | 3.1% |
| Uber Technologies, Inc. | 2.6% |
Asset Allocation

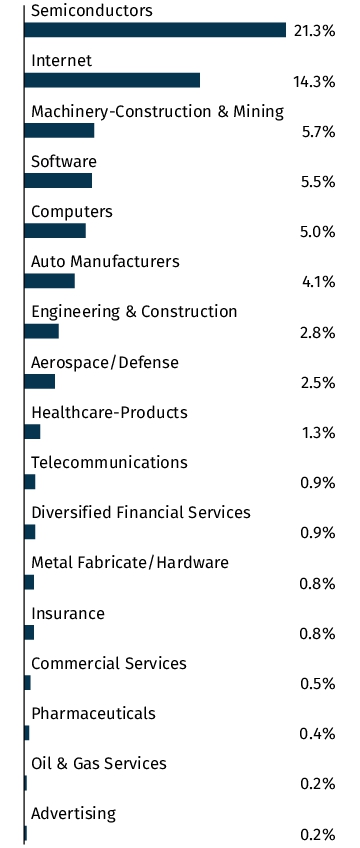
Sector Allocation
Top Ten Holdings
| Palantir Technologies, Inc. - Class A | 5.1% |
| Netflix, Inc. | 4.8% |
| Mastercard, Inc. - Class A | 4.6% |
| Oracle Corp. | 4.6% |
| Microsoft Corp. | 4.5% |
| Alphabet, Inc. - Class A | 4.5% |
| Meta Platforms, Inc. - Class A | 4.2% |
| International Business Machines Corp. | 3.8% |
| Salesforce, Inc. | 3.1% |
| Uber Technologies, Inc. | 2.6% |
Changes in and Disagreements with Accountants
There were no changes in or disagreements with the Fund's accountants during the reporting period.
Fund Expenses
(Based on a hypothetical $10,000 investment)
| Fund (Ticker) | Costs of a $10,000 investment | Costs paid as a percentage of a $10,000 investment |
||
| AXS FTSE Venture Capital Return Tracker Fund (Class C/LDVCX) |
$107 | 2.50%1 |
|
1
|
Annualized.
|
Key Fund Statistics
The following table outlines key fund statistics that you should pay attention to.
| Fund net assets | $71,152,726 |
| Total number of portfolio holdings | 145 |
| Portfolio turnover rate as of the end of the reporting period | 17% |
Graphical Representation of Holdings
The tables below show the investment makeup of the Fund, representing percentage of the total net assets of the Fund. The Top Ten Holdings and Sector Allocation exclude short-term holdings, if any. The Sector Allocation chart represents Common Stocks of the Fund.
Top Ten Holdings
| Palantir Technologies, Inc. - Class A | 5.1% |
| Netflix, Inc. | 4.8% |
| Mastercard, Inc. - Class A | 4.6% |
| Oracle Corp. | 4.6% |
| Microsoft Corp. | 4.5% |
| Alphabet, Inc. - Class A | 4.5% |
| Meta Platforms, Inc. - Class A | 4.2% |
| International Business Machines Corp. | 3.8% |
| Salesforce, Inc. | 3.1% |
| Uber Technologies, Inc. | 2.6% |
Asset Allocation
Sector Allocation

Top Ten Holdings
| Palantir Technologies, Inc. - Class A | 5.1% |
| Netflix, Inc. | 4.8% |
| Mastercard, Inc. - Class A | 4.6% |
| Oracle Corp. | 4.6% |
| Microsoft Corp. | 4.5% |
| Alphabet, Inc. - Class A | 4.5% |
| Meta Platforms, Inc. - Class A | 4.2% |
| International Business Machines Corp. | 3.8% |
| Salesforce, Inc. | 3.1% |
| Uber Technologies, Inc. | 2.6% |
Changes in and Disagreements with Accountants
There were no changes in or disagreements with the Fund's accountants during the reporting period.
Fund Expenses
(Based on a hypothetical $10,000 investment)
| Fund (Ticker) | Costs of a $10,000 investment | Costs paid as a percentage of a $10,000 investment |
||
| AXS FTSE Venture Capital Return Tracker Fund (Class A/LDVAX) |
$75 | 1.75%1 |
|
1
|
Annualized.
|
Key Fund Statistics
The following table outlines key fund statistics that you should pay attention to.
| Fund net assets | $71,152,726 |
| Total number of portfolio holdings | 145 |
| Portfolio turnover rate as of the end of the reporting period | 17% |
Graphical Representation of Holdings
The tables below show the investment makeup of the Fund, representing percentage of the total net assets of the Fund. The Top Ten Holdings and Sector Allocation exclude short-term holdings, if any. The Sector Allocation chart represents Common Stocks of the Fund.
Top Ten Holdings
| Palantir Technologies, Inc. - Class A | 5.1% |
| Netflix, Inc. | 4.8% |
| Mastercard, Inc. - Class A | 4.6% |
| Oracle Corp. | 4.6% |
| Microsoft Corp. | 4.5% |
| Alphabet, Inc. - Class A | 4.5% |
| Meta Platforms, Inc. - Class A | 4.2% |
| International Business Machines Corp. | 3.8% |
| Salesforce, Inc. | 3.1% |
| Uber Technologies, Inc. | 2.6% |
Asset Allocation

Sector Allocation

Top Ten Holdings
| Palantir Technologies, Inc. - Class A | 5.1% |
| Netflix, Inc. | 4.8% |
| Mastercard, Inc. - Class A | 4.6% |
| Oracle Corp. | 4.6% |
| Microsoft Corp. | 4.5% |
| Alphabet, Inc. - Class A | 4.5% |
| Meta Platforms, Inc. - Class A | 4.2% |
| International Business Machines Corp. | 3.8% |
| Salesforce, Inc. | 3.1% |
| Uber Technologies, Inc. | 2.6% |
Changes in and Disagreements with Accountants
There were no changes in or disagreements with the Fund's accountants during the reporting period.
This report describes changes to the Fund that occurred during the reporting period.
Fund Expenses
(Based on a hypothetical $10,000 investment)
| Fund (Ticker) | Costs of a $10,000 investment | Costs paid as a percentage of a $10,000 investment | ||
| AXS Income Opportunities Fund (Class D/OIODX) |
$129 | 2.58%1 |
|
1 |
Annualized. |
Key Fund Statistics
The following table outlines key fund statistics that you should pay attention to.
| Fund net assets | $14,916,574 |
| Total number of portfolio holdings | 8 |
| Portfolio turnover rate as of the end of the reporting period | 14% |
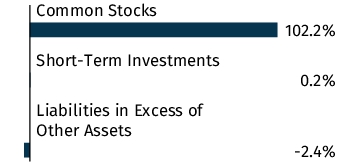
Graphical Representation of Holdings
The tables below show the investment makeup of the Fund, representing percentage of the total net assets of the Fund. The Top Ten Holdings exclude short-term holdings, if any.
Top Ten Holdings
| iShares Residential and Multisector Real Estate ETF | 26.7% |
| iShares Core U.S. REIT ETF | 26.3% |
| State Street SPDR Bloomberg Convertible Securities ETF | 12.0% |
| VanEck Mortgage REIT Income ETF | 10.9% |
| Principal Spectrum Preferred Securities Active ETF | 9.3% |
| Janus Henderson AAA CLO ETF | 9.1% |
| Virtus InfraCap U.S. Preferred Stock ETF | 4.9% |
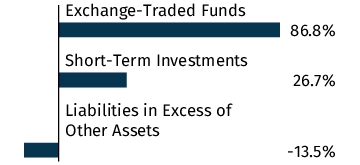
Asset Allocation
Top Ten Holdings
| iShares Residential and Multisector Real Estate ETF | 26.7% |
| iShares Core U.S. REIT ETF | 26.3% |
| State Street SPDR Bloomberg Convertible Securities ETF | 12.0% |
| VanEck Mortgage REIT Income ETF | 10.9% |
| Principal Spectrum Preferred Securities Active ETF | 9.3% |
| Janus Henderson AAA CLO ETF | 9.1% |
| Virtus InfraCap U.S. Preferred Stock ETF | 4.9% |
Material Fund Changes
On March 10, 2026, the Fund’s Board of Trustees of the Trust approved a Plan of Liquidation for the Fund and the Fund liquidated on April 17, 2026.
This is a summary of certain planned changes to the Fund since the beginning of the reporting period. For more complete information, you may review the Fund's prospectus at www.axsinvestments.com/oioix/#fundliterature.
This is a summary of certain planned changes to the Fund since the beginning of the reporting period. For more complete information, you may review the Fund's prospectus at www.axsinvestments.com/oioix/#fundliterature.
Changes in and Disagreements with Accountants
There were no changes in or disagreements with the Fund's accountants during the reporting period.
This report describes changes to the Fund that occurred during the reporting period.
Fund Expenses
(Based on a hypothetical $10,000 investment)
| Fund (Ticker) | Costs of a $10,000 investment | Costs paid as a percentage of a $10,000 investment | ||
| AXS Income Opportunities Fund (Class I/OIOIX) |
$79 | 1.58%1 |
|
1 |
Annualized. |
Key Fund Statistics
The following table outlines key fund statistics that you should pay attention to.
| Fund net assets | $14,916,574 |
| Total number of portfolio holdings | 8 |
| Portfolio turnover rate as of the end of the reporting period | 14% |
Graphical Representation of Holdings
The tables below show the investment makeup of the Fund, representing percentage of the total net assets of the Fund. The Top Ten Holdings exclude short-term holdings, if any.
Top Ten Holdings
| iShares Residential and Multisector Real Estate ETF | 26.7% |
| iShares Core U.S. REIT ETF | 26.3% |
| State Street SPDR Bloomberg Convertible Securities ETF | 12.0% |
| VanEck Mortgage REIT Income ETF | 10.9% |
| Principal Spectrum Preferred Securities Active ETF | 9.3% |
| Janus Henderson AAA CLO ETF | 9.1% |
| Virtus InfraCap U.S. Preferred Stock ETF | 4.9% |
Asset Allocation

Top Ten Holdings
| iShares Residential and Multisector Real Estate ETF | 26.7% |
| iShares Core U.S. REIT ETF | 26.3% |
| State Street SPDR Bloomberg Convertible Securities ETF | 12.0% |
| VanEck Mortgage REIT Income ETF | 10.9% |
| Principal Spectrum Preferred Securities Active ETF | 9.3% |
| Janus Henderson AAA CLO ETF | 9.1% |
| Virtus InfraCap U.S. Preferred Stock ETF | 4.9% |
Material Fund Changes
On March 10, 2026, the Fund’s Board of Trustees of the Trust approved a Plan of Liquidation for the Fund and the Fund liquidated on April 17, 2026.
This is a summary of certain planned changes to the Fund since the beginning of the reporting period. For more complete information, you may review the Fund's prospectus at www.axsinvestments.com/oioix/#fundliterature.
This is a summary of certain planned changes to the Fund since the beginning of the reporting period. For more complete information, you may review the Fund's prospectus at www.axsinvestments.com/oioix/#fundliterature.
Changes in and Disagreements with Accountants
There were no changes in or disagreements with the Fund's accountants during the reporting period.
Fund Expenses
(Based on a hypothetical $10,000 investment)
| Fund (Ticker) | Costs of a $10,000 investment | Costs paid as a percentage of a $10,000 investment | ||
| AXS Adaptive Plus Fund (Class I/AXSPX) |
$100 | 1.99%1 |
|
1 |
Annualized. |
Key Fund Statistics
The following table outlines key fund statistics that you should pay attention to.
| Fund net assets | $31,296,579 |
| Total number of portfolio holdings | 4 |
| Portfolio turnover rate as of the end of the reporting period | 0% |
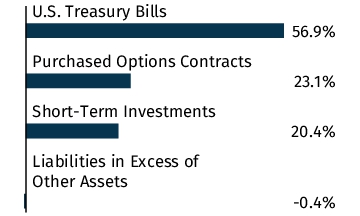
Graphical Representation of Holdings
The tables below show the investment makeup of the Fund, representing percentage of the total net assets of the Fund. The Top Ten Holdings exclude short-term holdings, if any.
Top Ten Holdings
| United States Treasury Bill, 8/6/2026 | 31.5% |
| United States Treasury Bill, 6/4/2026 | 25.4% |
| Nomura Galaxy Option-ProfitScore Regime-Adaptive Equity Index, 6/16/2026 | 23.1% |
Asset Allocation
Top Ten Holdings
| United States Treasury Bill, 8/6/2026 | 31.5% |
| United States Treasury Bill, 6/4/2026 | 25.4% |
| Nomura Galaxy Option-ProfitScore Regime-Adaptive Equity Index, 6/16/2026 | 23.1% |
Changes in and Disagreements with Accountants
There were no changes in or disagreements with the Fund's accountants during the reporting period.
Fund Expenses
(Based on a hypothetical $10,000 investment)
| Fund (Ticker) | Costs of a $10,000 investment | Costs paid as a percentage of a $10,000 investment |
||
| AXS Dynamic Opportunity Fund (Class I/ADOIX) |
$77 | 1.57%1 |
|
1
|
Annualized.
|
Key Fund Statistics
The following table outlines key fund statistics that you should pay attention to.
| Fund net assets | $54,483,522 |
| Total number of portfolio holdings | 41 |
| Portfolio turnover rate as of the end of the reporting period | 11% |
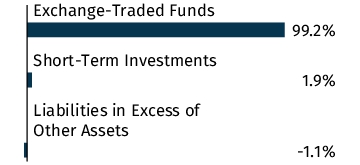
Graphical Representation of Holdings
The tables below show the investment makeup of the Fund, representing percentage of the total net assets of the Fund. The Top Ten Holdings and Industry Allocation exclude short-term holdings, if any. The Industry Allocation chart represents Common Stocks of the Fund.
Top Ten Holdings
| AXS Adaptive Plus Fund - Class I | 18.5% |
| NVIDIA Corp. | 6.4% |
| ProShares UltraPro Short QQQ | 6.3% |
| Vertiv Holdings Co. - Class A | 5.7% |
| Apple, Inc. | 4.7% |
| Tesla, Inc. | 4.1% |
| Palantir Technologies, Inc. - Class A | 4.0% |
| ASML Holding N.V. | 3.7% |
| Amazon.com, Inc. | 3.3% |
| Broadcom, Inc. | 3.2% |
Asset Allocation
Industry Allocation
Top Ten Holdings
| AXS Adaptive Plus Fund - Class I | 18.5% |
| NVIDIA Corp. | 6.4% |
| ProShares UltraPro Short QQQ | 6.3% |
| Vertiv Holdings Co. - Class A | 5.7% |
| Apple, Inc. | 4.7% |
| Tesla, Inc. | 4.1% |
| Palantir Technologies, Inc. - Class A | 4.0% |
| ASML Holding N.V. | 3.7% |
| Amazon.com, Inc. | 3.3% |
| Broadcom, Inc. | 3.2% |
Changes in and Disagreements with Accountants
There were no changes in or disagreements with the Fund's accountants during the reporting period.
Fund Expenses
(Based on a hypothetical $10,000 investment)
| Fund (Ticker) | Costs of a $10,000 investment | Costs paid as a percentage of a $10,000 investment | ||
| AXS Tactical Income Fund (Class I/TINIX) |
$81 | 1.62%1 |
|
1 |
Annualized. |
Key Fund Statistics
The following table outlines key fund statistics that you should pay attention to.
| Fund net assets | $30,606,688 |
| Total number of portfolio holdings | 12 |
| Portfolio turnover rate as of the end of the reporting period | 59% |
Graphical Representation of Holdings
The tables below show the investment makeup of the Fund, representing percentage of the total net assets of the Fund. The Top Ten Holdings exclude short-term holdings, if any.
Top Ten Holdings
| State Street SPDR Bloomberg Convertible Securities ETF | 8.1% |
| iShares Interest Rate Hedged High Yield Bond ETF | 7.9% |
| State Street Blackstone Senior Loan ETF | 7.9% |
| WisdomTree Trust Interest Rate Hedged U.S. Aggregate Bond Fund | 7.9% |
| Vanguard Short-Term Corporate Bond ETF | 7.9% |
| Vanguard Mortgage-Backed Securities ETF | 7.9% |
| Vanguard Short-Term Treasury ETF | 7.9% |
| Vanguard Short-Term Inflation-Protected Securities ETF | 7.9% |
| iShares 0-1 Year Treasury Bond ETF | 7.8% |
| Janus Henderson AAA CLO ETF | 7.8% |
Asset Allocation
Top Ten Holdings
| State Street SPDR Bloomberg Convertible Securities ETF | 8.1% |
| iShares Interest Rate Hedged High Yield Bond ETF | 7.9% |
| State Street Blackstone Senior Loan ETF | 7.9% |
| WisdomTree Trust Interest Rate Hedged U.S. Aggregate Bond Fund | 7.9% |
| Vanguard Short-Term Corporate Bond ETF | 7.9% |
| Vanguard Mortgage-Backed Securities ETF | 7.9% |
| Vanguard Short-Term Treasury ETF | 7.9% |
| Vanguard Short-Term Inflation-Protected Securities ETF | 7.9% |
| iShares 0-1 Year Treasury Bond ETF | 7.8% |
| Janus Henderson AAA CLO ETF | 7.8% |
Changes in and Disagreements with Accountants
There were no changes in or disagreements with the Fund's accountants during the reporting period.
| [1] | Annualized. |
| [2] | Annualized. |
| [3] | Annualized. |
| [4] | Annualized. |
| [5] | Annualized. |
| [6] | Annualized. |
| [7] | Annualized. |
| [8] | Annualized. |