Shareholder Report
|
6 Months Ended |
|
Mar. 31, 2026
USD ($)
Holding
|
|---|
| Shareholder Report [Line Items] |
|
|
| Document Type |
N-CSRS
|
|
| Amendment Flag |
false
|
|
| Registrant Name |
Northern Lights Fund Trust
|
|
| Entity Central Index Key |
0001314414
|
|
| Entity Investment Company Type |
N-1A
|
|
| Document Period End Date |
Mar. 31, 2026
|
|
| Shareholder Report Annual or Semi-Annual |
Semi-Annual Shareholder Report
|
|
| C000255862 |
|
|
| Shareholder Report [Line Items] |
|
|
| Fund Name |
Grant Park Dynamic Allocation Fund
|
|
| Class Name |
Class A Shares
|
|
| Trading Symbol |
GPKAX
|
|
| Additional Information Phone Number |
1-855-501-4758
|
|
| Additional Information Website |
https://www.grantparkfunds.com/funds/dynamic-allocation-fund
|
|
| Expenses [Text Block] |
What were the Fund’s costs for the last six months?(based on a hypothetical $10,000 investment) Table SummaryClass Name | Costs of a $10,000 investment | Costs paid as a percentage of a $10,000 investment |
|---|
Class A Shares | $93 | 1.83%Footnote Reference* |
|---|
| Footnote | Description | Footnote* | Annualized |
|
|
| Expenses Paid, Amount |
$ 93
|
|
| Expense Ratio, Percent |
1.83%
|
[1] |
| AssetsNet |
$ 66,496,250
|
|
| Holdings Count | Holding |
9
|
|
| Advisory Fees Paid, Amount |
$ 286,735
|
|
| InvestmentCompanyPortfolioTurnover |
160.00%
|
|
| Additional Fund Statistics [Text Block] |
Table SummaryNet Assets | $66,496,250 |
|---|
Number of Portfolio Holdings | 9 |
|---|
Advisory Fee (net of waivers) | $286,735 |
|---|
Portfolio Turnover | 160% |
|---|
|
|
| Holdings [Text Block] |
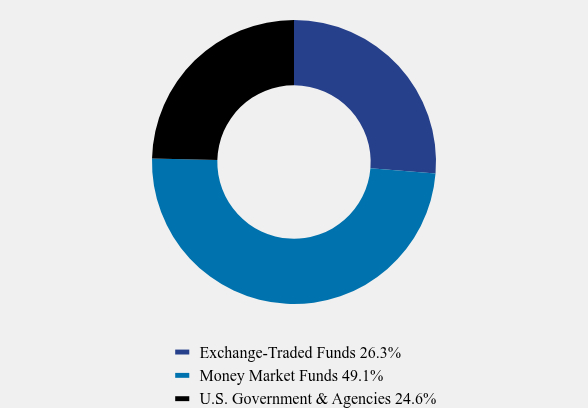
Asset Weighting (% of total investments)Table SummaryValue | Value |
|---|
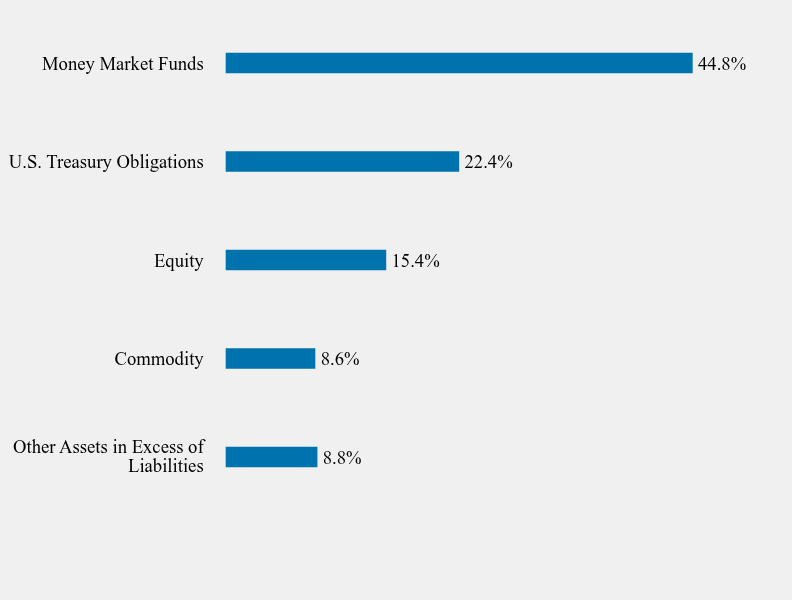
Exchange-Traded Funds | 26.3% | Money Market Funds | 49.1% | U.S. Government & Agencies | 24.6% | Sector Weighting (% of net assets)Table SummaryValue | Value |
|---|
Other Assets in Excess of Liabilities | 8.8% | Commodity | 8.6% | Equity | 15.4% | U.S. Treasury Obligations | 22.4% | Money Market Funds | 44.8% | Top 10 Holdings (% of net assets)Table SummaryHolding Name | % of Net Assets |
|---|
Invesco Optimum Yield Diversified Commodity Strategy No K-1 ETF | 8.6% |
|---|
United States Treasury Bill, 3.420%, 04/14/26 | 7.5% |
|---|
United States Treasury Bill, 3.610%, 05/14/26 | 7.5% |
|---|
United States Treasury Bill, 3.620%, 06/11/26 | 7.5% |
|---|
Vanguard FTSE Emerging Markets ETF | 6.2% |
|---|
Vanguard FTSE Developed Markets ETF | 5.2% |
|---|
Vanguard Real Estate ETF | 4.1% |
|---|
|
|
| Material Fund Change [Text Block] |
No material changes occurred during the period ended March 31, 2026. |
|
| C000255863 |
|
|
| Shareholder Report [Line Items] |
|
|
| Fund Name |
Grant Park Dynamic Allocation Fund
|
|
| Class Name |
Class I Shares
|
|
| Trading Symbol |
GPKIX
|
|
| Additional Information Phone Number |
1-855-501-4758
|
|
| Additional Information Website |
https://www.grantparkfunds.com/funds/dynamic-allocation-fund
|
|
| Expenses [Text Block] |
What were the Fund’s costs for the last six months?(based on a hypothetical $10,000 investment) Table SummaryClass Name | Costs of a $10,000 investment | Costs paid as a percentage of a $10,000 investment |
|---|
Class I Shares | $81 | 1.58%Footnote Reference* |
|---|
| Footnote | Description | Footnote* | Annualized |
|
|
| Expenses Paid, Amount |
$ 81
|
|
| Expense Ratio, Percent |
1.58%
|
[2] |
| AssetsNet |
$ 66,496,250
|
|
| Holdings Count | Holding |
9
|
|
| Advisory Fees Paid, Amount |
$ 286,735
|
|
| InvestmentCompanyPortfolioTurnover |
160.00%
|
|
| Additional Fund Statistics [Text Block] |
Table SummaryNet Assets | $66,496,250 |
|---|
Number of Portfolio Holdings | 9 |
|---|
Advisory Fee (net of waivers) | $286,735 |
|---|
Portfolio Turnover | 160% |
|---|
|
|
| Holdings [Text Block] |
Asset Weighting (% of total investments)Table SummaryValue | Value |
|---|
Exchange-Traded Funds | 26.3% | Money Market Funds | 49.1% | U.S. Government & Agencies | 24.6% | Sector Weighting (% of net assets)Table SummaryValue | Value |
|---|
Other Assets in Excess of Liabilities | 8.8% | Commodity | 8.6% | Equity | 15.4% | U.S. Treasury Obligations | 22.4% | Money Market Funds | 44.8% | Top 10 Holdings (% of net assets)Table SummaryHolding Name | % of Net Assets |
|---|
Invesco Optimum Yield Diversified Commodity Strategy No K-1 ETF | 8.6% |
|---|
United States Treasury Bill, 3.420%, 04/14/26 | 7.5% |
|---|
United States Treasury Bill, 3.610%, 05/14/26 | 7.5% |
|---|
United States Treasury Bill, 3.620%, 06/11/26 | 7.5% |
|---|
Vanguard FTSE Emerging Markets ETF | 6.2% |
|---|
Vanguard FTSE Developed Markets ETF | 5.2% |
|---|
Vanguard Real Estate ETF | 4.1% |
|---|
|
|
| Material Fund Change [Text Block] |
No material changes occurred during the period ended March 31, 2026. |
|
| C000134834 |
|
|
| Shareholder Report [Line Items] |
|
|
| Fund Name |
Grant Park Multi Alternative Strategies Fund
|
|
| Class Name |
Class A Shares
|
|
| Trading Symbol |
GPAAX
|
|
| Additional Information Phone Number |
1-855-501-4758
|
|
| Additional Information Website |
https://www.grantparkfunds.com/funds/multi-alternative-strategies-fund
|
|
| Expenses [Text Block] |
What were the Fund’s costs for the last six months?(based on a hypothetical $10,000 investment) Table SummaryClass Name | Costs of a $10,000 investment | Costs paid as a percentage of a $10,000 investment |
|---|
Class A Shares | $88 | 1.73%Footnote Reference* |
|---|
| Footnote | Description | Footnote* | Annualized |
|
|
| Expenses Paid, Amount |
$ 88
|
|
| Expense Ratio, Percent |
1.73%
|
[3] |
| AssetsNet |
$ 318,513,184
|
|
| Holdings Count | Holding |
33
|
|
| Advisory Fees Paid, Amount |
$ 1,846,558
|
|
| InvestmentCompanyPortfolioTurnover |
14.00%
|
|
| Additional Fund Statistics [Text Block] |
Table SummaryNet Assets | $318,513,184 |
|---|
Number of Portfolio Holdings | 33 |
|---|
Advisory Fee | $1,846,558 |
|---|
Portfolio Turnover | 14% |
|---|
|
|
| Holdings [Text Block] |
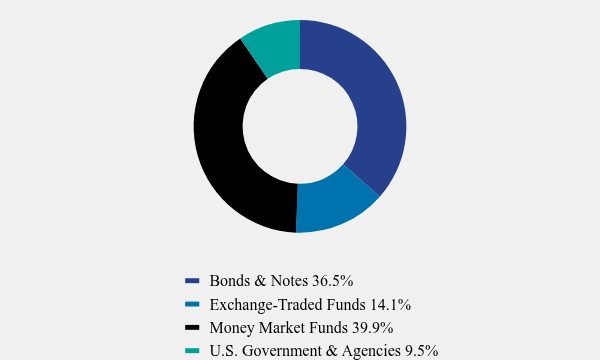
Asset Weighting (% of total investments)Table SummaryValue | Value |
|---|
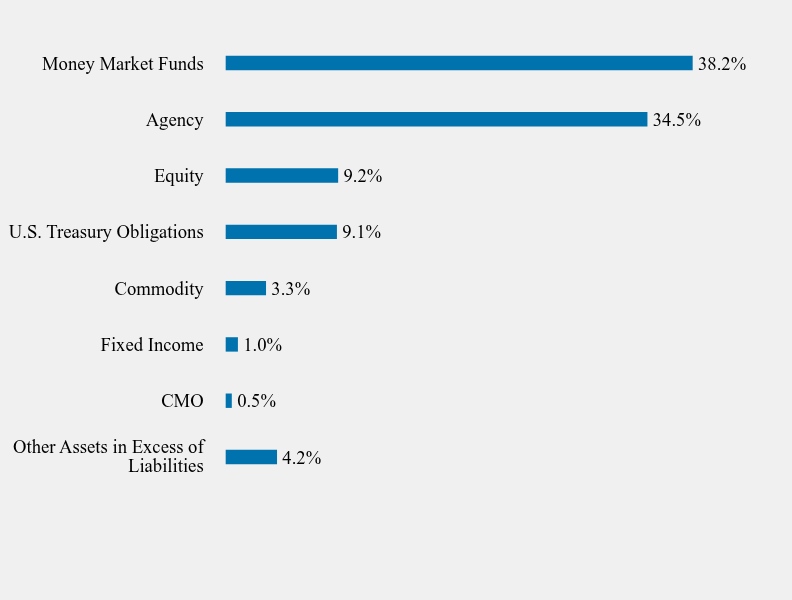
Bonds & Notes | 36.5% | Exchange-Traded Funds | 14.1% | Money Market Funds | 39.9% | U.S. Government & Agencies | 9.5% | Sector Weighting (% of net assets)Table SummaryValue | Value |
|---|
Other Assets in Excess of Liabilities | 4.2% | CMO | 0.5% | Fixed Income | 1.0% | Commodity | 3.3% | U.S. Treasury Obligations | 9.1% | Equity | 9.2% | Agency | 34.5% | Money Market Funds | 38.2% | Top 10 Holdings (% of net assets)Table SummaryHolding Name | % of Net Assets |
|---|
Federal Home Loan Banks, 2.000%, 02/25/28 | 4.6% |
|---|
Federal Home Loan Banks, 2.000%, 07/21/26 | 4.4% |
|---|
Federal National Mortgage Association, 0.850%, 06/30/26 | 4.1% |
|---|
Federal Home Loan Banks, 2.500%, 06/30/26 | 3.1% |
|---|
Federal Home Loan Mortgage Corporation, 0.700%, 08/19/26 | 3.1% |
|---|
Federal Home Loan Banks, 1.750%, 06/30/27 | 3.1% |
|---|
Federal Home Loan Banks, 2.000%, 01/28/28 | 3.1% |
|---|
Federal Home Loan Banks, 2.000%, 02/24/28 | 3.1% |
|---|
Federal Home Loan Banks, 2.000%, 08/24/28 | 3.0% |
|---|
Federal Home Loan Banks, 1.750%, 08/16/28 | 3.0% |
|---|
|
|
| Material Fund Change [Text Block] |
No material changes occurred during the period ended March 31, 2026. |
|
| C000134835 |
|
|
| Shareholder Report [Line Items] |
|
|
| Fund Name |
Grant Park Multi Alternative Strategies Fund
|
|
| Class Name |
Class C Shares
|
|
| Trading Symbol |
GPACX
|
|
| Additional Information Phone Number |
1-855-501-4758
|
|
| Additional Information Website |
https://www.grantparkfunds.com/funds/multi-alternative-strategies-fund
|
|
| Expenses [Text Block] |
What were the Fund’s costs for the last six months?(based on a hypothetical $10,000 investment) Table SummaryClass Name | Costs of a $10,000 investment | Costs paid as a percentage of a $10,000 investment |
|---|
Class C Shares | $126 | 2.48%Footnote Reference* |
|---|
| Footnote | Description | Footnote* | Annualized |
|
|
| Expenses Paid, Amount |
$ 126
|
|
| Expense Ratio, Percent |
2.48%
|
[4] |
| AssetsNet |
$ 318,513,184
|
|
| Holdings Count | Holding |
33
|
|
| Advisory Fees Paid, Amount |
$ 1,846,558
|
|
| InvestmentCompanyPortfolioTurnover |
14.00%
|
|
| Additional Fund Statistics [Text Block] |
Table SummaryNet Assets | $318,513,184 |
|---|
Number of Portfolio Holdings | 33 |
|---|
Advisory Fee | $1,846,558 |
|---|
Portfolio Turnover | 14% |
|---|
|
|
| Holdings [Text Block] |
Asset Weighting (% of total investments)Table SummaryValue | Value |
|---|
Bonds & Notes | 36.5% | Exchange-Traded Funds | 14.1% | Money Market Funds | 39.9% | U.S. Government & Agencies | 9.5% | Sector Weighting (% of net assets)Table SummaryValue | Value |
|---|
Other Assets in Excess of Liabilities | 4.2% | CMO | 0.5% | Fixed Income | 1.0% | Commodity | 3.3% | U.S. Treasury Obligations | 9.1% | Equity | 9.2% | Agency | 34.5% | Money Market Funds | 38.2% | Top 10 Holdings (% of net assets)Table SummaryHolding Name | % of Net Assets |
|---|
Federal Home Loan Banks, 2.000%, 02/25/28 | 4.6% |
|---|
Federal Home Loan Banks, 2.000%, 07/21/26 | 4.4% |
|---|
Federal National Mortgage Association, 0.850%, 06/30/26 | 4.1% |
|---|
Federal Home Loan Banks, 2.500%, 06/30/26 | 3.1% |
|---|
Federal Home Loan Mortgage Corporation, 0.700%, 08/19/26 | 3.1% |
|---|
Federal Home Loan Banks, 1.750%, 06/30/27 | 3.1% |
|---|
Federal Home Loan Banks, 2.000%, 01/28/28 | 3.1% |
|---|
Federal Home Loan Banks, 2.000%, 02/24/28 | 3.1% |
|---|
Federal Home Loan Banks, 2.000%, 08/24/28 | 3.0% |
|---|
Federal Home Loan Banks, 1.750%, 08/16/28 | 3.0% |
|---|
|
|
| Material Fund Change [Text Block] |
No material changes occurred during the period ended March 31, 2026. |
|
| C000134836 |
|
|
| Shareholder Report [Line Items] |
|
|
| Fund Name |
Grant Park Multi Alternative Strategies Fund
|
|
| Class Name |
Class I Shares
|
|
| Trading Symbol |
GPAIX
|
|
| Additional Information Phone Number |
1-855-501-4758
|
|
| Additional Information Website |
https://www.grantparkfunds.com/funds/multi-alternative-strategies-fund
|
|
| Expenses [Text Block] |
What were the Fund’s costs for the last six months?(based on a hypothetical $10,000 investment) Table SummaryClass Name | Costs of a $10,000 investment | Costs paid as a percentage of a $10,000 investment |
|---|
Class I Shares | $76 | 1.48%Footnote Reference* |
|---|
| Footnote | Description | Footnote* | Annualized |
|
|
| Expenses Paid, Amount |
$ 76
|
|
| Expense Ratio, Percent |
1.48%
|
[5] |
| AssetsNet |
$ 318,513,184
|
|
| Holdings Count | Holding |
33
|
|
| Advisory Fees Paid, Amount |
$ 1,846,558
|
|
| InvestmentCompanyPortfolioTurnover |
14.00%
|
|
| Additional Fund Statistics [Text Block] |
Table SummaryNet Assets | $318,513,184 |
|---|
Number of Portfolio Holdings | 33 |
|---|
Advisory Fee | $1,846,558 |
|---|
Portfolio Turnover | 14% |
|---|
|
|
| Holdings [Text Block] |
Asset Weighting (% of total investments)Table SummaryValue | Value |
|---|
Bonds & Notes | 36.5% | Exchange-Traded Funds | 14.1% | Money Market Funds | 39.9% | U.S. Government & Agencies | 9.5% | Sector Weighting (% of net assets)Table SummaryValue | Value |
|---|
Other Assets in Excess of Liabilities | 4.2% | CMO | 0.5% | Fixed Income | 1.0% | Commodity | 3.3% | U.S. Treasury Obligations | 9.1% | Equity | 9.2% | Agency | 34.5% | Money Market Funds | 38.2% | Top 10 Holdings (% of net assets)Table SummaryHolding Name | % of Net Assets |
|---|
Federal Home Loan Banks, 2.000%, 02/25/28 | 4.6% |
|---|
Federal Home Loan Banks, 2.000%, 07/21/26 | 4.4% |
|---|
Federal National Mortgage Association, 0.850%, 06/30/26 | 4.1% |
|---|
Federal Home Loan Banks, 2.500%, 06/30/26 | 3.1% |
|---|
Federal Home Loan Mortgage Corporation, 0.700%, 08/19/26 | 3.1% |
|---|
Federal Home Loan Banks, 1.750%, 06/30/27 | 3.1% |
|---|
Federal Home Loan Banks, 2.000%, 01/28/28 | 3.1% |
|---|
Federal Home Loan Banks, 2.000%, 02/24/28 | 3.1% |
|---|
Federal Home Loan Banks, 2.000%, 08/24/28 | 3.0% |
|---|
Federal Home Loan Banks, 1.750%, 08/16/28 | 3.0% |
|---|
|
|
| Material Fund Change [Text Block] |
No material changes occurred during the period ended March 31, 2026. |
|
| C000134837 |
|
|
| Shareholder Report [Line Items] |
|
|
| Fund Name |
Grant Park Multi Alternative Strategies Fund
|
|
| Class Name |
Class N Shares
|
|
| Trading Symbol |
GPANX
|
|
| Additional Information Phone Number |
1-855-501-4758
|
|
| Additional Information Website |
https://www.grantparkfunds.com/funds/multi-alternative-strategies-fund
|
|
| Expenses [Text Block] |
What were the Fund’s costs for the last six months?(based on a hypothetical $10,000 investment) Table SummaryClass Name | Costs of a $10,000 investment | Costs paid as a percentage of a $10,000 investment |
|---|
Class N Shares | $88 | 1.73%Footnote Reference* |
|---|
| Footnote | Description | Footnote* | Annualized |
|
|
| Expenses Paid, Amount |
$ 88
|
|
| Expense Ratio, Percent |
1.73%
|
[6] |
| AssetsNet |
$ 318,513,184
|
|
| Holdings Count | Holding |
33
|
|
| Advisory Fees Paid, Amount |
$ 1,846,558
|
|
| InvestmentCompanyPortfolioTurnover |
14.00%
|
|
| Additional Fund Statistics [Text Block] |
Table SummaryNet Assets | $318,513,184 |
|---|
Number of Portfolio Holdings | 33 |
|---|
Advisory Fee | $1,846,558 |
|---|
Portfolio Turnover | 14% |
|---|
|
|
| Holdings [Text Block] |
Asset Weighting (% of total investments)Table SummaryValue | Value |
|---|
Bonds & Notes | 36.5% | Exchange-Traded Funds | 14.1% | Money Market Funds | 39.9% | U.S. Government & Agencies | 9.5% | Sector Weighting (% of net assets)Table SummaryValue | Value |
|---|
Other Assets in Excess of Liabilities | 4.2% | CMO | 0.5% | Fixed Income | 1.0% | Commodity | 3.3% | U.S. Treasury Obligations | 9.1% | Equity | 9.2% | Agency | 34.5% | Money Market Funds | 38.2% | Top 10 Holdings (% of net assets)Table SummaryHolding Name | % of Net Assets |
|---|
Federal Home Loan Banks, 2.000%, 02/25/28 | 4.6% |
|---|
Federal Home Loan Banks, 2.000%, 07/21/26 | 4.4% |
|---|
Federal National Mortgage Association, 0.850%, 06/30/26 | 4.1% |
|---|
Federal Home Loan Banks, 2.500%, 06/30/26 | 3.1% |
|---|
Federal Home Loan Mortgage Corporation, 0.700%, 08/19/26 | 3.1% |
|---|
Federal Home Loan Banks, 1.750%, 06/30/27 | 3.1% |
|---|
Federal Home Loan Banks, 2.000%, 01/28/28 | 3.1% |
|---|
Federal Home Loan Banks, 2.000%, 02/24/28 | 3.1% |
|---|
Federal Home Loan Banks, 2.000%, 08/24/28 | 3.0% |
|---|
Federal Home Loan Banks, 1.750%, 08/16/28 | 3.0% |
|---|
|
|
| Material Fund Change [Text Block] |
No material changes occurred during the period ended March 31, 2026. |
|
|
|