Shareholder Report
|
6 Months Ended |
|
Mar. 31, 2026
USD ($)
Holding
|
|---|
| Shareholder Report [Line Items] |
|
|
| Document Type |
N-CSRS
|
|
| Amendment Flag |
false
|
|
| Registrant Name |
Advisors Preferred Trust
|
|
| Entity Central Index Key |
0001556505
|
|
| Entity Investment Company Type |
N-1A
|
|
| Document Period End Date |
Mar. 31, 2026
|
|
| Shareholder Report Annual or Semi-Annual |
Semi-Annual Shareholder Report
|
|
| C000154799 |
|
|
| Shareholder Report [Line Items] |
|
|
| Fund Name |
Spectrum Active Advantage Fund
|
|
| Class Name |
Investor Class
|
|
| Trading Symbol |
SAPEX
|
|
| Additional Information Phone Number |
(866) 862-9686
|
|
| Additional Information Website |
www.thespectrumfunds.com/fund-documents
|
|
| Expenses [Text Block] |
What were the Fund’s costs for the last six months?(based on a hypothetical $10,000 investment) Table SummaryClass Name | Costs of a $10,000 investment | Costs paid as a percentage of a $10,000 investment |
|---|
Investor | $88 | 1.78%Footnote Reference |
|---|
| Footnote | Description | Footnote | (Annualized) |
|
|
| Expenses Paid, Amount |
$ 88
|
|
| Expense Ratio, Percent |
1.78%
|
[1] |
| Performance Past Does Not Indicate Future [Text] |
The Fund’s past performance is not a good predictor of how the Fund will perform in the future.
|
|
| Average Annual Return [Table Text Block] |
Average Annual Total Returns Table Summary | 6 Months | 1 Year | 5 Years | 10 Years |
|---|
Spectrum Active Advantage Fund | -2.33% | 10.53% | -1.91% | 6.47% |
|---|
S&P 500® Index | -1.79% | 17.80% | 12.06% | 14.16% |
|---|
The Fund’s past performance is not a good predictor of how the Fund will perform in the future. The graph and table do not reflect the deduction of taxes that a shareholder would pay on fund distributions or redemption of fund shares. For updated performance call (866) 862-9686. |
|
| No Deduction of Taxes [Text Block] |
The graph and table do not reflect the deduction of taxes that a shareholder would pay on fund distributions or redemption of fund shares.
|
|
| AssetsNet |
$ 10,038,157
|
|
| Holdings Count | Holding |
12
|
|
| Advisory Fees Paid, Amount |
$ 78,519
|
|
| InvestmentCompanyPortfolioTurnover |
313.00%
|
|
| Additional Fund Statistics [Text Block] |
Table SummaryNet Assets | $10,038,157 |
|---|
Number of Portfolio Holdings | 12 |
|---|
Advisory Fee | $78,519 |
|---|
Portfolio Turnover | 313% |
|---|
|
|
| Holdings [Text Block] |
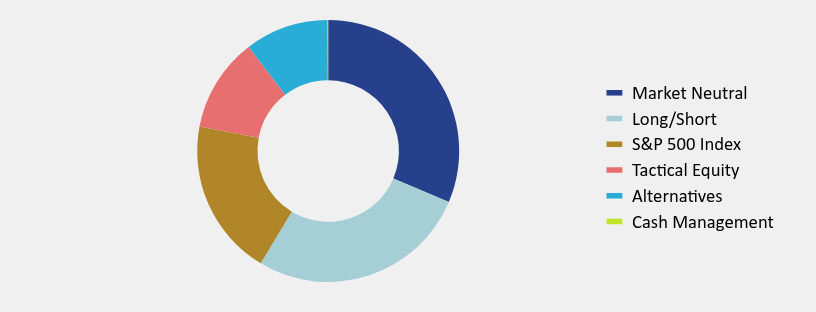
Investment Model Exposure 1.63 (1=100%) (value greater than 1 indicates use of leverage)Pie chart indexed to 100%, net exposureTable SummaryValue | Value |
|---|
Market Neutral | 31.37 | Long/Short | 27.24 | S&P 500 Index | 19.38 | Tactical Equity | 11.62 | Alternatives | 10.31 | Cash Management | 0.08 | Portfolio Allocation (% of total (including notional) exposure)Table SummaryCash Management | 0.08% |
|---|
Alternatives | 10.31% |
|---|
Market Neutral | 31.37% |
|---|
Long/Short | 27.24% |
|---|
S&P 500 Index | 19.38% |
|---|
Tactical Equity | 11.62% |
|---|
| 100.00% |
|---|
Top 10 Holdings (% of net assets)Table SummaryHolding Name | % of Net Assets |
|---|
United States Treasury Bill, 3.620%, 06/11/26
| 25.7% |
|---|
United States Treasury Bill, 3.620%, 06/18/26
| 13.7% |
|---|
Invesco S&P 500 Equal Weight ETF | 9.6% |
|---|
United States Treasury Bill, 3.610%, 05/07/26
| 9.1% |
|---|
Fidelity Government Portfolio Class I, 3.520%,
| 7.5% |
|---|
First American Government Obligations Fund Class Z, 3.534%,
| 7.5% |
|---|
Ambassador Fund | 5.2% |
|---|
Victory Pioneer CAT Bond Fund Class R6 | 5.2% |
|---|
iShares S&P 100 ETF | 5.1% |
|---|
|
|
| C000133465 |
|
|
| Shareholder Report [Line Items] |
|
|
| Fund Name |
Spectrum Low Volatility Fund
|
|
| Class Name |
Investor Class
|
|
| Trading Symbol |
SVARX
|
|
| Additional Information Phone Number |
(866) 862-9686
|
|
| Additional Information Website |
www.thespectrumfunds.com/fund-documents
|
|
| Expenses [Text Block] |
What were the Fund’s costs for the last six months?(based on a hypothetical $10,000 investment) Table SummaryClass Name | Costs of a $10,000 investment | Costs paid as a percentage of a $10,000 investment |
|---|
Investor | $122 | 2.42%Footnote Reference |
|---|
| Footnote | Description | Footnote | (Annualized) |
|
|
| Expenses Paid, Amount |
$ 122
|
|
| Expense Ratio, Percent |
2.42%
|
[2] |
| Performance Past Does Not Indicate Future [Text] |
The Fund’s past performance is not a good predictor of how the Fund will perform in the future.
|
|
| Average Annual Return [Table Text Block] |
Average Annual Total Returns Table Summary | 6 Months | 1 Year | 5 Years | 10 Years |
|---|
Spectrum Low Volatility Fund | 2.32% | 5.59% | 3.37% | 6.89% |
|---|
Bloomberg U.S. Aggregate Bond IndexFootnote Reference* | 1.05% | 4.35% | 0.31% | 1.70% |
|---|
Morningstar LSTA U.S. Leveraged Loan 100 Index | 1.05% | 5.94% | 5.91% | 5.46% |
|---|
| Footnote | Description | Footnote* | The Fund's primary broad based securities market index was changed to comply with regulatory requirements. |
The Fund is not sponsored, endorsed, sold or promoted by Morningstar, Inc. or any of its affiliates (all such entities, collectively, “Morningstar Entities”). The Morningstar Entities make no representation or warranty, express or implied, to the owners of the Fund or any member of the public regarding the advisability of investing in equity securities generally or in the Fund in particular or the ability of the Fund to track general equity market performance. THE MORNINGSTAR ENTITIES DO NOT GUARANTEE THE ACCURACY AND/OR THE COMPLETENESS OF THE FUND OR ANY DATA INCLUDED THEREIN AND MORNINGSTAR ENTITIES SHALL HAVE NO LIABILITY FOR ANY ERRORS, OMISSIONS, OR INTERRUPTIONS THEREIN. The Fund’s past performance is not a good predictor of how the Fund will perform in the future. The graph and table do not reflect the deduction of taxes that a shareholder would pay on fund distributions or redemption of fund shares. For updated performance call (866) 862-9686. |
|
| No Deduction of Taxes [Text Block] |
The graph and table do not reflect the deduction of taxes that a shareholder would pay on fund distributions or redemption of fund shares.
|
|
| AssetsNet |
$ 169,160,826
|
|
| Holdings Count | Holding |
13
|
|
| Advisory Fees Paid, Amount |
$ 1,914,217
|
|
| InvestmentCompanyPortfolioTurnover |
155.00%
|
|
| Additional Fund Statistics [Text Block] |
Table SummaryNet Assets | $169,160,826 |
|---|
Number of Portfolio Holdings | 13 |
|---|
Advisory Fee | $1,914,217 |
|---|
Portfolio Turnover | 155% |
|---|
|
|
| Holdings [Text Block] |
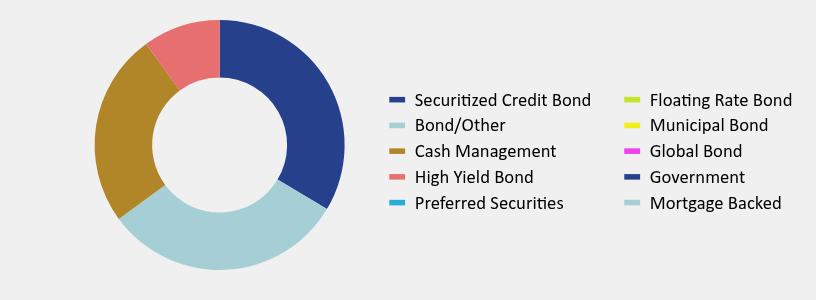
Investment Model Exposure 1.37 (1=100%) (value greater than 1 indicates use of leverage)Pie chart indexed to 100%, net exposureTable SummaryValue | Value |
|---|
Securitized Credit Bond | 33.57 | Bond/Other | 31.36 | Cash Management | 25.05 | High Yield Bond | 10.02 | Preferred Securities | 0.00 | Floating Rate Bond | 0.00 | Municipal Bond | 0.00 | Global Bond | 0.00 | Government | 0.00 | Mortgage Backed | 0.00 | Portfolio Allocation (% of total (including notional) exposure)Table SummaryHigh Yield Bond | 10.02% |
|---|
Global Bond | 0.00% |
|---|
Floating Rate Bond | 0.00% |
|---|
Securitized Credit Bond | 33.57% |
|---|
Municipal Bond | 0.00% |
|---|
Government | 0.00% |
|---|
Mortgage Backed | 0.00% |
|---|
Preferred Securities | 0.00% |
|---|
Bond/Other | 31.36% |
|---|
Cash Management | 25.05% |
|---|
| 100.00% |
|---|
Top 10 Holdings (% of net assets)Table SummaryHolding Name | % of Net Assets |
|---|
United States Treasury Bill, 3.630%, 06/04/26
| 20.7% |
|---|
Fidelity Government Portfolio Class I, 3.520%,
| 14.9% |
|---|
United States Treasury Bill, 3.620%, 06/11/26
| 14.8% |
|---|
Nationwide Strategic Income Fund Class R6 | 11.3% |
|---|
Victory Pioneer CAT Bond Fund Class R6 | 10.1% |
|---|
United States Treasury Bill, 3.620%, 06/25/26
| 7.6% |
|---|
Axonic Strategic Income Fund Class I | 6.3% |
|---|
Holbrook Structured Income Fund Class I | 5.8% |
|---|
United States Treasury Bill, 3.500%, 04/23/26
| 4.3% |
|---|
|
|
| C000226669 |
|
|
| Shareholder Report [Line Items] |
|
|
| Fund Name |
Spectrum Unconstrained Fund
|
|
| Trading Symbol |
SUNBX
|
|
| Additional Information Phone Number |
(866) 862-9686
|
|
| Additional Information Website |
www.thespectrumfunds.com/fund-documents
|
|
| Expenses [Text Block] |
What were the Fund’s costs for the last six months?(based on a hypothetical $10,000 investment) Table SummaryClass Name | Costs of a $10,000 investment | Costs paid as a percentage of a $10,000 investment |
|---|
Investor Class | $124 | 2.46%Footnote Reference |
|---|
| Footnote | Description | Footnote | (Annualized) |
|
|
| Expenses Paid, Amount |
$ 124
|
|
| Expense Ratio, Percent |
2.46%
|
[3] |
| Performance Past Does Not Indicate Future [Text] |
The Fund’s past performance is not a good predictor of how the Fund will perform in the future.
|
|
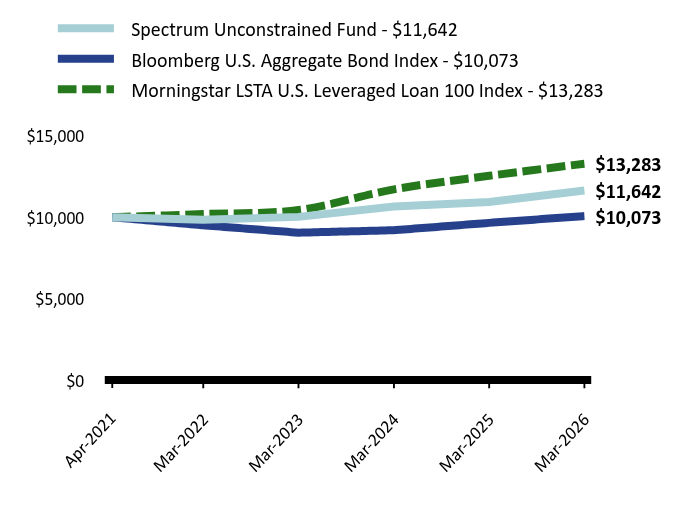
| Line Graph [Table Text Block] |
Table Summary | Spectrum Unconstrained Fund | Bloomberg U.S. Aggregate Bond Index | Morningstar LSTA U.S. Leveraged Loan 100 Index |
|---|
Apr-2021 | $10,000 | $10,000 | $10,000 |
|---|
Mar-2022 | $9,847 | $9,505 | $10,195 |
|---|
Mar-2023 | $10,021 | $9,050 | $10,442 |
|---|
Mar-2024 | $10,663 | $9,204 | $11,711 |
|---|
Mar-2025 | $10,938 | $9,653 | $12,538 |
|---|
Mar-2026 | $11,642 | $10,073 | $13,283 |
|---|
|
|
| Average Annual Return [Table Text Block] |
Average Annual Total Returns Table Summary | 6 Months | 1 Year | Since Inception (April 16, 2021) |
|---|
Spectrum Unconstrained Fund | 1.43% | 6.44% | 3.12% |
|---|
Bloomberg U.S. Aggregate Bond IndexFootnote Reference* | 1.05% | 4.35% | 0.15% |
|---|
Morningstar LSTA U.S. Leveraged Loan 100 Index | 1.05% | 5.94% | 5.90% |
|---|
| Footnote | Description | Footnote* | The Fund's primary broad based securities market index was changed to comply with regulatory requirements. |
The Fund is not sponsored, endorsed, sold or promoted by Morningstar, Inc. or any of its affiliates (all such entities, collectively, “Morningstar Entities”). The Morningstar Entities make no representation or warranty, express or implied, to the owners of the Fund or any member of the public regarding the advisability of investing in equity securities generally or in the Fund in particular or the ability of the Fund to track general equity market performance. THE MORNINGSTAR ENTITIES DO NOT GUARANTEE THE ACCURACY AND/OR THE COMPLETENESS OF THE FUND OR ANY DATA INCLUDED THEREIN AND MORNINGSTAR ENTITIES SHALL HAVE NO LIABILITY FOR ANY ERRORS, OMISSIONS, OR INTERRUPTIONS THEREIN. The Fund’s past performance is not a good predictor of how the Fund will perform in the future. The graph and table do not reflect the deduction of taxes that a shareholder would pay on fund distributions or redemption of fund shares. For updated performance call (866) 862-9686. |
|
| Performance Inception Date |
Apr. 16, 2021
|
|
| No Deduction of Taxes [Text Block] |
The graph and table do not reflect the deduction of taxes that a shareholder would pay on fund distributions or redemption of fund shares.
|
|
| AssetsNet |
$ 6,707,934
|
|
| Holdings Count | Holding |
11
|
|
| Advisory Fees Paid, Amount |
$ 69,153
|
|
| InvestmentCompanyPortfolioTurnover |
277.00%
|
|
| Additional Fund Statistics [Text Block] |
Table SummaryNet Assets | $6,707,934 |
|---|
Number of Portfolio Holdings | 11 |
|---|
Advisory Fee | $69,153 |
|---|
Portfolio Turnover | 277% |
|---|
|
|
| Holdings [Text Block] |
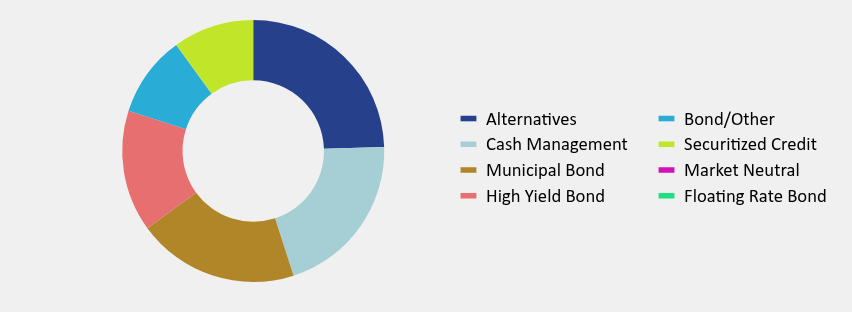
Investment Model Exposure 1.39 (1=100%) (value greater than 1 indicates use of leverage)Pie chart indexed to 100%, net exposureTable SummaryValue | Value |
|---|
Alternatives | 24.50 | Cash Management | 20.52 | Municipal Bond | 19.95 | High Yield Bond | 14.99 | Bond/Other | 10.04 | Securitized Credit | 10.00 | Market Neutral | 0.00 | Floating Rate Bond | 0.00 | Portfolio Allocation (% of total (including notional) exposure)Table SummaryHigh Yield Bond | 14.99% |
|---|
Floating Rate Bond | 0.00% |
|---|
Municipal Bond | 19.95% |
|---|
Bond/Other | 10.04% |
|---|
Cash Management | 20.52% |
|---|
Alternatives | 24.50% |
|---|
Securitized Credit | 10.00% |
|---|
Market Neutral | 0.00% |
|---|
| 100.00% |
|---|
Top 10 Holdings (% of net assets)Table SummaryHolding Name | % of Net Assets |
|---|
United States Treasury Bill, 3.630%, 06/04/26
| 25.1% |
|---|
United States Treasury Bill, 3.620%, 06/11/26
| 23.1% |
|---|
Miller Market Neutral Income Fund Class I | 14.5% |
|---|
Victory Pioneer CAT Bond Fund Class R6 | 10.0% |
|---|
Holbrook Income Fund Class I | 10.0% |
|---|
Fidelity Government Portfolio Class I, 3.520%,
| 7.2% |
|---|
First American Government Obligations Fund Class Z, 3.534%,
| 7.2% |
|---|
|
|
| Material Fund Change [Text Block] |
No material changes occurred during the period ended March 31, 2026. |
|
|
|