Shareholder Report
Mar. 31, 2026
USD ($)
Holding
Shareholder Report |
6 Months Ended |
|---|---|
|
Mar. 31, 2026
USD ($)
Holding
| |
| Shareholder Report [Line Items] | |
| Document Type | N-CSRS |
| Amendment Flag | false |
| Registrant Name | The 2023 ETF Series Trust II |
| Entity Central Index Key | 0001969674 |
| Entity Investment Company Type | N-1A |
| Document Period End Date | Mar. 31, 2026 |
| C000263747 | |
| Shareholder Report [Line Items] | |
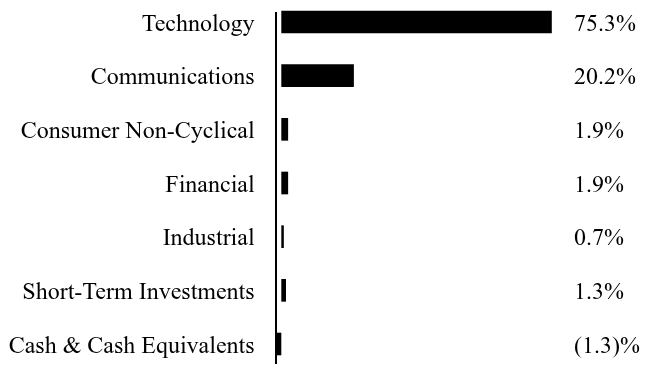
| Fund Name | Pictet AI & Automation ETF |
| Trading Symbol | PBOT |
| Annual or Semi-Annual Statement [Text Block] | This semi-annual shareholder report contains important information about Pictet AI & Automation ETF (the "Fund") for the period October 15, 2025* to March 31, 2026. |
| Shareholder Report Annual or Semi-Annual | semi-annual shareholder report |
| Additional Information [Text Block] | You can find additional information about the Fund at www.pictet.com/etf. You can also request this information by contacting us at 855-994-4778. |
| Additional Information Phone Number | 855-994-4778 |
| Additional Information Website | <span style="box-sizing: border-box; color: rgb(0, 0, 0); display: inline; flex-wrap: nowrap; font-size: 10.6667px; font-weight: 400; grid-area: auto; line-height: 16px; margin: 0px; overflow: visible; text-align: justify; text-align-last: left; white-space-collapse: preserve-breaks;">www.pictet.com/etf</span> |
| Expenses [Text Block] |
|
| Expenses Paid, Amount | $ 31 |
| Expense Ratio, Percent | 0.70% |
| AssetsNet | $ 4,672,000 |
| Holdings Count | Holding | 45 |
| InvestmentCompanyPortfolioTurnover | 74.00% |
| Additional Fund Statistics [Text Block] |
|
| Holdings [Text Block] |
|
| Largest Holdings [Text Block] |
|
| Material Fund Change [Text Block] |
|
| C000263748 | |
| Shareholder Report [Line Items] | |
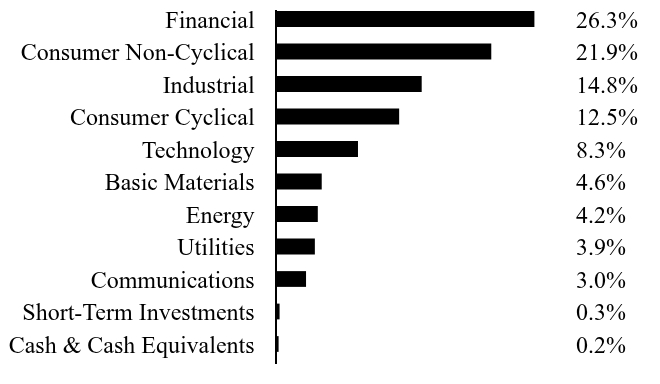
| Fund Name | Pictet AI Enhanced International Equity ETF |
| Trading Symbol | PQNT |
| Annual or Semi-Annual Statement [Text Block] | This semi-annual shareholder report contains important information about Pictet AI Enhanced International Equity ETF (the "Fund") for the period October 15, 2025* to March 31, 2026. |
| Shareholder Report Annual or Semi-Annual | semi-annual shareholder report |
| Additional Information [Text Block] | You can find additional information about the Fund at www.pictet.com/etf. You can also request this information by contacting us at 855-994-4778. |
| Additional Information Phone Number | 855-994-4778 |
| Additional Information Website | <span style="box-sizing: border-box; color: rgb(0, 0, 0); display: inline; flex-wrap: nowrap; font-size: 10.6667px; font-weight: 400; grid-area: auto; line-height: 16px; margin: 0px; overflow: visible; text-align: justify; text-align-last: left; white-space-collapse: preserve-breaks;">www.pictet.com/etf</span> |
| Expenses [Text Block] |
|
| Expenses Paid, Amount | $ 19 |
| Expense Ratio, Percent | 0.41% |
| AssetsNet | $ 5,154,000 |
| Holdings Count | Holding | 270 |
| InvestmentCompanyPortfolioTurnover | 86.00% |
| Additional Fund Statistics [Text Block] |
|
| Holdings [Text Block] |
|
| Largest Holdings [Text Block] |
|
| Material Fund Change [Text Block] |
|
| C000271445 | |
| Shareholder Report [Line Items] | |
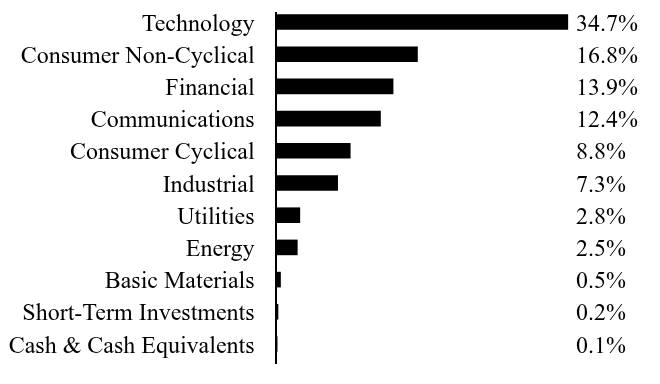
| Fund Name | Pictet AI Enhanced US Equity ETF |
| Trading Symbol | PQUS |
| Annual or Semi-Annual Statement [Text Block] | This semi-annual shareholder report contains important information about Pictet AI Enhanced US Equity ETF (the "Fund") for the period February 25, 2026* to March 31, 2026. |
| Shareholder Report Annual or Semi-Annual | semi-annual shareholder report |
| Additional Information [Text Block] | You can find additional information about the Fund at www.pictet.com/etf. You can also request this information by contacting us at 855-994-4778. |
| Additional Information Phone Number | 855-994-4778 |
| Additional Information Website | <span style="box-sizing: border-box; color: rgb(0, 0, 0); display: inline; flex-wrap: nowrap; font-size: 10.6667px; font-weight: 400; grid-area: auto; line-height: 16px; margin: 0px; overflow: visible; text-align: justify; text-align-last: left; white-space-collapse: preserve-breaks;">www.pictet.com/etf</span> |
| Expenses [Text Block] |
|
| Expenses Paid, Amount | $ 2 |
| Expense Ratio, Percent | 0.22% |
| AssetsNet | $ 51,124,000 |
| Holdings Count | Holding | 173 |
| InvestmentCompanyPortfolioTurnover | 16.00% |
| Additional Fund Statistics [Text Block] |
|
| Holdings [Text Block] |
|
| Largest Holdings [Text Block] |
|
| Material Fund Change [Text Block] |
|
| C000263749 | |
| Shareholder Report [Line Items] | |
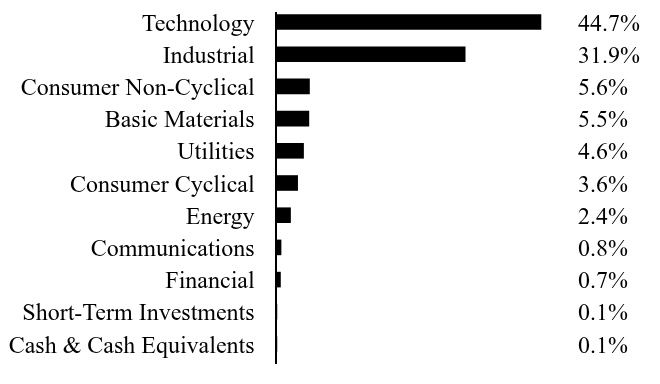
| Fund Name | Pictet Cleaner Planet ETF |
| Trading Symbol | PCLN |
| Annual or Semi-Annual Statement [Text Block] | This semi-annual shareholder report contains important information about Pictet Cleaner Planet ETF (the "Fund") for the period October 15, 2025* to March 31, 2026. |
| Shareholder Report Annual or Semi-Annual | semi-annual shareholder report |
| Additional Information [Text Block] | You can find additional information about the Fund at www.pictet.com/etf. You can also request this information by contacting us at 855-994-4778. |
| Additional Information Phone Number | 855-994-4778 |
| Additional Information Website | <span style="box-sizing: border-box; color: rgb(0, 0, 0); display: inline; flex-wrap: nowrap; font-size: 10.6667px; font-weight: 400; grid-area: auto; line-height: 16px; margin: 0px; overflow: visible; text-align: justify; text-align-last: left; white-space-collapse: preserve-breaks;">www.pictet.com/etf</span> |
| Expenses [Text Block] |
|
| Expenses Paid, Amount | $ 32 |
| Expense Ratio, Percent | 0.70% |
| AssetsNet | $ 13,296,000 |
| Holdings Count | Holding | 63 |
| InvestmentCompanyPortfolioTurnover | 58.00% |
| Additional Fund Statistics [Text Block] |
|
| Holdings [Text Block] |
|
| Largest Holdings [Text Block] |
|
| Material Fund Change [Text Block] |
|