Shareholder Report
Mar. 31, 2026
USD ($)
Holding
Shareholder Report |
6 Months Ended |
|---|---|
|
Mar. 31, 2026
USD ($)
Holding
| |
| Shareholder Report [Line Items] | |
| Document Type | N-CSRS |
| Amendment Flag | false |
| Registrant Name | Gabelli Equity Series Funds Inc |
| Entity Central Index Key | 0000877670 |
| Entity Investment Company Type | N-1A |
| Document Period End Date | Mar. 31, 2026 |
| C000002851 | |
| Shareholder Report [Line Items] | |
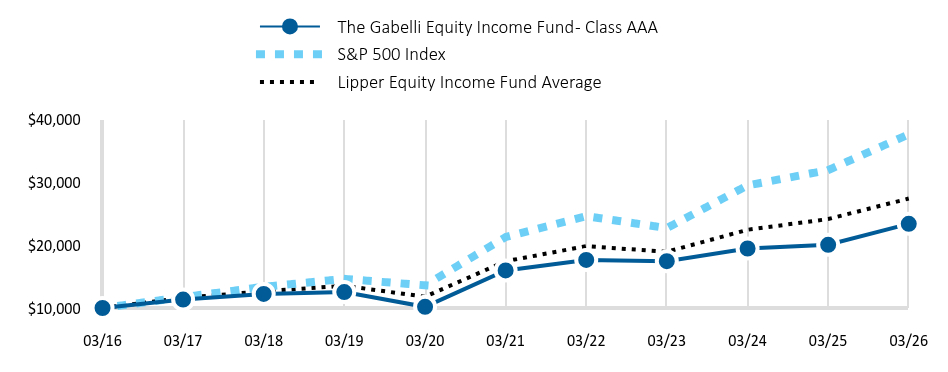
| Fund Name | The Gabelli Equity Income Fund |
| Class Name | Class AAA |
| Trading Symbol | GABEX |
| Annual or Semi-Annual Statement [Text Block] | This semi-annual shareholder report contains important information about The Gabelli Equity Income Fund (the "Fund") for the period of October 1, 2025 to March 31, 2026. |
| Shareholder Report Annual or Semi-Annual | semi-annual shareholder report |
| Additional Information [Text Block] | You may find additional information about the Fund at https://gabelli.com/ticker/GABEX/. You may also request information by contacting us at 800-GABELLI (800-422-3554). |
| Additional Information Phone Number | 800-GABELLI (800-422-3554) |
| Additional Information Website | https://gabelli.com/ticker/GABEX/ |
| Expenses [Text Block] | |
| Expenses Paid, Amount | $ 74 |
| Expense Ratio, Percent | 1.46% |
| Performance Past Does Not Indicate Future [Text] | Past performance does not guarantee future results. |
| Line Graph [Table Text Block] | |
| Average Annual Return [Table Text Block] | |
| No Deduction of Taxes [Text Block] | The table and graph presented above do not reflect the deduction of taxes a shareholder would pay on Fund distributions or the redemption of Fund shares. |
| AssetsNet | $ 441,639,249 |
| Holdings Count | Holding | 215 |
| Advisory Fees Paid, Amount | $ 2,258,746 |
| InvestmentCompanyPortfolioTurnover | 1.00% |
| Additional Fund Statistics [Text Block] | |
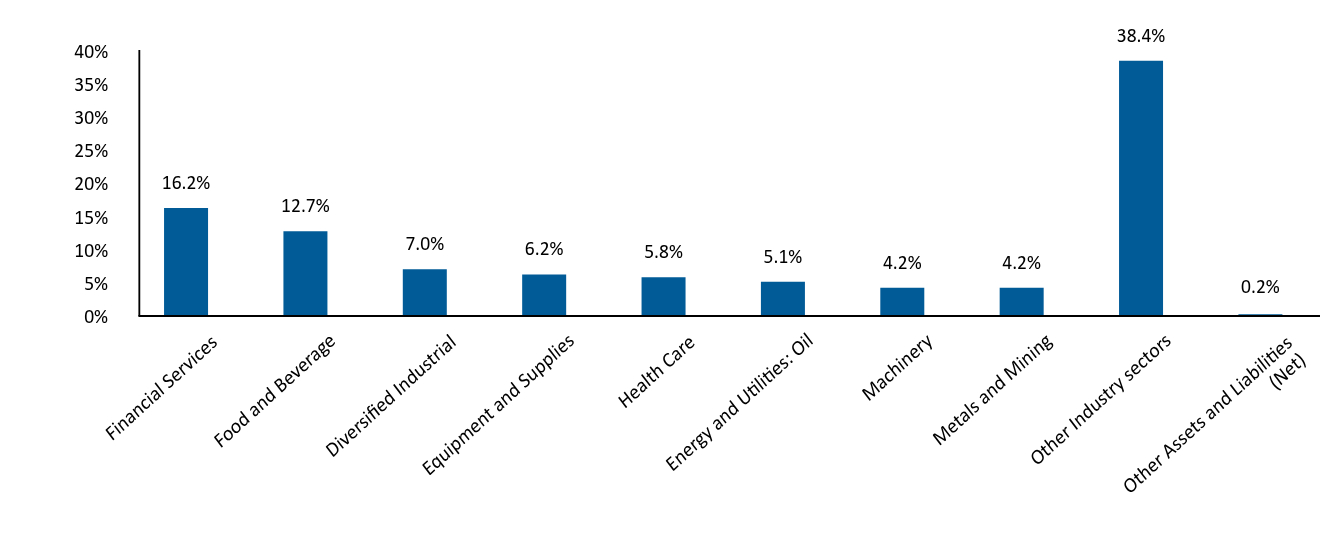
| Holdings [Text Block] | |
| Material Fund Change [Text Block] | |
| Updated Prospectus Phone Number | 800-GABELLI (800-422-3554) |
| Updated Prospectus Email Address | <span style="box-sizing: border-box; color: rgb(0, 0, 0); display: inline; flex-wrap: nowrap; font-size: 12px; font-weight: 400; grid-area: auto; line-height: 18px; margin: 0px; overflow: visible; text-align: justify; text-align-last: left; white-space-collapse: preserve-breaks;">info@gabelli.com</span> |
| Updated Prospectus Web Address | https://gabelli.com/ticker/GABEX/ |
| C000243164 | |
| Shareholder Report [Line Items] | |
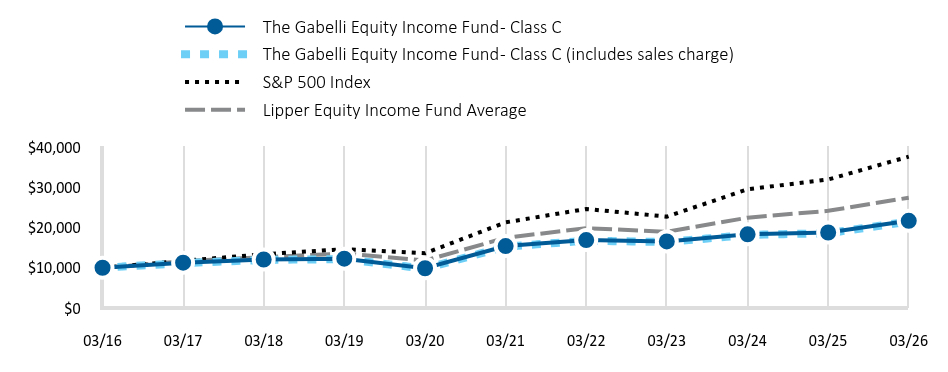
| Fund Name | The Gabelli Equity Income Fund |
| Class Name | Class C |
| Trading Symbol | GEICX |
| Annual or Semi-Annual Statement [Text Block] | This semi-annual shareholder report contains important information about The Gabelli Equity Income Fund (the "Fund") for the period of October 1, 2025 to March 31, 2026. |
| Shareholder Report Annual or Semi-Annual | semi-annual shareholder report |
| Additional Information [Text Block] | You may find additional information about the Fund at https://gabelli.com/ticker/GEICX/. You may also request information by contacting us at 800-GABELLI (800-422-3554). |
| Additional Information Phone Number | 800-GABELLI (800-422-3554) |
| Additional Information Website | https://gabelli.com/ticker/GEICX/ |
| Expenses [Text Block] | |
| Expenses Paid, Amount | $ 112 |
| Expense Ratio, Percent | 2.21% |
| Performance Past Does Not Indicate Future [Text] | Past performance does not guarantee future results. |
| Line Graph [Table Text Block] | |
| Average Annual Return [Table Text Block] | |
| No Deduction of Taxes [Text Block] | The table and graph presented above do not reflect the deduction of taxes a shareholder would pay on Fund distributions or the redemption of Fund shares. |
| AssetsNet | $ 441,639,249 |
| Holdings Count | Holding | 215 |
| Advisory Fees Paid, Amount | $ 2,258,746 |
| InvestmentCompanyPortfolioTurnover | 1.00% |
| Additional Fund Statistics [Text Block] | |
| Holdings [Text Block] | |
| Material Fund Change [Text Block] | |
| Updated Prospectus Phone Number | 800-GABELLI (800-422-3554) |
| Updated Prospectus Email Address | <span style="box-sizing: border-box; color: rgb(0, 0, 0); display: inline; flex-wrap: nowrap; font-size: 12px; font-weight: 400; grid-area: auto; line-height: 18px; margin: 0px; overflow: visible; text-align: justify; text-align-last: left; white-space-collapse: preserve-breaks;">info@gabelli.com</span> |
| Updated Prospectus Web Address | https://gabelli.com/ticker/GEICX/ |
| C000061072 | |
| Shareholder Report [Line Items] | |
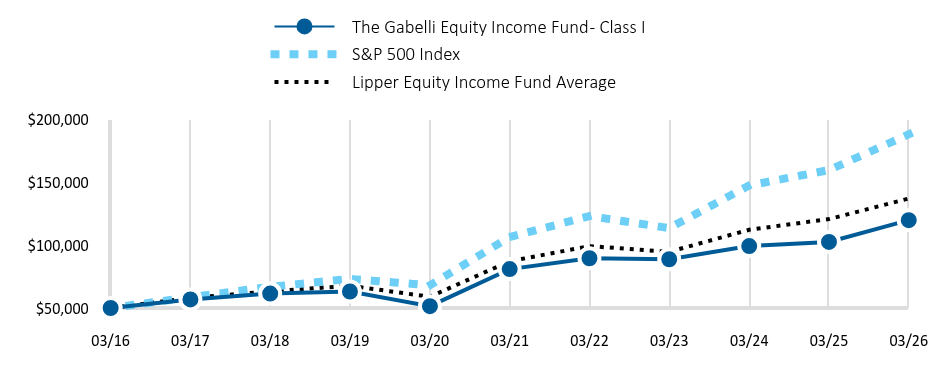
| Fund Name | The Gabelli Equity Income Fund |
| Class Name | Class I |
| Trading Symbol | GCIEX |
| Annual or Semi-Annual Statement [Text Block] | This semi-annual shareholder report contains important information about The Gabelli Equity Income Fund (the "Fund") for the period of October 1, 2025 to March 31, 2026. |
| Shareholder Report Annual or Semi-Annual | semi-annual shareholder report |
| Additional Information [Text Block] | You may find additional information about the Fund at https://gabelli.com/ticker/GCIEX/. You may also request information by contacting us at 800-GABELLI (800-422-3554). |
| Additional Information Phone Number | 800-GABELLI (800-422-3554) |
| Additional Information Website | https://gabelli.com/ticker/GCIEX/ |
| Expenses [Text Block] | |
| Expenses Paid, Amount | $ 62 |
| Expense Ratio, Percent | 1.21% |
| Performance Past Does Not Indicate Future [Text] | Past performance does not guarantee future results. |
| Line Graph [Table Text Block] | |
| Average Annual Return [Table Text Block] | |
| No Deduction of Taxes [Text Block] | The table and graph presented above do not reflect the deduction of taxes a shareholder would pay on Fund distributions or the redemption of Fund shares. |
| AssetsNet | $ 441,639,249 |
| Holdings Count | Holding | 215 |
| Advisory Fees Paid, Amount | $ 2,258,746 |
| InvestmentCompanyPortfolioTurnover | 1.00% |
| Additional Fund Statistics [Text Block] | |
| Holdings [Text Block] | |
| Material Fund Change [Text Block] | |
| Updated Prospectus Phone Number | 800-GABELLI (800-422-3554) |
| Updated Prospectus Email Address | <span style="box-sizing: border-box; color: rgb(0, 0, 0); display: inline; flex-wrap: nowrap; font-size: 12px; font-weight: 400; grid-area: auto; line-height: 18px; margin: 0px; overflow: visible; text-align: justify; text-align-last: left; white-space-collapse: preserve-breaks;">info@gabelli.com</span> |
| Updated Prospectus Web Address | https://gabelli.com/ticker/GCIEX/ |
| C000002850 | |
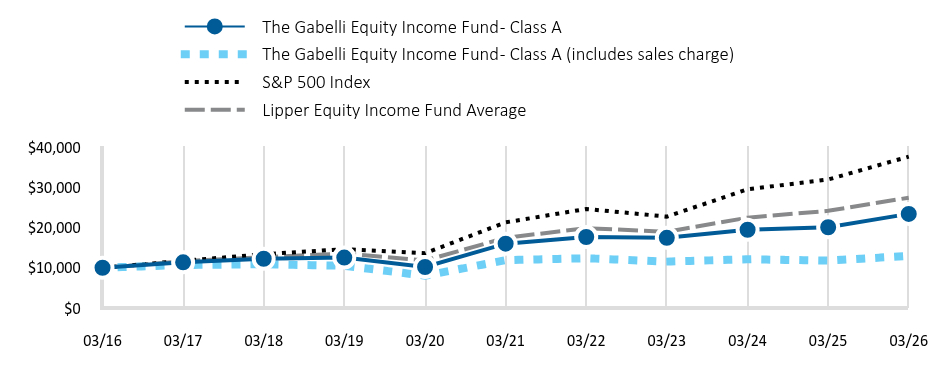
| Shareholder Report [Line Items] | |
| Fund Name | The Gabelli Equity Income Fund |
| Class Name | Class A |
| Trading Symbol | GCAEX |
| Annual or Semi-Annual Statement [Text Block] | This semi-annual shareholder report contains important information about The Gabelli Equity Income Fund (the "Fund") for the period of October 1, 2025 to March 31, 2026. |
| Shareholder Report Annual or Semi-Annual | semi-annual shareholder report |
| Additional Information [Text Block] | You may find additional information about the Fund at https://gabelli.com/ticker/GCAEX/. You may also request information by contacting us at 800-GABELLI (800-422-3554). |
| Additional Information Phone Number | 800-GABELLI (800-422-3554) |
| Additional Information Website | https://gabelli.com/ticker/GCAEX/ |
| Expenses [Text Block] | |
| Expenses Paid, Amount | $ 74 |
| Expense Ratio, Percent | 1.46% |
| Performance Past Does Not Indicate Future [Text] | Past performance does not guarantee future results. |
| Line Graph [Table Text Block] | |
| Average Annual Return [Table Text Block] | |
| No Deduction of Taxes [Text Block] | The table and graph presented above do not reflect the deduction of taxes a shareholder would pay on Fund distributions or the redemption of Fund shares. |
| AssetsNet | $ 441,639,249 |
| Holdings Count | Holding | 215 |
| Advisory Fees Paid, Amount | $ 2,258,746 |
| InvestmentCompanyPortfolioTurnover | 1.00% |
| Additional Fund Statistics [Text Block] | |
| Holdings [Text Block] | |
| Material Fund Change [Text Block] | |
| Updated Prospectus Phone Number | 800-GABELLI (800-422-3554) |
| Updated Prospectus Email Address | <span style="box-sizing: border-box; color: rgb(0, 0, 0); display: inline; flex-wrap: nowrap; font-size: 12px; font-weight: 400; grid-area: auto; line-height: 18px; margin: 0px; overflow: visible; text-align: justify; text-align-last: left; white-space-collapse: preserve-breaks;">info@gabelli.com</span> |
| Updated Prospectus Web Address | https://gabelli.com/ticker/GCAEX/ |
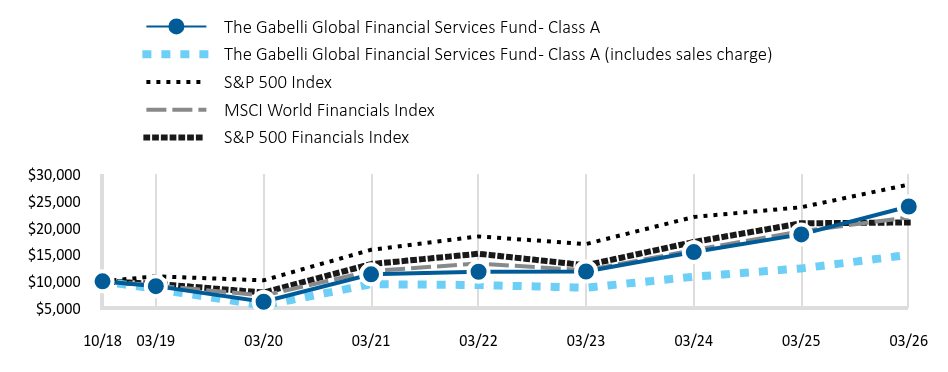
| C000203681 | |
| Shareholder Report [Line Items] | |
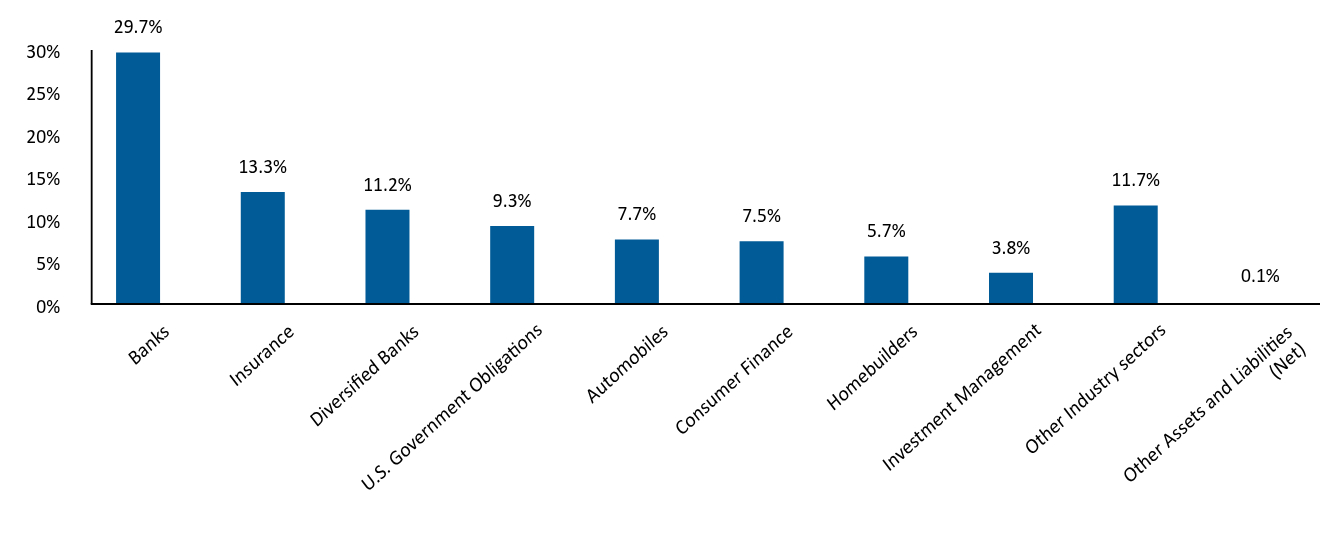
| Fund Name | The Gabelli Global Financial Services Fund |
| Class Name | Class A |
| Trading Symbol | GGFSX |
| Annual or Semi-Annual Statement [Text Block] | This semi-annual shareholder report contains important information about The Gabelli Global Financial Services Fund (the "Fund") for the period of October 1, 2025 to March 31, 2026. |
| Shareholder Report Annual or Semi-Annual | semi-annual shareholder report |
| Additional Information [Text Block] | You may find additional information about the Fund at https://gabelli.com/ticker/GGFSX/. You may also request information by contacting us at 800-GABELLI (800-422-3554). |
| Additional Information Phone Number | 800-GABELLI (800-422-3554) |
| Additional Information Website | https://gabelli.com/ticker/GGFSX/ |
| Expenses [Text Block] | |
| Expenses Paid, Amount | $ 64 |
| Expense Ratio, Percent | 1.25% |
| Performance Past Does Not Indicate Future [Text] | Past performance does not guarantee future results. |
| Line Graph [Table Text Block] | |
| Average Annual Return [Table Text Block] | |
| No Deduction of Taxes [Text Block] | The table and graph presented above do not reflect the deduction of taxes a shareholder would pay on Fund distributions or the redemption of Fund shares. |
| AssetsNet | $ 123,274,194 |
| Holdings Count | Holding | 52 |
| Advisory Fees Paid, Amount | $ 368,230 |
| InvestmentCompanyPortfolioTurnover | 13.00% |
| Additional Fund Statistics [Text Block] | |
| Holdings [Text Block] | |
| Material Fund Change [Text Block] | |
| Updated Prospectus Phone Number | 800-GABELLI (800-422-3554) |
| Updated Prospectus Email Address | <span style="box-sizing: border-box; color: rgb(0, 0, 0); display: inline; flex-wrap: nowrap; font-size: 12px; font-weight: 400; grid-area: auto; line-height: 18px; margin: 0px; overflow: visible; text-align: justify; text-align-last: left; white-space-collapse: preserve-breaks;">info@gabelli.com</span> |
| Updated Prospectus Web Address | https://gabelli.com/ticker/GGFSX/ |
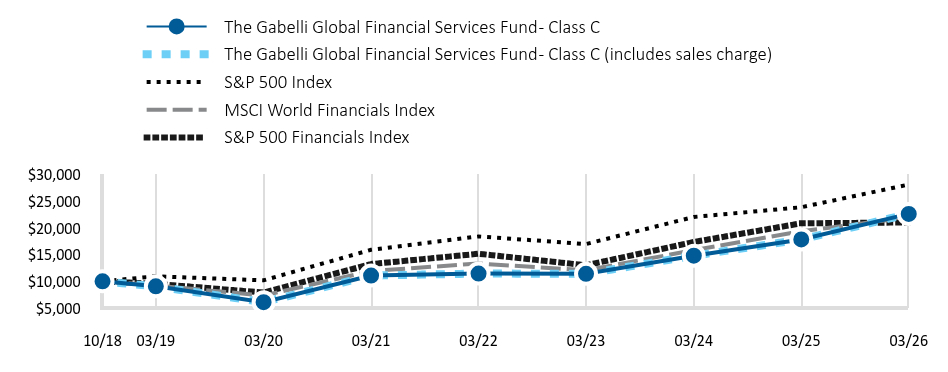
| C000203683 | |
| Shareholder Report [Line Items] | |
| Fund Name | The Gabelli Global Financial Services Fund |
| Class Name | Class C |
| Trading Symbol | GCFSX |
| Annual or Semi-Annual Statement [Text Block] | This semi-annual shareholder report contains important information about The Gabelli Global Financial Services Fund (the "Fund") for the period of October 1, 2025 to March 31, 2026. |
| Shareholder Report Annual or Semi-Annual | semi-annual shareholder report |
| Additional Information [Text Block] | You may find additional information about the Fund at https://gabelli.com/ticker/GCFSX/. You may also request information by contacting us at 800-GABELLI (800-422-3554). |
| Additional Information Phone Number | 800-GABELLI (800-422-3554) |
| Additional Information Website | https://gabelli.com/ticker/GCFSX/ |
| Expenses [Text Block] | |
| Expenses Paid, Amount | $ 102 |
| Expense Ratio, Percent | 2.00% |
| Performance Past Does Not Indicate Future [Text] | Past performance does not guarantee future results. |
| Line Graph [Table Text Block] | |
| Average Annual Return [Table Text Block] | |
| No Deduction of Taxes [Text Block] | The table and graph presented above do not reflect the deduction of taxes a shareholder would pay on Fund distributions or the redemption of Fund shares. |
| AssetsNet | $ 123,274,194 |
| Holdings Count | Holding | 52 |
| Advisory Fees Paid, Amount | $ 368,230 |
| InvestmentCompanyPortfolioTurnover | 13.00% |
| Additional Fund Statistics [Text Block] | |
| Holdings [Text Block] | |
| Material Fund Change [Text Block] | |
| Updated Prospectus Phone Number | 800-GABELLI (800-422-3554) |
| Updated Prospectus Email Address | <span style="box-sizing: border-box; color: rgb(0, 0, 0); display: inline; flex-wrap: nowrap; font-size: 12px; font-weight: 400; grid-area: auto; line-height: 18px; margin: 0px; overflow: visible; text-align: justify; text-align-last: left; white-space-collapse: preserve-breaks;">info@gabelli.com</span> |
| Updated Prospectus Web Address | https://gabelli.com/ticker/GCFSX/ |
| C000203680 | |
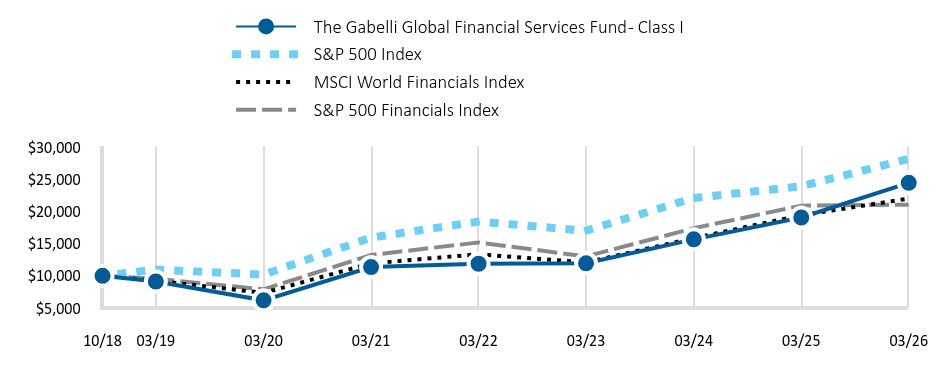
| Shareholder Report [Line Items] | |
| Fund Name | The Gabelli Global Financial Services Fund |
| Class Name | Class I |
| Trading Symbol | GFSIX |
| Annual or Semi-Annual Statement [Text Block] | This semi-annual shareholder report contains important information about The Gabelli Global Financial Services Fund (the "Fund") for the period of October 1, 2025 to March 31, 2026. |
| Shareholder Report Annual or Semi-Annual | semi-annual shareholder report |
| Additional Information [Text Block] | You may find additional information about the Fund at https://gabelli.com/ticker/GFSIX/. You may also request information by contacting us at 800-GABELLI (800-422-3554). |
| Additional Information Phone Number | 800-GABELLI (800-422-3554) |
| Additional Information Website | https://gabelli.com/ticker/GFSIX/ |
| Expenses [Text Block] | |
| Expenses Paid, Amount | $ 51 |
| Expense Ratio, Percent | 1.00% |
| Performance Past Does Not Indicate Future [Text] | Past performance does not guarantee future results. |
| Line Graph [Table Text Block] | |
| Average Annual Return [Table Text Block] | |
| No Deduction of Taxes [Text Block] | The table and graph presented above do not reflect the deduction of taxes a shareholder would pay on Fund distributions or the redemption of Fund shares. |
| AssetsNet | $ 123,274,194 |
| Holdings Count | Holding | 52 |
| Advisory Fees Paid, Amount | $ 368,230 |
| InvestmentCompanyPortfolioTurnover | 13.00% |
| Additional Fund Statistics [Text Block] | |
| Holdings [Text Block] | |
| Material Fund Change [Text Block] | |
| Updated Prospectus Phone Number | 800-GABELLI (800-422-3554) |
| Updated Prospectus Email Address | <span style="box-sizing: border-box; color: rgb(0, 0, 0); display: inline; flex-wrap: nowrap; font-size: 12px; font-weight: 400; grid-area: auto; line-height: 18px; margin: 0px; overflow: visible; text-align: justify; text-align-last: left; white-space-collapse: preserve-breaks;">info@gabelli.com</span> |
| Updated Prospectus Web Address | https://gabelli.com/ticker/GFSIX/ |
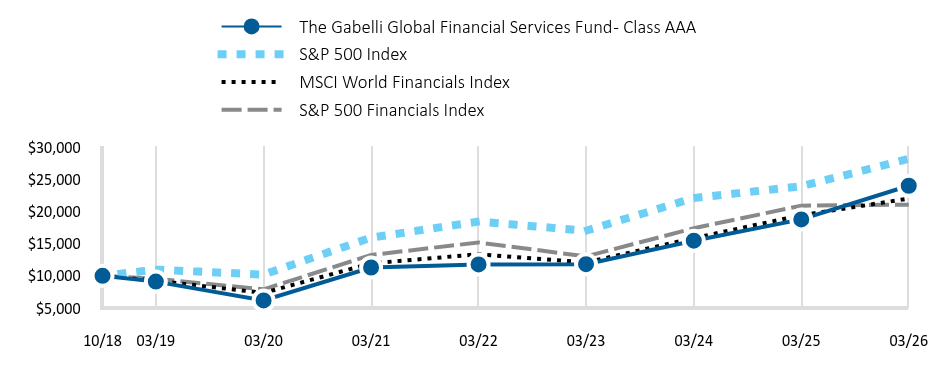
| C000203682 | |
| Shareholder Report [Line Items] | |
| Fund Name | The Gabelli Global Financial Services Fund |
| Class Name | Class AAA |
| Trading Symbol | GAFSX |
| Annual or Semi-Annual Statement [Text Block] | This semi-annual shareholder report contains important information about The Gabelli Global Financial Services Fund (the "Fund") for the period of October 1, 2025 to March 31, 2026. |
| Shareholder Report Annual or Semi-Annual | semi-annual shareholder report |
| Additional Information [Text Block] | You may find additional information about the Fund at https://gabelli.com/ticker/GAFSX/. You may also request information by contacting us at 800-GABELLI (800-422-3554). |
| Additional Information Phone Number | 800-GABELLI (800-422-3554) |
| Additional Information Website | https://gabelli.com/ticker/GAFSX/ |
| Expenses [Text Block] | |
| Expenses Paid, Amount | $ 64 |
| Expense Ratio, Percent | 1.25% |
| Performance Past Does Not Indicate Future [Text] | Past performance does not guarantee future results. |
| Line Graph [Table Text Block] | |
| Average Annual Return [Table Text Block] | |
| No Deduction of Taxes [Text Block] | The table and graph presented above do not reflect the deduction of taxes a shareholder would pay on Fund distributions or the redemption of Fund shares. |
| AssetsNet | $ 123,274,194 |
| Holdings Count | Holding | 52 |
| Advisory Fees Paid, Amount | $ 368,230 |
| InvestmentCompanyPortfolioTurnover | 13.00% |
| Additional Fund Statistics [Text Block] | |
| Holdings [Text Block] | |
| Material Fund Change [Text Block] | |
| Updated Prospectus Phone Number | 800-GABELLI (800-422-3554) |
| Updated Prospectus Email Address | <span style="box-sizing: border-box; color: rgb(0, 0, 0); display: inline; flex-wrap: nowrap; font-size: 12px; font-weight: 400; grid-area: auto; line-height: 18px; margin: 0px; overflow: visible; text-align: justify; text-align-last: left; white-space-collapse: preserve-breaks;">info@gabelli.com</span> |
| Updated Prospectus Web Address | https://gabelli.com/ticker/GAFSX/ |
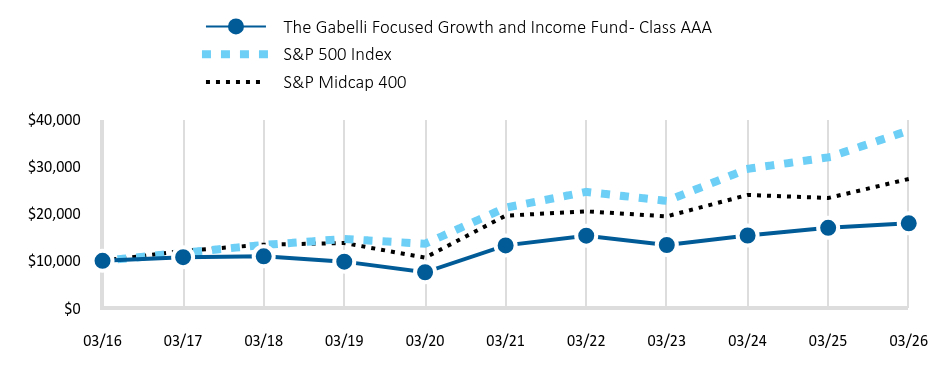
| C000002861 | |
| Shareholder Report [Line Items] | |
| Fund Name | The Gabelli Focused Growth and Income Fund |
| Class Name | Class AAA |
| Trading Symbol | GWSVX |
| Annual or Semi-Annual Statement [Text Block] | This semi-annual shareholder report contains important information about The Gabelli Focused Growth and Income Fund (the "Fund") for the period of October 1, 2025 to March 31, 2026. |
| Shareholder Report Annual or Semi-Annual | semi-annual shareholder report |
| Additional Information [Text Block] | You may find additional information about the Fund at https://gabelli.com/ticker/GWSVX/. You may also request information by contacting us at 800-GABELLI (800-422-3554). |
| Additional Information Phone Number | 800-GABELLI (800-422-3554) |
| Additional Information Website | https://gabelli.com/ticker/GWSVX/ |
| Expenses [Text Block] | |
| Expenses Paid, Amount | $ 90 |
| Expense Ratio, Percent | 1.76% |
| Performance Past Does Not Indicate Future [Text] | Past performance does not guarantee future results. |
| Line Graph [Table Text Block] | |
| Average Annual Return [Table Text Block] | |
| No Deduction of Taxes [Text Block] | The table and graph presented above do not reflect the deduction of taxes a shareholder would pay on Fund distributions or the redemption of Fund shares. |
| AssetsNet | $ 45,514,494 |
| Holdings Count | Holding | 41 |
| Advisory Fees Paid, Amount | $ 106,571 |
| InvestmentCompanyPortfolioTurnover | 13.00% |
| Additional Fund Statistics [Text Block] | |
| Holdings [Text Block] | |
| Material Fund Change [Text Block] | |
| Updated Prospectus Phone Number | 800-GABELLI (800-422-3554) |
| Updated Prospectus Email Address | <span style="box-sizing: border-box; color: rgb(0, 0, 0); display: inline; flex-wrap: nowrap; font-size: 12px; font-weight: 400; grid-area: auto; line-height: 18px; margin: 0px; overflow: visible; text-align: justify; text-align-last: left; white-space-collapse: preserve-breaks;">info@gabelli.com</span> |
| Updated Prospectus Web Address | https://gabelli.com/ticker/GWSVX/ |
| C000002860 | |
| Shareholder Report [Line Items] | |
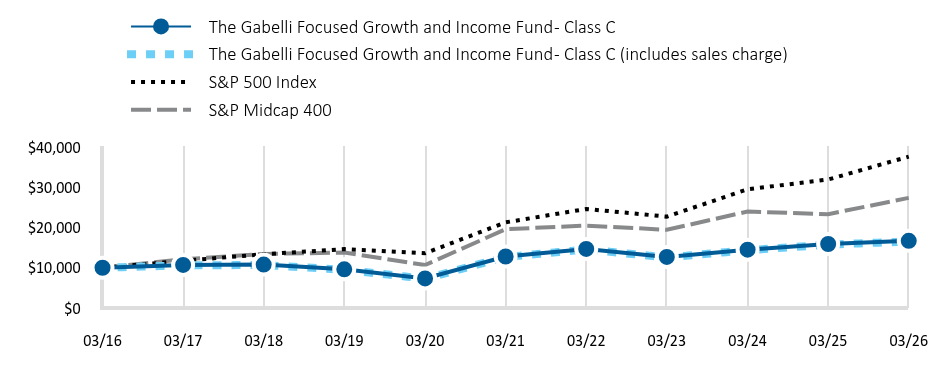
| Fund Name | The Gabelli Focused Growth and Income Fund |
| Class Name | Class C |
| Trading Symbol | GWSCX |
| Annual or Semi-Annual Statement [Text Block] | This semi-annual shareholder report contains important information about The Gabelli Focused Growth and Income Fund (the "Fund") for the period of October 1, 2025 to March 31, 2026. |
| Shareholder Report Annual or Semi-Annual | semi-annual shareholder report |
| Additional Information [Text Block] | You may find additional information about the Fund at https://gabelli.com/ticker/GWSCX/. You may also request information by contacting us at 800-GABELLI (800-422-3554). |
| Additional Information Phone Number | 800-GABELLI (800-422-3554) |
| Additional Information Website | https://gabelli.com/ticker/GWSCX/ |
| Expenses [Text Block] | |
| Expenses Paid, Amount | $ 129 |
| Expense Ratio, Percent | 2.51% |
| Performance Past Does Not Indicate Future [Text] | Past performance does not guarantee future results. |
| Line Graph [Table Text Block] | |
| Average Annual Return [Table Text Block] | |
| No Deduction of Taxes [Text Block] | The table and graph presented above do not reflect the deduction of taxes a shareholder would pay on Fund distributions or the redemption of Fund shares. |
| AssetsNet | $ 45,514,494 |
| Holdings Count | Holding | 41 |
| Advisory Fees Paid, Amount | $ 106,571 |
| InvestmentCompanyPortfolioTurnover | 13.00% |
| Additional Fund Statistics [Text Block] | |
| Holdings [Text Block] | |
| Material Fund Change [Text Block] | |
| Updated Prospectus Phone Number | 800-GABELLI (800-422-3554) |
| Updated Prospectus Email Address | <span style="box-sizing: border-box; color: rgb(0, 0, 0); display: inline; flex-wrap: nowrap; font-size: 12px; font-weight: 400; grid-area: auto; line-height: 18px; margin: 0px; overflow: visible; text-align: justify; text-align-last: left; white-space-collapse: preserve-breaks;">info@gabelli.com</span> |
| Updated Prospectus Web Address | https://gabelli.com/ticker/GWSCX/ |
| C000061074 | |
| Shareholder Report [Line Items] | |
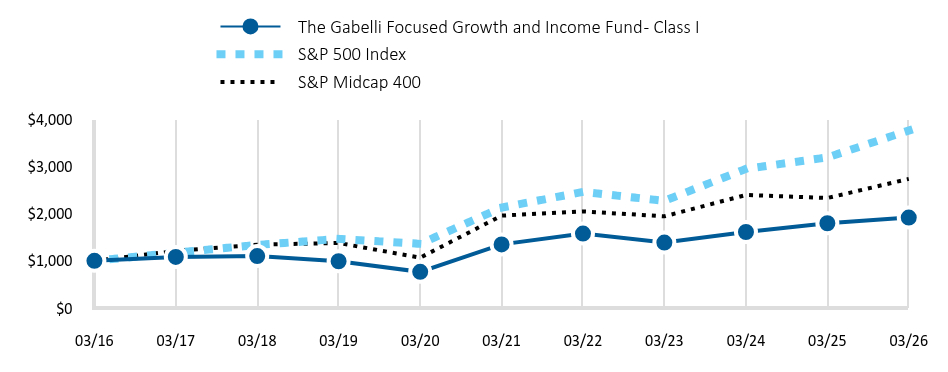
| Fund Name | The Gabelli Focused Growth and Income Fund |
| Class Name | Class I |
| Trading Symbol | GWSIX |
| Annual or Semi-Annual Statement [Text Block] | This semi-annual shareholder report contains important information about The Gabelli Focused Growth and Income Fund (the "Fund") for the period of October 1, 2025 to March 31, 2026. |
| Shareholder Report Annual or Semi-Annual | semi-annual shareholder report |
| Additional Information [Text Block] | You may find additional information about the Fund at https://gabelli.com/ticker/GWSIX/. You may also request information by contacting us at 800-GABELLI (800-422-3554). |
| Additional Information Phone Number | 800-GABELLI (800-422-3554) |
| Additional Information Website | https://gabelli.com/ticker/GWSIX/ |
| Expenses [Text Block] | |
| Expenses Paid, Amount | $ 41 |
| Expense Ratio, Percent | 0.80% |
| Performance Past Does Not Indicate Future [Text] | Past performance does not guarantee future results. |
| Line Graph [Table Text Block] | |
| Average Annual Return [Table Text Block] | |
| No Deduction of Taxes [Text Block] | The table and graph presented above do not reflect the deduction of taxes a shareholder would pay on Fund distributions or the redemption of Fund shares. |
| AssetsNet | $ 45,514,494 |
| Holdings Count | Holding | 41 |
| Advisory Fees Paid, Amount | $ 106,571 |
| InvestmentCompanyPortfolioTurnover | 13.00% |
| Additional Fund Statistics [Text Block] | |
| Holdings [Text Block] | |
| Material Fund Change [Text Block] | |
| Updated Prospectus Phone Number | 800-GABELLI (800-422-3554) |
| Updated Prospectus Email Address | <span style="box-sizing: border-box; color: rgb(0, 0, 0); display: inline; flex-wrap: nowrap; font-size: 12px; font-weight: 400; grid-area: auto; line-height: 18px; margin: 0px; overflow: visible; text-align: justify; text-align-last: left; white-space-collapse: preserve-breaks;">info@gabelli.com</span> |
| Updated Prospectus Web Address | https://gabelli.com/ticker/GWSIX/ |
| C000002858 | |
| Shareholder Report [Line Items] | |
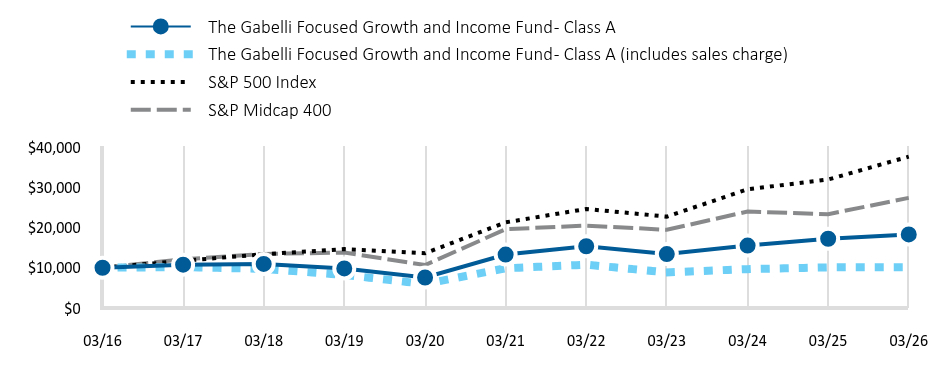
| Fund Name | The Gabelli Focused Growth and Income Fund |
| Class Name | Class A |
| Trading Symbol | GWSAX |
| Annual or Semi-Annual Statement [Text Block] | This semi-annual shareholder report contains important information about The Gabelli Focused Growth and Income Fund (the "Fund") for the period of October 1, 2025 to March 31, 2026. |
| Shareholder Report Annual or Semi-Annual | semi-annual shareholder report |
| Additional Information [Text Block] | You may find additional information about the Fund at https://gabelli.com/ticker/GWSAX/. You may also request information by contacting us at 800-GABELLI (800-422-3554). |
| Additional Information Phone Number | 800-GABELLI (800-422-3554) |
| Additional Information Website | https://gabelli.com/ticker/GWSAX/ |
| Expenses [Text Block] | |
| Expenses Paid, Amount | $ 64 |
| Expense Ratio, Percent | 1.25% |
| Performance Past Does Not Indicate Future [Text] | Past performance does not guarantee future results. |
| Line Graph [Table Text Block] | |
| Average Annual Return [Table Text Block] | |
| No Deduction of Taxes [Text Block] | The table and graph presented above do not reflect the deduction of taxes a shareholder would pay on Fund distributions or the redemption of Fund shares. |
| AssetsNet | $ 45,514,494 |
| Holdings Count | Holding | 41 |
| Advisory Fees Paid, Amount | $ 106,571 |
| InvestmentCompanyPortfolioTurnover | 13.00% |
| Additional Fund Statistics [Text Block] | |
| Holdings [Text Block] | |
| Material Fund Change [Text Block] | |
| Updated Prospectus Phone Number | 800-GABELLI (800-422-3554) |
| Updated Prospectus Email Address | <span style="box-sizing: border-box; color: rgb(0, 0, 0); display: inline; flex-wrap: nowrap; font-size: 12px; font-weight: 400; grid-area: auto; line-height: 18px; margin: 0px; overflow: visible; text-align: justify; text-align-last: left; white-space-collapse: preserve-breaks;">info@gabelli.com</span> |
| Updated Prospectus Web Address | https://gabelli.com/ticker/GWSAX/ |
| C000002855 | |
| Shareholder Report [Line Items] | |
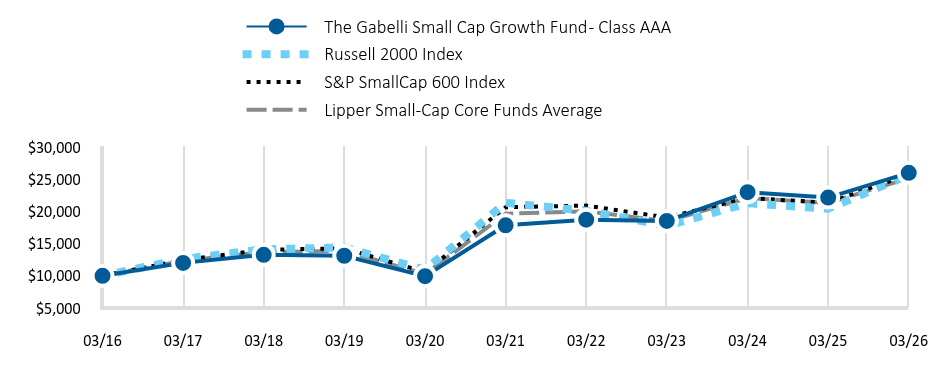
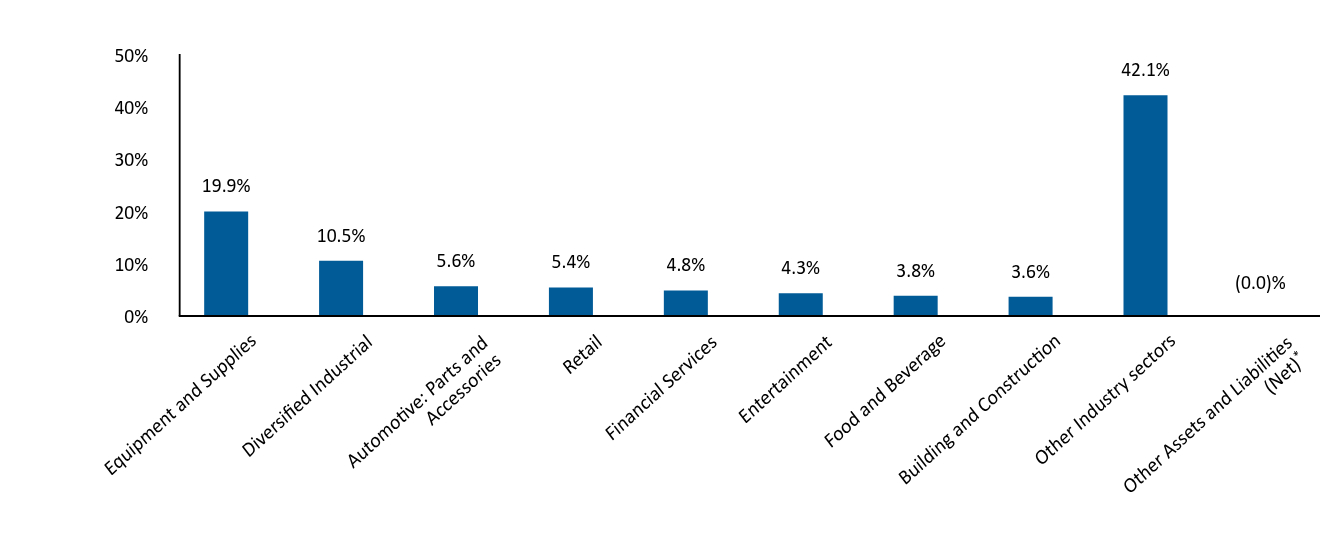
| Fund Name | The Gabelli Small Cap Growth Fund |
| Class Name | Class AAA |
| Trading Symbol | GABSX |
| Annual or Semi-Annual Statement [Text Block] | This semi-annual shareholder report contains important information about The Gabelli Small Cap Growth Fund (the "Fund") for the period of October 1, 2025 to March 31, 2026. |
| Shareholder Report Annual or Semi-Annual | semi-annual shareholder report |
| Additional Information [Text Block] | You may find additional information about the Fund at https://gabelli.com/ticker/GABSX/. You may also request information by contacting us at 800-GABELLI (800-422-3554). |
| Additional Information Phone Number | 800-GABELLI (800-422-3554) |
| Additional Information Website | https://gabelli.com/ticker/GABSX/ |
| Expenses [Text Block] | |
| Expenses Paid, Amount | $ 69 |
| Expense Ratio, Percent | 1.37% |
| Performance Past Does Not Indicate Future [Text] | Past performance does not guarantee future results. |
| Line Graph [Table Text Block] | |
| Average Annual Return [Table Text Block] | |
| No Deduction of Taxes [Text Block] | The table and graph presented above do not reflect the deduction of taxes a shareholder would pay on Fund distributions or the redemption of Fund shares. |
| AssetsNet | $ 1,813,787,223 |
| Holdings Count | Holding | 444 |
| Advisory Fees Paid, Amount | $ 9,173,568 |
| InvestmentCompanyPortfolioTurnover | 2.00% |
| Additional Fund Statistics [Text Block] | |
| Holdings [Text Block] | |
| Material Fund Change [Text Block] | |
| Updated Prospectus Phone Number | 800-GABELLI (800-422-3554) |
| Updated Prospectus Email Address | <span style="box-sizing: border-box; color: rgb(0, 0, 0); display: inline; flex-wrap: nowrap; font-size: 12px; font-weight: 400; grid-area: auto; line-height: 18px; margin: 0px; overflow: visible; text-align: justify; text-align-last: left; white-space-collapse: preserve-breaks;">info@gabelli.com</span> |
| Updated Prospectus Web Address | https://gabelli.com/ticker/GABSX/ |
| C000002857 | |
| Shareholder Report [Line Items] | |
| Fund Name | The Gabelli Small Cap Growth Fund |
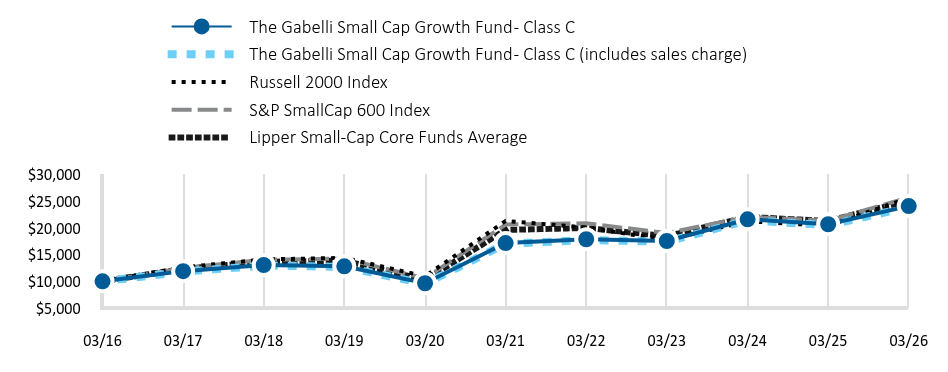
| Class Name | Class C |
| Trading Symbol | GCCSX |
| Annual or Semi-Annual Statement [Text Block] | This semi-annual shareholder report contains important information about The Gabelli Small Cap Growth Fund (the "Fund") for the period of October 1, 2025 to March 31, 2026. |
| Shareholder Report Annual or Semi-Annual | semi-annual shareholder report |
| Additional Information [Text Block] | You may find additional information about the Fund at https://gabelli.com/ticker/GCCSX/. You may also request information by contacting us at 800-GABELLI (800-422-3554). |
| Additional Information Phone Number | 800-GABELLI (800-422-3554) |
| Additional Information Website | https://gabelli.com/ticker/GCCSX/ |
| Expenses [Text Block] | |
| Expenses Paid, Amount | $ 107 |
| Expense Ratio, Percent | 2.12% |
| Performance Past Does Not Indicate Future [Text] | Past performance does not guarantee future results. |
| Line Graph [Table Text Block] | |
| Average Annual Return [Table Text Block] | |
| No Deduction of Taxes [Text Block] | The table and graph presented above do not reflect the deduction of taxes a shareholder would pay on Fund distributions or the redemption of Fund shares. |
| AssetsNet | $ 1,813,787,223 |
| Holdings Count | Holding | 444 |
| Advisory Fees Paid, Amount | $ 9,173,568 |
| InvestmentCompanyPortfolioTurnover | 2.00% |
| Additional Fund Statistics [Text Block] | |
| Holdings [Text Block] | |
| Material Fund Change [Text Block] | |
| Updated Prospectus Phone Number | 800-GABELLI (800-422-3554) |
| Updated Prospectus Email Address | <span style="box-sizing: border-box; color: rgb(0, 0, 0); display: inline; flex-wrap: nowrap; font-size: 12px; font-weight: 400; grid-area: auto; line-height: 18px; margin: 0px; overflow: visible; text-align: justify; text-align-last: left; white-space-collapse: preserve-breaks;">info@gabelli.com</span> |
| Updated Prospectus Web Address | https://gabelli.com/ticker/GCCSX/ |
| C000061073 | |
| Shareholder Report [Line Items] | |
| Fund Name | The Gabelli Small Cap Growth Fund |
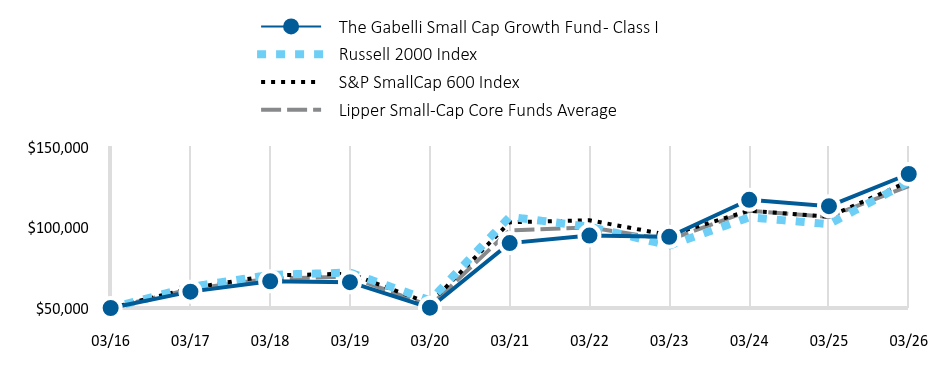
| Class Name | Class I |
| Trading Symbol | GACIX |
| Annual or Semi-Annual Statement [Text Block] | This semi-annual shareholder report contains important information about The Gabelli Small Cap Growth Fund (the "Fund") for the period of October 1, 2025 to March 31, 2026. |
| Shareholder Report Annual or Semi-Annual | semi-annual shareholder report |
| Additional Information [Text Block] | You may find additional information about the Fund at https://gabelli.com/ticker/GACIX/. You may also request information by contacting us at 800-GABELLI (800-422-3554). |
| Additional Information Phone Number | 800-GABELLI (800-422-3554) |
| Additional Information Website | https://gabelli.com/ticker/GACIX/ |
| Expenses [Text Block] | |
| Expenses Paid, Amount | $ 57 |
| Expense Ratio, Percent | 1.12% |
| Performance Past Does Not Indicate Future [Text] | Past performance does not guarantee future results. |
| Line Graph [Table Text Block] | |
| Average Annual Return [Table Text Block] | |
| No Deduction of Taxes [Text Block] | The table and graph presented above do not reflect the deduction of taxes a shareholder would pay on Fund distributions or the redemption of Fund shares. |
| AssetsNet | $ 1,813,787,223 |
| Holdings Count | Holding | 444 |
| Advisory Fees Paid, Amount | $ 9,173,568 |
| InvestmentCompanyPortfolioTurnover | 2.00% |
| Additional Fund Statistics [Text Block] | |
| Holdings [Text Block] | |
| Material Fund Change [Text Block] | |
| Updated Prospectus Phone Number | 800-GABELLI (800-422-3554) |
| Updated Prospectus Email Address | <span style="box-sizing: border-box; color: rgb(0, 0, 0); display: inline; flex-wrap: nowrap; font-size: 12px; font-weight: 400; grid-area: auto; line-height: 18px; margin: 0px; overflow: visible; text-align: justify; text-align-last: left; white-space-collapse: preserve-breaks;">info@gabelli.com</span> |
| Updated Prospectus Web Address | https://gabelli.com/ticker/GACIX/ |
| C000002854 | |
| Shareholder Report [Line Items] | |
| Fund Name | The Gabelli Small Cap Growth Fund |
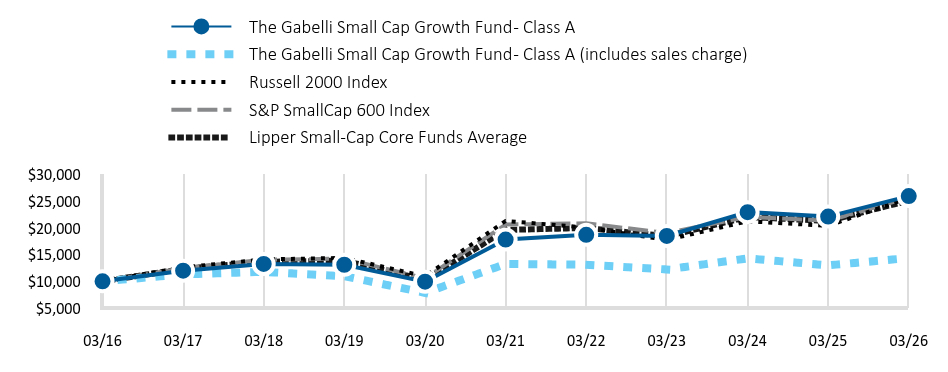
| Class Name | Class A |
| Trading Symbol | GCASX |
| Annual or Semi-Annual Statement [Text Block] | This semi-annual shareholder report contains important information about The Gabelli Small Cap Growth Fund (the "Fund") for the period of October 1, 2025 to March 31, 2026. |
| Shareholder Report Annual or Semi-Annual | semi-annual shareholder report |
| Additional Information [Text Block] | You may find additional information about the Fund at https://gabelli.com/ticker/GCASX/. You may also request information by contacting us at 800-GABELLI (800-422-3554). |
| Additional Information Phone Number | 800-GABELLI (800-422-3554) |
| Additional Information Website | https://gabelli.com/ticker/GCASX/ |
| Expenses [Text Block] | |
| Expenses Paid, Amount | $ 69 |
| Expense Ratio, Percent | 1.37% |
| Performance Past Does Not Indicate Future [Text] | Past performance does not guarantee future results. |
| Line Graph [Table Text Block] | |
| Average Annual Return [Table Text Block] | |
| No Deduction of Taxes [Text Block] | The table and graph presented above do not reflect the deduction of taxes a shareholder would pay on Fund distributions or the redemption of Fund shares. |
| AssetsNet | $ 1,813,787,223 |
| Holdings Count | Holding | 444 |
| Advisory Fees Paid, Amount | $ 9,173,568 |
| InvestmentCompanyPortfolioTurnover | 2.00% |
| Additional Fund Statistics [Text Block] | |
| Holdings [Text Block] | |
| Material Fund Change [Text Block] | |
| Updated Prospectus Phone Number | 800-GABELLI (800-422-3554) |
| Updated Prospectus Email Address | <span style="box-sizing: border-box; color: rgb(0, 0, 0); display: inline; flex-wrap: nowrap; font-size: 12px; font-weight: 400; grid-area: auto; line-height: 18px; margin: 0px; overflow: visible; text-align: justify; text-align-last: left; white-space-collapse: preserve-breaks;">info@gabelli.com</span> |
| Updated Prospectus Web Address | https://gabelli.com/ticker/GCASX/ |