Shareholder Report
|
12 Months Ended |
|
Mar. 31, 2026
USD ($)
Holding
|
|---|
| Shareholder Report [Line Items] |
|
| Document Type |
N-CSR
|
| Amendment Flag |
false
|
| Registrant Name |
Krane Shares Trust
|
| Entity Central Index Key |
0001547576
|
| Entity Investment Company Type |
N-1A
|
| Document Period End Date |
Mar. 31, 2026
|
| C000129136 |
|
| Shareholder Report [Line Items] |
|
| Fund Name |
KraneShares CSI China Internet ETF
|
| Class Name |
KraneShares CSI China Internet ETF
|
| Trading Symbol |
KWEB
|
| Security Exchange Name |
NYSEArca
|
| Annual or Semi-Annual Statement [Text Block] |
Annual Shareholder Report
|
| Shareholder Report Annual or Semi-Annual |
annual shareholder report
|
| Additional Information [Text Block] |
This annual shareholder report contains important information about the KraneShares CSI China Internet ETF (the "Fund") for the period from April 1, 2025 to March 31, 2026. You can find additional information about the Fund at https://kraneshares.com/kweb/. You can also request this information by contacting us at 1-855-857-2638.
|
| Additional Information Phone Number |
1-855-857-2638
|
| Additional Information Website |
https://kraneshares.com/kweb/
|
| Expenses [Text Block] |
What were the Fund costs for the last year?(based on a hypothetical $10,000 investment) Table SummaryFund Name | Costs of a $10,000 investment | Costs paid as a percentage of a $10,000 investment |
|---|
KraneShares CSI China Internet ETF | $64 | 0.69% |
|---|
|
| Expenses Paid, Amount |
$ 64
|
| Expense Ratio, Percent |
0.69%
|
| Factors Affecting Performance [Text Block] |
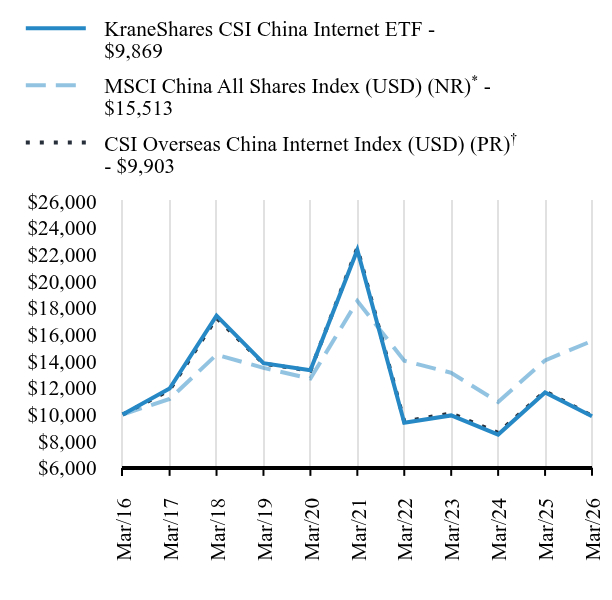
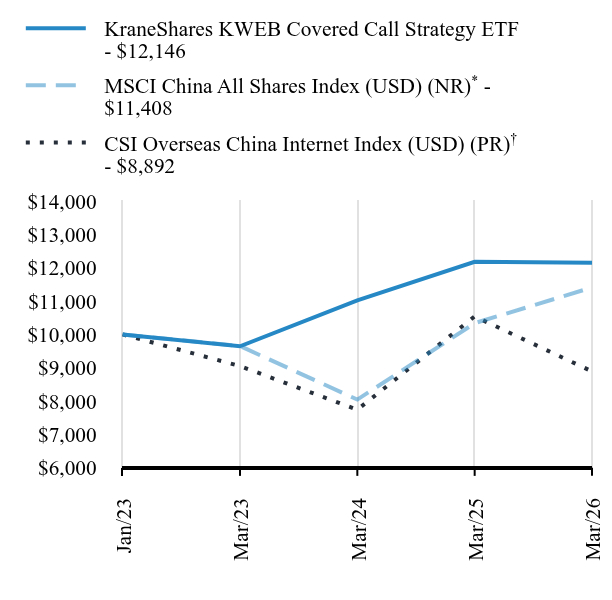
(a) CSI Overseas China Internet Index The KraneShares CSI China Internet ETF seeks to provide investment results that, before expenses and fees, correspond generally to the price and yield performance of the CSI Overseas China Internet Index (the "Underlying Index"), which is designed to measure the performance of the investable universe of publicly traded China-based companies whose primary business or businesses are in the Internet and Internet-related sectors, as defined by the index sponsor, China Securities Index Co., Ltd. China’s internet equities underperformed the broader Chinese equity market, as measured by the MSCI China All Shares Index, due to intense competition in China's E-Commerce industry, which weighed on the margins of large-cap e-commerce firms. Also, geopolitical headwinds, including tariffs, weighed on foreign investor sentiment towards China, further detracting from their performance. However, growth in artificial intelligence and cloud computing services remained strong for many China internet companies during the period. |
| Performance Past Does Not Indicate Future [Text] |
Past performance is not indicative of future performance.
|
| Line Graph [Table Text Block] |
Table Summary | KraneShares CSI China Internet ETF | MSCI China All Shares Index (USD) (NR)Footnote Reference* | CSI Overseas China Internet Index (USD) (PR)Footnote Reference† |
|---|
Mar/16 | $10,000 | $10,000 | $10,000 |
|---|
Mar/17 | $11,951 | $11,165 | $11,825 |
|---|
Mar/18 | $17,403 | $14,481 | $17,241 |
|---|
Mar/19 | $13,846 | $13,494 | $13,813 |
|---|
Mar/20 | $13,312 | $12,691 | $13,283 |
|---|
Mar/21 | $22,334 | $18,507 | $22,482 |
|---|
Mar/22 | $9,382 | $14,029 | $9,479 |
|---|
Mar/23 | $9,932 | $13,125 | $10,081 |
|---|
Mar/24 | $8,494 | $10,942 | $8,625 |
|---|
Mar/25 | $11,648 | $14,057 | $11,740 |
|---|
Mar/26 | $9,869 | $15,513 | $9,903 |
|---|
|
| Average Annual Return [Table Text Block] |
Table SummaryFund/Index Name | 1 Year | 5 Years | 10 Years |
|---|
KraneShares CSI China Internet ETF | -15.27% | -15.07% | -0.13% |
|---|
MSCI China All Shares Index (USD) (NR)Footnote Reference* | 10.36% | -3.47% | 4.49% |
|---|
CSI Overseas China Internet Index (USD) (PR)Footnote Reference† | -15.65% | -15.12% | -0.10% |
|---|
|
| No Deduction of Taxes [Text Block] |
The table and graph presented above do not reflect the deduction of taxes a shareholder would pay on Fund distributions or the redemption of Fund shares.
|
| AssetsNet |
$ 6,033,567,122
|
| Holdings Count | Holding |
32
|
| Advisory Fees Paid, Amount |
$ 52,896,988
|
| InvestmentCompanyPortfolioTurnover |
45.00%
|
| Additional Fund Statistics [Text Block] |
Key Fund Statistics as of March 31, 2026Table Summary | Total Net Assets | Number of Holdings | Total Advisory Fees Paid | Portfolio Turnover Rate |
|---|
| $6,033,567,122 | 32 | $52,896,988 | 45% |
|---|
|
| Holdings [Text Block] |
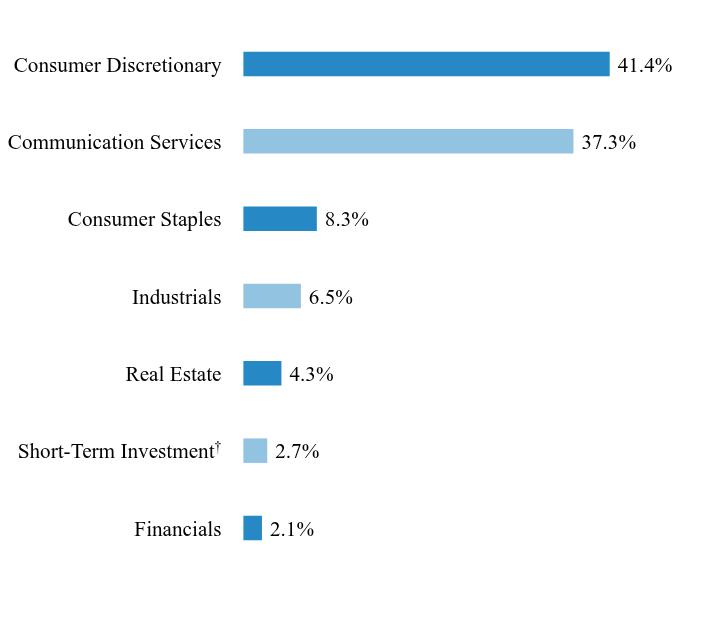
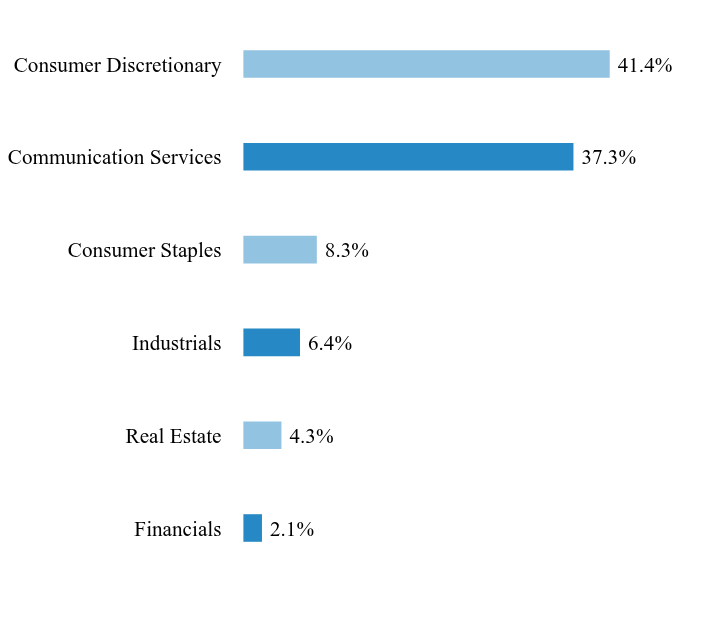
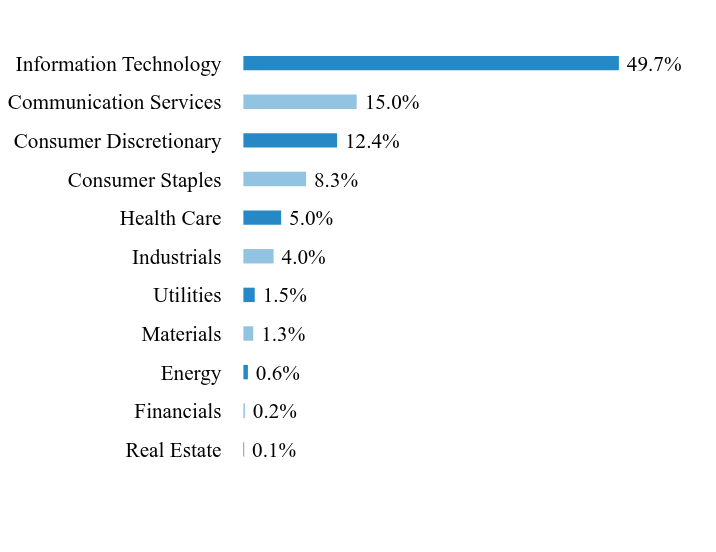
Asset/Sector WeightingsFootnote Reference*Table SummaryValue | Value |
|---|
Financials | 2.1% | Short-Term InvestmentFootnote Reference† | 2.7% | Real Estate | 4.3% | Industrials | 6.5% | Consumer Staples | 8.3% | Communication Services | 37.3% | Consumer Discretionary | 41.4% | | Footnote | Description | Footnote* | Percentages are calculated based on total net assets. | Footnote† | This security, or a portion thereof, was purchased with cash collateral held from securities on loan. |
|
| Largest Holdings [Text Block] |
Table SummaryHolding Name | | | Percentage of
Total Net AssetsFootnote Reference(A) |
|---|
Tencent Holdings | | | 10.1% | Alibaba Group Holding | | | 8.9% | PDD Holdings ADR | | | 8.8% | Meituan, Cl B | | | 7.4% | NetEase | | | 5.9% | JD.com, Cl A | | | 4.9% | KE Holdings, Cl A | | | 4.3% | Baidu, Cl A | | | 4.3% | JD Health International | | | 4.0% | Full Truck Alliance ADR | | | 3.6% | | Footnote | Description | Footnote(A) | Short-Term Investments are not shown in the top ten chart. |
|
| Material Fund Change [Text Block] |
This is a summary of certain changes to the Fund since April 1, 2025. For more complete information, you may review the Fund’s prospectus, which is available at https://kraneshares.com/kweb/#fund-documents or upon request at 1-855-857-2638. Krane Funds Advisors, LLC (“Krane” or the “Adviser”), the investment adviser to the Fund, entered into an agreement whereby its officers and employees, among others, through KFA Two Holdings, LLC, will acquire a majority interest in the Adviser from China International Capital Corporation (USA) Holdings Inc., a wholly-owned, indirect subsidiary of China International Capital Corporation Limited (the “Transaction”). Consummation of the Transaction will, under the Investment Company Act of 1940, result in the automatic termination of the Fund’s existing investment advisory and, if applicable, sub-advisory agreements. In anticipation of the Transaction, the Board approved new advisory and, if applicable, sub-advisory agreements on terms identical to the existing agreements (other than effective and termination dates), subject to shareholder approval of the new advisory agreement. The new sub-advisory agreement will take effect in reliance on a manager-of-managers exemptive order. To ensure continuity of management pending shareholder approval of the new advisory agreement, the Board also approved interim advisory and, if applicable, sub-advisory agreements, effective upon closing of the Transaction, each with terms substantially identical to the current agreements, to remain in effect for up to 150 days while shareholder approval is sought. |
| Updated Prospectus Web Address |
https://kraneshares.com/kweb/
|
| C000129571 |
|
| Shareholder Report [Line Items] |
|
| Fund Name |
KraneShares Bosera MSCI China A 50 Connect Index ETF
|
| Class Name |
KraneShares Bosera MSCI China A 50 Connect Index ETF
|
| Trading Symbol |
KBA
|
| Security Exchange Name |
NYSEArca
|
| Annual or Semi-Annual Statement [Text Block] |
Annual Shareholder Report
|
| Shareholder Report Annual or Semi-Annual |
annual shareholder report
|
| Additional Information [Text Block] |
This annual shareholder report contains important information about the KraneShares Bosera MSCI China A 50 Connect Index ETF (the "Fund") for the period from April 1, 2025 to March 31, 2026. You can find additional information about the Fund at https://kraneshares.com/kba/. You can also request this information by contacting us at 1-855-857-2638.
|
| Additional Information Phone Number |
1-855-857-2638
|
| Additional Information Website |
https://kraneshares.com/kba/
|
| Expenses [Text Block] |
What were the Fund costs for the last year?(based on a hypothetical $10,000 investment) Table SummaryFund Name | Costs of a $10,000 investment | Costs paid as a percentage of a $10,000 investment |
|---|
KraneShares Bosera MSCI China A 50 Connect Index ETF | $64 | 0.56% |
|---|
|
| Expenses Paid, Amount |
$ 64
|
| Expense Ratio, Percent |
0.56%
|
| Factors Affecting Performance [Text Block] |
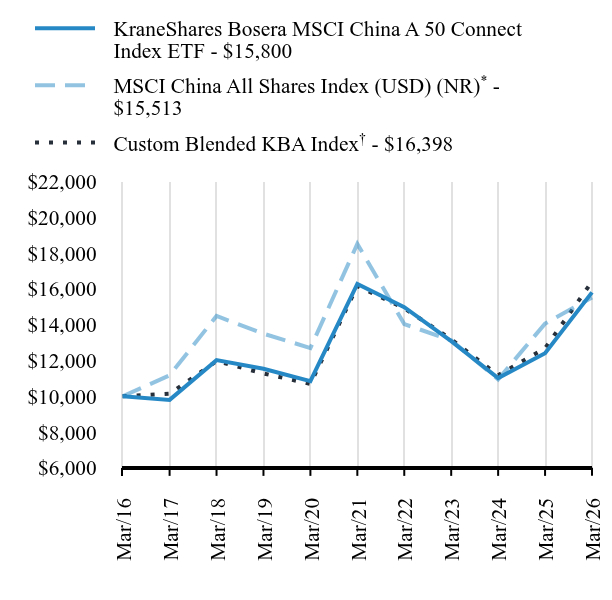
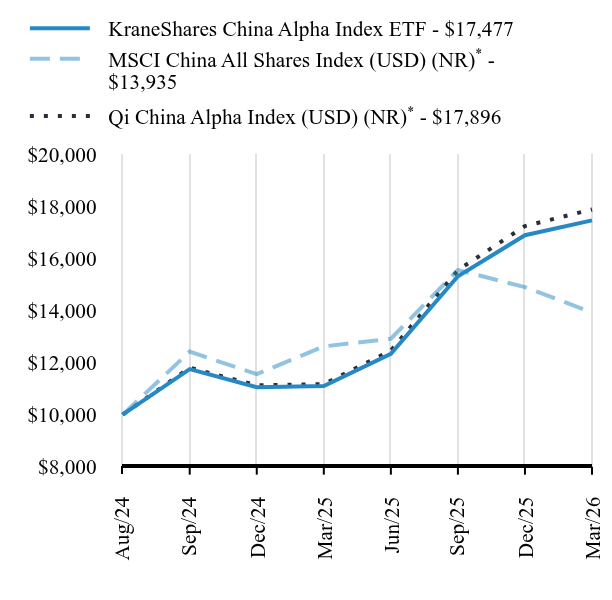
(a) MSCI China A 50 Connect Index The KraneShares Bosera MSCI China A 50 Connect Index ETF seeks to provide investment results that, before fees and expenses, correspond generally to the price and yield performance of the MSCI China A 50 Connect Index (the "Underlying Index"). The Underlying Index is constructed from the MSCI China A Index (the "Parent Index"), a broad-based benchmark index, which captures large and mid-capitalization China A-shares listed on the Shanghai Stock Exchange and/or the Shenzhen Stock Exchange and accessible through the Northbound Stock Connect program. The Underlying Index is designed to reflect the performance of the 50 largest securities representing each Global Industry Classification Standard (GICS) sector at the sector weight allocation of the Parent Index. China’s A-share market outperformed China’s equity market more broadly, as measured by the MSCI China All Shares Index, during the period. China’s A-share market benefited from strong performance in chipmakers and other technology hardware producers amid expectations of robust domestic demand for AI and cloud computing. |
| Performance Past Does Not Indicate Future [Text] |
Past performance is not indicative of future performance.
|
| Line Graph [Table Text Block] |
Table Summary | KraneShares Bosera MSCI China A 50 Connect Index ETF | MSCI China All Shares Index (USD) (NR)Footnote Reference* | Custom Blended KBA IndexFootnote Reference† |
|---|
Mar/16 | $10,000 | $10,000 | $10,000 |
|---|
Mar/17 | $9,796 | $11,165 | $10,140 |
|---|
Mar/18 | $12,018 | $14,481 | $11,964 |
|---|
Mar/19 | $11,535 | $13,494 | $11,273 |
|---|
Mar/20 | $10,845 | $12,691 | $10,690 |
|---|
Mar/21 | $16,268 | $18,507 | $16,152 |
|---|
Mar/22 | $14,972 | $14,029 | $14,911 |
|---|
Mar/23 | $13,081 | $13,125 | $13,185 |
|---|
Mar/24 | $11,016 | $10,942 | $11,177 |
|---|
Mar/25 | $12,405 | $14,057 | $12,679 |
|---|
Mar/26 | $15,800 | $15,513 | $16,398 |
|---|
|
| Average Annual Return [Table Text Block] |
Table SummaryFund/Index Name | 1 Year | 5 Years | 10 Years |
|---|
KraneShares Bosera MSCI China A 50 Connect Index ETF | 27.37% | -0.58% | 4.68% |
|---|
MSCI China All Shares Index (USD) (NR)Footnote Reference* | 10.36% | -3.47% | 4.49% |
|---|
Custom Blended KBA IndexFootnote Reference† | 29.34% | 0.30% | 5.07% |
|---|
|
| No Deduction of Taxes [Text Block] |
The table and graph presented above do not reflect the deduction of taxes a shareholder would pay on Fund distributions or the redemption of Fund shares.
|
| AssetsNet |
$ 170,401,301
|
| Holdings Count | Holding |
52
|
| Advisory Fees Paid, Amount |
$ 1,120,396
|
| InvestmentCompanyPortfolioTurnover |
55.00%
|
| Additional Fund Statistics [Text Block] |
Key Fund Statistics as of March 31, 2026Table Summary | Total Net Assets | Number of Holdings | Total Advisory Fees Paid | Portfolio Turnover Rate |
|---|
| $170,401,301 | 52 | $1,120,396 | 55% |
|---|
|
| Holdings [Text Block] |
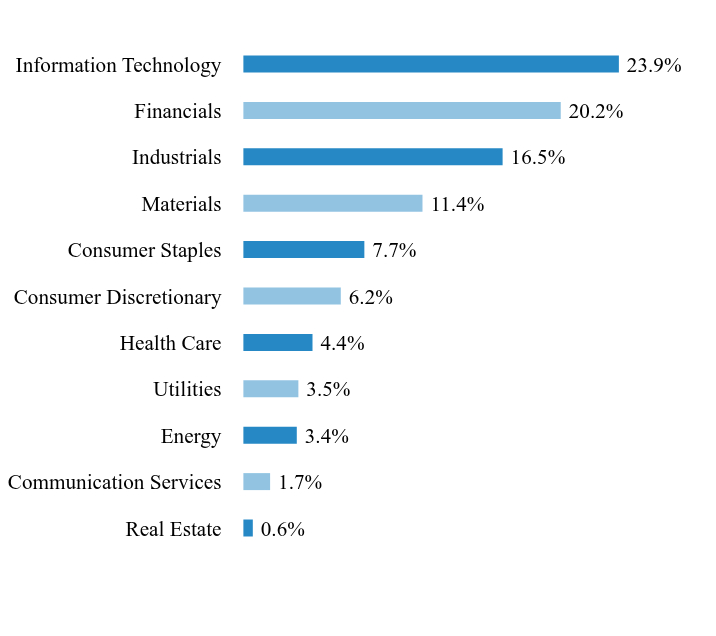
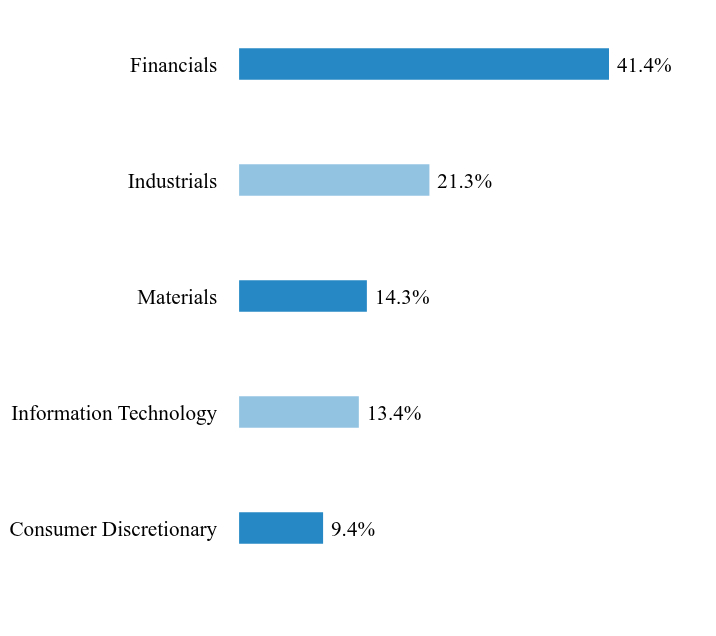
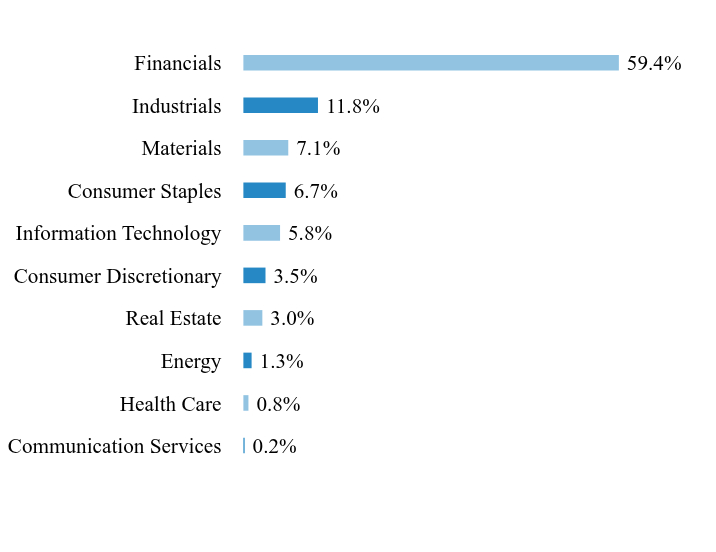
Sector WeightingsFootnote Reference*Table SummaryValue | Value |
|---|
Real Estate | 0.6% | Communication Services | 1.7% | Energy | 3.4% | Utilities | 3.5% | Health Care | 4.4% | Consumer Discretionary | 6.2% | Consumer Staples | 7.7% | Materials | 11.4% | Industrials | 16.5% | Financials | 20.2% | Information Technology | 23.9% | | Footnote | Description | Footnote* | Percentages are calculated based on total net assets. |
|
| Largest Holdings [Text Block] |
Table SummaryHolding Name | | | Percentage of
Total Net Assets |
|---|
Contemporary Amperex Technology, Cl A | | | 8.5% | Zijin Mining Group, Cl A | | | 6.1% | Kweichow Moutai, Cl A | | | 5.2% | Zhongji Innolight, Cl A | | | 4.6% | Foxconn Industrial Internet, Cl A | | | 4.6% | BYD, Cl A | | | 4.2% | Hygon Information Technology, Cl A | | | 3.5% | Eoptolink Technology, Cl A | | | 3.2% | China Merchants Bank, Cl A | | | 3.1% | Cambricon Technologies, Cl A | | | 3.0% | |
| Material Fund Change [Text Block] |
This is a summary of certain changes to the Fund since April 1, 2025. For more complete information, you may review the Fund’s prospectus, which is available at https://kraneshares.com/kba/#fund-documents or upon request at 1-855-857-2638. Krane Funds Advisors, LLC (“Krane” or the “Adviser”), the investment adviser to the Fund, entered into an agreement whereby its officers and employees, among others, through KFA Two Holdings, LLC, will acquire a majority interest in the Adviser from China International Capital Corporation (USA) Holdings Inc., a wholly-owned, indirect subsidiary of China International Capital Corporation Limited (the “Transaction”). Consummation of the Transaction will, under the Investment Company Act of 1940, result in the automatic termination of the Fund’s existing investment advisory and sub-advisory agreement. In anticipation of the Transaction, the Board approved new advisory and sub-advisory agreements on terms identical to the existing agreements (other than effective and termination dates), subject to shareholder approval of both the new advisory agreement and the Fund’s reliance on a manager-of-managers exemptive order. To ensure continuity of management pending shareholder approval, the Board also approved interim advisory and sub-advisory agreements, effective upon closing of the Transaction, each with terms substantially identical to the current agreements, to remain in effect for up to 150 days while shareholder approval is sought. |
| Updated Prospectus Web Address |
https://kraneshares.com/kba/
|
| C000180685 |
|
| Shareholder Report [Line Items] |
|
| Fund Name |
KraneShares MSCI One Belt One Road Index ETF
|
| Class Name |
KraneShares MSCI One Belt One Road Index ETF
|
| Trading Symbol |
OBOR
|
| Security Exchange Name |
NYSEArca
|
| Annual or Semi-Annual Statement [Text Block] |
Annual Shareholder Report
|
| Shareholder Report Annual or Semi-Annual |
annual shareholder report
|
| Additional Information [Text Block] |
This annual shareholder report contains important information about the KraneShares MSCI One Belt One Road Index ETF (the "Fund") for the period from April 1, 2025 to March 31, 2026. You can find additional information about the Fund at https://kraneshares.com/obor/. You can also request this information by contacting us at 1-855-857-2638.
|
| Additional Information Phone Number |
1-855-857-2638
|
| Additional Information Website |
https://kraneshares.com/obor/
|
| Expenses [Text Block] |
What were the Fund costs for the last year?(based on a hypothetical $10,000 investment) Table SummaryFund Name | Costs of a $10,000 investment | Costs paid as a percentage of a $10,000 investment |
|---|
KraneShares MSCI One Belt One Road Index ETF | $90 | 0.79% |
|---|
|
| Expenses Paid, Amount |
$ 90
|
| Expense Ratio, Percent |
0.79%
|
| Factors Affecting Performance [Text Block] |
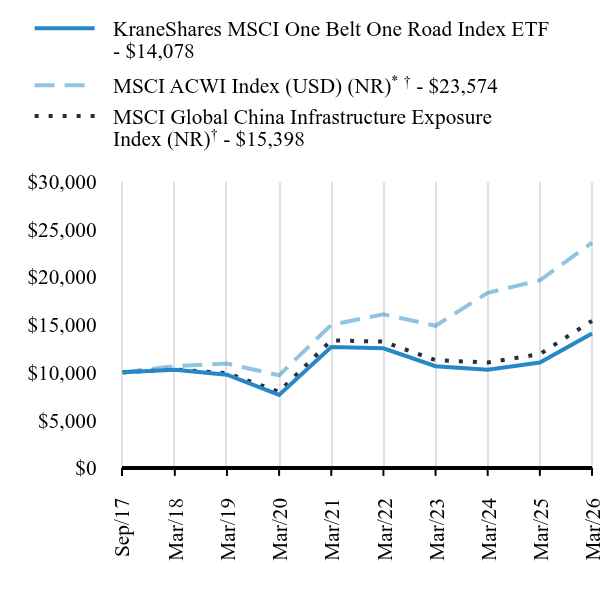
(a) MSCI Global China Infrastructure Exposure Index The KraneShares MSCI One Belt One Road Index ETF seeks to provide investment results that, before fees and expenses, correspond generally to the price and yield performance of the MSCI Global China Infrastructure Exposure Index (the Underlying Index). The Underlying Index aims to identify potential beneficiaries of the "Belt & Road" or "One Belt One Road" initiative by the central government in China based on how their geography, revenue, and sector attributes align with the broad theme. The Fund seeks to capture potential upside for the companies involved in China's Belt & Road Initiative. Equities involved in China’s Belt & Road Initiative outperformed global equity markets, as measured by the MSCI ACWI Index, during the period. The Fund benefited from the strong performance of suppliers of raw materials, which experienced a windfall as global supply became constrained by tensions in the Strait of Hormuz. |
| Performance Past Does Not Indicate Future [Text] |
Past performance is not indicative of future performance.
|
| Line Graph [Table Text Block] |
Table Summary | KraneShares MSCI One Belt One Road Index ETF | MSCI ACWI Index (USD) (NR)Footnote Reference*Footnote Reference† | MSCI Global China Infrastructure Exposure Index (NR)Footnote Reference† |
|---|
Sep/17 | $10,000 | $10,000 | $10,000 |
|---|
Mar/18 | $10,267 | $10,644 | $10,309 |
|---|
Mar/19 | $9,759 | $10,921 | $9,922 |
|---|
Mar/20 | $7,634 | $9,692 | $7,971 |
|---|
Mar/21 | $12,659 | $14,983 | $13,358 |
|---|
Mar/22 | $12,519 | $16,074 | $13,216 |
|---|
Mar/23 | $10,643 | $14,878 | $11,274 |
|---|
Mar/24 | $10,281 | $18,333 | $11,035 |
|---|
Mar/25 | $11,038 | $19,643 | $11,911 |
|---|
Mar/26 | $14,078 | $23,574 | $15,398 |
|---|
|
| Average Annual Return [Table Text Block] |
Table SummaryFund/Index Name | 1 Year | 5 Years | Annualized
Since
Inception |
|---|
KraneShares MSCI One Belt One Road Index ETF | 27.53% | 2.15% | 4.07% |
|---|
MSCI ACWI Index (USD) (NR)Footnote Reference*Footnote Reference† | 20.01% | 9.49% | 10.53% |
|---|
MSCI Global China Infrastructure Exposure Index (NR)Footnote Reference† | 29.28% | 2.88% | 5.17% |
|---|
|
| No Deduction of Taxes [Text Block] |
The table and graph presented above do not reflect the deduction of taxes a shareholder would pay on Fund distributions or the redemption of Fund shares.
|
| AssetsNet |
$ 4,064,962
|
| Holdings Count | Holding |
118
|
| Advisory Fees Paid, Amount |
$ 29,570
|
| InvestmentCompanyPortfolioTurnover |
29.00%
|
| Additional Fund Statistics [Text Block] |
Key Fund Statistics as of March 31, 2026Table Summary | Total Net Assets | Number of Holdings | Total Advisory Fees Paid | Portfolio Turnover Rate |
|---|
| $4,064,962 | 118 | $29,570 | 29% |
|---|
|
| Holdings [Text Block] |
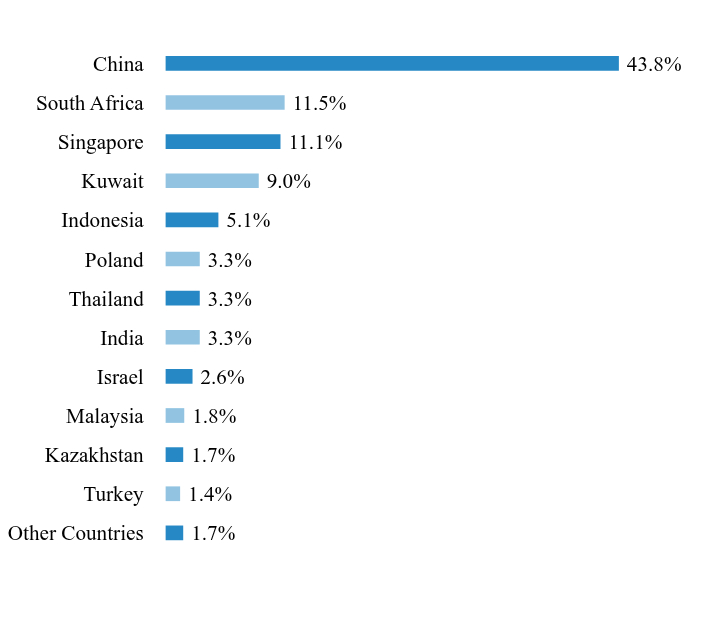
Country WeightingsFootnote Reference*Table SummaryValue | Value |
|---|
Other Countries | 1.7% | Turkey | 1.4% | Kazakhstan | 1.7% | Malaysia | 1.8% | Israel | 2.6% | India | 3.3% | Thailand | 3.3% | Poland | 3.3% | Indonesia | 5.1% | Kuwait | 9.0% | Singapore | 11.1% | South Africa | 11.5% | China | 43.8% | | Footnote | Description | Footnote* | Percentages are calculated based on total net assets. |
|
| Largest Holdings [Text Block] |
Table SummaryHolding Name | | | Percentage of
Total Net Assets |
|---|
Kuwait Finance House | | | 8.8% | Oversea-Chinese Banking | | | 8.1% | Valterra Platinum | | | 6.0% | China Yangtze Power, Cl A | | | 4.3% | Impala Platinum Holdings | | | 3.4% | KGHM Polska Miedz | | | 3.3% | PTT NVDR | | | 3.3% | China Petroleum & Chemical, Cl H | | | 2.0% | Northam Platinum Holdings | | | 1.9% | Singapore Technologies Engineering | | | 1.9% | |
| Material Fund Change [Text Block] |
This is a summary of certain changes to the Fund since April 1, 2025. For more complete information, you may review the Fund’s prospectus, which is available at https://kraneshares.com/obor/#fund-documents or upon request at 1-855-857-2638. Krane Funds Advisors, LLC (“Krane” or the “Adviser”), the investment adviser to the Fund, entered into an agreement whereby its officers and employees, among others, through KFA Two Holdings, LLC, will acquire a majority interest in the Adviser from China International Capital Corporation (USA) Holdings Inc., a wholly-owned, indirect subsidiary of China International Capital Corporation Limited (the “Transaction”). Consummation of the Transaction will, under the Investment Company Act of 1940, result in the automatic termination of the Fund’s existing investment advisory and, if applicable, sub-advisory agreements. In anticipation of the Transaction, the Board approved new advisory and, if applicable, sub-advisory agreements on terms identical to the existing agreements (other than effective and termination dates), subject to shareholder approval of the new advisory agreement. The new sub-advisory agreement will take effect in reliance on a manager-of-managers exemptive order. To ensure continuity of management pending shareholder approval of the new advisory agreement, the Board also approved interim advisory and, if applicable, sub-advisory agreements, effective upon closing of the Transaction, each with terms substantially identical to the current agreements, to remain in effect for up to 150 days while shareholder approval is sought. |
| Updated Prospectus Web Address |
https://kraneshares.com/obor/
|
| C000176655 |
|
| Shareholder Report [Line Items] |
|
| Fund Name |
KraneShares Emerging Markets Consumer Technology Index ETF
|
| Class Name |
KraneShares Emerging Markets Consumer Technology Index ETF
|
| Trading Symbol |
KEMQ
|
| Security Exchange Name |
NYSEArca
|
| Annual or Semi-Annual Statement [Text Block] |
Annual Shareholder Report
|
| Shareholder Report Annual or Semi-Annual |
annual shareholder report
|
| Additional Information [Text Block] |
This annual shareholder report contains important information about the KraneShares Emerging Markets Consumer Technology Index ETF (the "Fund") for the period from April 1, 2025 to March 31, 2026. You can find additional information about the Fund at https://kraneshares.com/kemq/. You can also request this information by contacting us at 1-855-857-2638.
|
| Additional Information Phone Number |
1-855-857-2638
|
| Additional Information Website |
https://kraneshares.com/kemq/
|
| Expenses [Text Block] |
What were the Fund costs for the last year?(based on a hypothetical $10,000 investment) Table SummaryFund Name | Costs of a $10,000 investment | Costs paid as a percentage of a $10,000 investment |
|---|
KraneShares Emerging Markets Consumer Technology Index ETF | $55 | 0.49% |
|---|
|
| Expenses Paid, Amount |
$ 55
|
| Expense Ratio, Percent |
0.49%
|
| Factors Affecting Performance [Text Block] |
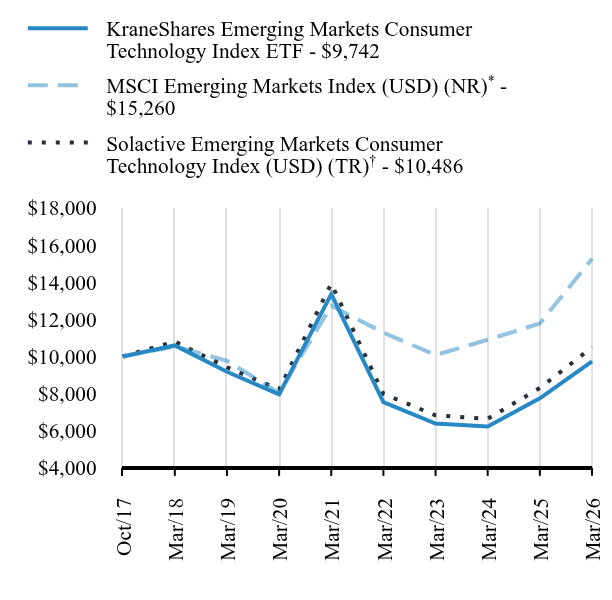
(a) Solactive Emerging Markets Consumer Technology Index The KraneShares Emerging Markets Consumer Technology Index ETF seeks to provide investment results that, before fees and expenses, correspond generally to the price and yield performance of the Solactive Emerging Markets Consumer Technology Index (the "Underlying Index"). The Underlying Index selects companies from 26 eligible countries within emerging markets whose primary business or businesses are internet retail, internet software/services, purchase, payment processing, semiconductor production, or software for internet and e-commerce transactions. Emerging market consumer technology equities underperformed emerging market equities more broadly, as measured by the MSCI Emerging Markets Index, during the period, due to the outsized performance of broad beta exposure to Latin America amid strong headline economic growth. Emerging markets consumer technology equities benefited from continued strong demand for AI chips from key global manufacturers, including Taiwan Semiconductor Manufacturing (TSMC) and SK Hynix, both of which are in Emerging Markets. |
| Performance Past Does Not Indicate Future [Text] |
Past performance is not indicative of future performance.
|
| Line Graph [Table Text Block] |
Table Summary | KraneShares Emerging Markets Consumer Technology Index ETF | MSCI Emerging Markets Index (USD) (NR)Footnote Reference* | Solactive Emerging Markets Consumer Technology Index (USD) (TR)Footnote Reference† |
|---|
Oct/17 | $10,000 | $10,000 | $10,000 |
|---|
Mar/18 | $10,592 | $10,546 | $10,802 |
|---|
Mar/19 | $9,176 | $9,765 | $9,421 |
|---|
Mar/20 | $7,957 | $8,038 | $8,225 |
|---|
Mar/21 | $13,355 | $12,731 | $13,922 |
|---|
Mar/22 | $7,537 | $11,284 | $7,987 |
|---|
Mar/23 | $6,384 | $10,076 | $6,831 |
|---|
Mar/24 | $6,226 | $10,898 | $6,643 |
|---|
Mar/25 | $7,746 | $11,779 | $8,301 |
|---|
Mar/26 | $9,742 | $15,260 | $10,486 |
|---|
|
| Average Annual Return [Table Text Block] |
Table SummaryFund/Index Name | 1 Year | 5 Years | Annualized
Since
Inception |
|---|
KraneShares Emerging Markets Consumer Technology Index ETF | 25.77% | -6.11% | -0.31% |
|---|
MSCI Emerging Markets Index (USD) (NR)Footnote Reference* | 29.55% | 3.69% | 5.11% |
|---|
Solactive Emerging Markets Consumer Technology Index (USD) (TR)Footnote Reference† | 26.32% | -5.51% | 0.56% |
|---|
|
| No Deduction of Taxes [Text Block] |
The table and graph presented above do not reflect the deduction of taxes a shareholder would pay on Fund distributions or the redemption of Fund shares.
|
| AssetsNet |
$ 47,148,281
|
| Holdings Count | Holding |
53
|
| Advisory Fees Paid, Amount |
$ 167,765
|
| InvestmentCompanyPortfolioTurnover |
72.00%
|
| Additional Fund Statistics [Text Block] |
Key Fund Statistics as of March 31, 2026Table Summary | Total Net Assets | Number of Holdings | Total Advisory Fees Paid | Portfolio Turnover Rate |
|---|
| $47,148,281 | 53 | $167,765 | 72% |
|---|
|
| Holdings [Text Block] |
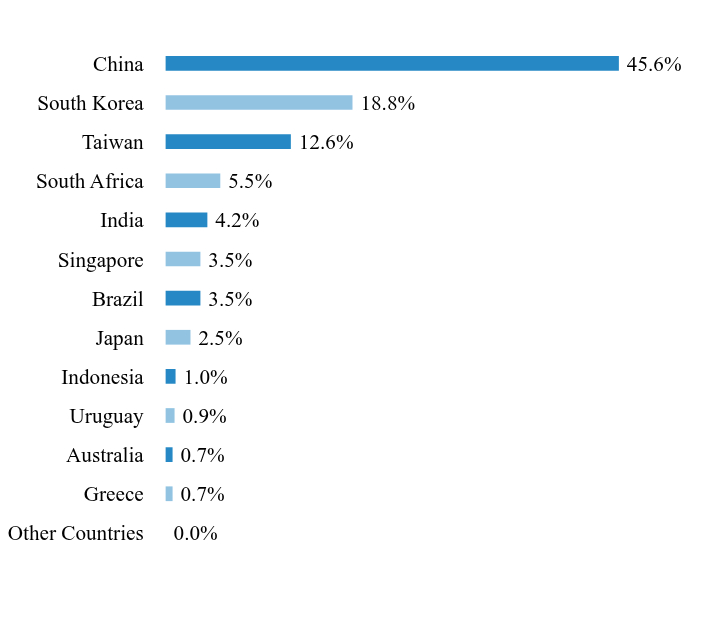
Country/Asset WeightingsFootnote Reference*Table SummaryValue | Value |
|---|
Other Countries | 0.0% | Greece | 0.7% | Australia | 0.7% | Uruguay | 0.9% | Indonesia | 1.0% | Japan | 2.5% | Brazil | 3.5% | Singapore | 3.5% | India | 4.2% | South Africa | 5.5% | Taiwan | 12.6% | South Korea | 18.8% | China | 45.6% | | Footnote | Description | Footnote* | Percentages are calculated based on total net assets. |
|
| Largest Holdings [Text Block] |
Table SummaryHolding Name | | | Percentage of
Total Net Assets |
|---|
Meituan, Cl B | | | 4.0% | JD.com, Cl A | | | 3.9% | PDD Holdings ADR | | | 3.7% | Taiwan Semiconductor Manufacturing | | | 3.6% | Sea ADR | | | 3.5% | NetEase | | | 3.4% | Alibaba Group Holding | | | 3.4% | Tencent Holdings | | | 3.3% | Naspers, Cl N | | | 3.3% | SK hynix | | | 3.1% | |
| Material Fund Change [Text Block] |
This is a summary of certain changes to the Fund since April 1, 2025. For more complete information, you may review the Fund’s prospectus, which is available at https://kraneshares.com/kemq/#fund-documents or upon request at 1-855-857-2638. Krane Funds Advisors, LLC (“Krane” or the “Adviser”), the investment adviser to the Fund, entered into an agreement whereby its officers and employees, among others, through KFA Two Holdings, LLC, will acquire a majority interest in the Adviser from China International Capital Corporation (USA) Holdings Inc., a wholly-owned, indirect subsidiary of China International Capital Corporation Limited (the “Transaction”). Consummation of the Transaction will, under the Investment Company Act of 1940, result in the automatic termination of the Fund’s existing investment advisory and, if applicable, sub-advisory agreements. In anticipation of the Transaction, the Board approved new advisory and, if applicable, sub-advisory agreements on terms identical to the existing agreements (other than effective and termination dates), subject to shareholder approval of the new advisory agreement. The new sub-advisory agreement will take effect in reliance on a manager-of-managers exemptive order. To ensure continuity of management pending shareholder approval of the new advisory agreement, the Board also approved interim advisory and, if applicable, sub-advisory agreements, effective upon closing of the Transaction, each with terms substantially identical to the current agreements, to remain in effect for up to 150 days while shareholder approval is sought. |
| Updated Prospectus Web Address |
https://kraneshares.com/kemq/
|
| C000157444 |
|
| Shareholder Report [Line Items] |
|
| Fund Name |
KraneShares MSCI China Clean Technology Index ETF
|
| Class Name |
KraneShares MSCI China Clean Technology Index ETF
|
| Trading Symbol |
KGRN
|
| Security Exchange Name |
NYSEArca
|
| Annual or Semi-Annual Statement [Text Block] |
Annual Shareholder Report
|
| Shareholder Report Annual or Semi-Annual |
annual shareholder report
|
| Additional Information [Text Block] |
This annual shareholder report contains important information about the KraneShares MSCI China Clean Technology Index ETF (the "Fund") for the period from April 1, 2025 to March 31, 2026. You can find additional information about the Fund at https://kraneshares.com/kgrn/. You can also request this information by contacting us at 1-855-857-2638.
|
| Additional Information Phone Number |
1-855-857-2638
|
| Additional Information Website |
https://kraneshares.com/kgrn/
|
| Expenses [Text Block] |
What were the Fund costs for the last year?(based on a hypothetical $10,000 investment) Table SummaryFund Name | Costs of a $10,000 investment | Costs paid as a percentage of a $10,000 investment |
|---|
KraneShares MSCI China Clean Technology Index ETF | $83 | 0.79% |
|---|
|
| Expenses Paid, Amount |
$ 83
|
| Expense Ratio, Percent |
0.79%
|
| Factors Affecting Performance [Text Block] |
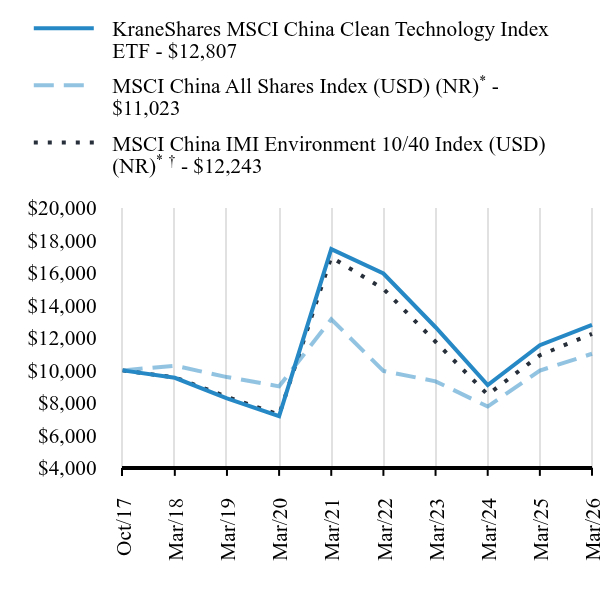
(a) MSCI China IMI Environment 10/40 Index The KraneShares MSCI China Clean Technology Index ETF seeks to provide investment results that, before fees and expenses, correspond generally to the price and yield performance of the MSCI China IMI Environment 10/40 Index (the "Underlying Index"). The Underlying Index comprises securities that derive at least 50% of their revenues from environmentally beneficial products and services. The Underlying Index is based on four key clean technology themes: (1) Alternative Energy, (2) Sustainable Water, (3) Pollution Prevention and (4) Energy Efficiency. The Underlying Index is designed to measure the performance of Chinese companies that focus on contributing to a more environmentally sustainable economy by making efficient use of scarce natural resources or by mitigating the impact of environmental degradation. China’s clean technology equities outperformed the broader China equity market, as measured by the MSCI China All Shares Index, during the period. China's clean technology equities benefited from higher oil prices, leading to speculation of an acceleration in China’s transition to renewables, as well as agreements among leading solar panel manufacturers to curb production and raise their profitability. |
| Performance Past Does Not Indicate Future [Text] |
Past performance is not indicative of future performance.
|
| Line Graph [Table Text Block] |
Table Summary | KraneShares MSCI China Clean Technology Index ETF | MSCI China All Shares Index (USD) (NR)Footnote Reference* | MSCI China IMI Environment 10/40 Index (USD) (NR)Footnote Reference*Footnote Reference† |
|---|
Oct/17 | $10,000 | $10,000 | $10,000 |
|---|
Mar/18 | $9,544 | $10,289 | $9,569 |
|---|
Mar/19 | $8,277 | $9,588 | $8,373 |
|---|
Mar/20 | $7,187 | $9,018 | $7,274 |
|---|
Mar/21 | $17,466 | $13,150 | $16,965 |
|---|
Mar/22 | $15,962 | $9,968 | $15,018 |
|---|
Mar/23 | $12,656 | $9,326 | $11,762 |
|---|
Mar/24 | $9,091 | $7,775 | $8,505 |
|---|
Mar/25 | $11,552 | $9,988 | $10,935 |
|---|
Mar/26 | $12,807 | $11,023 | $12,243 |
|---|
|
| Average Annual Return [Table Text Block] |
Table SummaryFund/Index Name | 1 Year | 5 Years | Annualized
Since
Inception |
|---|
KraneShares MSCI China Clean Technology Index ETF | 10.87% | -6.02% | 2.96% |
|---|
MSCI China All Shares Index (USD) (NR)Footnote Reference* | 10.36% | -3.47% | 1.16% |
|---|
MSCI China IMI Environment 10/40 Index (USD) (NR)Footnote Reference*Footnote Reference† | 11.96% | -6.32% | 2.42% |
|---|
|
| No Deduction of Taxes [Text Block] |
The table and graph presented above do not reflect the deduction of taxes a shareholder would pay on Fund distributions or the redemption of Fund shares.
|
| AssetsNet |
$ 61,608,429
|
| Holdings Count | Holding |
50
|
| Advisory Fees Paid, Amount |
$ 460,282
|
| InvestmentCompanyPortfolioTurnover |
35.00%
|
| Additional Fund Statistics [Text Block] |
Key Fund Statistics as of March 31, 2026Table Summary | Total Net Assets | Number of Holdings | Total Advisory Fees Paid | Portfolio Turnover Rate |
|---|
| $61,608,429 | 50 | $460,282 | 35% |
|---|
|
| Holdings [Text Block] |
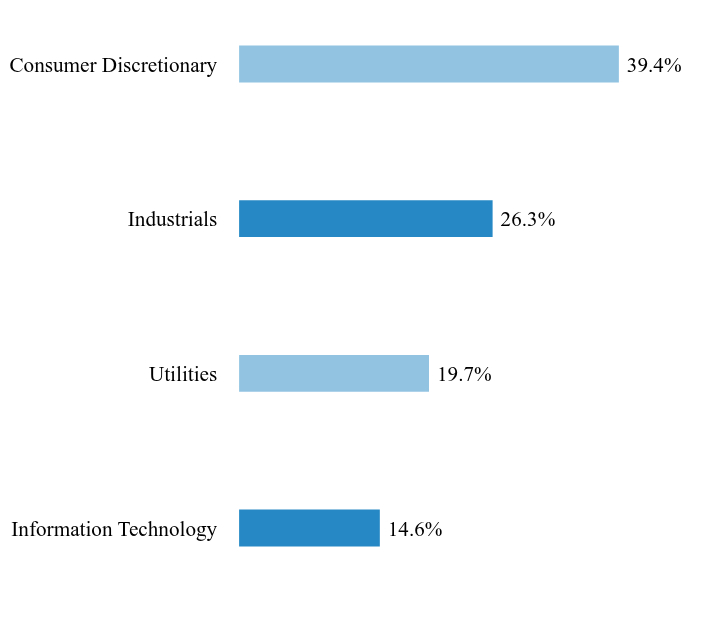
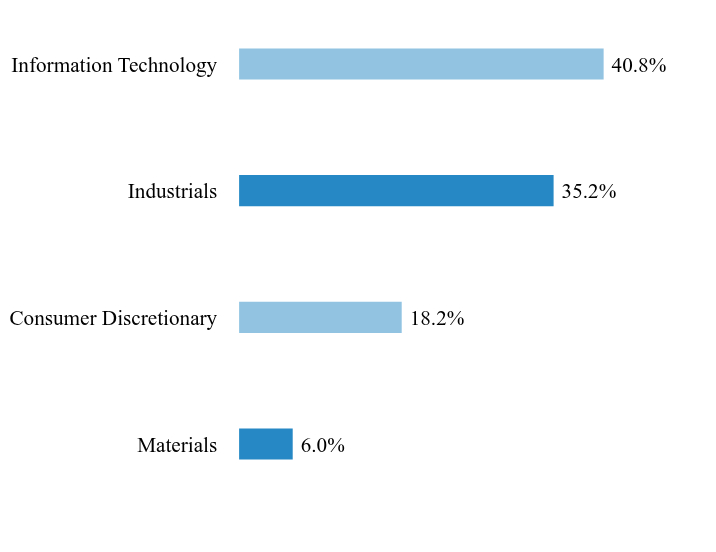
Sector WeightingsFootnote Reference*Table SummaryValue | Value |
|---|
Information Technology | 14.6% | Utilities | 19.7% | Industrials | 26.3% | Consumer Discretionary | 39.4% | | Footnote | Description | Footnote* | Percentages are calculated based on total net assets. |
|
| Largest Holdings [Text Block] |
Table SummaryHolding Name | | | Percentage of
Total Net Assets |
|---|
BYD, Cl H | | | 9.0% | Li Auto, Cl A | | | 8.6% | XPeng, Cl A | | | 8.5% | Contemporary Amperex Technology, Cl A | | | 6.8% | NIO, Cl A | | | 4.8% | CGN Power, Cl H | | | 4.8% | China Yangtze Power, Cl A | | | 4.7% | GDS Holdings, Cl A | | | 3.9% | Contemporary Amperex Technology, Cl H | | | 3.6% | Zhejiang Leapmotor Technology, Cl H | | | 3.2% | |
| Material Fund Change [Text Block] |
This is a summary of certain changes to the Fund since April 1, 2025. For more complete information, you may review the Fund’s prospectus, which is available at https://kraneshares.com/kgrn/#fund-documents or upon request at 1-855-857-2638. Krane Funds Advisors, LLC (“Krane” or the “Adviser”), the investment adviser to the Fund, entered into an agreement whereby its officers and employees, among others, through KFA Two Holdings, LLC, will acquire a majority interest in the Adviser from China International Capital Corporation (USA) Holdings Inc., a wholly-owned, indirect subsidiary of China International Capital Corporation Limited (the “Transaction”). Consummation of the Transaction will, under the Investment Company Act of 1940, result in the automatic termination of the Fund’s existing investment advisory and, if applicable, sub-advisory agreements. In anticipation of the Transaction, the Board approved new advisory and, if applicable, sub-advisory agreements on terms identical to the existing agreements (other than effective and termination dates), subject to shareholder approval of the new advisory agreement. The new sub-advisory agreement will take effect in reliance on a manager-of-managers exemptive order. To ensure continuity of management pending shareholder approval of the new advisory agreement, the Board also approved interim advisory and, if applicable, sub-advisory agreements, effective upon closing of the Transaction, each with terms substantially identical to the current agreements, to remain in effect for up to 150 days while shareholder approval is sought. |
| Updated Prospectus Web Address |
https://kraneshares.com/kgrn/
|
| C000198139 |
|
| Shareholder Report [Line Items] |
|
| Fund Name |
KraneShares Electric Vehicles and Future Mobility Index ETF
|
| Class Name |
KraneShares Electric Vehicles and Future Mobility Index ETF
|
| Trading Symbol |
KARS
|
| Security Exchange Name |
NYSEArca
|
| Annual or Semi-Annual Statement [Text Block] |
Annual Shareholder Report
|
| Shareholder Report Annual or Semi-Annual |
annual shareholder report
|
| Additional Information [Text Block] |
This annual shareholder report contains important information about the KraneShares Electric Vehicles and Future Mobility Index ETF (the "Fund") for the period from April 1, 2025 to March 31, 2026. You can find additional information about the Fund at https://kraneshares.com/kars/. You can also request this information by contacting us at 1-855-857-2638.
|
| Additional Information Phone Number |
1-855-857-2638
|
| Additional Information Website |
https://kraneshares.com/kars/
|
| Expenses [Text Block] |
What were the Fund costs for the last year?(based on a hypothetical $10,000 investment) Table SummaryFund Name | Costs of a $10,000 investment | Costs paid as a percentage of a $10,000 investment |
|---|
KraneShares Electric Vehicles and Future Mobility Index ETF | $86 | 0.69% |
|---|
|
| Expenses Paid, Amount |
$ 86
|
| Expense Ratio, Percent |
0.69%
|
| Factors Affecting Performance [Text Block] |
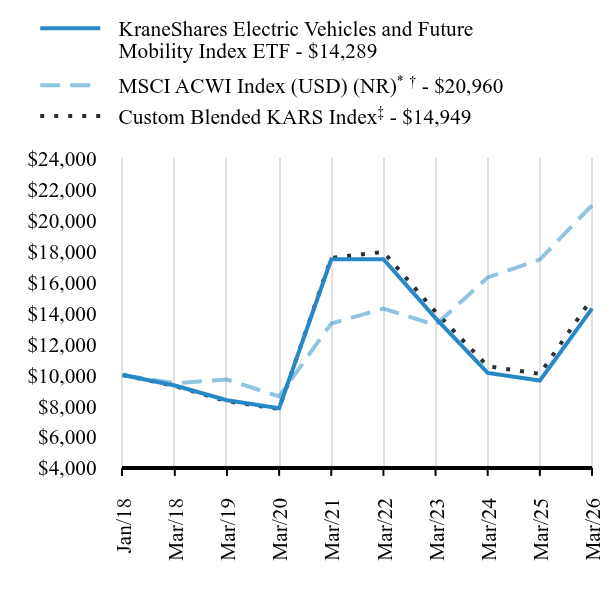
(a) Bloomberg Electric Vehicles Index The KraneShares Electric Vehicle & Future Mobility Index ETF seeks to provide investment results that, before fees and expenses, correspond generally to the price and yield performance of the Bloomberg Electric Vehicles Index (the "Underlying Index"). The Underlying Index seeks to measure the performance of companies that are engaged in the production of electric vehicles, their components, or other initiatives that may change the future of mobility. This includes electric vehicles, autonomous driving, lithium and/or copper production, lithium-ion/lead acid battery production, hydrogen fuel cell manufacturing, and/or electric infrastructure businesses. The global electric vehicle (“EV”) and future mobility ecosystem outperformed global equity markets, as measured by the MSCI ACWI Index, during the period. EVs and future mobility companies benefited from strong adoption trends, especially in China, a softer-than-expected political backlash against pro-EV policies in the United States, and an oil price shock that sparked speculation it could accelerate the electrification of transportation worldwide. |
| Performance Past Does Not Indicate Future [Text] |
Past performance is not indicative of future performance.
|
| Line Graph [Table Text Block] |
Table Summary | KraneShares Electric Vehicles and Future Mobility Index ETF | MSCI ACWI Index (USD) (NR)Footnote Reference*Footnote Reference† | Custom Blended KARS IndexFootnote Reference‡ |
|---|
Jan/18 | $10,000 | $10,000 | $10,000 |
|---|
Mar/18 | $9,320 | $9,464 | $9,287 |
|---|
Mar/19 | $8,370 | $9,710 | $8,307 |
|---|
Mar/20 | $7,856 | $8,617 | $7,812 |
|---|
Mar/21 | $17,476 | $13,322 | $17,567 |
|---|
Mar/22 | $17,484 | $14,291 | $17,951 |
|---|
Mar/23 | $13,676 | $13,228 | $14,081 |
|---|
Mar/24 | $10,132 | $16,299 | $10,567 |
|---|
Mar/25 | $9,639 | $17,465 | $10,069 |
|---|
Mar/26 | $14,289 | $20,960 | $14,949 |
|---|
|
| Average Annual Return [Table Text Block] |
Table SummaryFund/Index Name | 1 Year | 5 Years | Annualized
Since
Inception |
|---|
KraneShares Electric Vehicles and Future Mobility Index ETF | 48.24% | -3.95% | 4.45% |
|---|
MSCI ACWI Index (USD) (NR)Footnote Reference*Footnote Reference† | 20.01% | 9.49% | 9.44% |
|---|
Custom Blended KARS IndexFootnote Reference‡ | 48.46% | -3.18% | 5.02% |
|---|
|
| No Deduction of Taxes [Text Block] |
The table and graph presented above do not reflect the deduction of taxes a shareholder would pay on Fund distributions or the redemption of Fund shares.
|
| AssetsNet |
$ 73,782,461
|
| Holdings Count | Holding |
80
|
| Advisory Fees Paid, Amount |
$ 495,924
|
| InvestmentCompanyPortfolioTurnover |
69.00%
|
| Additional Fund Statistics [Text Block] |
Key Fund Statistics as of March 31, 2026Table Summary | Total Net Assets | Number of Holdings | Total Advisory Fees Paid | Portfolio Turnover Rate |
|---|
| $73,782,461 | 80 | $495,924 | 69% |
|---|
|
| Holdings [Text Block] |
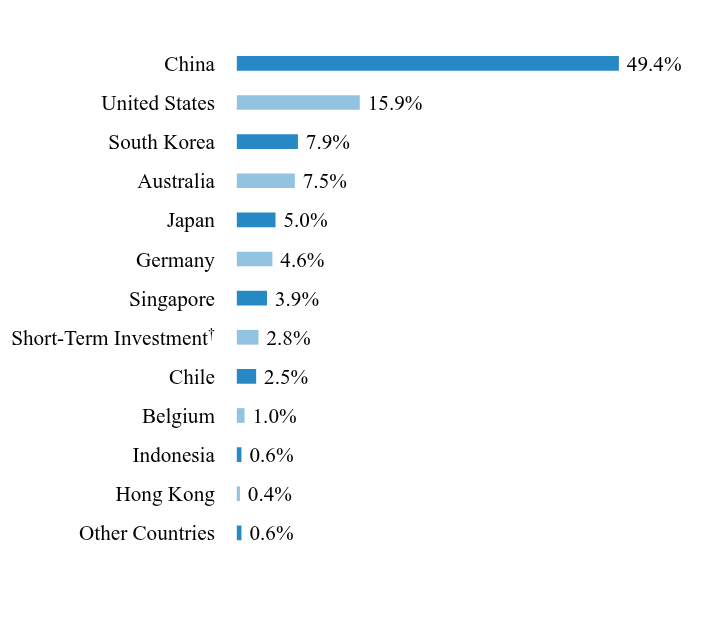
Country/Asset WeightingsFootnote Reference*Table SummaryValue | Value |
|---|
Other Countries | 0.6% | Hong Kong | 0.4% | Indonesia | 0.6% | Belgium | 1.0% | Chile | 2.5% | Short-Term InvestmentFootnote Reference† | 2.8% | Singapore | 3.9% | Germany | 4.6% | Japan | 5.0% | Australia | 7.5% | South Korea | 7.9% | United States | 15.9% | China | 49.4% | | Footnote | Description | Footnote* | Percentages are calculated based on total net assets. | Footnote† | This security, or a portion thereof, was purchased with cash collateral held from securities on loan. |
|
| Largest Holdings [Text Block] |
Table SummaryHolding Name | | | Percentage of
Total Net AssetsFootnote Reference(A) |
|---|
BYD, Cl A | | | 5.0% | Albemarle | | | 4.4% | Contemporary Amperex Technology, Cl A | | | 4.4% | Panasonic Holdings | | | 4.2% | STMicroelectronics | | | 3.9% | Tesla | | | 3.8% | Xiaomi, Cl B | | | 3.7% | Bayerische Motoren Werke | | | 3.4% | Geely Automobile Holdings | | | 3.2% | NIO, Cl A | | | 2.9% | | Footnote | Description | Footnote(A) | Short-Term Investments are not shown in the top ten chart. |
|
| Material Fund Change [Text Block] |
This is a summary of certain changes to the Fund since April 1, 2025. For more complete information, you may review the Fund’s prospectus, which is available at https://kraneshares.com/kars/#fund-documents or upon request at 1-855-857-2638. Krane Funds Advisors, LLC (“Krane” or the “Adviser”), the investment adviser to the Fund, entered into an agreement whereby its officers and employees, among others, through KFA Two Holdings, LLC, will acquire a majority interest in the Adviser from China International Capital Corporation (USA) Holdings Inc., a wholly-owned, indirect subsidiary of China International Capital Corporation Limited (the “Transaction”). Consummation of the Transaction will, under the Investment Company Act of 1940, result in the automatic termination of the Fund’s existing investment advisory and, if applicable, sub-advisory agreements. In anticipation of the Transaction, the Board approved new advisory and, if applicable, sub-advisory agreements on terms identical to the existing agreements (other than effective and termination dates), subject to shareholder approval of the new advisory agreement. The new sub-advisory agreement will take effect in reliance on a manager-of-managers exemptive order. To ensure continuity of management pending shareholder approval of the new advisory agreement, the Board also approved interim advisory and, if applicable, sub-advisory agreements, effective upon closing of the Transaction, each with terms substantially identical to the current agreements, to remain in effect for up to 150 days while shareholder approval is sought. |
| Updated Prospectus Web Address |
https://kraneshares.com/kars/
|
| C000195635 |
|
| Shareholder Report [Line Items] |
|
| Fund Name |
KraneShares MSCI All China Health Care Index ETF
|
| Class Name |
KraneShares MSCI All China Health Care Index ETF
|
| Trading Symbol |
KURE
|
| Security Exchange Name |
NYSEArca
|
| Annual or Semi-Annual Statement [Text Block] |
Annual Shareholder Report
|
| Shareholder Report Annual or Semi-Annual |
annual shareholder report
|
| Additional Information [Text Block] |
This annual shareholder report contains important information about the KraneShares MSCI All China Health Care Index ETF (the "Fund") for the period from April 1, 2025 to March 31, 2026. You can find additional information about the Fund at https://kraneshares.com/kure/. You can also request this information by contacting us at 1-855-857-2638.
|
| Additional Information Phone Number |
1-855-857-2638
|
| Additional Information Website |
https://kraneshares.com/kure/
|
| Expenses [Text Block] |
What were the Fund costs for the last year?(based on a hypothetical $10,000 investment) Table SummaryFund Name | Costs of a $10,000 investment | Costs paid as a percentage of a $10,000 investment |
|---|
KraneShares MSCI All China Health Care Index ETF | $69 | 0.65% |
|---|
|
| Expenses Paid, Amount |
$ 69
|
| Expense Ratio, Percent |
0.65%
|
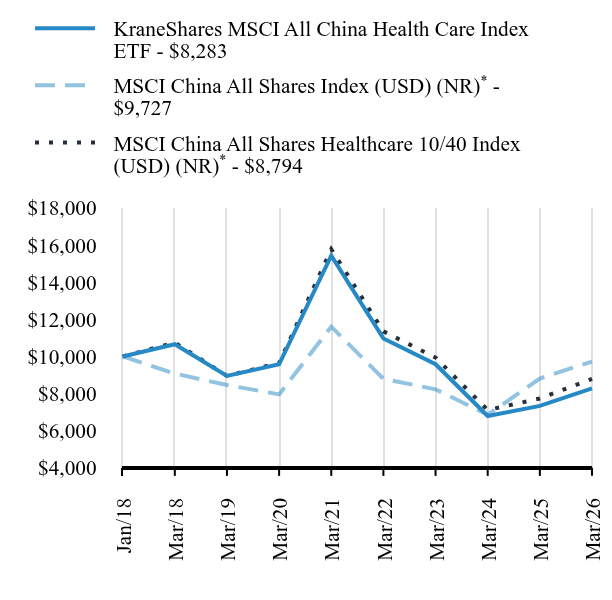
| Factors Affecting Performance [Text Block] |
(a) MSCI China All Shares Health Care 10/40 Index The KraneShares MSCI All China Health Care Index ETF seeks to provide investment results that, before fees and expenses, track the price and yield performance of the MSCI China All Shares Health Care 10/40 Index (the "Underlying Index"). The Underlying Index captures large and mid-cap representation across China A‐shares, B‐shares, H‐shares, Red‐chips, P‐chips, and foreign listings (e.g. American depositary receipts). The Underlying Index is designed to reflect the various China equity share classes, including those listed in Hong Kong, Shanghai, Shenzhen, and outside of China. China’s health care equities outperformed the broader China equity market, as measured by the MSCI China All Shares Index, during the period. China’s health care equities benefited from a surge in deals between China-based and multinational pharmaceutical companies to distribute treatments developed in China in external markets, as well as the shortening of the review period of innovative drugs for domestic distribution. |
| Performance Past Does Not Indicate Future [Text] |
Past performance is not indicative of future performance.
|
| Line Graph [Table Text Block] |
Table Summary | KraneShares MSCI All China Health Care Index ETF | MSCI China All Shares Index (USD) (NR)Footnote Reference* | MSCI China All Shares Healthcare 10/40 Index (USD) (NR)Footnote Reference* |
|---|
Jan/18 | $10,000 | $10,000 | $10,000 |
|---|
Mar/18 | $10,660 | $9,079 | $10,746 |
|---|
Mar/19 | $8,955 | $8,460 | $8,951 |
|---|
Mar/20 | $9,578 | $7,958 | $9,649 |
|---|
Mar/21 | $15,426 | $11,604 | $15,776 |
|---|
Mar/22 | $10,971 | $8,796 | $11,353 |
|---|
Mar/23 | $9,583 | $8,230 | $9,942 |
|---|
Mar/24 | $6,794 | $6,861 | $7,116 |
|---|
Mar/25 | $7,336 | $8,814 | $7,736 |
|---|
Mar/26 | $8,283 | $9,727 | $8,794 |
|---|
|
| Average Annual Return [Table Text Block] |
Table SummaryFund/Index Name | 1 Year | 5 Years | Annualized
Since
Inception |
|---|
KraneShares MSCI All China Health Care Index ETF | 12.90% | -11.69% | -2.28% |
|---|
MSCI China All Shares Index (USD) (NR)Footnote Reference* | 10.36% | -3.47% | -0.34% |
|---|
MSCI China All Shares Healthcare 10/40 Index (USD) (NR)Footnote Reference* | 13.67% | -11.03% | -1.56% |
|---|
|
| No Deduction of Taxes [Text Block] |
The table and graph presented above do not reflect the deduction of taxes a shareholder would pay on Fund distributions or the redemption of Fund shares.
|
| AssetsNet |
$ 80,418,442
|
| Holdings Count | Holding |
53
|
| Advisory Fees Paid, Amount |
$ 587,928
|
| InvestmentCompanyPortfolioTurnover |
73.00%
|
| Additional Fund Statistics [Text Block] |
Key Fund Statistics as of March 31, 2026Table Summary | Total Net Assets | Number of Holdings | Total Advisory Fees Paid | Portfolio Turnover Rate |
|---|
| $80,418,442 | 53 | $587,928 | 73% |
|---|
|
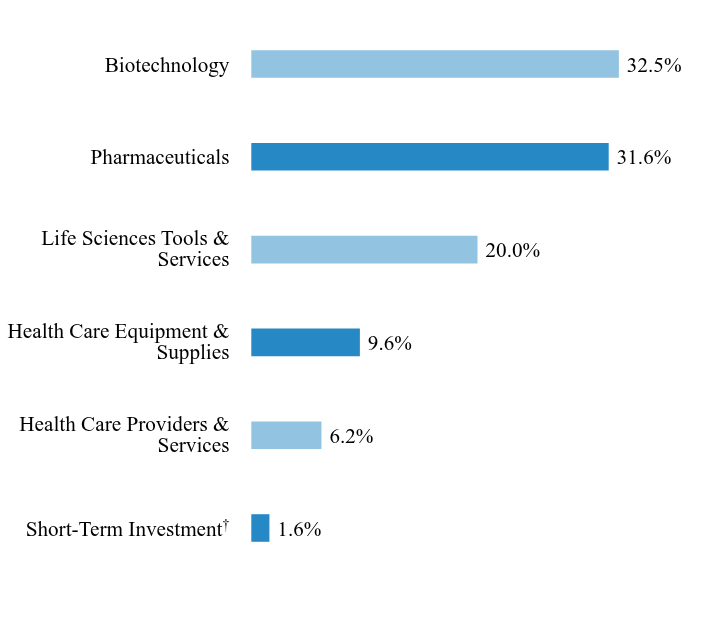
| Holdings [Text Block] |
Sector/Asset WeightingsFootnote Reference*Table SummaryValue | Value |
|---|
Short-Term InvestmentFootnote Reference† | 1.6% | Health Care Providers & Services | 6.2% | Health Care Equipment & Supplies | 9.6% | Life Sciences Tools & Services | 20.0% | Pharmaceuticals | 31.6% | Biotechnology | 32.5% | | Footnote | Description | Footnote* | Percentages are calculated based on total net assets. | Footnote† | This security, or a portion thereof, was purchased with cash collateral held from securities on loan. |
|
| Largest Holdings [Text Block] |
Table SummaryHolding Name | | | Percentage of
Total Net AssetsFootnote Reference(A) |
|---|
Innovent Biologics | | | 8.7% | BeOne Medicines, Cl H | | | 8.2% | Wuxi Biologics Cayman | | | 6.6% | Akeso | | | 5.7% | WuXi AppTec, Cl A | | | 5.7% | Jiangsu Hengrui Pharmaceuticals, Cl A | | | 4.6% | Shenzhen Mindray Bio-Medical Electronics, Cl A | | | 4.3% | Sino Biopharmaceutical | | | 4.2% | CSPC Pharmaceutical Group | | | 3.6% | Hansoh Pharmaceutical Group | | | 3.6% | | Footnote | Description | Footnote(A) | Short-Term Investments are not shown in the top ten chart. |
|
| Material Fund Change [Text Block] |
This is a summary of certain changes to the Fund since April 1, 2025. For more complete information, you may review the Fund’s prospectus, which is available at https://kraneshares.com/kure/#fund-documents or upon request at 1-855-857-2638. Krane Funds Advisors, LLC (“Krane” or the “Adviser”), the investment adviser to the Fund, entered into an agreement whereby its officers and employees, among others, through KFA Two Holdings, LLC, will acquire a majority interest in the Adviser from China International Capital Corporation (USA) Holdings Inc., a wholly-owned, indirect subsidiary of China International Capital Corporation Limited (the “Transaction”). Consummation of the Transaction will, under the Investment Company Act of 1940, result in the automatic termination of the Fund’s existing investment advisory and, if applicable, sub-advisory agreements. In anticipation of the Transaction, the Board approved new advisory and, if applicable, sub-advisory agreements on terms identical to the existing agreements (other than effective and termination dates), subject to shareholder approval of the new advisory agreement. The new sub-advisory agreement will take effect in reliance on a manager-of-managers exemptive order. To ensure continuity of management pending shareholder approval of the new advisory agreement, the Board also approved interim advisory and, if applicable, sub-advisory agreements, effective upon closing of the Transaction, each with terms substantially identical to the current agreements, to remain in effect for up to 150 days while shareholder approval is sought. |
| Updated Prospectus Web Address |
https://kraneshares.com/kure/
|
| C000195632 |
|
| Shareholder Report [Line Items] |
|
| Fund Name |
KraneShares Asia Pacific High Income USD Bond ETF
|
| Class Name |
KraneShares Asia Pacific High Income USD Bond ETF
|
| Trading Symbol |
KHYB
|
| Security Exchange Name |
NYSEArca
|
| Annual or Semi-Annual Statement [Text Block] |
Annual Shareholder Report
|
| Shareholder Report Annual or Semi-Annual |
annual shareholder report
|
| Additional Information [Text Block] |
This annual shareholder report contains important information about the KraneShares Asia Pacific High Income USD Bond ETF (the "Fund") for the period from April 1, 2025 to March 31, 2026. You can find additional information about the Fund at https://kraneshares.com/khyb/. You can also request this information by contacting us at 1-855-857-2638.
|
| Additional Information Phone Number |
1-855-857-2638
|
| Additional Information Website |
https://kraneshares.com/khyb/
|
| Expenses [Text Block] |
What were the Fund costs for the last year?(based on a hypothetical $10,000 investment) Table SummaryFund Name | Costs of a $10,000 investment | Costs paid as a percentage of a $10,000 investment |
|---|
KraneShares Asia Pacific High Income USD Bond ETF | $71 | 0.69% |
|---|
|
| Expenses Paid, Amount |
$ 71
|
| Expense Ratio, Percent |
0.69%
|
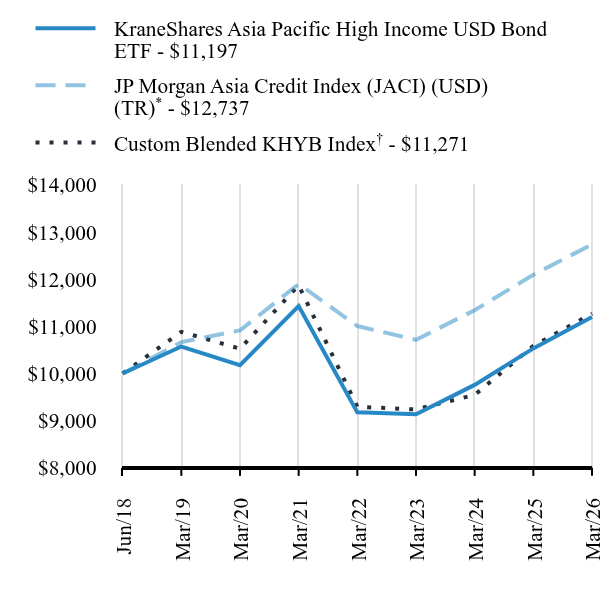
| Factors Affecting Performance [Text Block] |
^ Fund is actively managed and does not track an Underlying Index The KraneShares Asia Pacific High Income U.S.D. Bond ETF seeks to provide a total return that, before fees and expenses, exceeds that of the JP Morgan Asia Credit Index (JACI) Non-Investment Grade Corporate (the "Benchmark Index") over a complete market cycle. The Benchmark Index is comprised of liquid U.S. dollar-denominated debt instruments issued out of Asia ex-Japan and is market capitalization weighted. The Underlying Index is limited to issuers classified as noninvestment grade based on the middle rating between Moody's, Fitch, and S&P. The Asia ex-Japan U.S. dollar-denominated high yield bond market outperformed Asian fixed income more broadly, as measured by the JP Morgan Asia Credit Index, during the period. Asian high yield bonds demonstrated relative resilience in the wake of the oil price shock caused by Middle Eastern tensions in March and continued to benefit from a recovery in the bonds issued by China-based real estate developers. |
| Performance Past Does Not Indicate Future [Text] |
Past performance is not indicative of future performance.
|
| Line Graph [Table Text Block] |
Table Summary | KraneShares Asia Pacific High Income USD Bond ETF | JP Morgan Asia Credit Index (JACI) (USD) (TR)Footnote Reference* | Custom Blended KHYB IndexFootnote Reference† |
|---|
Jun/18 | $10,000 | $10,000 | $10,000 |
|---|
Mar/19 | $10,572 | $10,665 | $10,884 |
|---|
Mar/20 | $10,178 | $10,915 | $10,527 |
|---|
Mar/21 | $11,432 | $11,897 | $11,869 |
|---|
Mar/22 | $9,177 | $11,006 | $9,296 |
|---|
Mar/23 | $9,136 | $10,714 | $9,238 |
|---|
Mar/24 | $9,759 | $11,343 | $9,547 |
|---|
Mar/25 | $10,533 | $12,095 | $10,584 |
|---|
Mar/26 | $11,197 | $12,737 | $11,271 |
|---|
|
| Average Annual Return [Table Text Block] |
Table SummaryFund/Index Name | 1 Year | 5 Years | Annualized
Since
Inception |
|---|
KraneShares Asia Pacific High Income USD Bond ETF | 6.30% | -0.42% | 1.47% |
|---|
JP Morgan Asia Credit Index (JACI) (USD) (TR)Footnote Reference* | 5.31% | 1.37% | 3.16% |
|---|
Custom Blended KHYB IndexFootnote Reference† | 6.49% | -1.03% | 1.55% |
|---|
|
| No Deduction of Taxes [Text Block] |
The table and graph presented above do not reflect the deduction of taxes a shareholder would pay on Fund distributions or the redemption of Fund shares.
|
| AssetsNet |
$ 15,375,176
|
| Holdings Count | Holding |
66
|
| Advisory Fees Paid, Amount |
$ 148,775
|
| InvestmentCompanyPortfolioTurnover |
198.00%
|
| Additional Fund Statistics [Text Block] |
Key Fund Statistics as of March 31, 2026Table Summary | Total Net Assets | Number of Holdings | Total Advisory Fees Paid | Portfolio Turnover Rate |
|---|
| $15,375,176 | 66 | $148,775 | 198% |
|---|
|
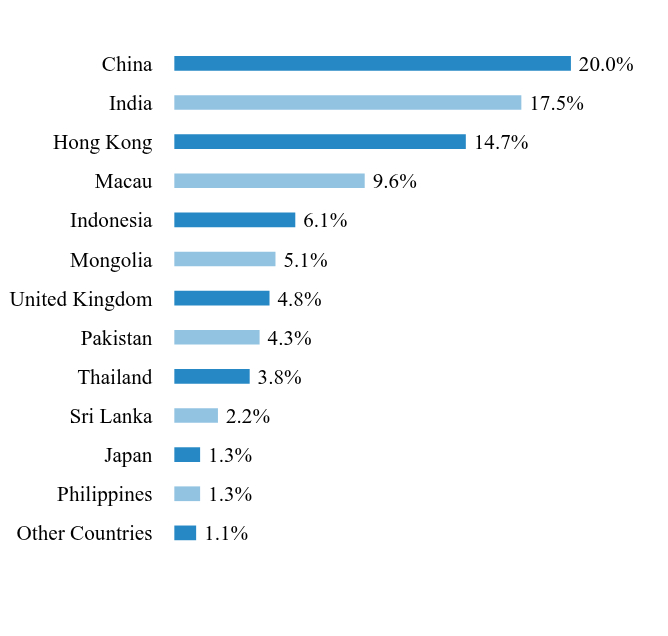
| Holdings [Text Block] |
Country WeightingsFootnote Reference*Footnote Reference^Table SummaryValue | Value |
|---|
Other Countries | 1.1% | Philippines | 1.3% | Japan | 1.3% | Sri Lanka | 2.2% | Thailand | 3.8% | Pakistan | 4.3% | United Kingdom | 4.8% | Mongolia | 5.1% | Indonesia | 6.1% | Macau | 9.6% | Hong Kong | 14.7% | India | 17.5% | China | 20.0% | | Footnote | Description | Footnote* | Percentages are calculated based on total net assets. | Footnote^ | This chart does not include cash, and therefore, the investments as a percentage to total net assets (which includes cash) will not add up to 100%. |
|
| Largest Holdings [Text Block] |
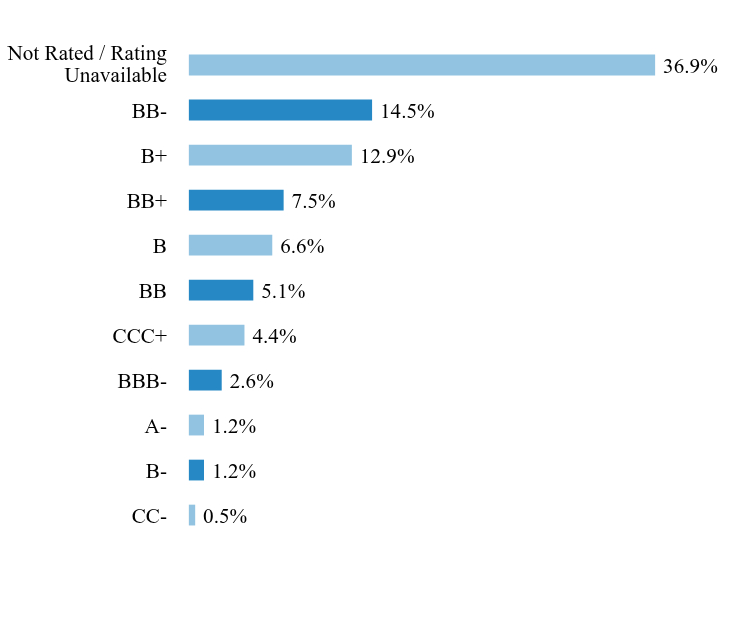
Credit Quality WeightingsFootnote Reference*Table SummaryValue | Value |
|---|
CC- | 0.5% | B- | 1.2% | A- | 1.2% | BBB- | 2.6% | CCC+ | 4.4% | BB | 5.1% | B | 6.6% | BB+ | 7.5% | B+ | 12.9% | BB- | 14.5% | Not Rated / Rating Unavailable | 36.9% | | Footnote | Description | Footnote* | Percentages are calculated based on total net assets. |
|
| Material Fund Change [Text Block] |
This is a summary of certain changes to the Fund since April 1, 2025. For more complete information, you may review the Fund’s prospectus, which is available at https://kraneshares.com/khyb/#fund-documents or upon request at 1-855-857-2638. Effective September 1, 2025, the Fund’s sub-adviser, Nikko Asset Management Americas Inc., changed its name to Amova Asset Management Americas, Inc. Krane Funds Advisors, LLC (“Krane” or the “Adviser”), the investment adviser to the Fund, entered into an agreement whereby its officers and employees, among others, through KFA Two Holdings, LLC, will acquire a majority interest in the Adviser from China International Capital Corporation (USA) Holdings Inc., a wholly-owned, indirect subsidiary of China International Capital Corporation Limited (the “Transaction”). Consummation of the Transaction will, under the Investment Company Act of 1940, result in the automatic termination of the Fund’s existing investment advisory and, if applicable, sub-advisory agreements. In anticipation of the Transaction, the Board approved new advisory and, if applicable, sub-advisory agreements on terms identical to the existing agreements (other than effective and termination dates), subject to shareholder approval of the new advisory agreement. The new sub-advisory agreement will take effect in reliance on a manager-of-managers exemptive order. To ensure continuity of management pending shareholder approval of the new advisory agreement, the Board also approved interim advisory and, if applicable, sub-advisory agreements, effective upon closing of the Transaction, each with terms substantially identical to the current agreements, to remain in effect for up to 150 days while shareholder approval is sought. |
| Updated Prospectus Web Address |
https://kraneshares.com/khyb/
|
| C000210156 |
|
| Shareholder Report [Line Items] |
|
| Fund Name |
KraneShares MSCI Emerging Markets ex China Index ETF
|
| Class Name |
KraneShares MSCI Emerging Markets ex China Index ETF
|
| Trading Symbol |
KEMX
|
| Security Exchange Name |
NYSEArca
|
| Annual or Semi-Annual Statement [Text Block] |
Annual Shareholder Report
|
| Shareholder Report Annual or Semi-Annual |
annual shareholder report
|
| Additional Information [Text Block] |
This annual shareholder report contains important information about the KraneShares MSCI Emerging Markets ex China Index ETF (the "Fund") for the period from April 1, 2025 to March 31, 2026. You can find additional information about the Fund at https://kraneshares.com/kemx/. You can also request this information by contacting us at 1-855-857-2638.
|
| Additional Information Phone Number |
1-855-857-2638
|
| Additional Information Website |
https://kraneshares.com/kemx/
|
| Expenses [Text Block] |
What were the Fund costs for the last year?(based on a hypothetical $10,000 investment) Table SummaryFund Name | Costs of a $10,000 investment | Costs paid as a percentage of a $10,000 investment |
|---|
KraneShares MSCI Emerging Markets ex China Index ETF | $29 | 0.24% |
|---|
|
| Expenses Paid, Amount |
$ 29
|
| Expense Ratio, Percent |
0.24%
|
| Factors Affecting Performance [Text Block] |
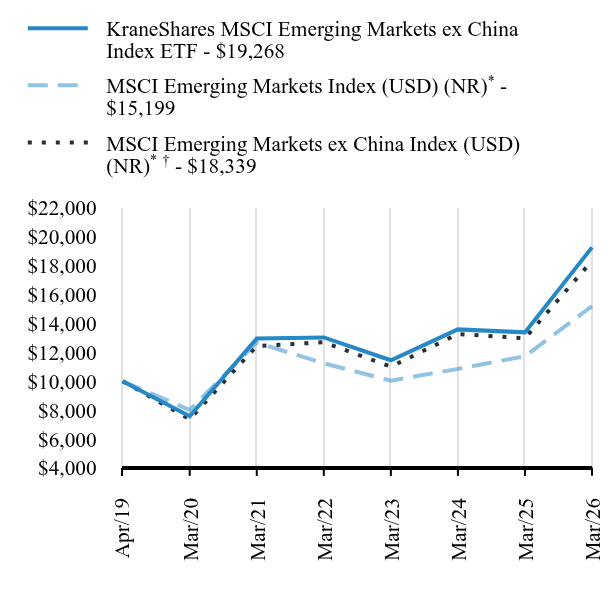
(a) MSCI Emerging Markets ex China Index The KraneShares MSCI Emerging Markets ex China Index ETF (the “Fund”) seeks to provide investment results that, before fees and expenses, correspond generally to the price and yield performance of a specific equity securities index. The Fund’s current index is the MSCI Emerging Markets ex China Index (the “Underlying Index”). Emerging markets ex-China equities outperformed broad emerging market equities (including China), as measured by the MSCI Emerging Markets Index, during the period. Emerging markets ex-China benefited from improving regional economies in Latin America and a weaker U.S. dollar. |
| Performance Past Does Not Indicate Future [Text] |
Past performance is not indicative of future performance.
|
| Line Graph [Table Text Block] |
Table Summary | KraneShares MSCI Emerging Markets ex China Index ETF | MSCI Emerging Markets Index (USD) (NR)Footnote Reference* | MSCI Emerging Markets ex China Index (USD) (NR)Footnote Reference*Footnote Reference† |
|---|
Apr/19 | $10,000 | $10,000 | $10,000 |
|---|
Mar/20 | $7,569 | $8,005 | $7,371 |
|---|
Mar/21 | $12,957 | $12,679 | $12,440 |
|---|
Mar/22 | $13,031 | $11,238 | $12,697 |
|---|
Mar/23 | $11,451 | $10,036 | $11,006 |
|---|
Mar/24 | $13,589 | $10,854 | $13,263 |
|---|
Mar/25 | $13,383 | $11,732 | $12,979 |
|---|
Mar/26 | $19,268 | $15,199 | $18,339 |
|---|
|
| Average Annual Return [Table Text Block] |
Table SummaryFund/Index Name | 1 Year | 5 Years | Annualized
Since
Inception |
|---|
KraneShares MSCI Emerging Markets ex China Index ETF | 43.97% | 8.26% | 9.86% |
|---|
MSCI Emerging Markets Index (USD) (NR)Footnote Reference* | 29.55% | 3.69% | 6.19% |
|---|
MSCI Emerging Markets ex China Index (USD) (NR)Footnote Reference*Footnote Reference† | 41.30% | 8.07% | 9.08% |
|---|
|
| No Deduction of Taxes [Text Block] |
The table and graph presented above do not reflect the deduction of taxes a shareholder would pay on Fund distributions or the redemption of Fund shares.
|
| AssetsNet |
$ 100,768,776
|
| Holdings Count | Holding |
286
|
| Advisory Fees Paid, Amount |
$ 165,961
|
| InvestmentCompanyPortfolioTurnover |
27.00%
|
| Additional Fund Statistics [Text Block] |
Key Fund Statistics as of March 31, 2026Table Summary | Total Net Assets | Number of Holdings | Total Advisory Fees Paid | Portfolio Turnover Rate |
|---|
| $100,768,776 | 286 | $165,961 | 27% |
|---|
|
| Holdings [Text Block] |
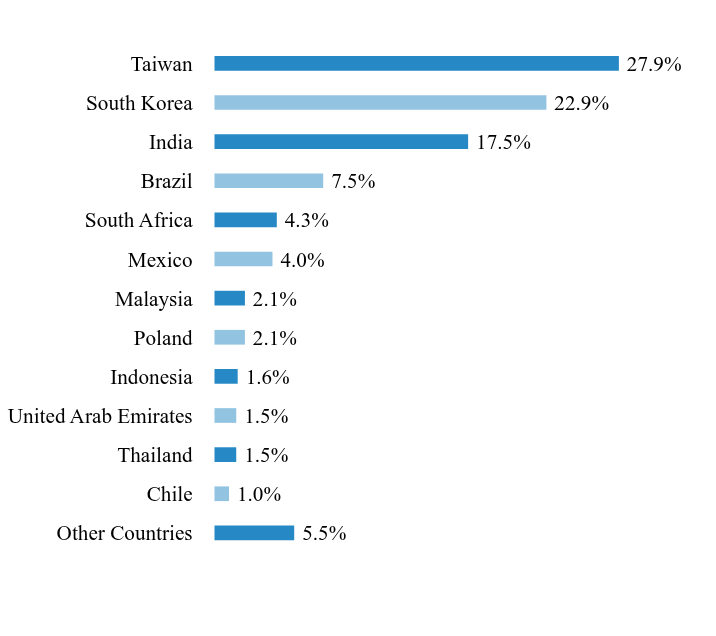
Country WeightingsFootnote Reference*Table SummaryValue | Value |
|---|
Other Countries | 5.5% | Chile | 1.0% | Thailand | 1.5% | United Arab Emirates | 1.5% | Indonesia | 1.6% | Poland | 2.1% | Malaysia | 2.1% | Mexico | 4.0% | South Africa | 4.3% | Brazil | 7.5% | India | 17.5% | South Korea | 22.9% | Taiwan | 27.9% | | Footnote | Description | Footnote* | Percentages are calculated based on total net assets. |
|
| Largest Holdings [Text Block] |
Table SummaryHolding Name | | | Percentage of
Total Net Assets |
|---|
Taiwan Semiconductor Manufacturing | | | 14.7% | Samsung Electronics | | | 6.5% | SK hynix | | | 3.8% | Reliance Industries | | | 1.2% | MediaTek | | | 1.2% | Delta Electronics | | | 1.2% | Accton Technology | | | 1.1% | ICICI Bank | | | 1.0% | Vale | | | 1.0% | HDFC Bank | | | 1.0% | |
| Material Fund Change [Text Block] |
This is a summary of certain changes to the Fund since April 1, 2025. For more complete information, you may review the Fund’s prospectus, which is available at https://kraneshares.com/etf/kemx/#documents or upon request at 1-855-857-2638. Krane Funds Advisors, LLC (“Krane” or the “Adviser”), the investment adviser to the Fund, entered into an agreement whereby its officers and employees, among others, through KFA Two Holdings, LLC, will acquire a majority interest in the Adviser from China International Capital Corporation (USA) Holdings Inc., a wholly-owned, indirect subsidiary of China International Capital Corporation Limited (the “Transaction”). Consummation of the Transaction will, under the Investment Company Act of 1940, result in the automatic termination of the Fund’s existing investment advisory and, if applicable, sub-advisory agreements. In anticipation of the Transaction, the Board approved new advisory and, if applicable, sub-advisory agreements on terms identical to the existing agreements (other than effective and termination dates), subject to shareholder approval of the new advisory agreement. The new sub-advisory agreement will take effect in reliance on a manager-of-managers exemptive order. To ensure continuity of management pending shareholder approval of the new advisory agreement, the Board also approved interim advisory and, if applicable, sub-advisory agreements, effective upon closing of the Transaction, each with terms substantially identical to the current agreements, to remain in effect for up to 150 days while shareholder approval is sought. |
| Updated Prospectus Web Address |
https://kraneshares.com/kemx/
|
| C000214065 |
|
| Shareholder Report [Line Items] |
|
| Fund Name |
KraneShares Global Carbon Strategy ETF
|
| Class Name |
KraneShares Global Carbon Strategy ETF
|
| Trading Symbol |
KRBN
|
| Security Exchange Name |
NYSEArca
|
| Annual or Semi-Annual Statement [Text Block] |
Annual Shareholder Report
|
| Shareholder Report Annual or Semi-Annual |
annual shareholder report
|
| Additional Information [Text Block] |
This annual shareholder report contains important information about the KraneShares Global Carbon Strategy ETF (the "Fund") for the period from April 1, 2025 to March 31, 2026. You can find additional information about the Fund at https://kraneshares.com/krbn/. You can also request this information by contacting us at 1-855-857-2638.
|
| Additional Information Phone Number |
1-855-857-2638
|
| Additional Information Website |
https://kraneshares.com/krbn/
|
| Expenses [Text Block] |
What were the Fund costs for the last year?(based on a hypothetical $10,000 investment) Table SummaryFund Name | Costs of a $10,000 investment | Costs paid as a percentage of a $10,000 investment |
|---|
KraneShares Global Carbon Strategy ETF | $82 | 0.79% |
|---|
|
| Expenses Paid, Amount |
$ 82
|
| Expense Ratio, Percent |
0.79%
|
| Performance Past Does Not Indicate Future [Text] |
Past performance is not indicative of future performance.
|
| No Deduction of Taxes [Text Block] |
The table and graph presented above do not reflect the deduction of taxes a shareholder would pay on Fund distributions or the redemption of Fund shares.
|
| AssetsNet |
$ 131,672,361
|
| Holdings Count | Holding |
9
|
| Advisory Fees Paid, Amount |
$ 1,268,620
|
| InvestmentCompanyPortfolioTurnover |
50.00%
|
| Additional Fund Statistics [Text Block] |
Key Fund Statistics as of March 31, 2026Table Summary | Total Net Assets | Number of Holdings | Total Advisory Fees Paid | Portfolio Turnover Rate |
|---|
| $131,672,361 | 9 | $1,268,620 | 50% |
|---|
|
| Holdings [Text Block] |
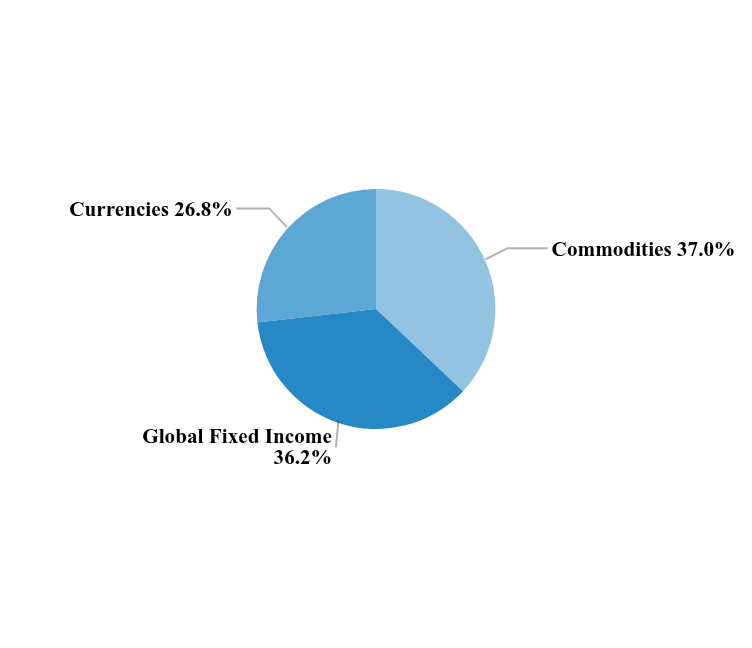
Market ExposureFootnote Reference*Table SummaryAllowance Exposure: | |
|---|
Futures | 48.4% |
|---|
Index Linked Note | 51.7% |
|---|
Collateral and Currency Management: | |
|---|
Short-Term Investment, GVMXX | 5.1% |
|---|
Exchange-Traded Fund | 64.1% |
|---|
Index Linked Note | 19.6% |
|---|
| Footnote | Description | Footnote* | Percentages are calculated based on total net assets. All Investments are presented at market value with the exception of future contracts which are presented at the notional amount. |
|
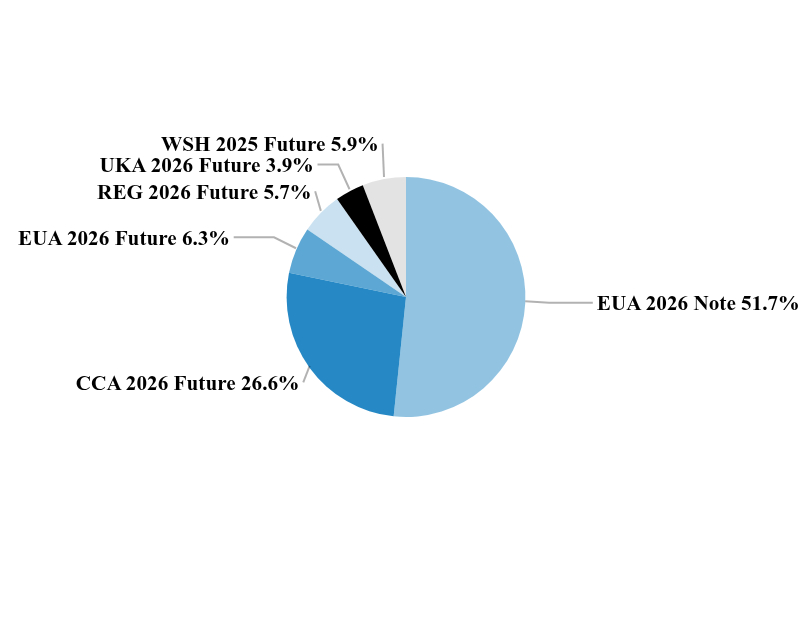
| Largest Holdings [Text Block] |
Allowance BreakdownFootnote Reference^Table SummaryValue | Value |
|---|
EUA 2026 Note | 51.7% | CCA 2026 Future | 26.6% | EUA 2026 Future | 6.3% | REG 2026 Future | 5.7% | UKA 2026 Future | 3.9% | WSH 2025 Future | 5.9% | | Footnote | Description | Footnote^ | Percentages are calculated based on total notional value. Future contracts are presented at the notional value. |
|
| Updated Prospectus Web Address |
https://kraneshares.com/krbn/
|
| C000222186 |
|
| Shareholder Report [Line Items] |
|
| Fund Name |
KraneShares Value Line<sup style="inset: 1.5px 0px 4px; box-sizing: border-box; color: rgb(38, 137, 197); display: inline; flex-wrap: nowrap; font-size: 16px; font-weight: 700; grid-area: auto; line-height: 0px; margin: 0px; overflow: visible; position: relative; text-align: left; text-align-last: auto; white-space-collapse: preserve-breaks;">®</sup> Dynamic Dividend Equity Index ETF
|
| Trading Symbol |
KVLE
|
| Security Exchange Name |
NYSEArca
|
| Annual or Semi-Annual Statement [Text Block] |
Annual Shareholder Report
|
| Shareholder Report Annual or Semi-Annual |
annual shareholder report
|
| Additional Information [Text Block] |
This annual shareholder report contains important information about the KraneShares Value Line® Dynamic Dividend Equity Index ETF (the "Fund") for the period from April 1, 2025 to March 31, 2026. You can find additional information about the Fund at https://kraneshares.com/kvle/. You can also request this information by contacting us at 1-855-857-2638.
|
| Additional Information Phone Number |
1-855-857-2638
|
| Additional Information Website |
https://kraneshares.com/kvle/
|
| Expenses [Text Block] |
What were the Fund costs for the last year?(based on a hypothetical $10,000 investment) Table SummaryFund Name | Costs of a $10,000 investment | Costs paid as a percentage of a $10,000 investment |
|---|
KraneShares Value Line® Dynamic Dividend Equity Index ETF | $59 | 0.56% |
|---|
|
| Expenses Paid, Amount |
$ 59
|
| Expense Ratio, Percent |
0.56%
|
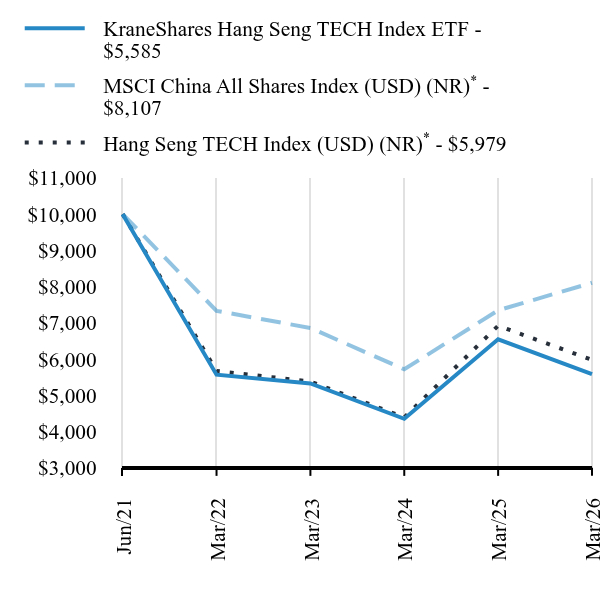
| Factors Affecting Performance [Text Block] |
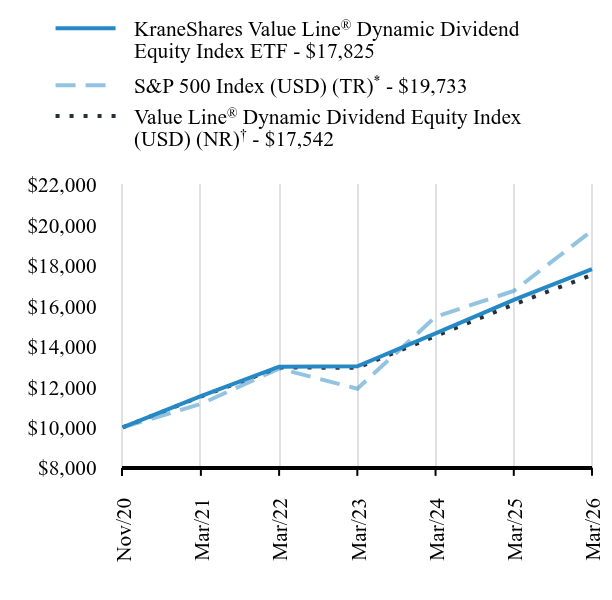
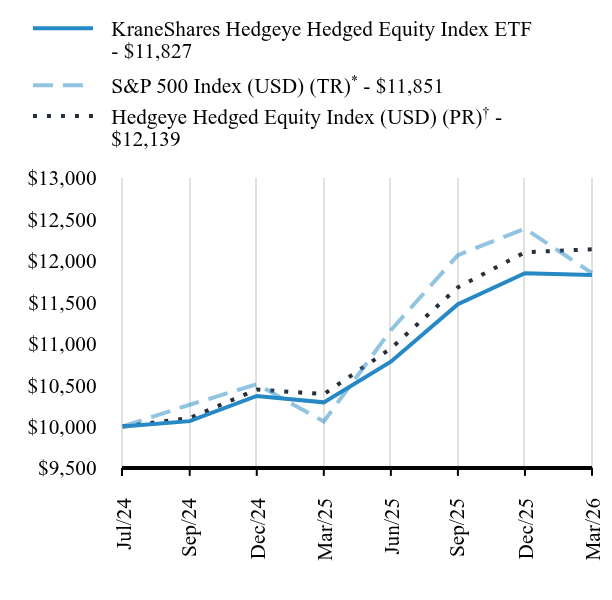
(a) Value Line® Dynamic Dividend Equity Index The KraneShares Value Line® Dynamic Dividend Equity Index ETF seeks to provide investment results that correspond generally to the price and yield performance of the Value Line® Dynamic Dividend Equity Index (the "Underlying Index"). The Underlying Index introduces a market-adaptive approach to investing in U.S. large-cap companies. The strategy seeks to identify U.S. companies whose equity securities pay a high dividend yield and are the highest rated by Value Line®'s Safety™ and Timeliness™ Ranking Systems. Careful quantitative modeling, which incorporates a unique set of risk management tools, adjusts the beta of the overall portfolio based on the market environment. The index is rebalanced monthly. The Fund underperformed the broad U.S. equity market, as measured by the S&P 500 Index, during the period, largely due to its value tilt relative to broader indexes. The information technology stocks held by the Fund contributed the most to its positive performance for the period. Meanwhile, the Consumer Staples stocks held by the Fund detracted the most from performance. |
| Performance Past Does Not Indicate Future [Text] |
Past performance is not indicative of future performance.
|
| Line Graph [Table Text Block] |
Table Summary | KraneShares Value Line® Dynamic Dividend Equity Index ETF | S&P 500 Index (USD) (TR)Footnote Reference* | Value Line® Dynamic Dividend Equity Index (USD) (NR)Footnote Reference† |
|---|
Nov/20 | $10,000 | $10,000 | $10,000 |
|---|
Mar/21 | $11,546 | $11,165 | $11,529 |
|---|
Mar/22 | $13,003 | $12,912 | $12,966 |
|---|
Mar/23 | $13,027 | $11,914 | $12,950 |
|---|
Mar/24 | $14,650 | $15,474 | $14,522 |
|---|
Mar/25 | $16,307 | $16,751 | $16,083 |
|---|
Mar/26 | $17,825 | $19,733 | $17,542 |
|---|
|
| Average Annual Return [Table Text Block] |
Table SummaryFund/Index Name | 1 Year | 5 Years | Annualized
Since
Inception |
|---|
KraneShares Value Line® Dynamic Dividend Equity Index ETF | 9.31% | 9.07% | 11.40% |
|---|
S&P 500 Index (USD) (TR)Footnote Reference* | 17.80% | 12.06% | 13.54% |
|---|
Value Line® Dynamic Dividend Equity Index (USD) (NR)Footnote Reference† | 9.07% | 8.76% | 11.07% |
|---|
|
| No Deduction of Taxes [Text Block] |
The table and graph presented above do not reflect the deduction of taxes a shareholder would pay on Fund distributions or the redemption of Fund shares.
|
| AssetsNet |
$ 34,829,581
|
| Holdings Count | Holding |
75
|
| Advisory Fees Paid, Amount |
$ 144,818
|
| InvestmentCompanyPortfolioTurnover |
112.00%
|
| Additional Fund Statistics [Text Block] |
Key Fund Statistics as of March 31, 2026Table Summary | Total Net Assets | Number of Holdings | Total Advisory Fees Paid | Portfolio Turnover Rate |
|---|
| $34,829,581 | 75 | $144,818 | 112% |
|---|
|
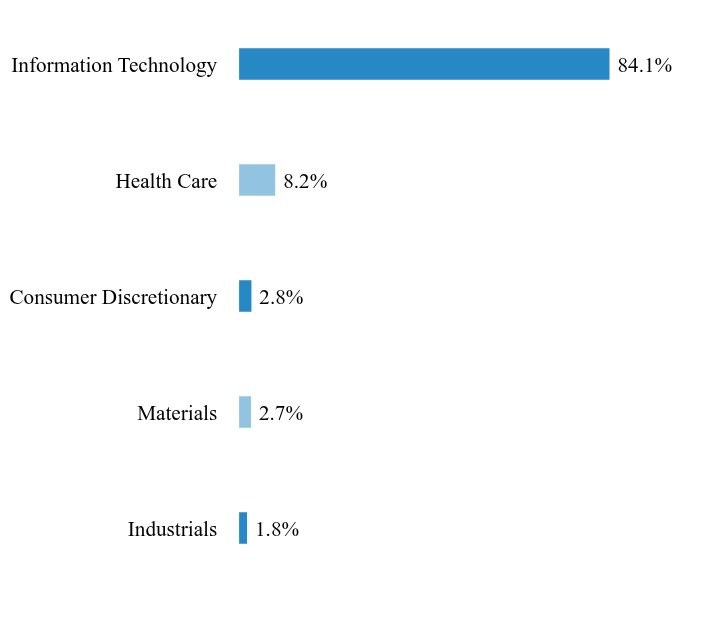
| Holdings [Text Block] |
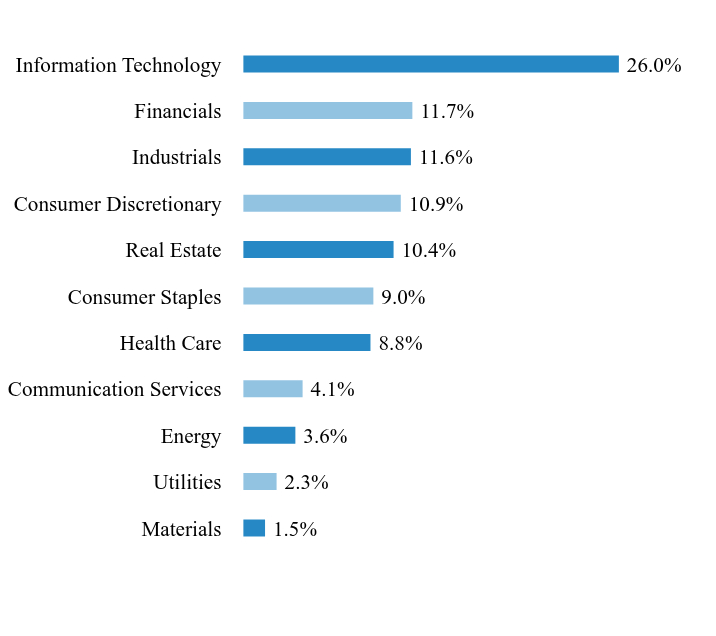
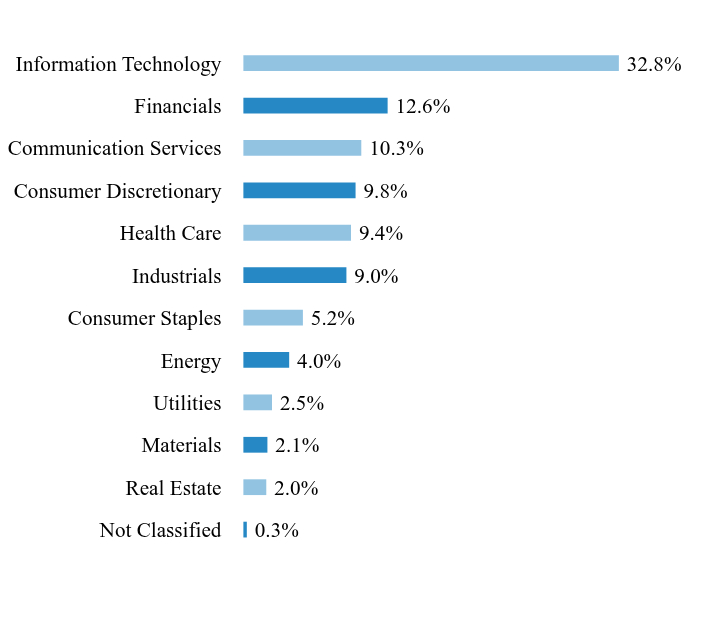
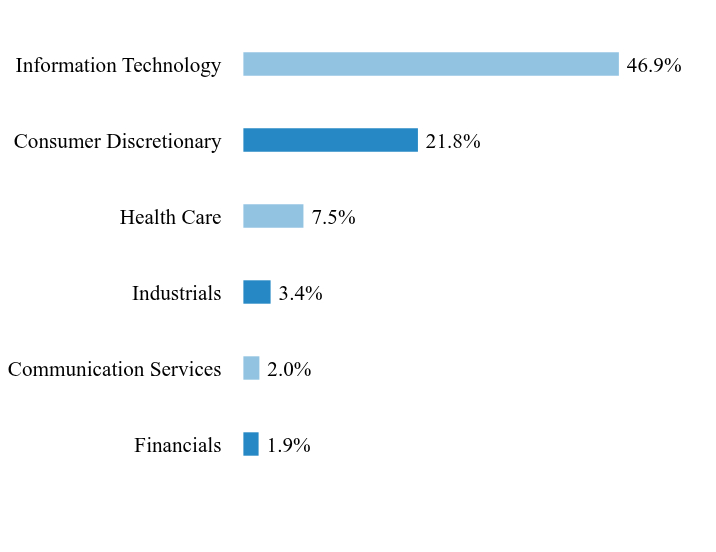
Sector WeightingsFootnote Reference*Table SummaryValue | Value |
|---|
Materials | 1.5% | Utilities | 2.3% | Energy | 3.6% | Communication Services | 4.1% | Health Care | 8.8% | Consumer Staples | 9.0% | Real Estate | 10.4% | Consumer Discretionary | 10.9% | Industrials | 11.6% | Financials | 11.7% | Information Technology | 26.0% | | Footnote | Description | Footnote* | Percentages are calculated based on total net assets. |
|
| Largest Holdings [Text Block] |
Table SummaryHolding Name | | | Percentage of
Total Net Assets |
|---|
NVIDIA | | | 6.8% | Microsoft | | | 5.7% | Broadcom | | | 3.2% | Alphabet, Cl C | | | 2.6% | Johnson & Johnson | | | 2.5% | JPMorgan Chase | | | 2.4% | AbbVie | | | 2.2% | Goldman Sachs Group | | | 2.1% | Cisco Systems | | | 2.0% | Texas Instruments | | | 1.8% | |
| Material Fund Change [Text Block] |
This is a summary of certain changes to the Fund since April 1, 2025. For more complete information, you may review the Fund’s prospectus, which is available at https://kraneshares.com/etf/kvle/#documents or upon request at 1-855-857-2638. Krane Funds Advisors, LLC (“Krane” or the “Adviser”), the investment adviser to the Fund, entered into an agreement whereby its officers and employees, among others, through KFA Two Holdings, LLC, will acquire a majority interest in the Adviser from China International Capital Corporation (USA) Holdings Inc., a wholly-owned, indirect subsidiary of China International Capital Corporation Limited (the “Transaction”). Consummation of the Transaction will, under the Investment Company Act of 1940, result in the automatic termination of the Fund’s existing investment advisory and, if applicable, sub-advisory agreements. In anticipation of the Transaction, the Board approved new advisory and, if applicable, sub-advisory agreements on terms identical to the existing agreements (other than effective and termination dates), subject to shareholder approval of the new advisory agreement. The new sub-advisory agreement will take effect in reliance on a manager-of-managers exemptive order. To ensure continuity of management pending shareholder approval of the new advisory agreement, the Board also approved interim advisory and, if applicable, sub-advisory agreements, effective upon closing of the Transaction, each with terms substantially identical to the current agreements, to remain in effect for up to 150 days while shareholder approval is sought. |
| Updated Prospectus Web Address |
https://kraneshares.com/kvle/
|
| C000223083 |
|
| Shareholder Report [Line Items] |
|
| Fund Name |
KraneShares Mount Lucas Managed Futures Index Strategy ETF
|
| Class Name |
KraneShares Mount Lucas Managed Futures Index Strategy ETF
|
| Trading Symbol |
KMLM
|
| Security Exchange Name |
NYSEArca
|
| Annual or Semi-Annual Statement [Text Block] |
Annual Shareholder Report
|
| Shareholder Report Annual or Semi-Annual |
annual shareholder report
|
| Additional Information [Text Block] |
This annual shareholder report contains important information about the KraneShares Mount Lucas Managed Futures Index Strategy ETF (the "Fund") for the period from April 1, 2025 to March 31, 2026. You can find additional information about the Fund at https://kraneshares.com/kmlm/. You can also request this information by contacting us at 1-855-857-2638.
|
| Additional Information Phone Number |
1-855-857-2638
|
| Additional Information Website |
https://kraneshares.com/kmlm/
|
| Expenses [Text Block] |
What were the Fund costs for the last year?(based on a hypothetical $10,000 investment) Table SummaryFund Name | Costs of a $10,000 investment | Costs paid as a percentage of a $10,000 investment |
|---|
KraneShares Mount Lucas Managed Futures Index Strategy ETF | $94 | 0.90% |
|---|
|
| Expenses Paid, Amount |
$ 94
|
| Expense Ratio, Percent |
0.90%
|
| Factors Affecting Performance [Text Block] |
(a) KFA MLM Index The KraneShares Mount Lucas Managed Futures Index Strategy ETF seeks to provide investment results that, before fees and expenses, track the price performance of the KFA MLM Index (the "Underlying Index"). The Index consists of a portfolio of twenty-two liquid futures contracts traded on U.S. and foreign exchanges. The Index includes futures contracts on 11 commodities, six currencies, and five global bond markets. These three baskets are weighted by their relative historical volatility, and within each basket, the constituent markets are equal dollar weighted. The Fund’s performance over the period was mixed, Commodities contributed to performance while Currencies and Global Bonds detracted. The Fund’s positioning was short global bonds for much of the period though it did move to long positions in the US and UK bonds. The Fund entered the period long the USD, short its basket of global currencies, but as the USD weakened mid-2025, the Fund’s positioning shifted to long global currencies, short the USD. With the one exception being short Yen for much of the period trending lower. The Fund was predominantly short grain markets, long metals, long Live Cattle and short Sugar. Energy markets held mixed exposures during the period but got long Crude, Heating Oil and Unleaded Gas in 2026 as global energy markets surged on as Middle East tensions rose and the Iran War started. |
| Performance Past Does Not Indicate Future [Text] |
Past performance is not indicative of future performance.
|
| No Deduction of Taxes [Text Block] |
The table and graph presented above do not reflect the deduction of taxes a shareholder would pay on Fund distributions or the redemption of Fund shares.
|
| AssetsNet |
$ 272,545,215
|
| Holdings Count | Holding |
27
|
| Advisory Fees Paid, Amount |
$ 1,685,059
|
| InvestmentCompanyPortfolioTurnover |
0.00%
|
| Additional Fund Statistics [Text Block] |
Key Fund Statistics as of March 31, 2026Table Summary | Total Net Assets | Number of Holdings | Total Advisory Fees Paid | Portfolio Turnover Rate |
|---|
| $272,545,215 | 27 | $1,685,059 | 0% |
|---|
|
| Holdings [Text Block] |
Commodity ExposureFootnote Reference*Footnote Reference^Table SummaryValue | Value |
|---|
Commodities | 37.0% | Global Fixed Income | 36.2% | Currencies | 26.8% | | Footnote | Description | Footnote* | Percentages are calculated based on total market value of commodity exposure. | Footnote^ | This chart does not include cash, and therefore, the investments as a percentage to total net assets (which includes cash) will not add up to 100%. |
|
| Largest Holdings [Text Block] |
Table SummaryInstrument | Asset Class | Exposure (%) | Top Position |
|---|
JPN 10Y BOND(OSE) JUN26 | Bond | 33% | Top Short | NATURAL GAS FUTR JUN26 | Commodity | 52% | Top Short | NY HARB ULSD FUT JUN26 | Commodity | 16% | Top Long | JPN YEN CURR FUT JUN26 | Currency | 47% | Top Short | AUDUSD CRNCY FUT JUN26 | Currency | 72% | Top Long | |
| Material Fund Change [Text Block] |
This is a summary of certain changes to the Fund since April 1, 2025. For more complete information, you may review the Fund’s prospectus, which is available at https://kraneshares.com/etf/kmlm/#fund-documents or upon request at 1-855-857-2638. Krane Funds Advisors, LLC (“Krane” or the “Adviser”), the investment adviser to the Fund, entered into an agreement whereby its officers and employees, among others, through KFA Two Holdings, LLC, will acquire a majority interest in the Adviser from China International Capital Corporation (USA) Holdings Inc., a wholly-owned, indirect subsidiary of China International Capital Corporation Limited (the “Transaction”). Consummation of the Transaction will, under the Investment Company Act of 1940, result in the automatic termination of the Fund’s existing investment advisory and, if applicable, sub-advisory agreements. In anticipation of the Transaction, the Board approved new advisory and, if applicable, sub-advisory agreements on terms identical to the existing agreements (other than effective and termination dates), subject to shareholder approval of the new advisory agreement. The new sub-advisory agreement will take effect in reliance on a manager-of-managers exemptive order. To ensure continuity of management pending shareholder approval of the new advisory agreement, the Board also approved interim advisory and, if applicable, sub-advisory agreements, effective upon closing of the Transaction, each with terms substantially identical to the current agreements, to remain in effect for up to 150 days while shareholder approval is sought. |
| Updated Prospectus Web Address |
https://kraneshares.com/kmlm/
|
| C000220718 |
|
| Shareholder Report [Line Items] |
|
| Fund Name |
KraneShares SSE STAR Market 50 Index ETF
|
| Class Name |
KraneShares SSE STAR Market 50 Index ETF
|
| Trading Symbol |
KSTR
|
| Security Exchange Name |
NYSEArca
|
| Annual or Semi-Annual Statement [Text Block] |
Annual Shareholder Report
|
| Shareholder Report Annual or Semi-Annual |
annual shareholder report
|
| Additional Information [Text Block] |
This annual shareholder report contains important information about the KraneShares SSE STAR Market 50 Index ETF (the "Fund") for the period from April 1, 2025 to March 31, 2026. You can find additional information about the Fund at https://kraneshares.com/kstr/. You can also request this information by contacting us at 1-855-857-2638.
|
| Additional Information Phone Number |
1-855-857-2638
|
| Additional Information Website |
https://kraneshares.com/kstr/
|
| Expenses [Text Block] |
What were the Fund costs for the last year?(based on a hypothetical $10,000 investment) Table SummaryFund Name | Costs of a $10,000 investment | Costs paid as a percentage of a $10,000 investment |
|---|
KraneShares SSE STAR Market 50 Index ETF | $102 | 0.89% |
|---|
|
| Expenses Paid, Amount |
$ 102
|
| Expense Ratio, Percent |
0.89%
|
| Factors Affecting Performance [Text Block] |
(a) Shanghai Stock Exchange Science and Technology Innovation Board 50 Index The KraneShares SSE STAR Market 50 Index ETF seeks to provide investment results that, before fees and expenses, correspond generally to the price and yield performance of the Shanghai Stock Exchange ("SSE") Science and Technology Innovation Board 50 Index (the "Underlying Index"). The Underlying Index is comprised of the 50 largest companies listed on the SSE Science and Technology Innovation Board ("STAR Market") as determined by market capitalization and liquidity. STAR Market-listed equities outperformed China’s market more broadly, as measured by the MSCI China All Shares Index, during the period. STAR-market listed equities benefited from strong performance in chipmakers and other technology hardware producers amid expectations of robust domestic and overseas demand for AI and cloud computing. The Underlying Index includes a name indicated in U.S. Executive Order 13959/14032(1) that was not held in the portfolio during the period. (1) Executive Order 13959/14032, signed by President Trump on November 12, 2020, prohibits U.S. investors from purchasing or transacting in securities linked to Chinese companies identified as tied to the Chinese military (CMICs). It became effective on January 11, 2021. Executive Order 14032, signed by President Biden on June 3, 2021, amends Executive Order 13959 by maintaining the investment restrictions while allowing the Treasury Secretary, in coordination with the Secretaries of State and Defense, to update the list of prohibited companies. It also outlines procedures for U.S. persons to divest from such securities. |
| Performance Past Does Not Indicate Future [Text] |
Past performance is not indicative of future performance.
|
| Line Graph [Table Text Block] |
Table Summary | KraneShares SSE STAR Market 50 Index ETF | MSCI China All Shares Index (USD) (NR)Footnote Reference* | SSE Science and Technology Innovation Board 50 Index (USD, TR)Footnote Reference† |
|---|
Jan/21 | $10,000 | $10,000 | $10,000 |
|---|
Mar/21 | $8,424 | $8,896 | $8,334 |
|---|
Mar/22 | $7,504 | $6,743 | $7,555 |
|---|
Mar/23 | $6,756 | $6,309 | $6,946 |
|---|
Mar/24 | $4,360 | $5,260 | $4,688 |
|---|
Mar/25 | $5,532 | $6,757 | $6,309 |
|---|
Mar/26 | $7,128 | $7,457 | $8,170 |
|---|
|
| Average Annual Return [Table Text Block] |
Table SummaryFund/Index Name | 1 Year | 5 Years | Annualized
Since
Inception |
|---|
KraneShares SSE STAR Market 50 Index ETF | 28.85% | -3.29% | -6.33% |
|---|
MSCI China All Shares Index (USD) (NR)Footnote Reference* | 10.36% | -3.47% | -5.51% |
|---|
SSE Science and Technology Innovation Board 50 Index (USD, TR)Footnote Reference† | 29.50% | -0.40% | -3.83% |
|---|
|
| No Deduction of Taxes [Text Block] |
The table and graph presented above do not reflect the deduction of taxes a shareholder would pay on Fund distributions or the redemption of Fund shares.
|
| AssetsNet |
$ 81,081,466
|
| Holdings Count | Holding |
51
|
| Advisory Fees Paid, Amount |
$ 464,461
|
| InvestmentCompanyPortfolioTurnover |
188.00%
|
| Additional Fund Statistics [Text Block] |
Key Fund Statistics as of March 31, 2026Table Summary | Total Net Assets | Number of Holdings | Total Advisory Fees Paid | Portfolio Turnover Rate |
|---|
| $81,081,466 | 51 | $464,461 | 188% |
|---|
|
| Holdings [Text Block] |
Sector WeightingsFootnote Reference*Table SummaryValue | Value |
|---|
Industrials | 1.8% | Materials | 2.7% | Consumer Discretionary | 2.8% | Health Care | 8.2% | Information Technology | 84.1% | | Footnote | Description | Footnote* | Percentages are calculated based on total net assets. |
|
| Largest Holdings [Text Block] |
Table SummaryHolding Name | | | Percentage of
Total Net Assets |
|---|
Cambricon Technologies, Cl A | | | 10.2% | Hygon Information Technology, Cl A | | | 9.6% | Montage Technology, Cl A | | | 7.1% | Advanced Micro-Fabrication Equipment China, Cl A | | | 5.2% | Verisilicon Microelectronics Shanghai, Cl A | | | 4.1% | Biwin Storage Technology, Cl A | | | 3.8% | Piotech, Cl A | | | 3.4% | Shanghai United Imaging Healthcare, Cl A | | | 3.0% | Beijing Kingsoft Office Software, Cl A | | | 3.0% | Hwatsing Technology, Cl A | | | 2.4% | |
| Material Fund Change [Text Block] |
This is a summary of certain changes to the Fund since April 1, 2025. For more complete information, you may review the Fund’s prospectus, which is available at https://kraneshares.com/etf/kstr/#documents or upon request at 1-855-857-2638. Krane Funds Advisors, LLC (“Krane” or the “Adviser”), the investment adviser to the Fund, entered into an agreement whereby its officers and employees, among others, through KFA Two Holdings, LLC, will acquire a majority interest in the Adviser from China International Capital Corporation (USA) Holdings Inc., a wholly-owned, indirect subsidiary of China International Capital Corporation Limited (the “Transaction”). Consummation of the Transaction will, under the Investment Company Act of 1940, result in the automatic termination of the Fund’s existing investment advisory and, if applicable, sub-advisory agreements. In anticipation of the Transaction, the Board approved new advisory and, if applicable, sub-advisory agreements on terms identical to the existing agreements (other than effective and termination dates), subject to shareholder approval of the new advisory agreement. The new sub-advisory agreement will take effect in reliance on a manager-of-managers exemptive order. To ensure continuity of management pending shareholder approval of the new advisory agreement, the Board also approved interim advisory and, if applicable, sub-advisory agreements, effective upon closing of the Transaction, each with terms substantially identical to the current agreements, to remain in effect for up to 150 days while shareholder approval is sought. |
| Updated Prospectus Web Address |
https://kraneshares.com/kstr/
|
| C000223017 |
|
| Shareholder Report [Line Items] |
|
| Fund Name |
KraneShares Hang Seng TECH Index ETF
|
| Class Name |
KraneShares Hang Seng TECH Index ETF
|
| Trading Symbol |
KTEC
|
| Security Exchange Name |
NYSEArca
|
| Annual or Semi-Annual Statement [Text Block] |
Annual Shareholder Report
|
| Shareholder Report Annual or Semi-Annual |
annual shareholder report
|
| Additional Information [Text Block] |
This annual shareholder report contains important information about the KraneShares Hang Seng TECH Index ETF (the "Fund") for the period from April 1, 2025 to March 31, 2026. You can find additional information about the Fund at https://kraneshares.com/ktec/. You can also request this information by contacting us at 1-855-857-2638.
|
| Additional Information Phone Number |
1-855-857-2638
|
| Additional Information Website |
https://kraneshares.com/ktec/
|
| Expenses [Text Block] |
What were the Fund costs for the last year?(based on a hypothetical $10,000 investment) Table SummaryFund Name | Costs of a $10,000 investment | Costs paid as a percentage of a $10,000 investment |
|---|
KraneShares Hang Seng TECH Index ETF | $64 | 0.69% |
|---|
|
| Expenses Paid, Amount |
$ 64
|
| Expense Ratio, Percent |
0.69%
|
| Factors Affecting Performance [Text Block] |
(a) Hang Seng TECH Index The KraneShares Hang Seng TECH Index ETF seeks to provide investment results that, before expenses and fees, correspond generally to the price and yield performance of the Hang Seng TECH Index (the "Underlying Index"). The Underlying Index is designed to track the performance of the 30 largest technology companies listed in Hong Kong with significant revenue exposure to technology themes. Hong Kong-listed technology equities underperformed the broader Chinese equity market, as measured by the MSCI China All Shares Index, due to intense competition in China's E-Commerce industry, which weighed on the margins of large-cap e-commerce firms. Also, geopolitical headwinds, including tariffs, weighed on foreign investor sentiment towards China, further detracting from their performance. However, growth in artificial intelligence and cloud computing services remained strong for many Hong Kong-listed technology companies during the period. |
| Performance Past Does Not Indicate Future [Text] |
Past performance is not indicative of future performance.
|
| Line Graph [Table Text Block] |
Table Summary | KraneShares Hang Seng TECH Index ETF | MSCI China All Shares Index (USD) (NR)Footnote Reference* | Hang Seng TECH Index (USD) (NR)Footnote Reference* |
|---|
Jun/21 | $10,000 | $10,000 | $10,000 |
|---|
Mar/22 | $5,572 | $7,332 | $5,674 |
|---|
Mar/23 | $5,328 | $6,859 | $5,381 |
|---|
Mar/24 | $4,354 | $5,719 | $4,392 |
|---|
Mar/25 | $6,548 | $7,346 | $6,921 |
|---|
Mar/26 | $5,585 | $8,107 | $5,979 |
|---|
|
| Average Annual Return [Table Text Block] |
Table SummaryFund/Index Name | 1 Year | Annualized
Since
Inception |
|---|
KraneShares Hang Seng TECH Index ETF | -14.71% | -11.40% |
|---|
MSCI China All Shares Index (USD) (NR)Footnote Reference* | 10.36% | -4.27% |
|---|
Hang Seng TECH Index (USD) (NR)Footnote Reference* | -13.61% | -10.13% |
|---|
|
| No Deduction of Taxes [Text Block] |
The table and graph presented above do not reflect the deduction of taxes a shareholder would pay on Fund distributions or the redemption of Fund shares.
|
| AssetsNet |
$ 50,732,389
|
| Holdings Count | Holding |
29
|
| Advisory Fees Paid, Amount |
$ 356,460
|
| InvestmentCompanyPortfolioTurnover |
71.00%
|
| Additional Fund Statistics [Text Block] |
Key Fund Statistics as of March 31, 2026Table Summary | Total Net Assets | Number of Holdings | Total Advisory Fees Paid | Portfolio Turnover Rate |
|---|
| $50,732,389 | 29 | $356,460 | 71% |
|---|
|
| Holdings [Text Block] |
Sector WeightingsFootnote Reference*Footnote Reference^Table SummaryValue | Value |
|---|
Consumer Staples | 2.7% | Information Technology | 20.4% | Communication Services | 27.8% | Consumer Discretionary | 44.2% | | Footnote | Description | Footnote* | Percentages are calculated based on total net assets. | Footnote^ | This chart does not include cash, and therefore, the investments as a percentage to total net assets (which includes cash) will not add up to 100%. |
|
| Largest Holdings [Text Block] |
Table SummaryHolding Name | | | Percentage of
Total Net Assets |
|---|
BYD, Cl H | | | 9.9% | Meituan, Cl B | | | 9.8% | Xiaomi, Cl B | | | 9.0% | Tencent Holdings | | | 8.5% | NetEase | | | 7.9% | JD.com, Cl A | | | 4.5% | Alibaba Group Holding | | | 4.5% | Kuaishou Technology, Cl B | | | 4.4% | Baidu, Cl A | | | 4.3% | XPeng, Cl A | | | 3.5% | |
| Material Fund Change [Text Block] |
This is a summary of certain changes to the Fund since April 1, 2025. For more complete information, you may review the Fund’s prospectus, which is available at https://kraneshares.com/etf/ktec/#documents or upon request at 1-855-857-2638. Krane Funds Advisors, LLC (“Krane” or the “Adviser”), the investment adviser to the Fund, entered into an agreement whereby its officers and employees, among others, through KFA Two Holdings, LLC, will acquire a majority interest in the Adviser from China International Capital Corporation (USA) Holdings Inc., a wholly-owned, indirect subsidiary of China International Capital Corporation Limited (the “Transaction”). Consummation of the Transaction will, under the Investment Company Act of 1940, result in the automatic termination of the Fund’s existing investment advisory and, if applicable, sub-advisory agreements. In anticipation of the Transaction, the Board approved new advisory and, if applicable, sub-advisory agreements on terms identical to the existing agreements (other than effective and termination dates), subject to shareholder approval of the new advisory agreement. The new sub-advisory agreement will take effect in reliance on a manager-of-managers exemptive order. To ensure continuity of management pending shareholder approval of the new advisory agreement, the Board also approved interim advisory and, if applicable, sub-advisory agreements, effective upon closing of the Transaction, each with terms substantially identical to the current agreements, to remain in effect for up to 150 days while shareholder approval is sought. |
| Updated Prospectus Web Address |
https://kraneshares.com/ktec/
|
| C000229247 |
|
| Shareholder Report [Line Items] |
|
| Fund Name |
KraneShares California Carbon Allowance Strategy ETF
|
| Class Name |
KraneShares California Carbon Allowance Strategy ETF
|
| Trading Symbol |
KCCA
|
| Security Exchange Name |
NYSEArca
|
| Annual or Semi-Annual Statement [Text Block] |
Annual Shareholder Report
|
| Shareholder Report Annual or Semi-Annual |
annual shareholder report
|
| Additional Information [Text Block] |
This annual shareholder report contains important information about the KraneShares California Carbon Allowance Strategy ETF (the "Fund") for the period from April 1, 2025 to March 31, 2026. You can find additional information about the Fund at https://kraneshares.com/kcca/. You can also request this information by contacting us at 1-855-857-2638.
|
| Additional Information Phone Number |
1-855-857-2638
|
| Additional Information Website |
https://kraneshares.com/kcca/
|
| Expenses [Text Block] |
What were the Fund costs for the last year?(based on a hypothetical $10,000 investment) Table SummaryFund Name | Costs of a $10,000 investment | Costs paid as a percentage of a $10,000 investment |
|---|
KraneShares California Carbon Allowance Strategy ETF | $76 | 0.79% |
|---|
|
| Expenses Paid, Amount |
$ 76
|
| Expense Ratio, Percent |
0.79%
|
| Performance Past Does Not Indicate Future [Text] |
Past performance is not indicative of future performance.
|
| No Deduction of Taxes [Text Block] |
The table and graph presented above do not reflect the deduction of taxes a shareholder would pay on Fund distributions or the redemption of Fund shares.
|
| AssetsNet |
$ 105,547,125
|
| Holdings Count | Holding |
3
|
| Advisory Fees Paid, Amount |
$ 885,540
|
| InvestmentCompanyPortfolioTurnover |
42.00%
|
| Additional Fund Statistics [Text Block] |
Key Fund Statistics as of March 31, 2026Table Summary | Total Net Assets | Number of Holdings | Total Advisory Fees Paid | Portfolio Turnover Rate |
|---|
| $105,547,125 | 3 | $885,540 | 42% |
|---|
|
| Holdings [Text Block] |
Collateral ManagementFootnote Reference*Table SummaryShort-Term Investment, GVMXX | 7.2% |
|---|
Exchange-Traded FundFootnote Reference** | 82.2% |
|---|
| Footnote | Description | Footnote* | Percentages are calculated based on total net assets. All Investments are presented at market value with the exception of future contracts which are presented at the notional amount. | Footnote** | Affiliated Investment |
|
| Largest Holdings [Text Block] |
Futures BreakdownFootnote Reference^Footnote Reference*Table SummaryValue | Value |
|---|
California | 100.0% | | Footnote | Description | Footnote^ | Percentages are calculated based on total notional value. Future contracts are presented at the notional value. | Footnote* | At the latest auction, which occurred on February 18, 2026, 12.50% of allowances were purchased for Quebec-based polluters. |
|
| Updated Prospectus Web Address |
https://kraneshares.com/kcca/
|
| C000240471 |
|
| Shareholder Report [Line Items] |
|
| Fund Name |
KraneShares KWEB Covered Call Strategy ETF
|
| Class Name |
KraneShares KWEB Covered Call Strategy ETF
|
| Trading Symbol |
KLIP
|
| Security Exchange Name |
NYSEArca
|
| Annual or Semi-Annual Statement [Text Block] |
Annual Shareholder Report
|
| Shareholder Report Annual or Semi-Annual |
annual shareholder report
|
| Additional Information [Text Block] |
This annual shareholder report contains important information about the KraneShares KWEB Covered Call Strategy ETF (the "Fund") for the period from April 1, 2025 to March 31, 2026. You can find additional information about the Fund at https://kraneshares.com/klip/. You can also request this information by contacting us at 1-855-857-2638.
|
| Additional Information Phone Number |
1-855-857-2638
|
| Additional Information Website |
https://kraneshares.com/klip/
|
| Expenses [Text Block] |
What were the Fund costs for the last year?(based on a hypothetical $10,000 investment) Table SummaryFund Name | Costs of a $10,000 investment | Costs paid as a percentage of a $10,000 investment |
|---|
KraneShares KWEB Covered Call Strategy ETF | $26 | 0.26% |
|---|
|
| Expenses Paid, Amount |
$ 26
|
| Expense Ratio, Percent |
0.26%
|
| Factors Affecting Performance [Text Block] |
^ Fund is actively managed and does not track an Underlying Index. The KraneShares KWEB Covered Call Strategy ETF seeks to provide current income. To achieve its investment objective, the Fund employs a covered call strategy. Under normal circumstances, the Fund invests at least 80% of its net assets (plus borrowings for investment purposes) in the component securities of the CSI Overseas China Internet Index or in instruments that have economic characteristics similar to those in the Index and writes (sells) covered call options on the Index or in instruments that have economic characteristics similar to writing covered call options on the Index. Currently, the Fund invests in the KraneShares CSI China Internet ETF (the "Underlying Fund"), which is an exchange-traded fund advised by Krane that seeks to track the Index, and to write (sell) covered call options on the Underlying Fund. A decline in the volatility of China’s internet equities led to a decrease in the options premiums earned by the Fund during the period. China’s internet equities underperformed the broader Chinese equity market, as measured by the MSCI China All Shares Index, due to intense competition in China's E-Commerce industry, which weighed on the margins of large-cap e-commerce firms. |
| Performance Past Does Not Indicate Future [Text] |
Past performance is not indicative of future performance.
|
| Line Graph [Table Text Block] |
Table Summary | KraneShares KWEB Covered Call Strategy ETF | MSCI China All Shares Index (USD) (NR)Footnote Reference* | CSI Overseas China Internet Index (USD) (PR)Footnote Reference† |
|---|
Jan/23 | $10,000 | $10,000 | $10,000 |
|---|
Mar/23 | $9,644 | $9,652 | $9,052 |
|---|
Mar/24 | $11,021 | $8,047 | $7,744 |
|---|
Mar/25 | $12,179 | $10,337 | $10,541 |
|---|
Mar/26 | $12,146 | $11,408 | $8,892 |
|---|
|
| Average Annual Return [Table Text Block] |
Table SummaryFund/Index Name | 1 Year | Annualized
Since
Inception |
|---|
KraneShares KWEB Covered Call Strategy ETF | -0.27% | 6.22% |
|---|
MSCI China All Shares Index (USD) (NR)Footnote Reference* | 10.36% | 4.18% |
|---|
CSI Overseas China Internet Index (USD) (PR)Footnote Reference† | -15.65% | -3.58% |
|---|
|
| No Deduction of Taxes [Text Block] |
The table and graph presented above do not reflect the deduction of taxes a shareholder would pay on Fund distributions or the redemption of Fund shares.
|
| AssetsNet |
$ 111,303,120
|
| Holdings Count | Holding |
8
|
| Advisory Fees Paid, Amount |
$ 275,962
|
| InvestmentCompanyPortfolioTurnover |
397.00%
|
| Additional Fund Statistics [Text Block] |
Key Fund Statistics as of March 31, 2026Table Summary | Total Net Assets | Number of Holdings | Total Advisory Fees Paid | Portfolio Turnover Rate |
|---|
| $111,303,120 | 8 | $275,962 | 397% |
|---|
|
| Holdings [Text Block] |
(KWEB) Sector WeightingsFootnote Reference*Table SummaryValue | Value |
|---|
Financials | 2.1% | Real Estate | 4.3% | Industrials | 6.4% | Consumer Staples | 8.3% | Communication Services | 37.3% | Consumer Discretionary | 41.4% | | Footnote | Description | Footnote* | Percentages are calculated based on total net assets of KWEB (KraneShares CSI China Internet ETF), an investment in which the Fund holds shares. These securities are not direct holdings of the Fund itself. |
|
| Largest Holdings [Text Block] |
Table SummaryHolding Name | | | Percentage of
Total Net AssetsFootnote Reference(A) |
|---|
KraneShares CSI China Internet ETFFootnote Reference** | | | 101.8% | Written OptionsFootnote Reference(1) | | | -2.0% | | Footnote | Description | Footnote** | Affiliated Investment | Footnote(1) | At market value. | Footnote(A) | Short-Term Investments are not shown in the top ten chart. |
|
| Material Fund Change [Text Block] |
This is a summary of certain changes to the Fund since April 1, 2025. For more complete information, you may review the Fund’s prospectus, which is available at https://kraneshares.com/etf/klip/#fund-documents or upon request at 1-855-857-2638. Krane Funds Advisors, LLC (“Krane” or the “Adviser”), the investment adviser to the Fund, entered into an agreement whereby its officers and employees, among others, through KFA Two Holdings, LLC, will acquire a majority interest in the Adviser from China International Capital Corporation (USA) Holdings Inc., a wholly-owned, indirect subsidiary of China International Capital Corporation Limited (the “Transaction”). Consummation of the Transaction will, under the Investment Company Act of 1940, result in the automatic termination of the Fund’s existing investment advisory and, if applicable, sub-advisory agreements. In anticipation of the Transaction, the Board approved new advisory and, if applicable, sub-advisory agreements on terms identical to the existing agreements (other than effective and termination dates), subject to shareholder approval of the new advisory agreement. The new sub-advisory agreement will take effect in reliance on a manager-of-managers exemptive order. To ensure continuity of management pending shareholder approval of the new advisory agreement, the Board also approved interim advisory and, if applicable, sub-advisory agreements, effective upon closing of the Transaction, each with terms substantially identical to the current agreements, to remain in effect for up to 150 days while shareholder approval is sought. |
| Updated Prospectus Web Address |
https://kraneshares.com/klip/
|
| C000249202 |
|
| Shareholder Report [Line Items] |
|
| Fund Name |
KraneShares Hedgeye Hedged Equity Index ETF
|
| Class Name |
KraneShares Hedgeye Hedged Equity Index ETF
|
| Trading Symbol |
KSPY
|
| Security Exchange Name |
NYSEArca
|
| Annual or Semi-Annual Statement [Text Block] |
Annual Shareholder Report
|
| Shareholder Report Annual or Semi-Annual |
annual shareholder report
|
| Additional Information [Text Block] |
This annual shareholder report contains important information about the KraneShares Hedgeye Hedged Equity Index ETF (the "Fund") for the period from April 1, 2025 to March 31, 2026. You can find additional information about the Fund at https://kraneshares.com/kspy/. You can also request this information by contacting us at 1-855-857-2638.
|
| Additional Information Phone Number |
1-855-857-2638
|
| Additional Information Website |
https://kraneshares.com/kspy/
|
| Expenses [Text Block] |
What were the Fund costs for the last year?(based on a hypothetical $10,000 investment) Table SummaryFund Name | Costs of a $10,000 investment | Costs paid as a percentage of a $10,000 investment |
|---|
KraneShares Hedgeye Hedged Equity Index ETF | $77 | 0.72% |
|---|
|
| Expenses Paid, Amount |
$ 77
|
| Expense Ratio, Percent |
0.72%
|
| Factors Affecting Performance [Text Block] |
(a) Hedgeye Hedged Equity Index The KraneShares Hedgeye Hedged Equity Index ETF seeks to provide investment results that, before fees and expenses, correspond generally to the price and yield performance of the Hedgeye Hedged Equity Index (the "Underlying Index"). The Underlying Index is designed to track the performance of a portfolio of large-cap securities subject to downside hedging and seeking to exhibit less volatility than a portfolio of large-cap securities alone. The Underlying Index models an investment in the S&P 500 Index, the purchase and sale of put options on the S&P 500 Index and Flexible Exchange® Options (“FLEX Options”) on an ETF that tracks the S&P 500 Index or a similar large-cap securities index, and the sale of call options on the S&P 500 Index. Fund assets not invested in options are invested in an ETF that seeks to track the S&P 500 Index. The put options on the S&P 500 Index and the State Street SPDR S&P 500 Trust ETF held by the Fund detracted from its performance relative to the S&P 500 Index, which was up during the period. |
| Performance Past Does Not Indicate Future [Text] |
Past performance is not indicative of future performance.
|
| Line Graph [Table Text Block] |
Table Summary | KraneShares Hedgeye Hedged Equity Index ETF | S&P 500 Index (USD) (TR)Footnote Reference* | Hedgeye Hedged Equity Index (USD) (PR)Footnote Reference† |
|---|
Jul/24 | $10,000 | $10,000 | $10,000 |
|---|
Sep/24 | $10,064 | $10,262 | $10,102 |
|---|
Dec/24 | $10,368 | $10,509 | $10,446 |
|---|
Mar/25 | $10,291 | $10,060 | $10,390 |
|---|
Jun/25 | $10,782 | $11,161 | $10,941 |
|---|
Sep/25 | $11,475 | $12,068 | $11,679 |
|---|
Dec/25 | $11,849 | $12,388 | $12,102 |
|---|
Mar/26 | $11,827 | $11,851 | $12,139 |
|---|
|
| Average Annual Return [Table Text Block] |
Table SummaryFund/Index Name | 1 Year | Annualized
Since
Inception |
|---|
KraneShares Hedgeye Hedged Equity Index ETF | 14.92% | 10.31% |
|---|
S&P 500 Index (USD) (TR)Footnote Reference* | 17.80% | 10.45% |
|---|
Hedgeye Hedged Equity Index (USD) (PR)Footnote Reference† | 16.83% | 12.01% |
|---|
|
| No Deduction of Taxes [Text Block] |
The table and graph presented above do not reflect the deduction of taxes a shareholder would pay on Fund distributions or the redemption of Fund shares.
|
| AssetsNet |
$ 76,784,891
|
| Holdings Count | Holding |
4
|
| Advisory Fees Paid, Amount |
$ 279,350
|
| InvestmentCompanyPortfolioTurnover |
30.00%
|
| Additional Fund Statistics [Text Block] |
Key Fund Statistics as of March 31, 2026Table Summary | Total Net Assets | Number of Holdings | Total Advisory Fees Paid | Portfolio Turnover Rate |
|---|
| $76,784,891 | 4 | $279,350 | 30% |
|---|
|
| Holdings [Text Block] |
KSPY Sector WeightingsFootnote Reference*Table SummaryValue | Value |
|---|
Not Classified | 0.3% | Real Estate | 2.0% | Materials | 2.1% | Utilities | 2.5% | Energy | 4.0% | Consumer Staples | 5.2% | Industrials | 9.0% | Health Care | 9.4% | Consumer Discretionary | 9.8% | Communication Services | 10.3% | Financials | 12.6% | Information Technology | 32.8% | | Footnote | Description | Footnote* | Percentages are calculated based on total net assets of SPY (SPDR S&P 500 ETF), an investment in which the Fund holds shares. These securities are not direct holdings of the Fund itself. |
|
| Largest Holdings [Text Block] |
Table SummaryHolding Name | | | Percentage of
Total Net Assets |
|---|
State Street SPDR S&P 500 ETF Trust | | | 98.9% | Purchased OptionFootnote Reference(1) | | | 2.5% | Written OptionsFootnote Reference(1) | | | -1.8% | | Footnote | Description | Footnote(1) | At market value. |
|
| Material Fund Change [Text Block] |
This is a summary of certain changes to the Fund since April 1, 2025. For more complete information, you may review the Fund’s prospectus, which is available at https://kraneshares.com/etf/kspy/#fund-documents or upon request at 1-855-857-2638. The Board of the Trust approved the appointment of Hedgeye Asset Management, LLC (“HAM”) as sub-adviser to the Fund. In connection with this change, John McNamara was appointed as a portfolio manager of the Fund and the Adviser’s voluntary fee waiver was terminated. Krane Funds Advisors, LLC (“Krane” or the “Adviser”), the investment adviser to the Fund, entered into an agreement whereby its officers and employees, among others, through KFA Two Holdings, LLC, will acquire a majority interest in the Adviser from China International Capital Corporation (USA) Holdings Inc., a wholly-owned, indirect subsidiary of China International Capital Corporation Limited (the “Transaction”). Consummation of the Transaction will, under the Investment Company Act of 1940, result in the automatic termination of the Fund’s existing investment advisory and, if applicable, sub-advisory agreements. In anticipation of the Transaction, the Board approved new advisory and, if applicable, sub-advisory agreements on terms identical to the existing agreements (other than effective and termination dates), subject to shareholder approval of the new advisory agreement. The new sub-advisory agreement will take effect in reliance on a manager-of-managers exemptive order. To ensure continuity of management pending shareholder approval of the new advisory agreement, the Board also approved interim advisory and, if applicable, sub-advisory agreements, effective upon closing of the Transaction, each with terms substantially identical to the current agreements, to remain in effect for up to 150 days while shareholder approval is sought. |
| Updated Prospectus Web Address |
https://kraneshares.com/kspy/
|
| C000250789 |
|
| Shareholder Report [Line Items] |
|
| Fund Name |
KraneShares Artificial Intelligence and Technology ETF
|
| Class Name |
KraneShares Artificial Intelligence and Technology ETF
|
| Trading Symbol |
AGIX
|
| Security Exchange Name |
NASDAQ
|
| Annual or Semi-Annual Statement [Text Block] |
Annual Shareholder Report
|
| Shareholder Report Annual or Semi-Annual |
annual shareholder report
|
| Additional Information [Text Block] |
This annual shareholder report contains important information about the KraneShares Artificial Intelligence and Technology ETF (the "Fund") for the period from April 1, 2025 to March 31, 2026. You can find additional information about the Fund at https://kraneshares.com/agix/. You can also request this information by contacting us at 1-855-857-2638.
|
| Additional Information Phone Number |
1-855-857-2638
|
| Additional Information Website |
https://kraneshares.com/agix/
|
| Expenses [Text Block] |
What were the Fund costs for the last year?(based on a hypothetical $10,000 investment) Table SummaryFund Name | Costs of a $10,000 investment | Costs paid as a percentage of a $10,000 investment |
|---|
KraneShares Artificial Intelligence and Technology ETF | $117 | 1.00% |
|---|
|
| Expenses Paid, Amount |
$ 117
|
| Expense Ratio, Percent |
1.00%
|
| Factors Affecting Performance [Text Block] |
^ Fund is actively managed and does not track an Underlying Index Under normal circumstances, the KraneShares Artificial Intelligence & Technology ETF invests at least 80% of its net assets (plus borrowings for investment purposes) in securities of artificial intelligence (AI) and technology companies and other instruments that have economic characteristics similar to such securities. The Fund considers a company to be an "AI and Technology" company if it is classified in the Technology economy within the FactSet Revere Business Industry Classification system (RBICS), which requires a company to generate at least 50% of its revenue from within the Technology economy, and has an AI Exposure Score greater than zero. An "AI and Technology" company will generally operate in the following industries, as categorized by RBICS: computer peripherals, data processing services, information technology services, internet retail, internet software/services, packaged software, semiconductors, or telecommunications equipment. An AI Exposure Score is a proprietary score used by the Underlying Index (as defined below) that attempts to quantify the exposure of a company with regard to AI. It is measured in a range from 0 (no exposure) to 5 (highest exposure) and is based on the company's public business descriptions, public filings, press releases, and financial disclosures that directly indicate involvement in AI-related business or the incorporation of AI technologies into their key operations, offerings and research and development activities. U.S. AI equities outperformed the broader U.S. equity market, as defined by the S&P 500 Index, as expectations for the potential capabilities of AI-enabled agents rose and chipmakers’ revenues remained stable at current levels. The Fund’s allocation to the privately-held company Anthropic contributed to its positive performance during the period. The Fund acquired a position in the privately held company xAI, now known as SpaceX, following a merger, during the period. |
| Performance Past Does Not Indicate Future [Text] |
Past performance is not indicative of future performance.
|
| Line Graph [Table Text Block] |
Table Summary | KraneShares Artificial Intelligence and Technology ETF | S&P 500 Index (USD) (TR)Footnote Reference* | Solactive Etna Artificial General Intelligence Index (USD) (NR)Footnote Reference† |
|---|
Jul/24 | $10,000 | $10,000 | $10,000 |
|---|
Sep/24 | $10,164 | $10,341 | $10,090 |
|---|
Dec/24 | $11,389 | $10,590 | $11,328 |
|---|
Mar/25 | $9,876 | $10,138 | $9,724 |
|---|
Jun/25 | $12,642 | $11,247 | $12,610 |
|---|
Sep/25 | $14,702 | $12,161 | $14,286 |
|---|
Dec/25 | $14,758 | $12,483 | $14,016 |
|---|
Mar/26 | $13,141 | $11,942 | $12,320 |
|---|
|
| Average Annual Return [Table Text Block] |
Table SummaryFund/Index Name | 1 Year | Annualized
Since
Inception |
|---|
KraneShares Artificial Intelligence and Technology ETF | 33.06% | 17.39% |
|---|
S&P 500 Index (USD) (TR)Footnote Reference* | 17.80% | 10.98% |
|---|
Solactive Etna Artificial General Intelligence Index (USD) (NR)Footnote Reference† | 26.69% | 13.02% |
|---|
|
| No Deduction of Taxes [Text Block] |
The table and graph presented above do not reflect the deduction of taxes a shareholder would pay on Fund distributions or the redemption of Fund shares.
|
| AssetsNet |
$ 171,473,296
|
| Holdings Count | Holding |
57
|
| Advisory Fees Paid, Amount |
$ 848,639
|
| InvestmentCompanyPortfolioTurnover |
70.00%
|
| Additional Fund Statistics [Text Block] |
Key Fund Statistics as of March 31, 2026Table Summary | Total Net Assets | Number of Holdings | Total Advisory Fees Paid | Portfolio Turnover Rate |
|---|
| $171,473,296 | 57 | $848,639 | 70% |
|---|
|
| Holdings [Text Block] |
Sector WeightingsFootnote Reference*Table SummaryValue | Value |
|---|
Health Care | 1.0% | Utilities | 3.3% | Industrials | 5.3% | Consumer Discretionary | 6.0% | Communication Services | 11.2% | Information Technology | 72.8% | | Footnote | Description | Footnote* | Percentages are calculated based on total net assets. |
|
| Largest Holdings [Text Block] |
Table SummaryHolding Name | | | Percentage of
Total Net Assets |
|---|
NVIDIA | | | 5.3% | Microsoft | | | 4.0% | Meta Platforms, Cl A | | | 3.7% | SpaceX, Cl A | | | 3.6% | Alphabet, Cl A | | | 3.4% | Apple | | | 3.3% | Broadcom | | | 3.1% | Taiwan Semiconductor Manufacturing | | | 2.9% | Amazon.com | | | 2.8% | Anthropic | | | 2.7% | |
| Material Fund Change [Text Block] |
This is a summary of certain changes to the Fund since April 1, 2025. For more complete information, you may review the Fund’s prospectus, which is available at https://kraneshares.com/etf/agix/#fund-documents or upon request at 1-855-857-2638. Effective June 1, 2026, the Fund’s name changed from “KraneShares Artificial Intelligence and Technology ETF” to “KraneShares Public-Private AI and Technology ETF”. In addition, the Fund’s principal investment strategy has been updated to provide that, under normal circumstances, it will invest at least 80% of its net assets (plus borrowings for investment purposes) in the publicly traded or privately offered securities of “Artificial Intelligence (“AI”) and Technology” companies and other instruments that have economic characteristics similar to such securities. Krane Funds Advisors, LLC (“Krane” or the “Adviser”), the investment adviser to the Fund, entered into an agreement whereby its officers and employees, among others, through KFA Two Holdings, LLC, will acquire a majority interest in the Adviser from China International Capital Corporation (USA) Holdings Inc., a wholly-owned, indirect subsidiary of China International Capital Corporation Limited (the “Transaction”). Consummation of the Transaction will, under the Investment Company Act of 1940, result in the automatic termination of the Fund’s existing investment advisory and, if applicable, sub-advisory agreements. In anticipation of the Transaction, the Board approved new advisory and, if applicable, sub-advisory agreements on terms identical to the existing agreements (other than effective and termination dates), subject to shareholder approval of the new advisory agreement. The new sub-advisory agreement will take effect in reliance on a manager-of-managers exemptive order. To ensure continuity of management pending shareholder approval of the new advisory agreement, the Board also approved interim advisory and, if applicable, sub-advisory agreements, effective upon closing of the Transaction, each with terms substantially identical to the current agreements, to remain in effect for up to 150 days while shareholder approval is sought. |
| Updated Prospectus Web Address |
https://kraneshares.com/agix/
|
| C000251229 |
|
| Shareholder Report [Line Items] |
|
| Fund Name |
KraneShares Sustainable Ultra Short Duration Index ETF
|
| Class Name |
KraneShares Sustainable Ultra Short Duration Index ETF
|
| Trading Symbol |
KCSH
|
| Security Exchange Name |
NYSEArca
|
| Annual or Semi-Annual Statement [Text Block] |
Annual Shareholder Report
|
| Shareholder Report Annual or Semi-Annual |
annual shareholder report
|
| Additional Information [Text Block] |
This annual shareholder report contains important information about the KraneShares Sustainable Ultra Short Duration Index ETF (the "Fund") for the period from April 1, 2025 to March 31, 2026. You can find additional information about the Fund at https://kraneshares.com/kcsh/. You can also request this information by contacting us at 1-855-857-2638.
|
| Additional Information Phone Number |
1-855-857-2638
|
| Additional Information Website |
https://kraneshares.com/kcsh/
|
| Expenses [Text Block] |
What were the Fund costs for the last year?(based on a hypothetical $10,000 investment) Table SummaryFund Name | Costs of a $10,000 investment | Costs paid as a percentage of a $10,000 investment |
|---|
KraneShares Sustainable Ultra Short Duration Index ETF | $20 | 0.20% |
|---|
|
| Expenses Paid, Amount |
$ 20
|
| Expense Ratio, Percent |
0.20%
|
| Factors Affecting Performance [Text Block] |
(a) Solactive ISS Sustainable Select 0-1 Year USD Corporate IG Index The KraneShares Sustainable Ultra Short Duration Index ETF seeks to provide investment results that, before fees and expenses, correspond generally to the price and yield performance of the Solactive ISS Sustainable Select 0-1 Year USD Corporate Investment Grade (“IG”) Index (the "Underlying Index"). The Underlying Index is designed to measure the performance of U.S. dollar denominated investment grade corporate debt securities with a maturity of up to one year that are compatible with the principal objective of the Paris Agreement, which seeks to limit temperature increases in this century to well below 2 degrees Celsius, and preferably to 1.5 degrees Celsius, above pre-industrial levels (i.e., carbon reduction target levels). The Fund underperformed the Bloomberg U.S. Aggregate Bond Index, which benefited from interest rate cuts during the period, as the Index has a longer duration, thereby exposing it to greater interest rate risk. However, volatility in global markets toward the end of the period led to a shift to the relative safety of cash-like investments, contributing to the Fund’s positive performance for the period. |
| Performance Past Does Not Indicate Future [Text] |
Past performance is not indicative of future performance.
|
| Line Graph [Table Text Block] |
Table Summary | KraneShares Sustainable Ultra Short Duration Index ETF | Bloomberg U.S. Aggregate Bond Index (USD) (TR)Footnote Reference* | Solactive ISS Sustainable Select 0-1 Year USD Corporate IG Index (USD) (TR)Footnote Reference* |
|---|
Jul/24 | $10,000 | $10,000 | $10,000 |
|---|
Sep/24 | $10,112 | $10,404 | $10,116 |
|---|
Dec/24 | $10,226 | $10,085 | $10,235 |
|---|
Mar/25 | $10,343 | $10,366 | $10,351 |
|---|
Jun/25 | $10,458 | $10,491 | $10,463 |
|---|
Sep/25 | $10,576 | $10,704 | $10,585 |
|---|
Dec/25 | $10,688 | $10,822 | $10,699 |
|---|
Mar/26 | $10,773 | $10,817 | $10,787 |
|---|
|
| Average Annual Return [Table Text Block] |
Table SummaryFund/Index Name | 1 Year | Annualized
Since
Inception |
|---|
KraneShares Sustainable Ultra Short Duration Index ETF | 4.16% | 4.52% |
|---|
Bloomberg U.S. Aggregate Bond Index (USD) (TR)Footnote Reference* | 4.35% | 4.78% |
|---|
Solactive ISS Sustainable Select 0-1 Year USD Corporate IG Index (USD) (TR)Footnote Reference* | 4.21% | 4.60% |
|---|
|
| No Deduction of Taxes [Text Block] |
The table and graph presented above do not reflect the deduction of taxes a shareholder would pay on Fund distributions or the redemption of Fund shares.
|
| AssetsNet |
$ 174,016,994
|
| Holdings Count | Holding |
95
|
| Advisory Fees Paid, Amount |
$ 371,285
|
| InvestmentCompanyPortfolioTurnover |
0.00%
|
| Additional Fund Statistics [Text Block] |
Key Fund Statistics as of March 31, 2026Table Summary | Total Net Assets | Number of Holdings | Total Advisory Fees Paid | Portfolio Turnover Rate |
|---|
| $174,016,994 | 95 | $371,285 | 0% |
|---|
|
| Holdings [Text Block] |
Maturity WeightingsFootnote Reference*Footnote Reference^Table SummaryValue | Value |
|---|
9-12 Months | 13.2% | 6-9 Months | 16.8% | 3-6 Months | 27.2% | 0-3 Months | 37.5% | | Footnote | Description | Footnote* | Percentages are calculated based on total net assets. | Footnote^ | This chart does not include cash, and therefore, the investments as a percentage to total net assets (which includes cash) will not add up to 100%. |
|
| Largest Holdings [Text Block] |
Table SummaryHolding Name | Coupon Rate | Maturity Date | Percentage of Total
Net Assets |
|---|
American Express | 1.650%
| 11/04/26
| 2.5% | Sumitomo Mitsui Financial Group | 2.632%
| 07/14/26
| 2.3% | Procter & Gamble | 1.900%
| 02/01/27
| 2.3% | ASB Bank | 5.346%
| 06/15/26
| 2.0% | Citigroup | 4.300%
| 11/20/26
| 2.0% | JPMorgan Chase | 4.125%
| 12/15/26
| 2.0% | Procter & Gamble | 2.450%
| 11/03/26
| 2.0% | Toronto-Dominion Bank | 1.200%
| 06/03/26
| 1.9% | Toyota Motor Credit | 1.125%
| 06/18/26
| 1.8% | Goldman Sachs Group | 5.950%
| 01/15/27
| 1.7% | |
| Material Fund Change [Text Block] |
This is a summary of certain changes to the Fund since April 1, 2025. For more complete information, you may review the Fund’s prospectus, which is available at https://kraneshares.com/etf/kcsh/#fund-documents or upon request at 1-855-857-2638. Krane Funds Advisors, LLC (“Krane” or the “Adviser”), the investment adviser to the Fund, entered into an agreement whereby its officers and employees, among others, through KFA Two Holdings, LLC, will acquire a majority interest in the Adviser from China International Capital Corporation (USA) Holdings Inc., a wholly-owned, indirect subsidiary of China International Capital Corporation Limited (the “Transaction”). Consummation of the Transaction will, under the Investment Company Act of 1940, result in the automatic termination of the Fund’s existing investment advisory and, if applicable, sub-advisory agreements. In anticipation of the Transaction, the Board approved new advisory and, if applicable, sub-advisory agreements on terms identical to the existing agreements (other than effective and termination dates), subject to shareholder approval of the new advisory agreement. The new sub-advisory agreement will take effect in reliance on a manager-of-managers exemptive order. To ensure continuity of management pending shareholder approval of the new advisory agreement, the Board also approved interim advisory and, if applicable, sub-advisory agreements, effective upon closing of the Transaction, each with terms substantially identical to the current agreements, to remain in effect for up to 150 days while shareholder approval is sought. |
| Updated Prospectus Web Address |
https://kraneshares.com/kcsh/
|
| C000249978 |
|
| Shareholder Report [Line Items] |
|
| Fund Name |
KraneShares China Alpha Index ETF
|
| Class Name |
KraneShares China Alpha Index ETF
|
| Trading Symbol |
KCAI
|
| Security Exchange Name |
NYSEArca
|
| Annual or Semi-Annual Statement [Text Block] |
Annual Shareholder Report
|
| Shareholder Report Annual or Semi-Annual |
annual shareholder report
|
| Additional Information [Text Block] |
This annual shareholder report contains important information about the KraneShares China Alpha Index ETF (the "Fund") for the period from April 1, 2025 to March 31, 2026. You can find additional information about the Fund at https://kraneshares.com/kcai/. You can also request this information by contacting us at 1-855-857-2638.
|
| Additional Information Phone Number |
1-855-857-2638
|
| Additional Information Website |
https://kraneshares.com/kcai/
|
| Expenses [Text Block] |
What were the Fund costs for the last year?(based on a hypothetical $10,000 investment) Table SummaryFund Name | Costs of a $10,000 investment | Costs paid as a percentage of a $10,000 investment |
|---|
KraneShares China Alpha Index ETF | $102 | 0.79% |
|---|
|
| Expenses Paid, Amount |
$ 102
|
| Expense Ratio, Percent |
0.79%
|
| Factors Affecting Performance [Text Block] |
(a) Qi China Alpha Index The KraneShares Qi China Alpha Index ETF seeks to provide investment results that, before fees and expenses, correspond generally to the price and yield performance of the Qi China Alpha Index (the "Underlying Index"). The Underlying Index seeks to provide a total return that exceeds the CSI 300 Index (the "Benchmark Index") using an automated algorithmic machine learning investment process ("AI Process") developed by Quant Insight Ltd. ("Index Provider"). The CSI 300 Index is a free-float capitalization-weighted index that tracks the performance of China A-Shares issued by the 300 largest companies by market capitalization and liquidity traded on the Shanghai Stock Exchange and Shenzhen Stock Exchange. The Fund outperformed China’s equity market more broadly, as measured by the MSCI China All Shares Index, during the period. The Fund also outperformed its benchmark index, the CSI 300 Index. The Fund benefited from relative strength in China’s A-share market during the period, as well as the alpha generated by its AI Process. |
| Performance Past Does Not Indicate Future [Text] |
Past performance is not indicative of future performance.
|
| Line Graph [Table Text Block] |
Table Summary | KraneShares China Alpha Index ETF | MSCI China All Shares Index (USD) (NR)Footnote Reference* | Qi China Alpha Index (USD) (NR)Footnote Reference* |
|---|
Aug/24 | $10,000 | $10,000 | $10,000 |
|---|
Sep/24 | $11,756 | $12,426 | $11,808 |
|---|
Dec/24 | $11,057 | $11,561 | $11,128 |
|---|
Mar/25 | $11,102 | $12,627 | $11,178 |
|---|
Jun/25 | $12,341 | $12,922 | $12,468 |
|---|
Sep/25 | $15,326 | $15,565 | $15,562 |
|---|
Dec/25 | $16,905 | $14,907 | $17,260 |
|---|
Mar/26 | $17,477 | $13,935 | $17,896 |
|---|
|
| Average Annual Return [Table Text Block] |
Table SummaryFund/Index Name | 1 Year | Annualized
Since
Inception |
|---|
KraneShares China Alpha Index ETF | 57.43% | 42.01% |
|---|
MSCI China All Shares Index (USD) (NR)Footnote Reference* | 10.36% | 23.18% |
|---|
Qi China Alpha Index (USD) (NR)Footnote Reference* | 60.09% | 44.14% |
|---|
|
| No Deduction of Taxes [Text Block] |
The table and graph presented above do not reflect the deduction of taxes a shareholder would pay on Fund distributions or the redemption of Fund shares.
|
| AssetsNet |
$ 11,014,037
|
| Holdings Count | Holding |
40
|
| Advisory Fees Paid, Amount |
$ 78,132
|
| InvestmentCompanyPortfolioTurnover |
174.00%
|
| Additional Fund Statistics [Text Block] |
Key Fund Statistics as of March 31, 2026Table Summary | Total Net Assets | Number of Holdings | Total Advisory Fees Paid | Portfolio Turnover Rate |
|---|
| $11,014,037 | 40 | $78,132 | 174% |
|---|
|
| Holdings [Text Block] |
Sector WeightingsFootnote Reference*Table SummaryValue | Value |
|---|
Consumer Discretionary | 9.4% | Information Technology | 13.4% | Materials | 14.3% | Industrials | 21.3% | Financials | 41.4% | | Footnote | Description | Footnote* | Percentages are calculated based on total net assets. |
|
| Largest Holdings [Text Block] |
Table SummaryHolding Name | | | Percentage of
Total Net Assets |
|---|
Eoptolink Technology, Cl A | | | 3.4% | Satellite Chemical, Cl A | | | 3.4% | China Construction Bank, Cl A | | | 3.3% | Bank of China, Cl A | | | 3.3% | Industrial & Commercial Bank of China, Cl A | | | 3.3% | Ningxia Baofeng Energy Group, Cl A | | | 3.3% | Huaxia Bank, Cl A | | | 3.3% | Bank of Communications, Cl A | | | 3.2% | Shanghai Pudong Development Bank, Cl A | | | 3.2% | Bank of Jiangsu, Cl A | | | 3.2% | |
| Material Fund Change [Text Block] |
This is a summary of certain changes to the Fund since April 1, 2025. For more complete information, you may review the Fund’s prospectus, which is available at https://kraneshares.com/etf/kcai/#fund-documents or upon request at 1-855-857-2638. Krane Funds Advisors, LLC (“Krane” or the “Adviser”), the investment adviser to the Fund, entered into an agreement whereby its officers and employees, among others, through KFA Two Holdings, LLC, will acquire a majority interest in the Adviser from China International Capital Corporation (USA) Holdings Inc., a wholly-owned, indirect subsidiary of China International Capital Corporation Limited (the “Transaction”). Consummation of the Transaction will, under the Investment Company Act of 1940, result in the automatic termination of the Fund’s existing investment advisory and, if applicable, sub-advisory agreements. In anticipation of the Transaction, the Board approved new advisory and, if applicable, sub-advisory agreements on terms identical to the existing agreements (other than effective and termination dates), subject to shareholder approval of the new advisory agreement. The new sub-advisory agreement will take effect in reliance on a manager-of-managers exemptive order. To ensure continuity of management pending shareholder approval of the new advisory agreement, the Board also approved interim advisory and, if applicable, sub-advisory agreements, effective upon closing of the Transaction, each with terms substantially identical to the current agreements, to remain in effect for up to 150 days while shareholder approval is sought. |
| Updated Prospectus Web Address |
https://kraneshares.com/kcai/
|
| C000254137 |
|
| Shareholder Report [Line Items] |
|
| Fund Name |
KraneShares Man Buyout Beta Index ETF
|
| Class Name |
KraneShares Man Buyout Beta Index ETF
|
| Trading Symbol |
BUYO
|
| Security Exchange Name |
NYSEArca
|
| Annual or Semi-Annual Statement [Text Block] |
Annual Shareholder Report
|
| Shareholder Report Annual or Semi-Annual |
annual shareholder report
|
| Additional Information [Text Block] |
This annual shareholder report contains important information about the KraneShares Man Buyout Beta Index ETF (the "Fund") for the period from April 1, 2025 to March 31, 2026. You can find additional information about the Fund at https://kraneshares.com/buyo/. You can also request this information by contacting us at 1-855-857-2638.
|
| Additional Information Phone Number |
1-855-857-2638
|
| Additional Information Website |
https://kraneshares.com/buyo/
|
| Expenses [Text Block] |
What were the Fund costs for the last year?(based on a hypothetical $10,000 investment) Table SummaryFund Name | Costs of a $10,000 investment | Costs paid as a percentage of a $10,000 investment |
|---|
KraneShares Man Buyout Beta Index ETF | $99 | 0.89% |
|---|
|
| Expenses Paid, Amount |
$ 99
|
| Expense Ratio, Percent |
0.89%
|
| Factors Affecting Performance [Text Block] |
(a) Man Buyout Beta Index The KraneShares Man Buyout Beta Index ETF seeks to provide investment results that, before fees and expenses, track the price and yield performance of a specific equity securities index. The Fund's current index is the Man Buyout Beta Index (the "Underlying Index"). The Underlying Index is designed to provide a proxy for private equity performance and risk exposures by focusing on small- and mid-capitalization stocks with characteristics similar to companies in private equity buyout funds. A "buyout" fund is a type of fund that targets companies for acquisition or control in an attempt to enhance the value of those acquired companies. The Fund does not invest directly in private equity funds or the privately-held shares of companies, and the Fund will not attempt to acquire or control private companies. The Fund outperformed the all-capitalization U.S. equity market, as measured by the Russell 3,000 Index, during the period, due to its overweight to the Industrials sector. The Fund’s stock selection methodology, which focuses on fundamental ratios that make companies attractive potential targets for take-private deals, helped produce this overweight. |
| Performance Past Does Not Indicate Future [Text] |
Past performance is not indicative of future performance.
|
| Line Graph [Table Text Block] |
Table Summary | KraneShares Man Buyout Beta Index ETF | Russell 3000 Index (USD) (TR)Footnote Reference* | Man Buyout Beta Index (USD) (TR)Footnote Reference* |
|---|
Oct/24 | $10,000 | $10,000 | $10,000 |
|---|
Dec/24 | $10,040 | $10,378 | $10,059 |
|---|
Mar/25 | $9,084 | $9,888 | $9,127 |
|---|
Jun/25 | $10,024 | $10,975 | $10,092 |
|---|
Sep/25 | $10,720 | $11,872 | $10,823 |
|---|
Dec/25 | $11,126 | $12,157 | $11,256 |
|---|
Mar/26 | $11,062 | $11,676 | $11,222 |
|---|
|
| Average Annual Return [Table Text Block] |
Table SummaryFund/Index Name | 1 Year | Annualized
Since
Inception |
|---|
KraneShares Man Buyout Beta Index ETF | 21.78% | 7.06% |
|---|
Russell 3000 Index (USD) (TR)Footnote Reference* | 18.09% | 11.04% |
|---|
Man Buyout Beta Index (USD) (TR)Footnote Reference* | 22.95% | 8.10% |
|---|
|
| No Deduction of Taxes [Text Block] |
The table and graph presented above do not reflect the deduction of taxes a shareholder would pay on Fund distributions or the redemption of Fund shares.
|
| AssetsNet |
$ 12,436,718
|
| Holdings Count | Holding |
291
|
| Advisory Fees Paid, Amount |
$ 103,737
|
| InvestmentCompanyPortfolioTurnover |
76.00%
|
| Additional Fund Statistics [Text Block] |
Key Fund Statistics as of March 31, 2026Table Summary | Total Net Assets | Number of Holdings | Total Advisory Fees Paid | Portfolio Turnover Rate |
|---|
| $12,436,718 | 291 | $103,737 | 76% |
|---|
|
| Holdings [Text Block] |
Sector WeightingsFootnote Reference*Table SummaryValue | Value |
|---|
Energy | 0.1% | Utilities | 2.0% | Consumer Staples | 4.5% | Communication Services | 6.9% | Materials | 8.4% | Financials | 8.9% | Health Care | 11.9% | Consumer Discretionary | 13.7% | Information Technology | 21.5% | Industrials | 22.0% | | Footnote | Description | Footnote* | Percentages are calculated based on total net assets. |
|
| Largest Holdings [Text Block] |
Table SummaryHolding Name | | | Percentage of
Total Net Assets |
|---|
DigitalOcean Holdings | | | 1.5% | News, Cl A | | | 1.4% | Encompass Health | | | 1.3% | Jabil | | | 1.2% | Millicom International Cellular | | | 1.2% | Coherent | | | 1.2% | Onto Innovation | | | 1.2% | Teladoc Health | | | 1.2% | Tapestry | | | 1.2% | Axis Capital Holdings | | | 1.1% | |
| Material Fund Change [Text Block] |
This is a summary of certain changes to the Fund since April 1, 2025. For more complete information, you may review the Fund’s prospectus, which is available at https://kraneshares.com/etf/buyo/#fund-documents or upon request at 1-855-857-2638. Krane Funds Advisors, LLC (“Krane” or the “Adviser”), the investment adviser to the Fund, entered into an agreement whereby its officers and employees, among others, through KFA Two Holdings, LLC, will acquire a majority interest in the Adviser from China International Capital Corporation (USA) Holdings Inc., a wholly-owned, indirect subsidiary of China International Capital Corporation Limited (the “Transaction”). Consummation of the Transaction will, under the Investment Company Act of 1940, result in the automatic termination of the Fund’s existing investment advisory and, if applicable, sub-advisory agreements. In anticipation of the Transaction, the Board approved new advisory and, if applicable, sub-advisory agreements on terms identical to the existing agreements (other than effective and termination dates), subject to shareholder approval of the new advisory agreement. The new sub-advisory agreement will take effect in reliance on a manager-of-managers exemptive order. To ensure continuity of management pending shareholder approval of the new advisory agreement, the Board also approved interim advisory and, if applicable, sub-advisory agreements, effective upon closing of the Transaction, each with terms substantially identical to the current agreements, to remain in effect for up to 150 days while shareholder approval is sought. |
| Updated Prospectus Web Address |
https://kraneshares.com/buyo/
|
| C000206147 |
|
| Shareholder Report [Line Items] |
|
| Fund Name |
KraneShares Global Humanoid and Embodied Intelligence Index ETF
|
| Class Name |
KraneShares Global Humanoid and Embodied Intelligence Index ETF
|
| Trading Symbol |
KOID
|
| Security Exchange Name |
NASDAQ
|
| Annual or Semi-Annual Statement [Text Block] |
Annual Shareholder Report
|
| Shareholder Report Annual or Semi-Annual |
annual shareholder report
|
| Additional Information [Text Block] |
This annual shareholder report contains important information about the KraneShares Global Humanoid and Embodied Intelligence Index ETF (the "Fund") for the period from June 4, 2025 (commencement of operations) to March 31, 2026. You can find additional information about the Fund at https://kraneshares.com/koid/. You can also request this information by contacting us at 1-855-857-2638.
|
| Additional Information Phone Number |
1-855-857-2638
|
| Additional Information Website |
https://kraneshares.com/koid/
|
| Expenses [Text Block] |
What were the Fund costs for the period?(based on a hypothetical $10,000 investment) Table SummaryFund Name | Costs of a $10,000 investmentFootnote Reference* | Costs paid as a percentage of a $10,000 investment |
|---|
KraneShares Global Humanoid and Embodied Intelligence Index ETF | $64 | 0.69% |
|---|
| Footnote | Description | Footnote* | Costs shown not annualized. If the Fund had been open for the full fiscal year, costs shown would have been higher for the period ended. |
|
| Expenses Paid, Amount |
$ 64
|
| Expense Ratio, Percent |
0.69%
|
| Factors Affecting Performance [Text Block] |
*Return since Fund inception on June 4, 2025 (less than one year) (a) MerQube Global Humanoid and Embodied Intelligence Index The KraneShares Global Humanoid and Embodied Intelligence Index ETF seeks to provide investment results that, before fees and expenses, correspond generally to the price and yield performance of a specific equity securities index. The Fund’s current index is the MerQube Global Humanoid and Embodied Intelligence Index (the “Underlying Index”). The Underlying Index is an equal-weighted index designed to track companies involved in humanoid and embodied intelligence technologies, including robotics, autonomous systems, and related supply chain solutions. Global humanoid robotics-related equities outperformed global equities, as measured by the MSCI All Country World Index (ACWI), during the period. Humanoid robotics-related equities benefited from the strong performance of producers of refined rare earth elements (REEs) used in the construction of humanoid robots. Humanoid robotics-related equities also benefited from speculation about the potential IPOs of privately held robotics manufacturers, including Unitree. |
| AssetsNet |
$ 119,163,401
|
| Holdings Count | Holding |
50
|
| Advisory Fees Paid, Amount |
$ 410,006
|
| InvestmentCompanyPortfolioTurnover |
44.00%
|
| Additional Fund Statistics [Text Block] |
Key Fund Statistics as of March 31, 2026Table Summary | Total Net Assets | Number of Holdings | Total Advisory Fees Paid | Portfolio Turnover Rate |
|---|
| $119,163,401 | 50 | $410,006 | 44% |
|---|
|
| Holdings [Text Block] |
Sector WeightingsFootnote Reference*Table SummaryValue | Value |
|---|
Materials | 6.0% | Consumer Discretionary | 18.2% | Industrials | 35.2% | Information Technology | 40.8% | | Footnote | Description | Footnote* | Percentages are calculated based on total net assets. |
|
| Largest Holdings [Text Block] |
Table SummaryHolding Name | | | Percentage of
Total Net Assets |
|---|
Jabil | | | 2.1% | Credo Technology Group Holding | | | 2.1% | Amphenol, Cl A | | | 2.1% | MP Materials | | | 2.1% | NVIDIA | | | 2.1% | Sensata Technologies Holding | | | 2.1% | TE Connectivity | | | 2.1% | Regal Rexnord | | | 2.1% | NXP Semiconductors | | | 2.1% | Analog Devices | | | 2.1% | |
| Material Fund Change [Text Block] |
This is a summary of certain changes to the Fund since April 1, 2025. For more complete information, you may review the Fund’s prospectus, which is available at https://kraneshares.com/etf/koid/#fund-documentsor upon request at 1-855-857-2638. The Fund changed its ticker from KBOT to KOID, changed its listing exchange to The Nasdaq Stock Market, and effected two name changes: (i) on May 1, 2025, from “KraneShares Asia Robotics and Artificial Intelligence Index ETF” to “KraneShares Global Humanoid and Embodied Intelligence Index ETF”, and (ii) on May 1, 2026, from “KraneShares Global Humanoid and Embodied Intelligence Index ETF” to KraneShares Global Humanoid Robotics and Physical AI Index ETF”. Concurrent with the May 1, 2025 name change, the Fund’s underlying index changed from the “Solactive Asia Robotics & Artificial Intelligence Index” to the “MerQube Global Humanoid and Embodied Intelligence Index.” Additionally, in connection with the May 1, 2026 name change, the name of the Fund’s underlying index will change on June 16, 2026, from “MerQube Global Humanoid and Embodied Intelligence Index” to “MerQube Global Humanoid Robotics and Physical AI Index”. Krane Funds Advisors, LLC (“Krane” or the “Adviser”), the investment adviser to the Fund, entered into an agreement whereby its officers and employees, among others, through KFA Two Holdings, LLC, will acquire a majority interest in the Adviser from China International Capital Corporation (USA) Holdings Inc., a wholly-owned, indirect subsidiary of China International Capital Corporation Limited (the “Transaction”). Consummation of the Transaction will, under the Investment Company Act of 1940, result in the automatic termination of the Fund’s existing investment advisory and, if applicable, sub-advisory agreements. In anticipation of the Transaction, the Board approved new advisory and, if applicable, sub-advisory agreements on terms identical to the existing agreements (other than effective and termination dates), subject to shareholder approval of the new advisory agreement. The new sub-advisory agreement will take effect in reliance on a manager-of-managers exemptive order. To ensure continuity of management pending shareholder approval of the new advisory agreement, the Board also approved interim advisory and, if applicable, sub-advisory agreements, effective upon closing of the Transaction, each with terms substantially identical to the current agreements, to remain in effect for up to 150 days while shareholder approval is sought. |
| Updated Prospectus Web Address |
https://kraneshares.com/koid/
|
| C000264117 |
|
| Shareholder Report [Line Items] |
|
| Fund Name |
KraneShares Dragon Capital Vietnam Growth Index ETF
|
| Class Name |
KraneShares Dragon Capital Vietnam Growth Index ETF
|
| Trading Symbol |
KPHO
|
| Security Exchange Name |
NYSE
|
| Annual or Semi-Annual Statement [Text Block] |
Annual Shareholder Report
|
| Shareholder Report Annual or Semi-Annual |
annual shareholder report
|
| Additional Information [Text Block] |
This annual shareholder report contains important information about the KraneShares Dragon Capital Vietnam Growth Index ETF (the "Fund") for the period from December 3, 2025 (commencement of operations) to March 31, 2026. You can find additional information about the Fund at https://kraneshares.com/kpho/. You can also request this information by contacting us at 1-855-857-2638.
|
| Additional Information Phone Number |
1-855-857-2638
|
| Additional Information Website |
https://kraneshares.com/kpho/
|
| Expenses [Text Block] |
What were the Fund costs for the period?(based on a hypothetical $10,000 investment) Table SummaryFund Name | Costs of a $10,000 investmentFootnote Reference* | Costs paid as a percentage of a $10,000 investment |
|---|
KraneShares Dragon Capital Vietnam Growth Index ETF | $25 | 0.79% |
|---|
| Footnote | Description | Footnote* | Costs shown not annualized. If the Fund had been open for the full fiscal year, costs shown would have been higher for the period ended. |
|
| Expenses Paid, Amount |
$ 25
|
| Expense Ratio, Percent |
0.79%
|
| Factors Affecting Performance [Text Block] |
*Return since Fund inception on December 3, 2025 (less than one year) (a) Dragon Capital MerQube Vietnam Growth Index The KraneShares Dragon Capital Vietnam Growth Index ETF seeks to provide investment results that, before fees and expenses, correspond generally to the price and yield performance of a specific equity securities index, which is the Dragon Capital MerQube Vietnam Growth Index (the “Underlying Index”). The Underlying Index is designed to measure the performance of growth stocks listed on the Ho Chi Minh City Stock Exchange (“HOSE”) and includes both equity securities and foreign exchange-traded funds. Vietnam’s equity market underperformed frontier markets more broadly, as measured by the MSCI Frontier Markets Index, during the period. Vietnam’s economy was heavily exposed to oil imports traversing the Strait of Hormuz, which were cut off during the strait's closure in March, leading to a decline in sentiment. |
| AssetsNet |
$ 13,010,616
|
| Holdings Count | Holding |
37
|
| Advisory Fees Paid, Amount |
$ 22,993
|
| InvestmentCompanyPortfolioTurnover |
29.00%
|
| Additional Fund Statistics [Text Block] |
Key Fund Statistics as of March 31, 2026Table Summary | Total Net Assets | Number of Holdings | Total Advisory Fees Paid | Portfolio Turnover Rate |
|---|
| $13,010,616 | 37 | $22,993 | 29% |
|---|
|
| Holdings [Text Block] |
Sector WeightingsFootnote Reference*Table SummaryValue | Value |
|---|
Communication Services | 0.2% | Health Care | 0.8% | Energy | 1.3% | Real Estate | 3.0% | Consumer Discretionary | 3.5% | Information Technology | 5.8% | Consumer Staples | 6.7% | Materials | 7.1% | Industrials | 11.8% | Financials | 59.4% | | Footnote | Description | Footnote* | Sector weightings reflect both direct equity holdings and a look-through to the underlying constituents of the DCVFMVN DIAMOND ETF held by the Fund. |
|
| Largest Holdings [Text Block] |
Table SummaryHolding Name | | | Percentage of
Total Net Assets |
|---|
DCVFMVN Diamond ETF | | | 23.5% | Vietnam Prosperity JSC Bank | | | 8.0% | Ho Chi Minh City Development Joint Stock Commercial Bank | | | 7.8% | Bank for Foreign Trade of Vietnam JSC | | | 7.7% | Gemadept | | | 4.2% | Saigon - Hanoi Commercial Joint Stock Bank | | | 4.2% | Hoa Phat Group JSC | | | 4.0% | Tien Phong Commercial Joint Stock Bank | | | 3.8% | Bank for Investment and Development of Vietnam JSC | | | 3.5% | VIX Securities JSC | | | 3.5% | |
| Material Fund Change [Text Block] |
This is a summary of certain changes to the Fund since April 1, 2025. For more complete information, you may review the Fund’s prospectus, which is available at https://kraneshares.com/etf/kpho/#fund-documents or upon request at 1-855-857-2638. Krane Funds Advisors, LLC (“Krane” or the “Adviser”), the investment adviser to the Fund, entered into an agreement whereby its officers and employees, among others, through KFA Two Holdings, LLC, will acquire a majority interest in the Adviser from China International Capital Corporation (USA) Holdings Inc., a wholly-owned, indirect subsidiary of China International Capital Corporation Limited (the “Transaction”). Consummation of the Transaction will, under the Investment Company Act of 1940, result in the automatic termination of the Fund’s existing investment advisory and, if applicable, sub-advisory agreements. In anticipation of the Transaction, the Board approved new advisory and, if applicable, sub-advisory agreements on terms identical to the existing agreements (other than effective and termination dates), subject to shareholder approval of the new advisory agreement. The new sub-advisory agreement will take effect in reliance on a manager-of-managers exemptive order. To ensure continuity of management pending shareholder approval of the new advisory agreement, the Board also approved interim advisory and, if applicable, sub-advisory agreements, effective upon closing of the Transaction, each with terms substantially identical to the current agreements, to remain in effect for up to 150 days while shareholder approval is sought. |
| Updated Prospectus Web Address |
https://kraneshares.com/kpho/
|
| C000263033 |
|
| Shareholder Report [Line Items] |
|
| Fund Name |
KraneShares Wahed Alternative Income Index ETF
|
| Class Name |
KraneShares Wahed Alternative Income Index ETF
|
| Trading Symbol |
KWIN
|
| Security Exchange Name |
NYSEArca
|
| Annual or Semi-Annual Statement [Text Block] |
Annual Shareholder Report
|
| Shareholder Report Annual or Semi-Annual |
annual shareholder report
|
| Additional Information [Text Block] |
This annual shareholder report contains important information about the KraneShares Wahed Alternative Income Index ETF (the "Fund") for the period from November 4, 2025 (commencement of operations) to March 31, 2026. You can find additional information about the Fund at https://kraneshares.com/etf/kwin/. You can also request this information by contacting us at 1-855-857-2638.
|
| Additional Information Phone Number |
1-855-857-2638
|
| Additional Information Website |
https://kraneshares.com/etf/kwin/
|
| Expenses [Text Block] |
What were the Fund costs for the period?(based on a hypothetical $10,000 investment) Table SummaryFund Name | Costs of a $10,000 investmentFootnote Reference* | Costs paid as a percentage of a $10,000 investment |
|---|
KraneShares Wahed Alternative Income Index ETF | $21 | 0.51% |
|---|
| Footnote | Description | Footnote* | Costs shown not annualized. If the Fund had been open for the full fiscal year, costs shown would have been higher for the period ended. |
|
| Expenses Paid, Amount |
$ 21
|
| Expense Ratio, Percent |
0.51%
|
| Factors Affecting Performance [Text Block] |
*Return since Fund inception on November 4, 2025 (less than one year) (a) Wahed Alternative Income Index The KraneShares Wahed Alternative Income Index ETF seeks to provide investment results that, before fees and expenses, correspond generally to the price and yield performance of a specific equity securities index. The Fund’s current index is the Wahed Shariah Alternative Income Index (the “Underlying Index”). The Underlying Index is designed to generate income consistent with Shariah and Islamic principles as interpreted by Wahed Invest LLC, the Sub-Adviser. The Index consists of equal-weighted long positions in U.S. equity securities that pass both business activity and financial ratio screens used to identify Shariah-compliant companies. The Fund outperformed the Bloomberg U.S. Aggregate Bond Index during the period because the option income received by the fund and reinvested in securities exceeded the return of the Bloomberg U.S. Aggregate Bond Index. |
| AssetsNet |
$ 45,775,423
|
| Holdings Count | Holding |
305
|
| Advisory Fees Paid, Amount |
$ 74,562
|
| InvestmentCompanyPortfolioTurnover |
1.00%
|
| Additional Fund Statistics [Text Block] |
Key Fund Statistics as of March 31, 2026Table Summary | Total Net Assets | Number of Holdings | Total Advisory Fees Paid | Portfolio Turnover Rate |
|---|
| $45,775,423 | 305 | $74,562 | 1% |
|---|
|
| Holdings [Text Block] |
Sector WeightingsFootnote Reference*Table SummaryValue | Value |
|---|
Financials | 1.9% | Communication Services | 2.0% | Industrials | 3.4% | Health Care | 7.5% | Consumer Discretionary | 21.8% | Information Technology | 46.9% | | Footnote | Description | Footnote* | Percentages are calculated based on total net assets. |
|
| Largest Holdings [Text Block] |
Table SummaryHolding Name | | | Percentage of
Total Net Assets |
|---|
Net Options Contracts | | | 16.1% | Intuitive Surgical | | | 4.7% | Fortinet | | | 4.3% | Amazon.com | | | 4.1% | Lululemon Athletica | | | 4.1% | Cadence Design Systems | | | 3.9% | Arista Networks | | | 3.9% | O'Reilly Automotive | | | 3.9% | AutoZone | | | 3.7% | Crowdstrike Holdings, Cl A | | | 3.7% | |
| Material Fund Change [Text Block] |
This is a summary of certain changes to the Fund since April 1, 2025. For more complete information, you may review the Fund’s prospectus, which is available at https://kraneshares.com/etf/kwin/#fund-documents or upon request at 1-855-857-2638. Krane Funds Advisors, LLC (“Krane” or the “Adviser”), the investment adviser to the Fund, entered into an agreement whereby its officers and employees, among others, through KFA Two Holdings, LLC, will acquire a majority interest in the Adviser from China International Capital Corporation (USA) Holdings Inc., a wholly-owned, indirect subsidiary of China International Capital Corporation Limited (the “Transaction”). Consummation of the Transaction will, under the Investment Company Act of 1940, result in the automatic termination of the Fund’s existing investment advisory and, if applicable, sub-advisory agreements. In anticipation of the Transaction, the Board approved new advisory and, if applicable, sub-advisory agreements on terms identical to the existing agreements (other than effective and termination dates), subject to shareholder approval of the new advisory agreement. The new sub-advisory agreement will take effect in reliance on a manager-of-managers exemptive order. To ensure continuity of management pending shareholder approval of the new advisory agreement, the Board also approved interim advisory and, if applicable, sub-advisory agreements, effective upon closing of the Transaction, each with terms substantially identical to the current agreements, to remain in effect for up to 150 days while shareholder approval is sought. |
| Updated Prospectus Web Address |
https://kraneshares.com/etf/kwin/
|
| C000264125 |
|
| Shareholder Report [Line Items] |
|
| Fund Name |
KraneShares InspereX Nasdaq Dynamic Buffered High Income Index ETF
|
| Class Name |
KraneShares InspereX Nasdaq Dynamic Buffered High Income Index ETF
|
| Trading Symbol |
KIQQ
|
| Security Exchange Name |
NASDAQ
|
| Annual or Semi-Annual Statement [Text Block] |
Annual Shareholder Report
|
| Shareholder Report Annual or Semi-Annual |
annual shareholder report
|
| Additional Information [Text Block] |
This annual shareholder report contains important information about the KraneShares InspereX Nasdaq Dynamic Buffered High Income Index ETF (the "Fund") for the period from January 6, 2026 (commencement of operations) to March 31, 2026. You can find additional information about the Fund at https://kraneshares.com/etf/kiqq/. You can also request this information by contacting us at 1-855-857-2638.
|
| Additional Information Phone Number |
1-855-857-2638
|
| Additional Information Website |
https://kraneshares.com/etf/kiqq/
|
| Expenses [Text Block] |
What were the Fund costs for the period?(based on a hypothetical $10,000 investment) Table SummaryFund Name | Costs of a $10,000 investmentFootnote Reference* | Costs paid as a percentage of a $10,000 investment |
|---|
KraneShares InspereX Nasdaq Dynamic Buffered High Income Index ETF | $18 | 0.79% |
|---|
| Footnote | Description | Footnote* | Costs shown not annualized. If the Fund had been open for the full fiscal year, costs shown would have been higher for the period ended. |
|
| Expenses Paid, Amount |
$ 18
|
| Expense Ratio, Percent |
0.79%
|
| Factors Affecting Performance [Text Block] |
*Return since Fund inception on January 6, 2026 (less than one year) (a) Nasdaq InspereX Dynamic Buffered High Income™ Index The KraneShares InspereX Nasdaq Dynamic Buffered High Income Index ETF seeks to provide investment results that, before fees and expenses, correspond generally to the price and yield performance of a specific equity and derivative securities index, which is the Nasdaq InspereX Dynamic Buffered High Income™ Index (the “Underlying Index”). The Underlying Index is designed to track the performance of a systematic enhanced collar strategy that seeks to limit losses while providing option income. The short futures on the Nasdaq 100 Index, to which the Fund was synthetically exposed, led to its outperformance over the Nasdaq Composite Index, which was down during the period. |
| AssetsNet |
$ 2,290,170
|
| Holdings Count | Holding |
102
|
| Advisory Fees Paid, Amount |
$ 4,285
|
| InvestmentCompanyPortfolioTurnover |
3.00%
|
| Additional Fund Statistics [Text Block] |
Key Fund Statistics as of March 31, 2026Table Summary | Total Net Assets | Number of Holdings | Total Advisory Fees Paid | Portfolio Turnover Rate |
|---|
| $2,290,170 | 102 | $4,285 | 3% |
|---|
|
| Holdings [Text Block] |
Sector WeightingsFootnote Reference*Table SummaryValue | Value |
|---|
Real Estate | 0.1% | Financials | 0.2% | Energy | 0.6% | Materials | 1.3% | Utilities | 1.5% | Industrials | 4.0% | Health Care | 5.0% | Consumer Staples | 8.3% | Consumer Discretionary | 12.4% | Communication Services | 15.0% | Information Technology | 49.7% | | Footnote | Description | Footnote* | Percentages are calculated based on total net assets. |
|
| Largest Holdings [Text Block] |
Table SummaryAsset Type | % of Net Assets |
|---|
Common Stock | 98.1% | Total Return SwapsFootnote Reference(1) | 1.4% | | Footnote | Description | Footnote(1) | At market value. |
|
| Material Fund Change [Text Block] |
This is a summary of certain changes to the Fund since April 1, 2025. For more complete information, you may review the Fund’s prospectus, which is available at https://kraneshares.com/etf/kiqq/#fund-documents or upon request at 1-855-857-2638. Krane Funds Advisors, LLC (“Krane” or the “Adviser”), the investment adviser to the Fund, entered into an agreement whereby its officers and employees, among others, through KFA Two Holdings, LLC, will acquire a majority interest in the Adviser from China International Capital Corporation (USA) Holdings Inc., a wholly-owned, indirect subsidiary of China International Capital Corporation Limited (the “Transaction”). Consummation of the Transaction will, under the Investment Company Act of 1940, result in the automatic termination of the Fund’s existing investment advisory and, if applicable, sub-advisory agreements. In anticipation of the Transaction, the Board approved new advisory and, if applicable, sub-advisory agreements on terms identical to the existing agreements (other than effective and termination dates), subject to shareholder approval of the new advisory agreement. The new sub-advisory agreement will take effect in reliance on a manager-of-managers exemptive order. To ensure continuity of management pending shareholder approval of the new advisory agreement, the Board also approved interim advisory and, if applicable, sub-advisory agreements, effective upon closing of the Transaction, each with terms substantially identical to the current agreements, to remain in effect for up to 150 days while shareholder approval is sought. |
| Updated Prospectus Web Address |
https://kraneshares.com/etf/kiqq/
|