Pay Versus Performance
As required by Item 402(v) of Regulation S-K, we are providing the following information about the relationship between executive compensation for our principal executive officer (“PEO”) and non-PEO Named Executive Officers and the financial performance of the Company. The table below addresses compensation actually paid (“CAP”) to the PEO and the non-PEO Named Executive Officers, which is a concept developed by the SEC for purposes of this tabular disclosure and does not imply that the covered executives actually received payments or value equal to the CAP during the applicable fiscal year. Although the Compensation Committee focuses on pay relative to performance in its executive compensation decisions, it has not historically utilized CAP as a key measure in implementing its pay-for-performance philosophy. For further information concerning the Company’s pay-for-performance philosophy and how the Company aligns executive compensation with the Company’s performance, refer to “Compensation Discussion and Analysis” above.
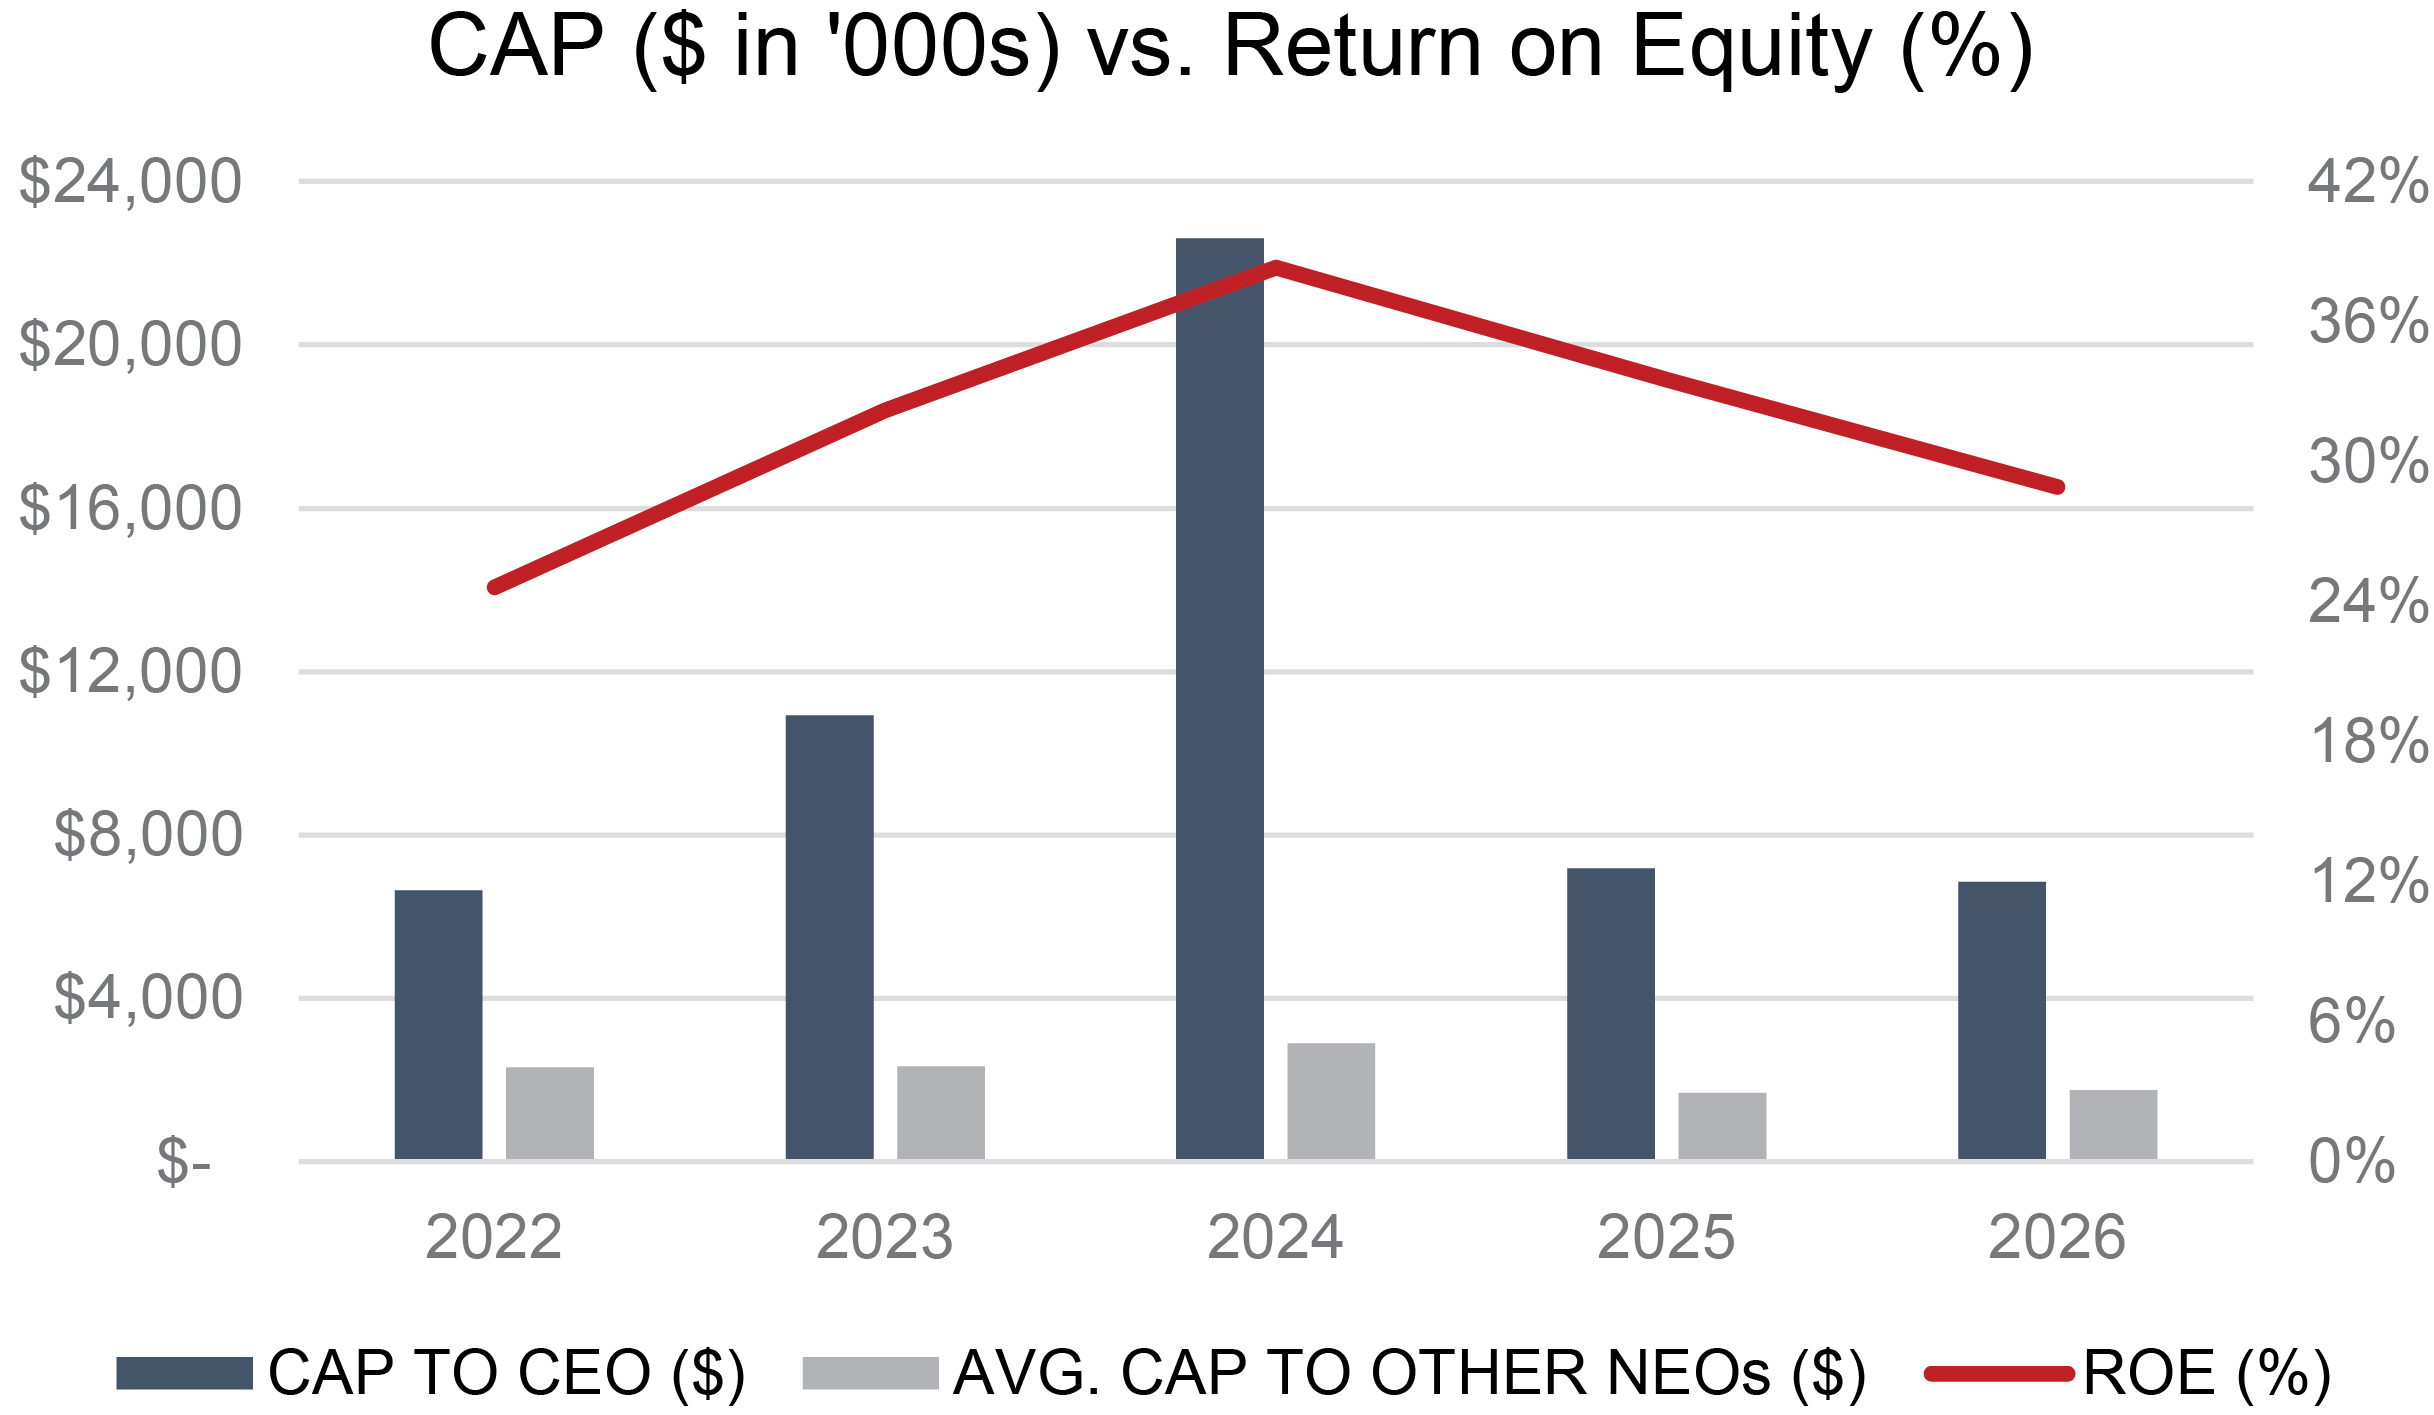
The Company has selected Return on Equity as the company-selected financial performance measure presented in the table below. Although the Company uses numerous financial and non-financial performance measures for the purpose of evaluating performance for the Company’s compensation programs, the Company has determined that Return on Equity is the financial performance measure that represents the most important performance measure (that is not otherwise required to be disclosed in the table) used by the Company to link compensation actually paid to the Company’s Named Executive Officers for the most recently completed fiscal year to Company performance.
|
|
|
|
|
|
|
|
|
|
|
|
Average |
|
Average Compensation |
|
Value of Initial Fixed $100 |
|
|
|
|
|
|
|
|
|
|
||||||||||||||||||||||
Fiscal |
|
Summary |
|
Compensation |
|
Total for Non- |
|
Actually Paid to |
|
Total |
|
Peer Group Total |
|
Net Income |
|
Return on |
||||||||||||||||||||||||||||||||
|
|
|
|
|
|
|
|
|
|
|
|
|
|
|
|
|
|
|
|
|
|
|
|
|
|
|
|
|
|
|
|
|
|
|
|
|
|
|
|
|
||||||||
|
|
|
|
|
|
|
|
|
|
|
|
|
|
|
|
|
|
|
|
|
|
|
|
|
|
|
|
|
|
|
|
|
|
|
|
|
|
|
|
|
||||||||
2026 |
|
|
|
10,302,728 |
|
|
|
|
|
6,855,311 |
|
|
|
|
|
2,180,634 |
|
|
|
|
|
1,744,281 |
|
|
|
|
|
145.10 |
|
|
|
|
|
164.98 |
|
|
|
|
|
423,809 |
|
|
|
|
|
28.9 |
% |
|
|
|
|
|
|
|
|
|
|
|
|
|
|
|
|
|
|
|
|
|
|
|
|
|
|
|
|
|
|
|
|
|
|
|
|
|
|
|
|
|
|
||||||||
2025 |
|
|
|
10,031,035 |
|
|
|
|
|
7,187,509 |
|
|
|
|
|
2,041,204 |
|
|
|
|
|
1,679,090 |
|
|
|
|
|
169.16 |
|
|
|
|
|
148.89 |
|
|
|
|
|
463,416 |
|
|
|
|
|
33.5 |
% |
|
|
|
|
|
|
|
|
|
|
|
|
|
|
|
|
|
|
|
|
|
|
|
|
|
|
|
|
|
|
|
|
|
|
|
|
|
|
|
|
|
|
||||||||
|
|
|
|
|
|
|
|
|
|
|
|
|
|
|
|
|
|
|
|
|
|
|
|
|
|
|
|
|
|
|
|
|
|
|
|
|
|
|
|
|
||||||||
2024 |
|
|
|
8,464,214 |
|
|
|
|
|
22,621,110 |
|
|
|
|
|
1,911,988 |
|
|
|
|
|
2,879,383 |
|
|
|
|
|
206.29 |
|
|
|
|
|
152.30 |
|
|
|
|
|
477,639 |
|
|
|
|
|
38.3 |
% |
|
|
|
|
|
|
|
|
|
|
|
|
|
|
|
|
|
|
|
|
|
|
|
|
|
|
|
|
|
|
|
|
|
|
|
|
|
|
|
|
|
|
||||||||
|
|
|
|
|
|
|
|
|
|
|
|
|
|
|
|
|
|
|
|
|
|
|
|
|
|
|
|
|
|
|
|
|
|
|
|
|
|
|
|
|
||||||||
2023 |
|
|
|
7,997,493 |
|
|
|
|
|
10,936,146 |
|
|
|
|
|
2,175,544 |
|
|
|
|
|
2,334,525 |
|
|
|
|
|
110.83 |
|
|
|
|
|
98.24 |
|
|
|
|
|
461,540 |
|
|
|
|
|
32.2 |
% |
|
|
|
|
|
|
|
|
|
|
|
|
|
|
|
|
|
|
|
|
|
|
|
|
|
|
|
|
|
|
|
|
|
|
|
|
|
|
|
|
|
|
||||||||
|
|
|
|
|
|
|
|
|
|
|
|
|
|
|
|
|
|
|
|
|
|
|
|
|
|
|
|
|
|
|
|
|
|
|
|
|
|
|
|
|
||||||||
2022 |
|
|
|
6,975,909 |
|
|
|
|
|
6,645,203 |
|
|
|
|
|
2,410,994 |
|
|
|
|
|
2,304,789 |
|
|
|
|
|
96.18 |
|
|
|
|
|
103.14 |
|
|
|
|
|
374,247 |
|
|
|
|
|
24.6 |
% |
|
|
|
|
|
|
|
|
|
|
|
|
|
|
|
|
|
|
|
|
|
|
|
|
|
|
|
|
|
|
|
|
|
|
|
|
|
|
|
|
|
|
||||||||
|
|
|
|
|
|
|
|
|
|
|
|
|
|
|
|
|
|
|
|
|
|
|
|
|
|
|
|
|
|
|
|
|
|
|
|
|
|
|
|
|
||||||||
|
|
|
|
|
|
|
|
|
|
|
|
|
|
|
|
|
|
|
|
|
|
|
|
|
|
|
|
|
|
|
|
|
|
|
|
|
|
|
|
|
||||||||
Fiscal |
|
Reported Summary |
|
Reported Value of |
|
Equity Award |
|
Compensation Actually |
||||||||||||||||
|
|
|
|
|
|
|
|
|
|
|
|
|
|
|
|
|
|
|
|
|
||||
|
|
|
|
|
|
|
|
|
|
|
|
|
|
|
|
|
|
|
|
|
||||
2026 |
|
|
|
10,302,728 |
|
|
|
|
|
(7,115,104 |
) |
|
|
|
|
3,667,687 |
|
|
|
|
|
6,855,311 |
|
|
|
|
|
|
|
|
|
|
|
|
|
|
|
|
|
|
|
|
|
|
|
||||
|
|
|
|
|
|
|
|
|
|
|
|
|
|
|
|
|
|
|
|
|
||||
|
|
|
|
|
|
|
|
|
|
|
|
|
|
|
|
|
|
|
|
|
||||
Fiscal |
|
Fiscal Year-End |
|
Change in Fair |
|
Fair Value as of |
|
Change in Fair |
|
Fair Value at End |
|
Value of |
|
Total Equity |
||||||||||||||||||||||||||||
|
|
|
|
|
|
|
|
|
|
|
|
|
|
|
|
|
|
|
|
|
|
|
|
|
|
|
|
|
|
|
|
|
|
|
|
|||||||
|
|
|
|
|
|
|
|
|
|
|
|
|
|
|
|
|
|
|
|
|
|
|
|
|
|
|
|
|
|
|
|
|
|
|
|
|||||||
2026 |
|
|
|
5,487,765 |
|
|
|
|
|
(1,025,185 |
) |
|
|
|
|
- |
|
|
|
|
|
(829,385 |
) |
|
|
|
|
— |
|
|
|
|
|
34,492 |
|
|
|
|
|
3,667,687 |
|
|
|
|
|
|
|
|
|
|
|
|
|
|
|
|
|
|
|
|
|
|
|
|
|
|
|
|
|
|
|
|
|
|
|
|
|
|
|||||||
|
|
|
|
|
|
|
|
|
|
|
|
|
|
|
|
|
|
|
|
|
|
|
|
|
|
|
|
|
|
|
|
|
|
|
|
|||||||
|
|
|
|
|
|
|
|
|
|
|
|
|
|
|
|
|
|
|
|
|
|
|
|
|
|
|
|
|
|
|
|
|
|
|
|
|||||||
Fiscal |
|
Average Reported |
|
Average Reported |
|
Average Equity |
|
Average |
||||||||||||||||
|
|
|
|
|
|
|
|
|
|
|
|
|
|
|
|
|
|
|
|
|
||||
|
|
|
|
|
|
|
|
|
|
|
|
|
|
|
|
|
|
|
|
|
||||
2026 |
|
|
|
2,180,634 |
|
|
|
|
|
(1,060,953 |
) |
|
|
|
|
624,600 |
|
|
|
|
|
1,744,281 |
|
|
|
|
|
|
|
|
|
|
|
|
|
|
|
|
|
|
|
|
|
|
|
||||
|
|
|
|
|
|
|
|
|
|
|
|
|
|
|
|
|
|
|
|
|
||||
|
|
|
|
|
|
|
|
|
|
|
|
|
|
|
|
|
|
|
|
|
||||
Fiscal |
|
Fiscal Year-End |
|
Change in Fair |
|
Fair Value as of |
|
Change in Fair |
|
Fair Value at |
|
Value of |
|
Total Equity |
||||||||||||||||||||||||||||
|
|
|
|
|
|
|
|
|
|
|
|
|
|
|
|
|
|
|
|
|
|
|
|
|
|
|
|
|
|
|
|
|
|
|
|
|||||||
|
|
|
|
|
|
|
|
|
|
|
|
|
|
|
|
|
|
|
|
|
|
|
|
|
|
|
|
|
|
|
|
|
|
|
|
|||||||
2026 |
|
|
|
826,981 |
|
|
|
|
|
(151,069 |
) |
|
|
|
|
- |
|
|
|
|
|
(57,574 |
) |
|
|
|
|
— |
|
|
|
|
|
6,262 |
|
|
|
|
|
624,600 |
|
|
|
|
|
|
|
|
|
|
|
|
|
|
|
|
|
|
|
|
|
|
|
|
|
|
|
|
|
|
|
|
|
|
|
|
|
|
|||||||
|
|
|
|
|
|
|
|
|
|
|
|
|
|
|
|
|
|
|
|
|
|
|
|
|
|
|
|
|
|
|
|
|
|
|
|
|||||||
|
|
|
|
|
|
|
|
|
|
|
|
|
|
|
|
|
|
|
|
|
|
|
|
|
|
|
|
|
|
|
|
|
|
|
|
|||||||
Fiscal |
|
Reported Summary |
|
Reported Value of |
|
Equity Award |
|
Compensation Actually |
||||||||||||||||
|
|
|
|
|
|
|
|
|
|
|
|
|
|
|
|
|
|
|
|
|
||||
|
|
|
|
|
|
|
|
|
|
|
|
|
|
|
|
|
|
|
|
|
||||
2026 |
|
|
|
10,302,728 |
|
|
|
|
|
(7,115,104 |
) |
|
|
|
|
3,667,687 |
|
|
|
|
|
6,855,311 |
|
|
|
|
|
|
|
|
|
|
|
|
|
|
|
|
|
|
|
|
|
|
|
||||
|
|
|
|
|
|
|
|
|
|
|
|
|
|
|
|
|
|
|
|
|
||||
|
|
|
|
|
|
|
|
|
|
|
|
|
|
|
|
|
|
|
|
|
||||
Fiscal |
|
Fiscal Year-End |
|
Change in Fair |
|
Fair Value as of |
|
Change in Fair |
|
Fair Value at End |
|
Value of |
|
Total Equity |
||||||||||||||||||||||||||||
|
|
|
|
|
|
|
|
|
|
|
|
|
|
|
|
|
|
|
|
|
|
|
|
|
|
|
|
|
|
|
|
|
|
|
|
|||||||
|
|
|
|
|
|
|
|
|
|
|
|
|
|
|
|
|
|
|
|
|
|
|
|
|
|
|
|
|
|
|
|
|
|
|
|
|||||||
2026 |
|
|
|
5,487,765 |
|
|
|
|
|
(1,025,185 |
) |
|
|
|
|
- |
|
|
|
|
|
(829,385 |
) |
|
|
|
|
— |
|
|
|
|
|
34,492 |
|
|
|
|
|
3,667,687 |
|
|
|
|
|
|
|
|
|
|
|
|
|
|
|
|
|
|
|
|
|
|
|
|
|
|
|
|
|
|
|
|
|
|
|
|
|
|
|||||||
|
|
|
|
|
|
|
|
|
|
|
|
|
|
|
|
|
|
|
|
|
|
|
|
|
|
|
|
|
|
|
|
|
|
|
|
|||||||
|
|
|
|
|
|
|
|
|
|
|
|
|
|
|
|
|
|
|
|
|
|
|
|
|
|
|
|
|
|
|
|
|
|
|
|
|||||||
Fiscal |
|
Average Reported |
|
Average Reported |
|
Average Equity |
|
Average |
||||||||||||||||
|
|
|
|
|
|
|
|
|
|
|
|
|
|
|
|
|
|
|
|
|
||||
|
|
|
|
|
|
|
|
|
|
|
|
|
|
|
|
|
|
|
|
|
||||
2026 |
|
|
|
2,180,634 |
|
|
|
|
|
(1,060,953 |
) |
|
|
|
|
624,600 |
|
|
|
|
|
1,744,281 |
|
|
|
|
|
|
|
|
|
|
|
|
|
|
|
|
|
|
|
|
|
|
|
||||
|
|
|
|
|
|
|
|
|
|
|
|
|
|
|
|
|
|
|
|
|
||||
|
|
|
|
|
|
|
|
|
|
|
|
|
|
|
|
|
|
|
|
|
||||
Fiscal |
|
Fiscal Year-End |
|
Change in Fair |
|
Fair Value as of |
|
Change in Fair |
|
Fair Value at |
|
Value of |
|
Total Equity |
||||||||||||||||||||||||||||
|
|
|
|
|
|
|
|
|
|
|
|
|
|
|
|
|
|
|
|
|
|
|
|
|
|
|
|
|
|
|
|
|
|
|
|
|||||||
|
|
|
|
|
|
|
|
|
|
|
|
|
|
|
|
|
|
|
|
|
|
|
|
|
|
|
|
|
|
|
|
|
|
|
|
|||||||
2026 |
|
|
|
826,981 |
|
|
|
|
|
(151,069 |
) |
|
|
|
|
- |
|
|
|
|
|
(57,574 |
) |
|
|
|
|
— |
|
|
|
|
|
6,262 |
|
|
|
|
|
624,600 |
|
|
|
|
|
|
|
|
|
|
|
|
|
|
|
|
|
|
|
|
|
|
|
|
|
|
|
|
|
|
|
|
|
|
|
|
|
|
|||||||
|
|
|
|
|
|
|
|
|
|
|
|
|
|
|
|
|
|
|
|
|
|
|
|
|
|
|
|
|
|
|
|
|
|
|
|
|||||||
|
|
|
|
|
|
|
|
|
|
|
|
|
|
|
|
|
|
|
|
|
|
|
|
|
|
|
|
|
|
|
|
|
|
|
|
|||||||
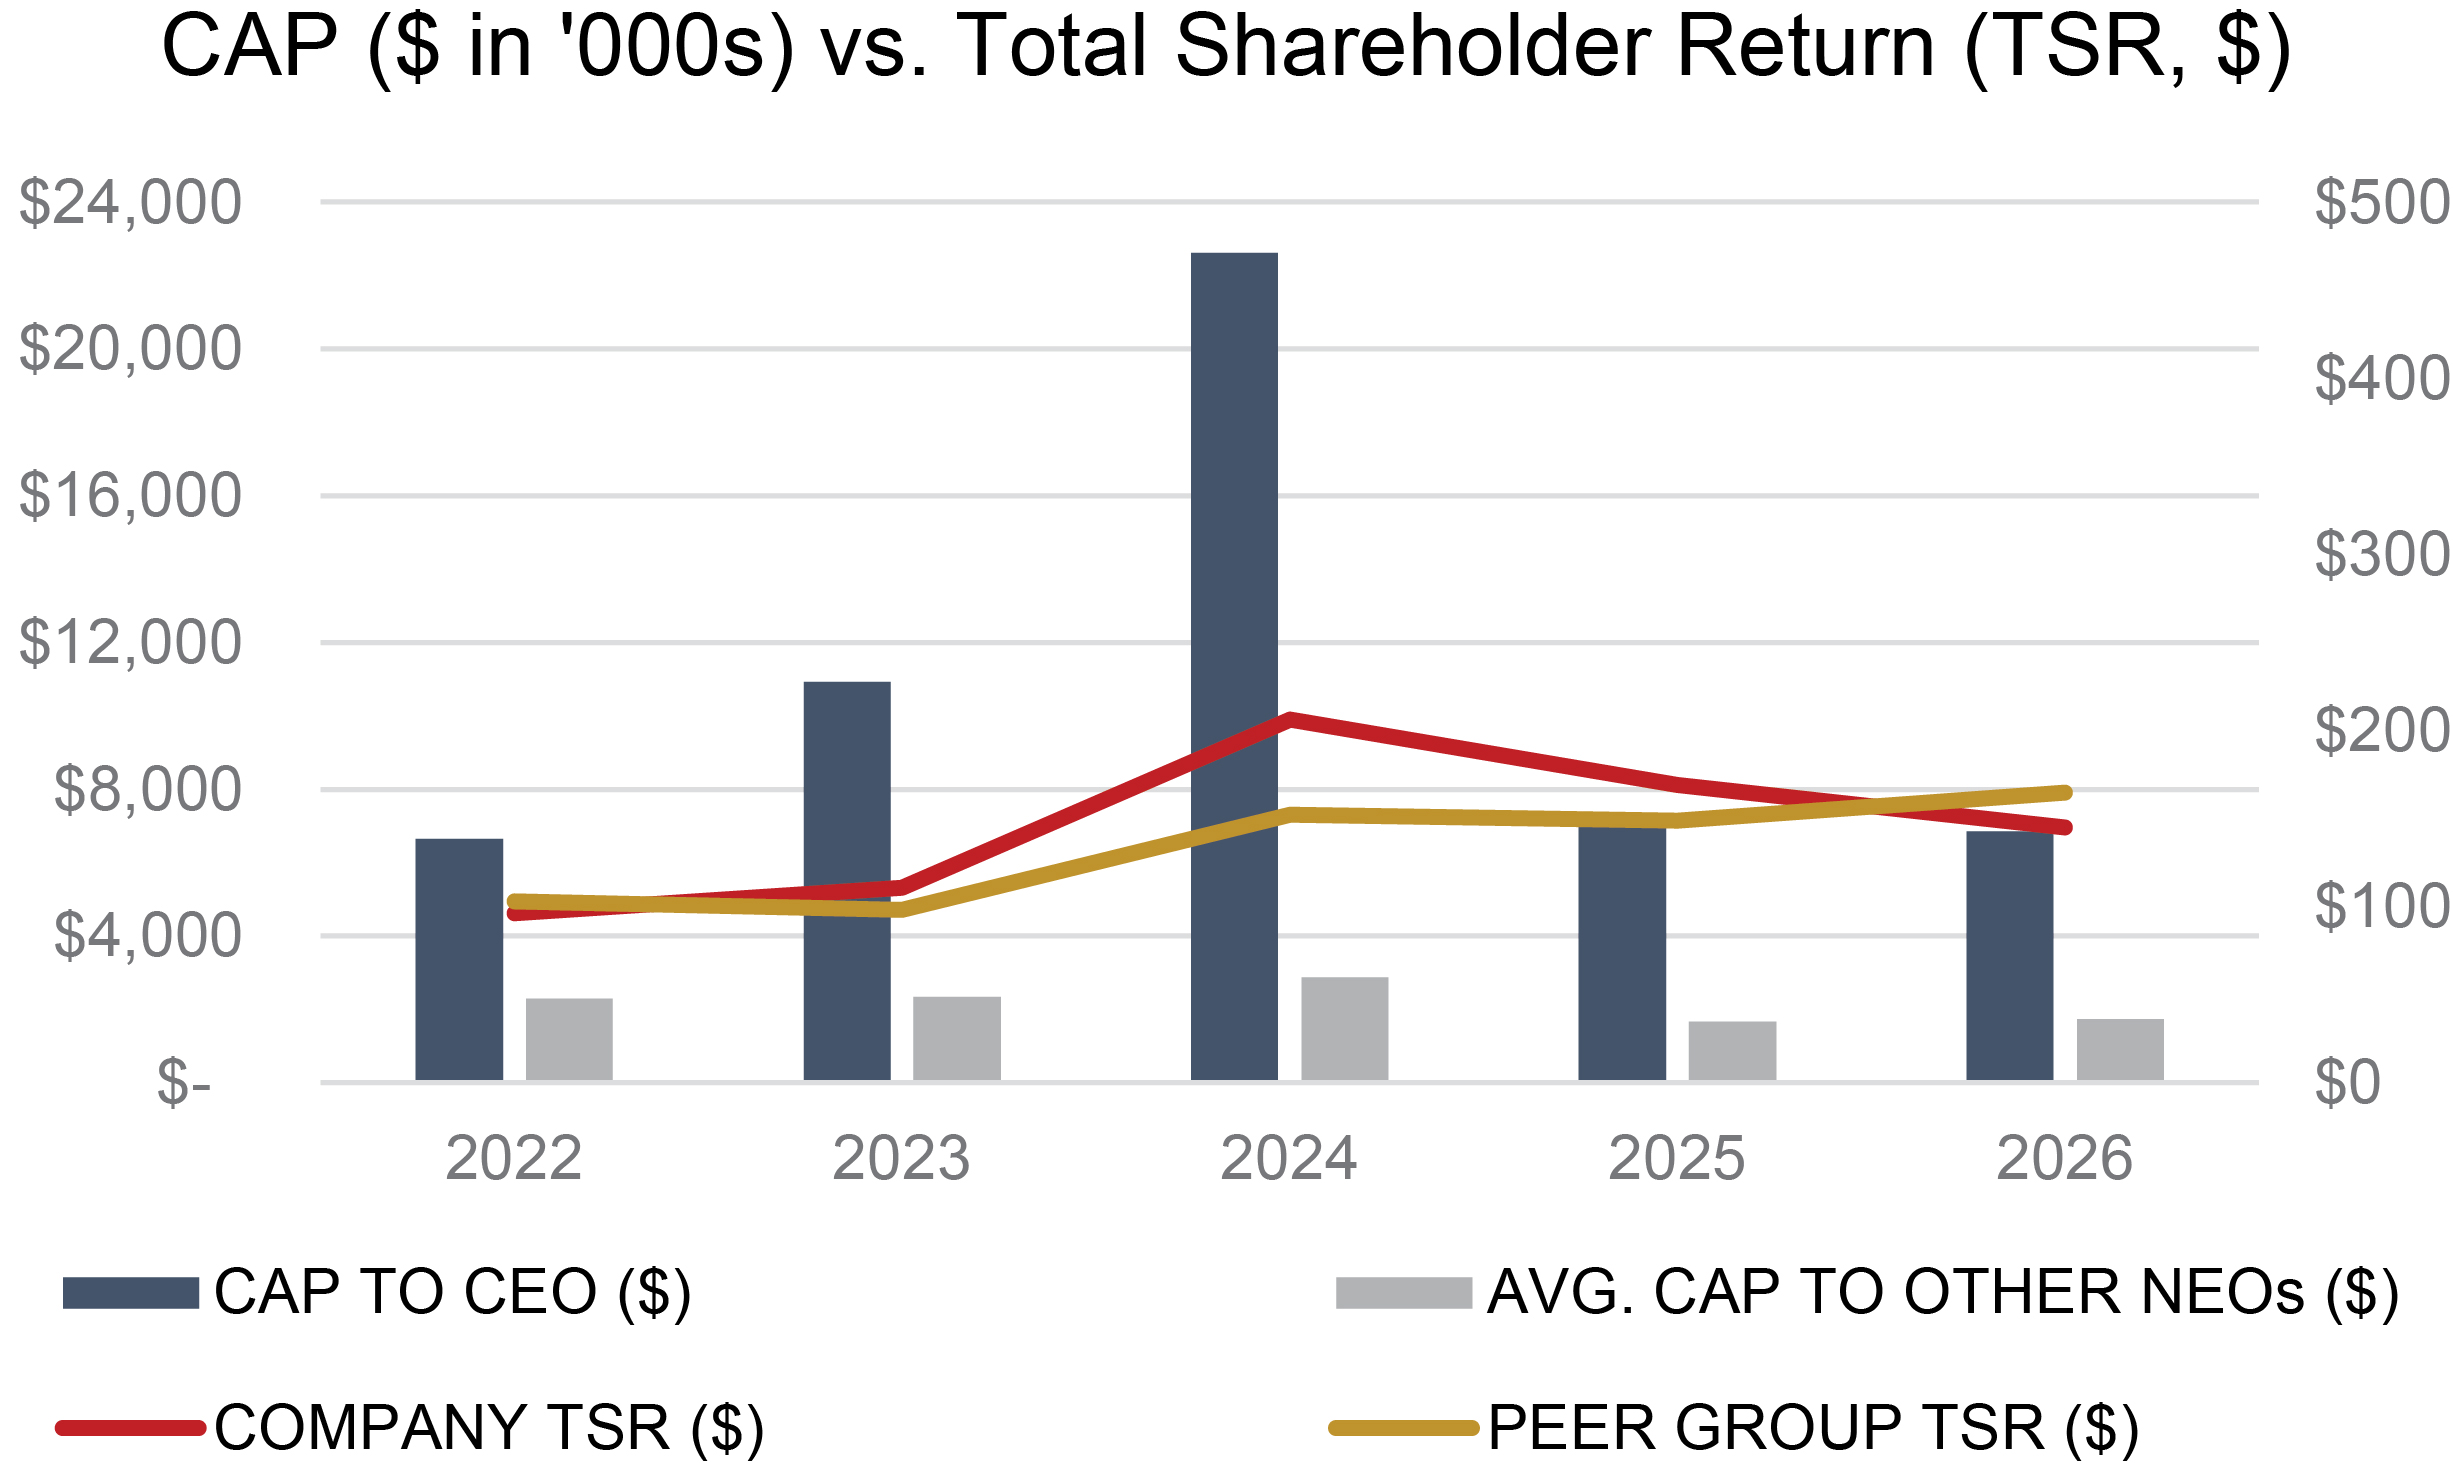
Compensation Actually Paid versus Total Shareholder Return
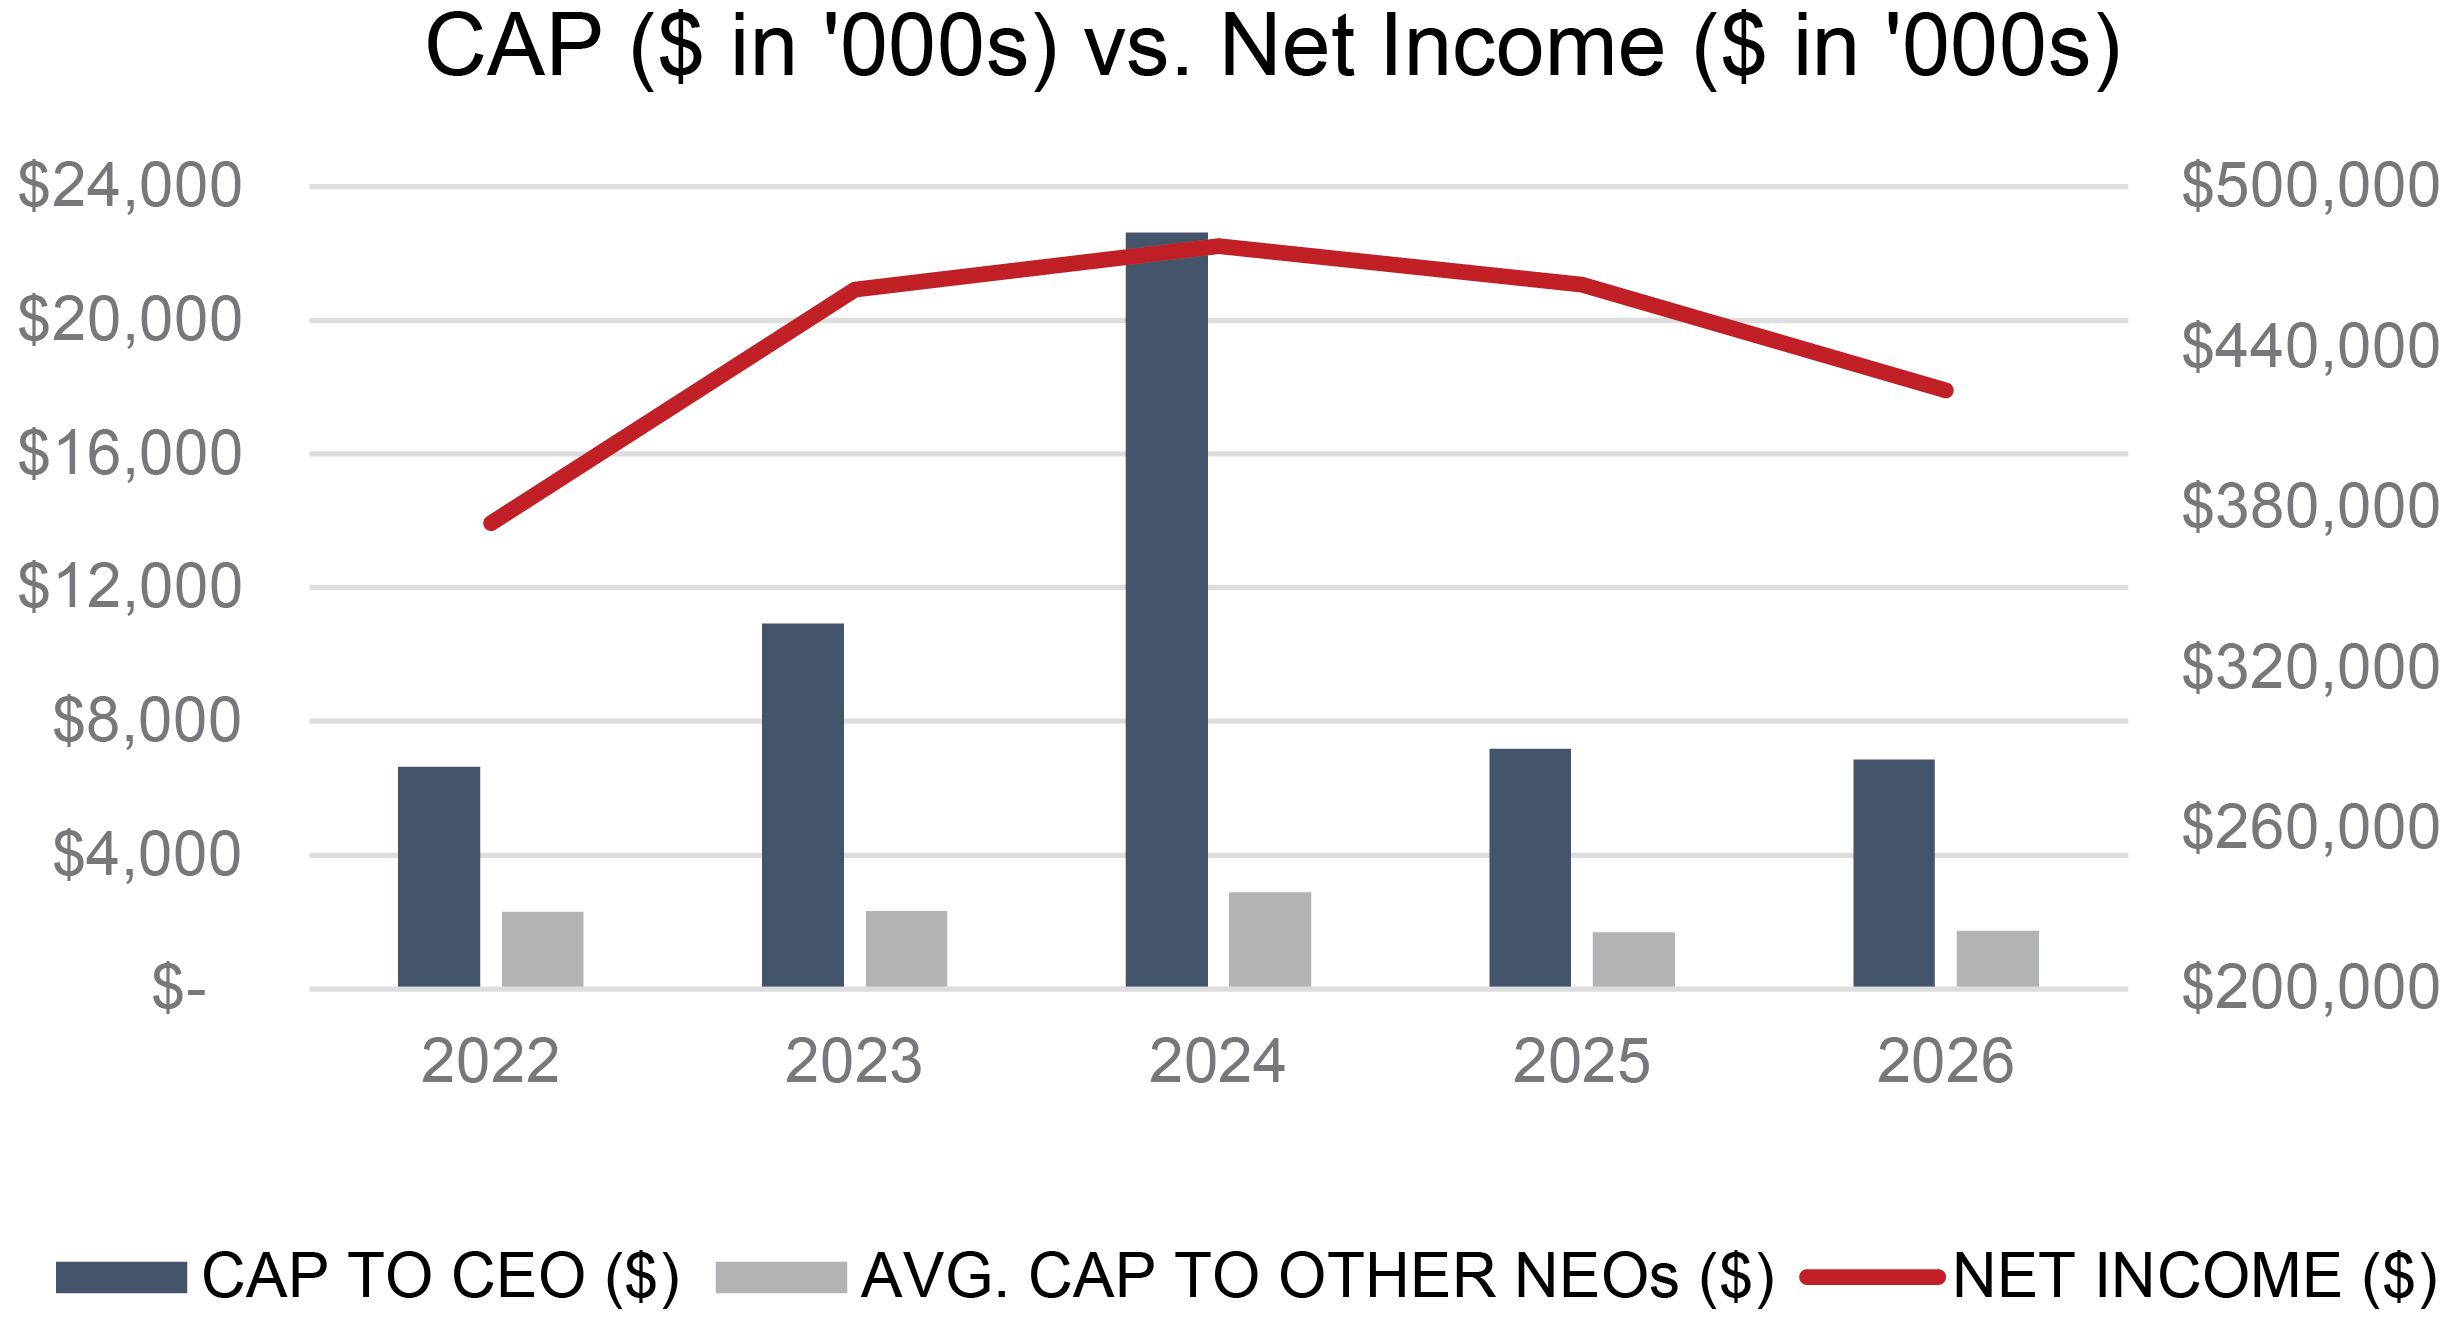
Compensation Actually Paid versus Net Income
Compensation Actually Paid versus Return on Equity
Compensation Actually Paid versus Total Shareholder Return
Financial Performance Measures
As described in greater detail in “Compensation Discussion and Analysis,” the Company’s executive compensation program reflects a pay-for-performance philosophy. The metrics that the Company uses for both our long-term and short-term incentive awards are selected based on an objective of incentivizing our Named Executive Officers to increase the value of our enterprise for our stockholders. The most important financial performance measures used by the Company to link executive compensation actually paid to the Company’s Named Executive Officers, for the most recently completed fiscal year, to the Company’s performance are as follows: