What were the Fund costs for the period?
(based on a hypothetical $10,000 investment)
|
Class
Name |
Costs
of a $10,000 investment |
Costs
paid as a percentage of a $10,000 investment |
|---|---|---|
|
Investor
Class |
$133 |
1.44% |
How did the Fund Perform?
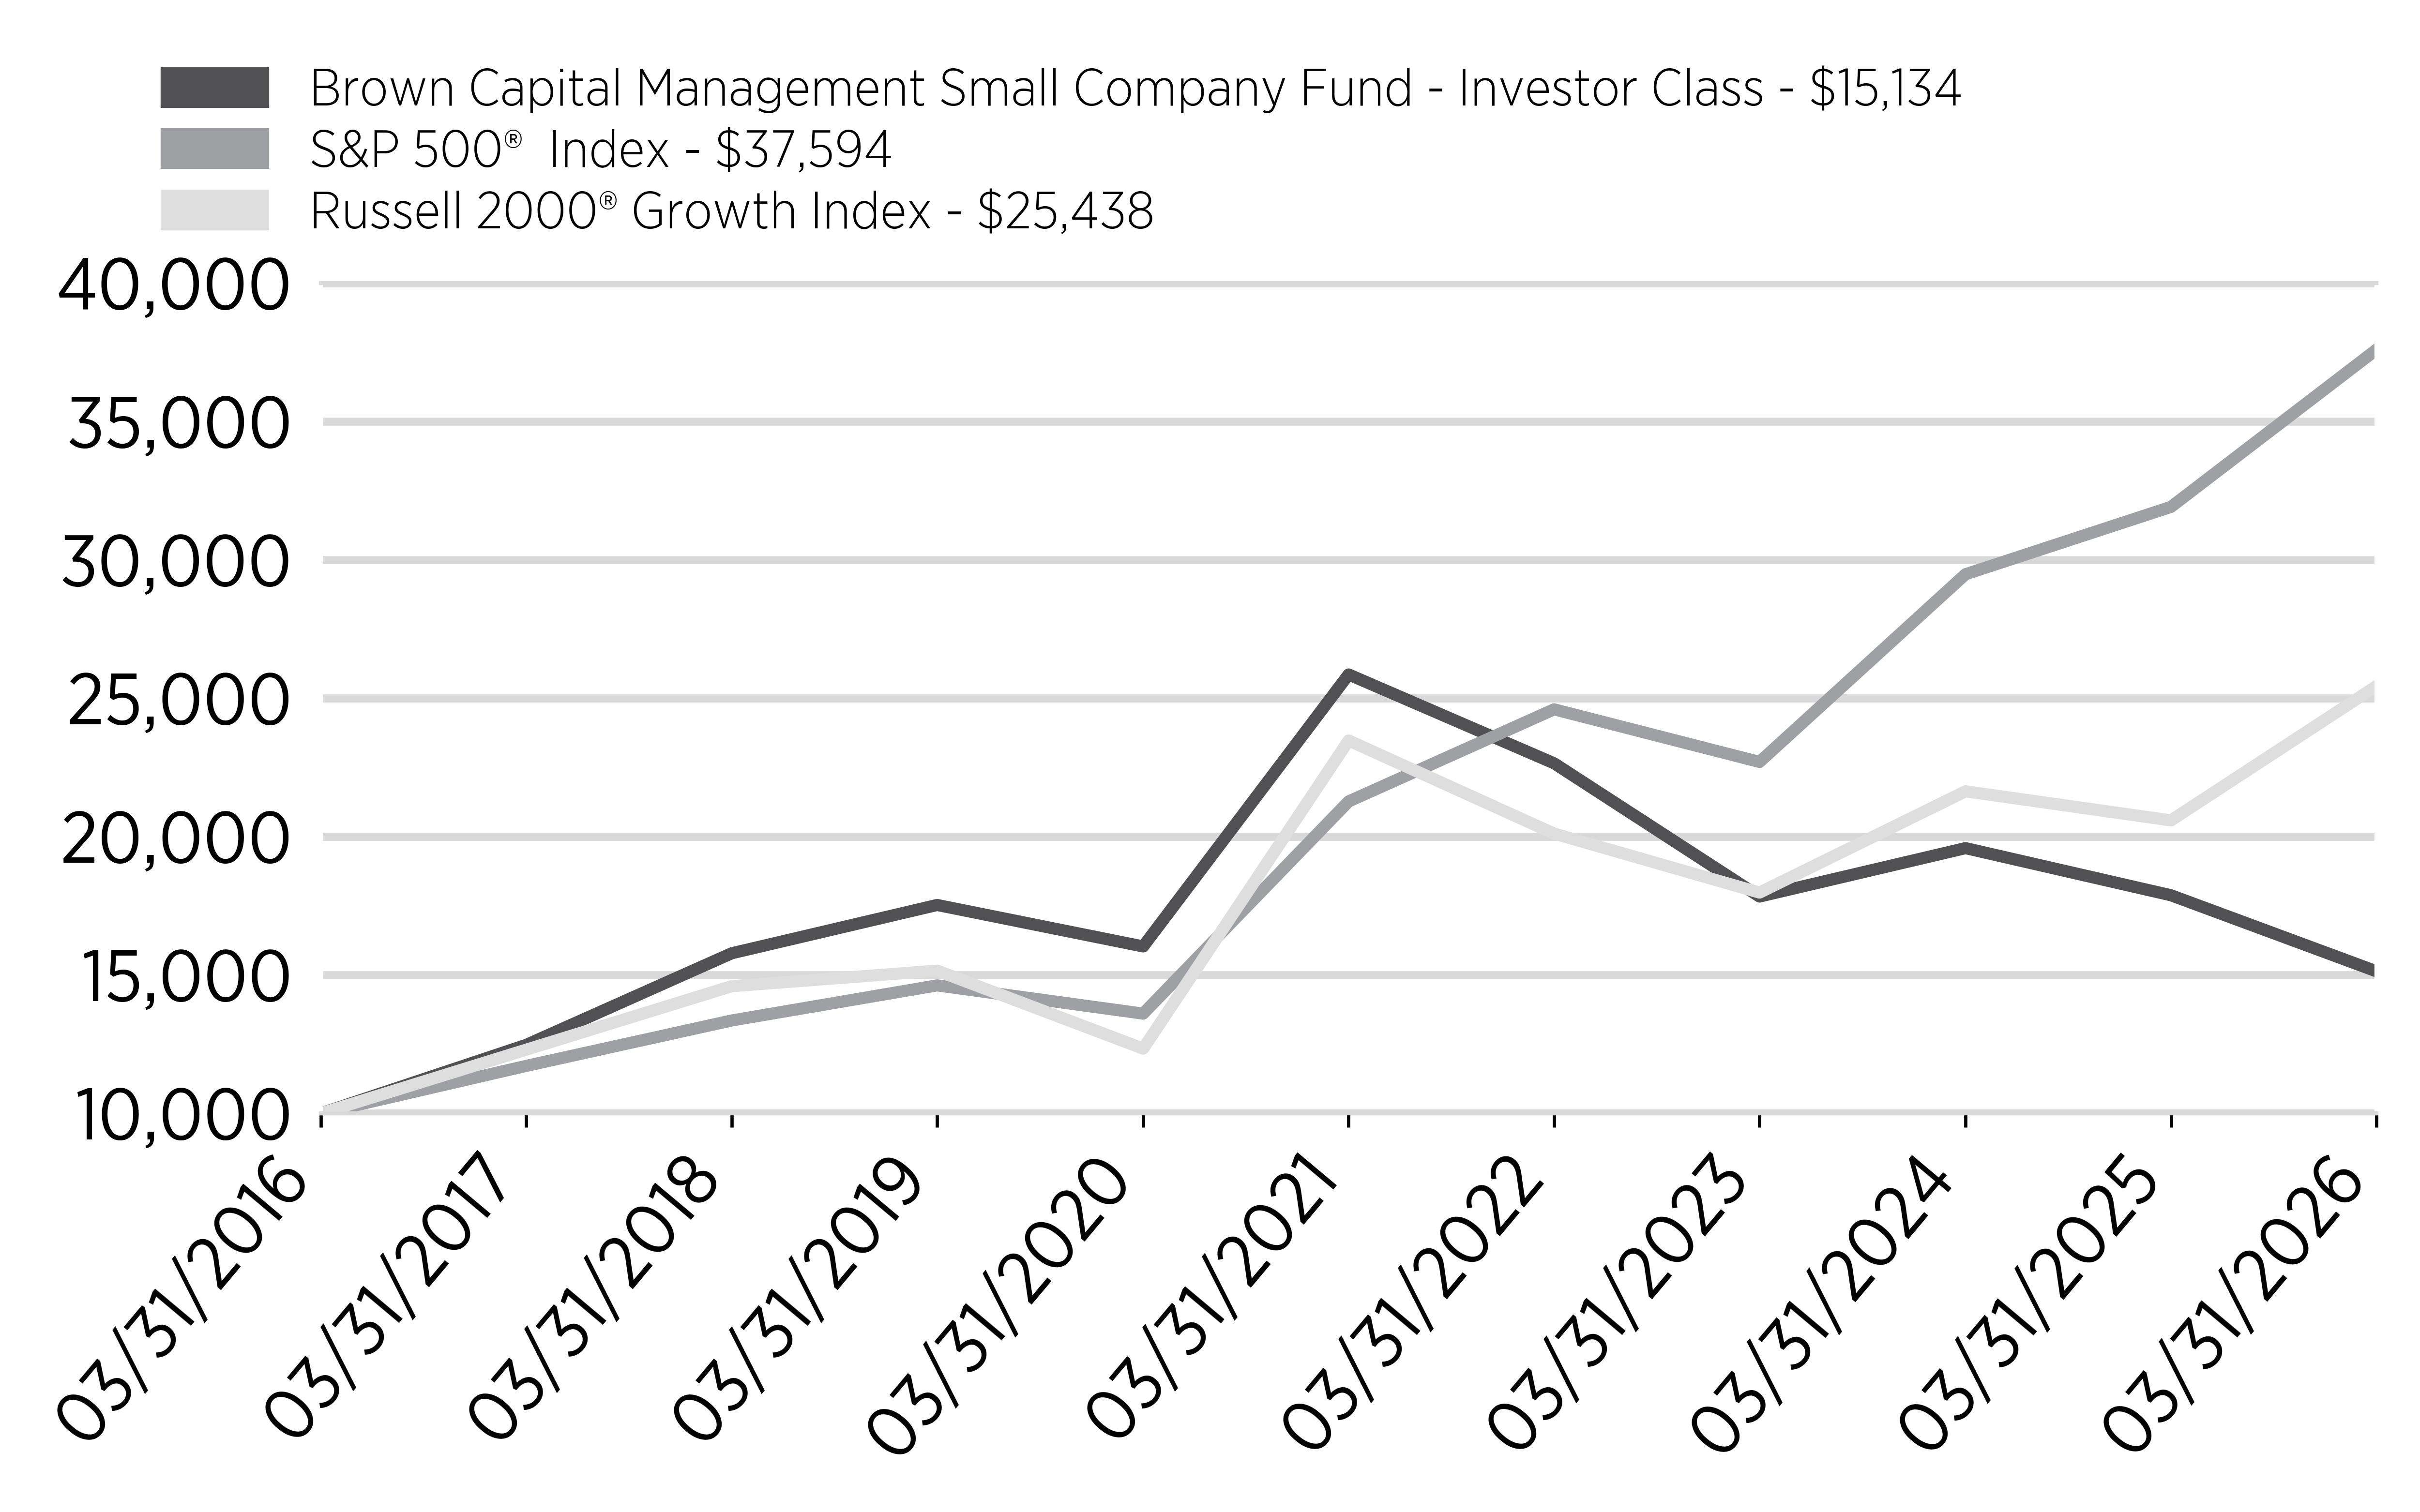
The Brown Capital Management Small Company Fund Investor Class Shares (the “Fund”) returned -15.37% for the fiscal year ended March 31, 2026, compared with 17.80% for the S&P 500® Index and 23.58% for the Russell 2000® Growth Index. These extreme and disappointing results reflect a continuation of the challenging environment for our investment approach over the past several years.
The primary driver of performance during the year was a continued divergence between company fundamentals and stock price behavior. Across much of the portfolio, our Exceptional Growth Companies (EGCs) delivered solid operational results, including durable revenue growth and strong competitive positioning. However, these fundamentals were not reflected in share prices due to poor market sentiment toward high-quality growth companies.
In particular, software and software-adjacent businesses experienced a significant valuation decline driven by concerns about the potential disruptive impact of artificial intelligence (AI). In our view, this reaction has been overly broad. Many of our holdings—particularly those with proprietary data, mission-critical workflows and consumption-based business models—are more likely to benefit from AI than be displaced by it over time. As of March 31, 2026, we estimate that these AI-affected holdings are trading at a 56% discount to their five-year average forward price-to-sales multiples. Life sciences tools and services companies also faced a difficult environment, as customers remained cautious in committing capital.
Top contributors to return included Cognex and Xometry. Cognex benefited from improving demand trends and margin expansion, while Xometry continued to execute on its digital manufacturing marketplace strategy, delivering strong growth and customer expansion. Among the largest detractors were Tyler Technologies and Paycom Software, both of which declined primarily due to valuation compression despite continued operational performance.
During the year, we added several new holdings, including Mama’s Creations and Credo Technology, expanding our exposure to data management and AI infrastructure. We also exited positions such as Vicor and Helios Technologies following a reassessment of their long-term prospects.
Cumulative Performance
(based on a hypothetical $10,000 investment)
Annual Performance
Average Annual Total Return
|
|
1
Year |
5
Years |
10
Years |
|---|---|---|---|
|
Brown
Capital Management
Small
Company Fund - Investor Class |
-15.37% |
-10.16% |
4.23% |
|
S&P
500® Index |
17.80% |
12.06% |
14.16% |
|
Russell
2000® Growth Index |
23.58% |
1.62% |
9.79% |
Key Fund Statistics
(as of March 31, 2026)
|
Fund
Net Assets |
$321,889,235 |
|
Number
of Holdings |
47 |
|
Total
Net Advisory Fee |
$6,667,114 |
|
Portfolio
Turnover Rate |
13% |
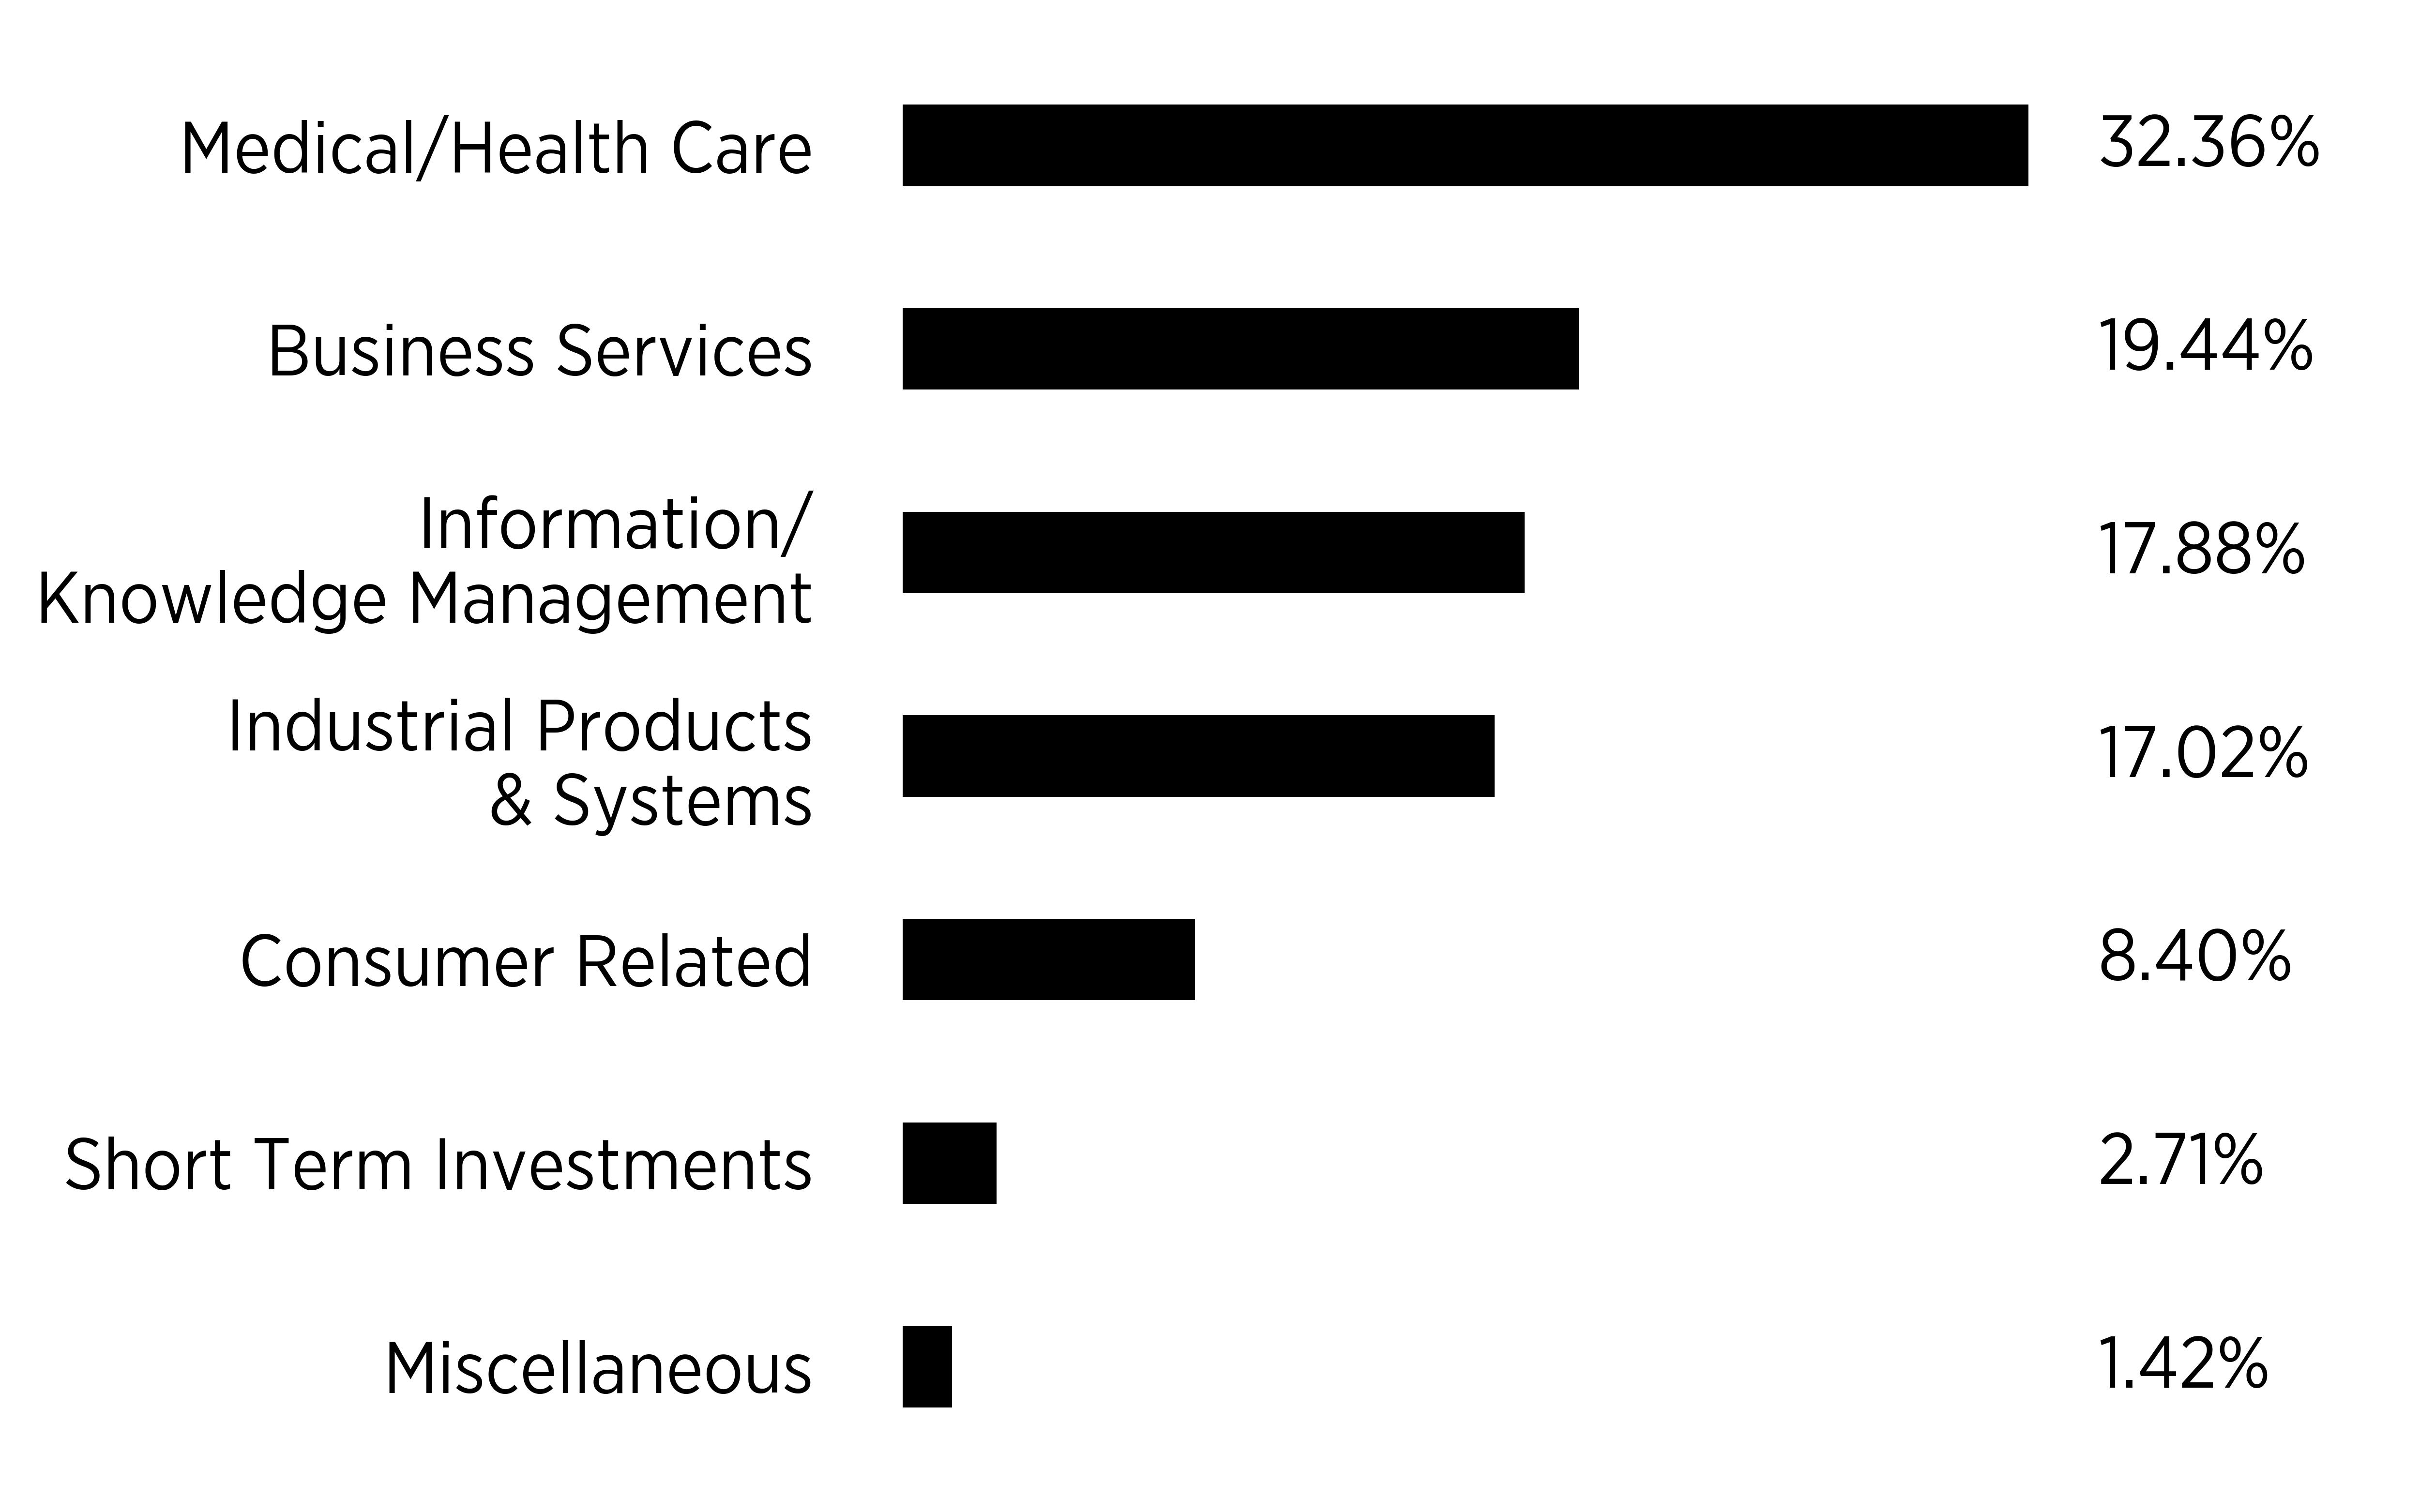
Sector Breakdown
|
Top
10 Holdings |
|
|---|---|
|
Glaukos
Corp. |
|
|
Datadog,
Inc. Class A |
|
|
Cognex
Corp. |
|
|
Repligen
Corp. |
|
|
Veeva
Systems, Inc. Class A |
|
|
Guidewire
Software, Inc. |
|
|
Vericel
Corp. |
|
|
Tyler
Technologies, Inc. |
|
|
Manhattan
Associates, Inc. |
|
|
Xometry,
Inc. |
What were the Fund costs for the period?
(based on a hypothetical $10,000 investment)
|
Class
Name |
Costs
of a $10,000 investment |
Costs
paid as a percentage of a $10,000 investment |
|---|---|---|
|
Institutional
Class |
$115 |
1.24% |
How did the Fund Perform?
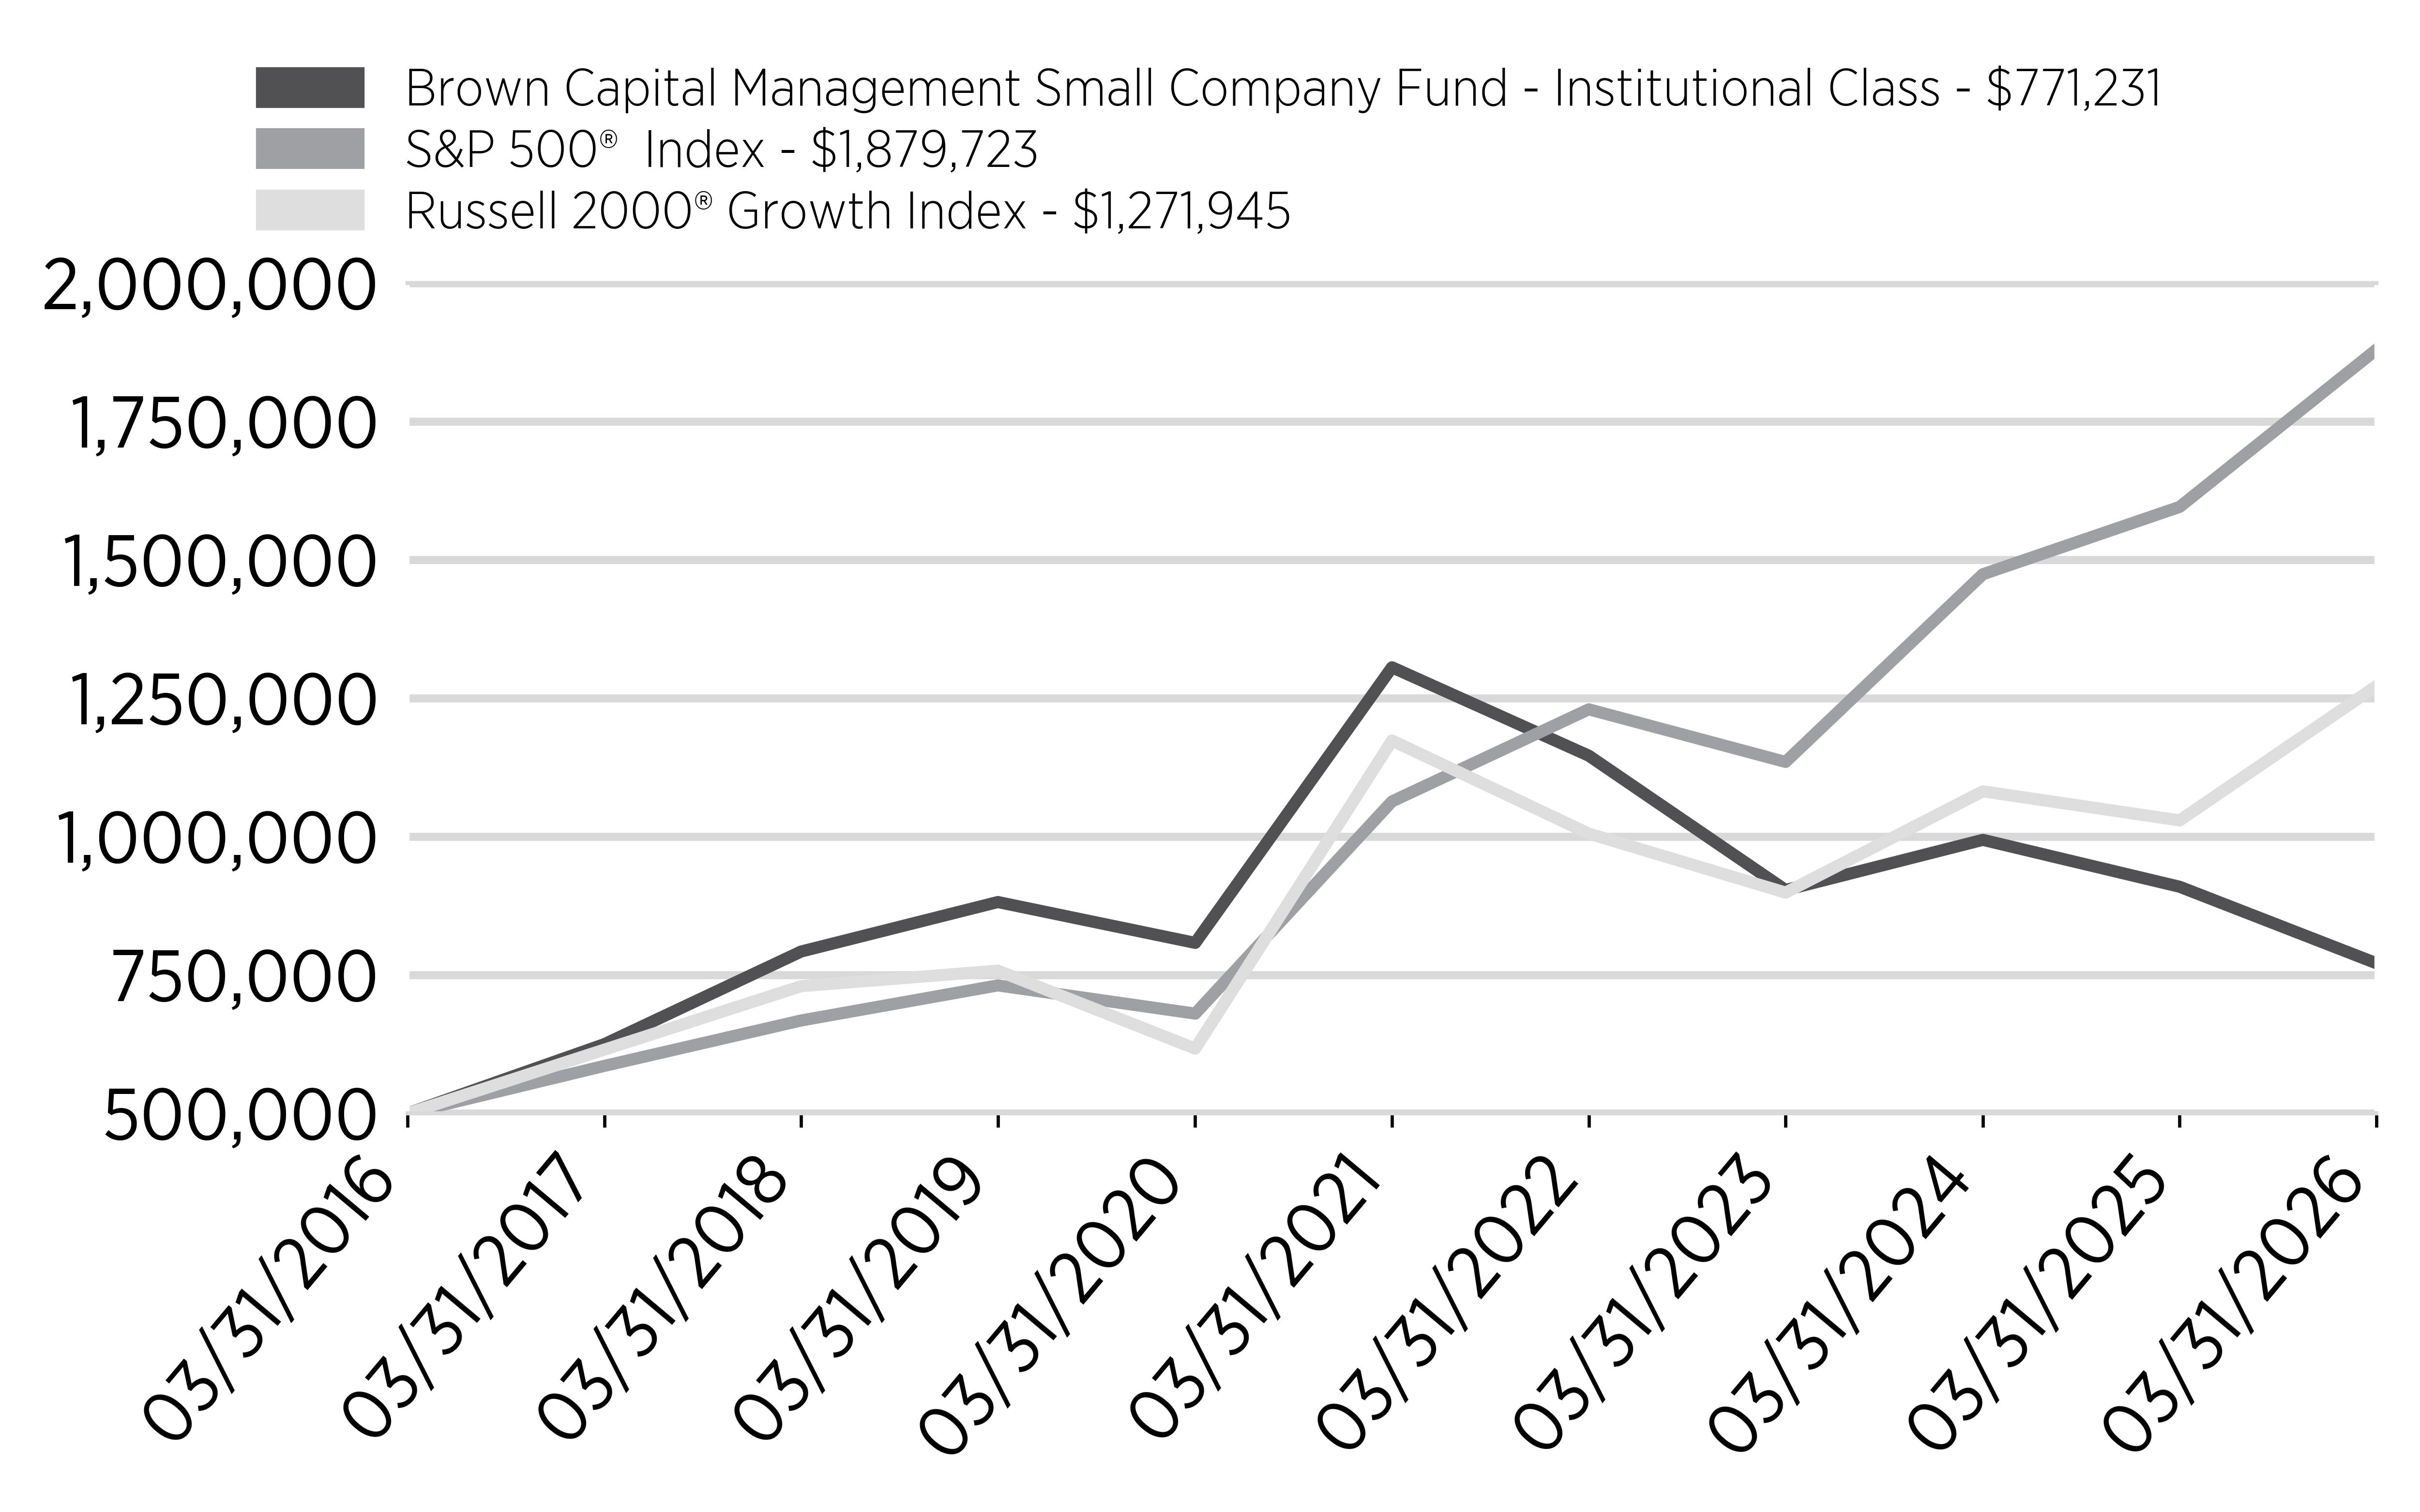
The Brown Capital Management Small Company Fund, Institutional Class Shares (the “Fund”) returned -15.20% for the fiscal year ended March 31, 2026, compared with 17.80% for the S&P 500® Index and 23.58% for the Russell 2000® Growth Index. These extreme and disappointing results reflect a continuation of the challenging environment for our investment approach over the past several years.
The primary driver of performance during the year was a continued divergence between company fundamentals and stock price behavior. Across much of the portfolio, our Exceptional Growth Companies (EGCs) delivered solid operational results, including durable revenue growth and strong competitive positioning. However, these fundamentals were not reflected in share prices due to poor market sentiment toward high-quality growth companies.
In particular, software and software-adjacent businesses experienced a significant valuation decline driven by concerns about the potential disruptive impact of artificial intelligence (AI). In our view, this reaction has been overly broad. Many of our holdings—particularly those with proprietary data, mission-critical workflows and consumption-based business models—are more likely to benefit from AI than be displaced by it over time. As of March 31, 2026, we estimate that these AI-affected holdings are trading at a 56% discount to their five-year average forward price-to-sales multiples. Life sciences tools and services companies also faced a difficult environment, as customers remained cautious in committing capital.
Top contributors to return included Cognex and Xometry. Cognex benefited from improving demand trends and margin expansion, while Xometry continued to execute on its digital manufacturing marketplace strategy, delivering strong growth and customer expansion. Among the largest detractors were Tyler Technologies and Paycom Software, both of which declined primarily due to valuation compression despite continued operational performance.
During the year, we added several new holdings, including Mama’s Creations and Credo Technology, expanding our exposure to data management and AI infrastructure. We also exited positions such as Vicor and Helios Technologies following a reassessment of their long-term prospects.
Cumulative Performance
(based on a hypothetical $500,000 investment)
Annual Performance
Average Annual Total Return
|
|
1
Year |
5
Years |
10
Years |
|---|---|---|---|
|
Brown
Capital Management
Small
Company Fund - Institutional Class |
-15.20% |
-10.00% |
4.43% |
|
S&P
500® Index |
17.80% |
12.06% |
14.16% |
|
Russell
2000® Growth Index |
23.58% |
1.62% |
9.79% |
Key Fund Statistics
(as of March 31, 2026)
|
Fund
Net Assets |
$321,889,235 |
|
Number
of Holdings |
47 |
|
Total
Net Advisory Fee |
$6,667,114 |
|
Portfolio
Turnover Rate |
13% |
Sector Breakdown
|
Top
10 Holdings |
|
|---|---|
|
Glaukos
Corp. |
|
|
Datadog,
Inc. Class A |
|
|
Cognex
Corp. |
|
|
Repligen
Corp. |
|
|
Veeva
Systems, Inc. Class A |
|
|
Guidewire
Software, Inc. |
|
|
Vericel
Corp. |
|
|
Tyler
Technologies, Inc. |
|
|
Manhattan
Associates, Inc. |
|
|
Xometry,
Inc. |
What were the Fund costs for the period?
(based on a hypothetical $10,000 investment)
|
Class
Name |
Costs
of a $10,000 investment |
Costs
paid as a percentage of a $10,000 investment |
|---|---|---|
|
Investor
Class |
$117 |
1.25% |
How did the Fund Perform?
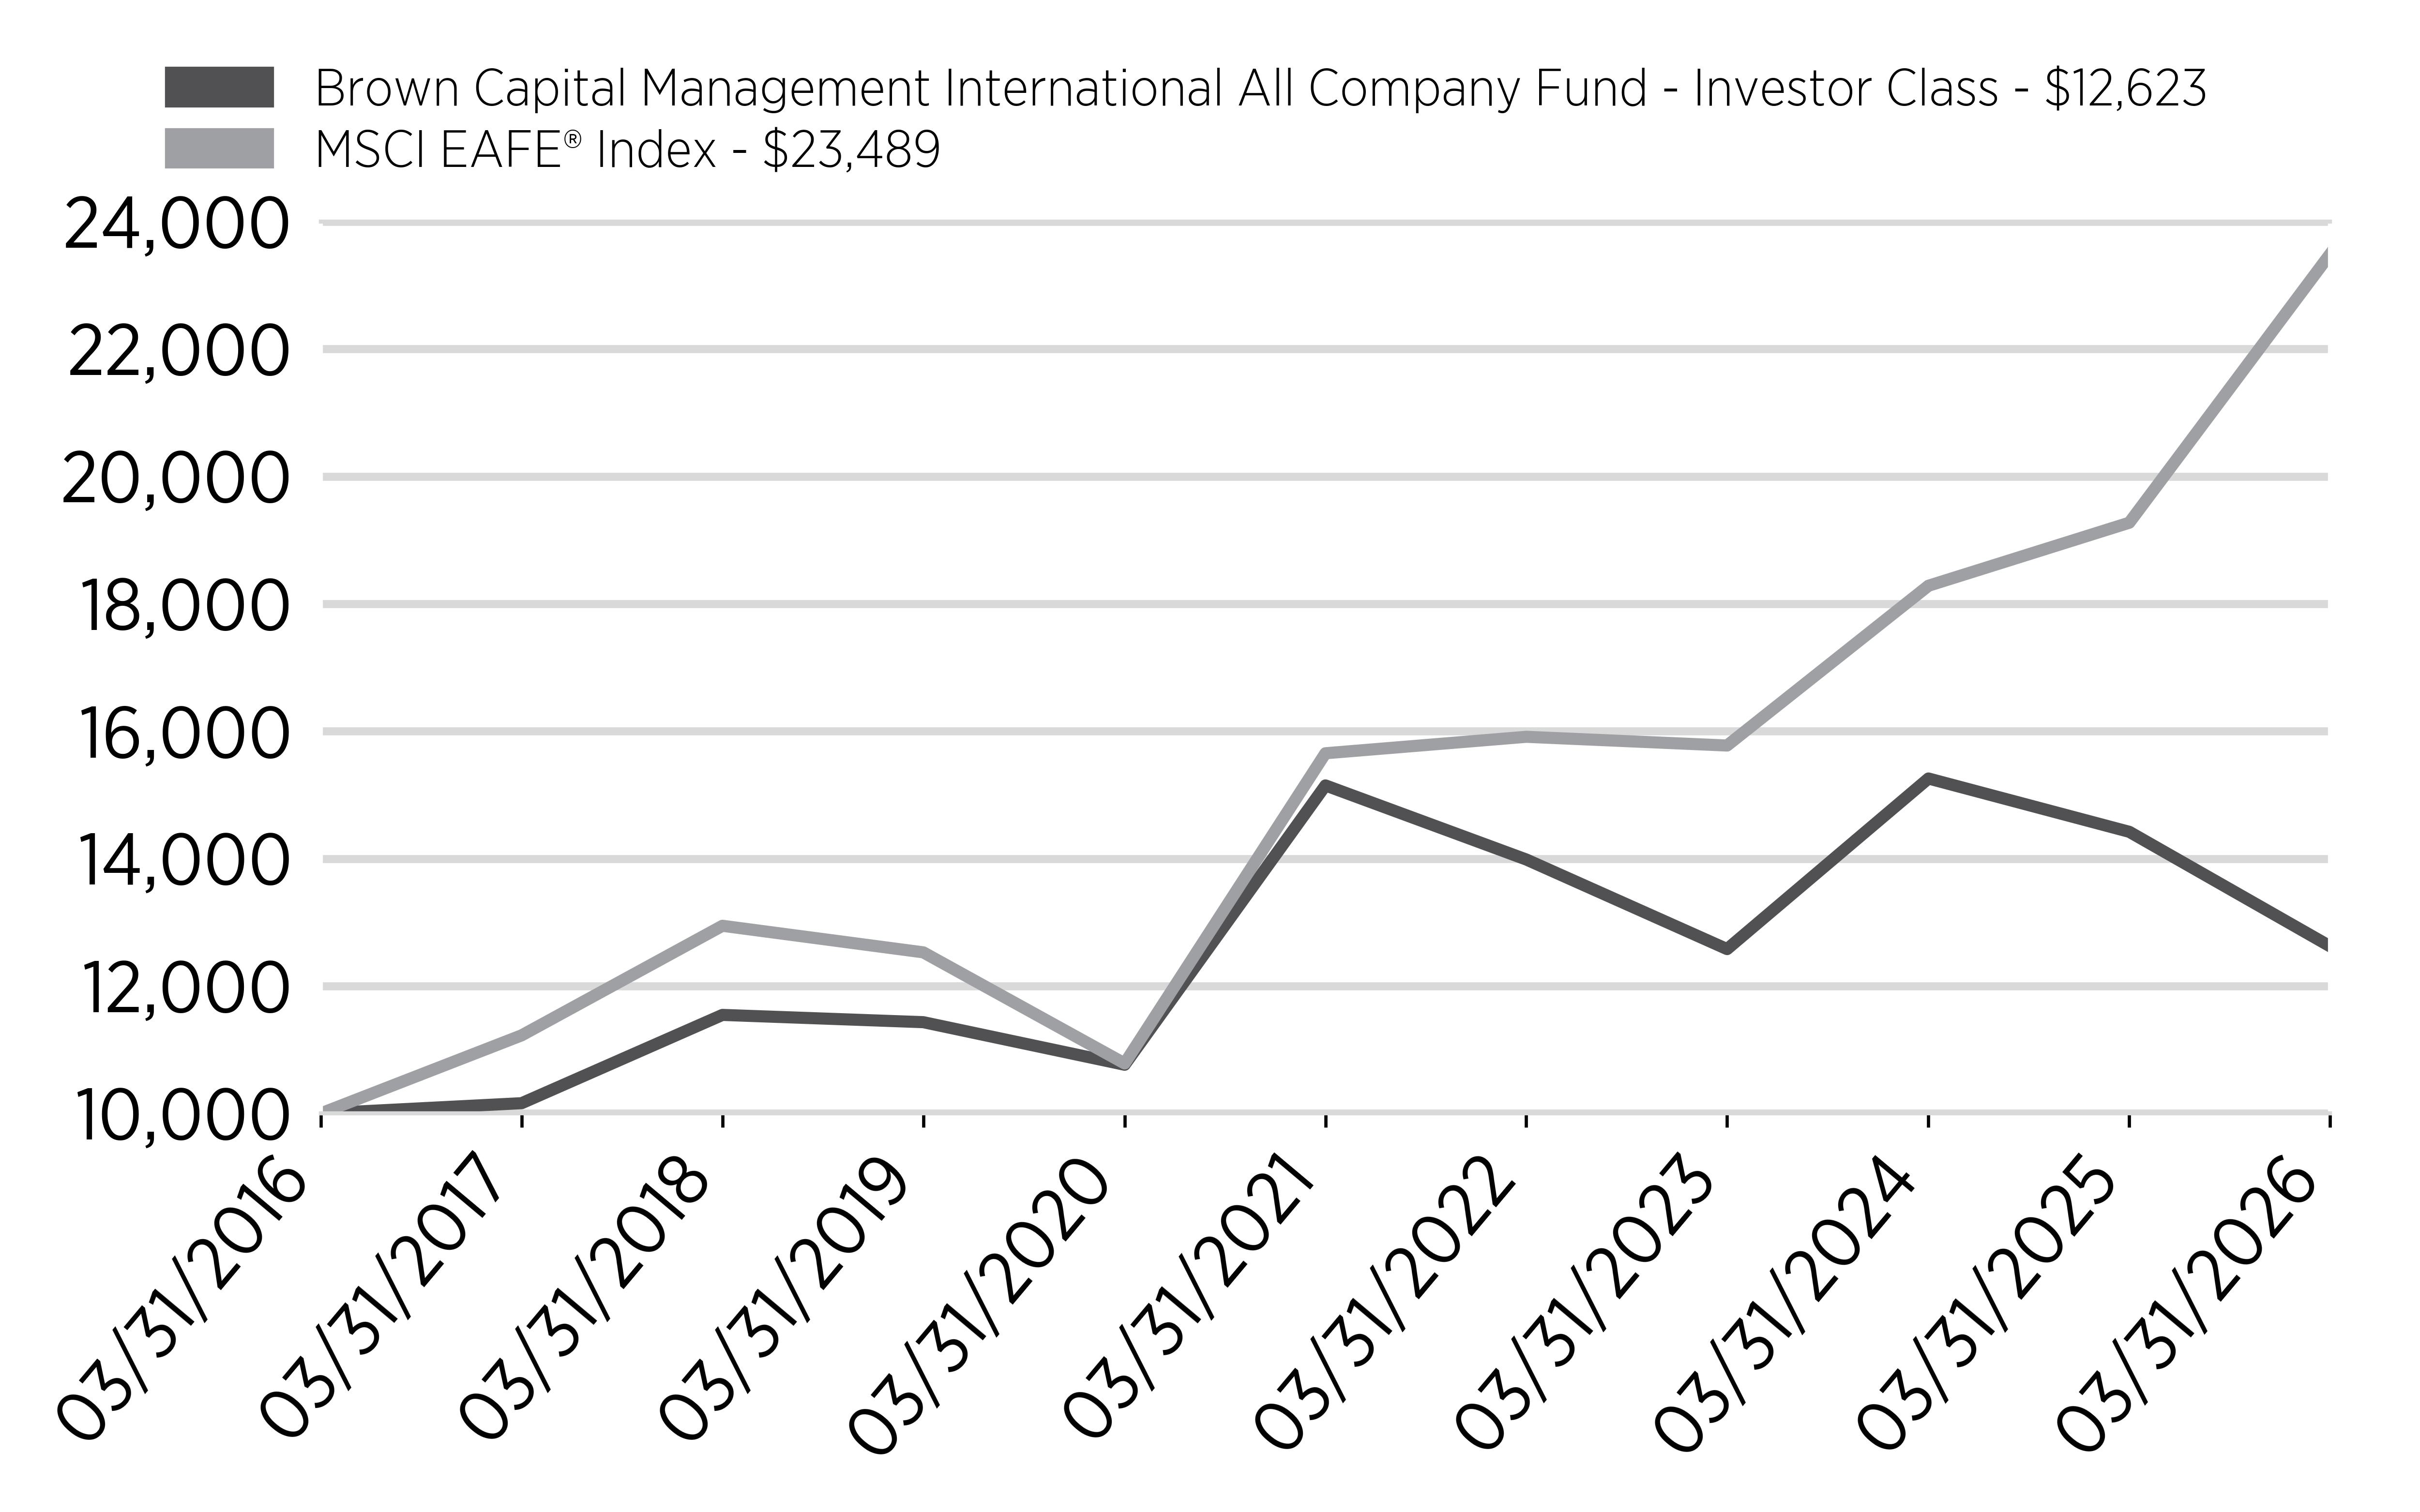
The Brown Capital Management International All Company Fund Investor Class Shares (the “Fund”) declined 12.46% for the fiscal year ended March 31, 2026, lagging the MSCI EAFE® Index, which rose 21.88%. The underperformance was driven by a rotation away from growth equities, a sharp performance divide related to artificial intelligence (AI) and several stock-specific challenges.
We invest in what we call Exceptional Growth Companies (EGCs) that offer mission-critical products and services, saving their customers time, lives, money and headaches, or providing exceptional value to consumers. While market conditions were unfavorable, we believe our EGCs retain the competitive positioning, pricing power and financial strength to navigate periods of volatility.
While market sentiment was challenging, the fundamentals of many of our holdings remained solid, with continued revenue growth, resilient margins and ongoing execution against long-term strategies. Despite this, share prices declined across portions of the portfolio, particularly among software and platform businesses, as investors reassessed the potential impact of AI and rotated toward more cyclical areas of the market.
Top contributors included Camtek and ASML, both of which benefited from strong demand tied to AI-related semiconductor investment. Among the detractors were MonotaRO and Flutter Entertainment, which declined amid moderating growth expectations, margin pressures and broader weakness in growth stocks.
We added several new positions during the year, including Apotea, Hub24 and Nu Holdings, and exited holdings such as AutoStore, Tecan and CyberArk as we reassessed fundamentals and redeployed capital into higher-conviction opportunities.
Thank you for your continued support.
Cumulative Performance
(based on a hypothetical $10,000 investment)
Annual Performance
Average Annual Total Return
|
|
1
Year |
5
Years |
10
Years |
|---|---|---|---|
|
Brown
Capital Management International
All
Company Fund - Investor Class |
-12.46% |
-3.58% |
2.36% |
|
MSCI
EAFE® Index |
21.88% |
8.46% |
8.91% |
Key Fund Statistics
(as of March 31, 2026)
|
Fund
Net Assets |
$46,792,886 |
|
Number
of Holdings |
41 |
|
Total
Net Advisory Fee |
$87,374 |
|
Portfolio
Turnover Rate |
15% |
Sector Breakdown
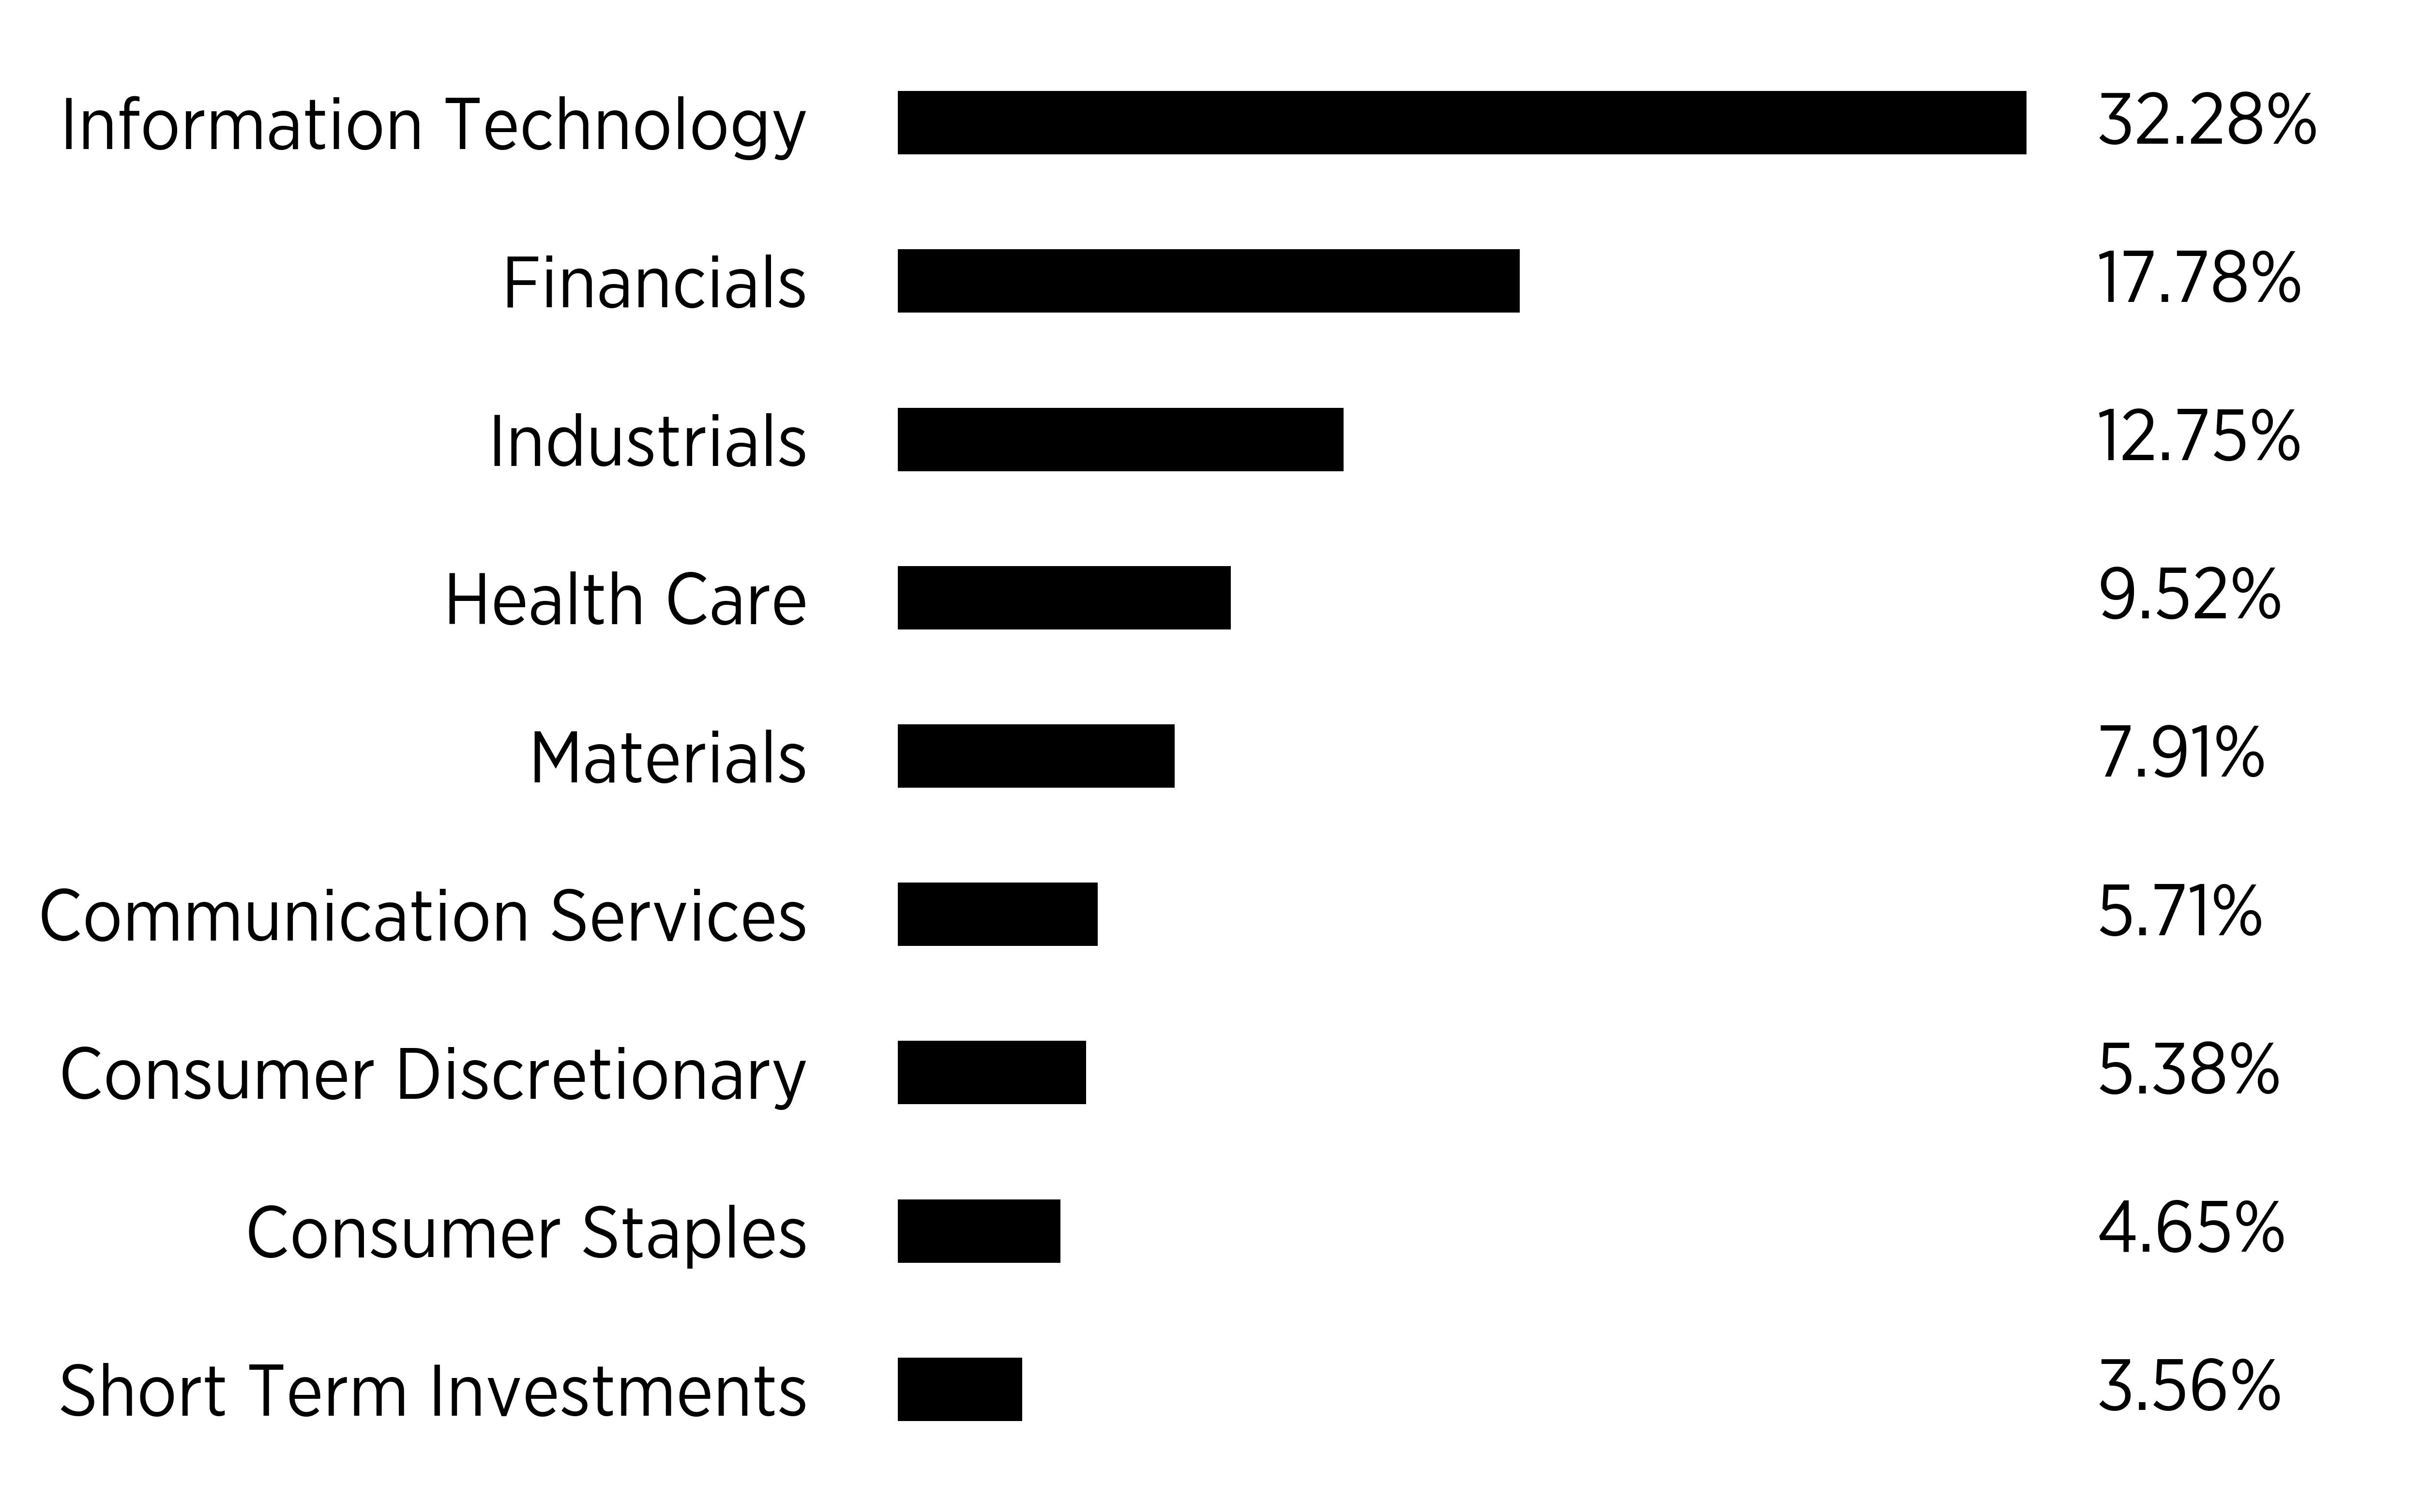
|
Top
10 Holdings |
|
|---|---|
|
ASML
Holding NV |
|
|
AJ
Bell plc |
|
|
REA
Group Ltd. |
|
|
Givaudan
SA |
|
|
Novonesis
A/S |
|
|
Camtek
Ltd. |
|
|
MercadoLibre,
Inc. |
|
|
The
Descartes Systems Group, Inc. |
|
|
First
American Treasury Obligations Fund - X Class |
|
|
Azimut
Holding S.p.A. |
Material Changes
Fund Liquidation
On May 22, 2026, the Board of Trustees of Brown Capital Management Mutual Funds approved a Plan of Termination and Liquidation (the "Plan") for the Brown Capital Management International All Company Fund ("Fund"). The Brown Capital Management International All Company Fund commenced operations on May 28, 1999. Brown Capital Management, LLC (the "Advisor"), the Fund's investment advisor, recommended that the Board approve the Plan due to factors such as the Fund's underperformance and diminished assets under management, limited growth opportunities, and the Advisor's indication that it does not desire to continue subsidizing the Fund's expenses. As a result, the Board concluded that it is in the best interests of the Fund and its shareholders to terminate and liquidate the Fund. The Fund is expected to terminate as a series of the Trust and liquidate on or about June 30, 2026 (the "Termination Date").
Effective May 26, 2026, the Fund is closed to new and subsequent investments. Any remaining shareholders on the Termination Date will receive a distribution of their remaining investment value in the Fund, after the payment of certain Fund liabilities as provided for in the Plan. The sale or liquidation of your Fund shares will generally be a taxable event. You should consult your tax adviser about your tax situation as concerns the Fund's termination and liquidation.
As shareholders redeem shares of the Fund between May 26, 2026 and the Termination Date, the Fund may not be able to maintain its investment objective and other investment policies. Accordingly, the Fund may deviate from its investment objective and other investment policies during the period between May 26, 2026 and the Termination Date.
What were the Fund costs for the period?
(based on a hypothetical $10,000 investment)
|
Class
Name |
Costs
of a $10,000 investment |
Costs
paid as a percentage of a $10,000 investment |
|---|---|---|
|
Institutional
Class |
$94 |
1.00% |
How did the Fund Perform?
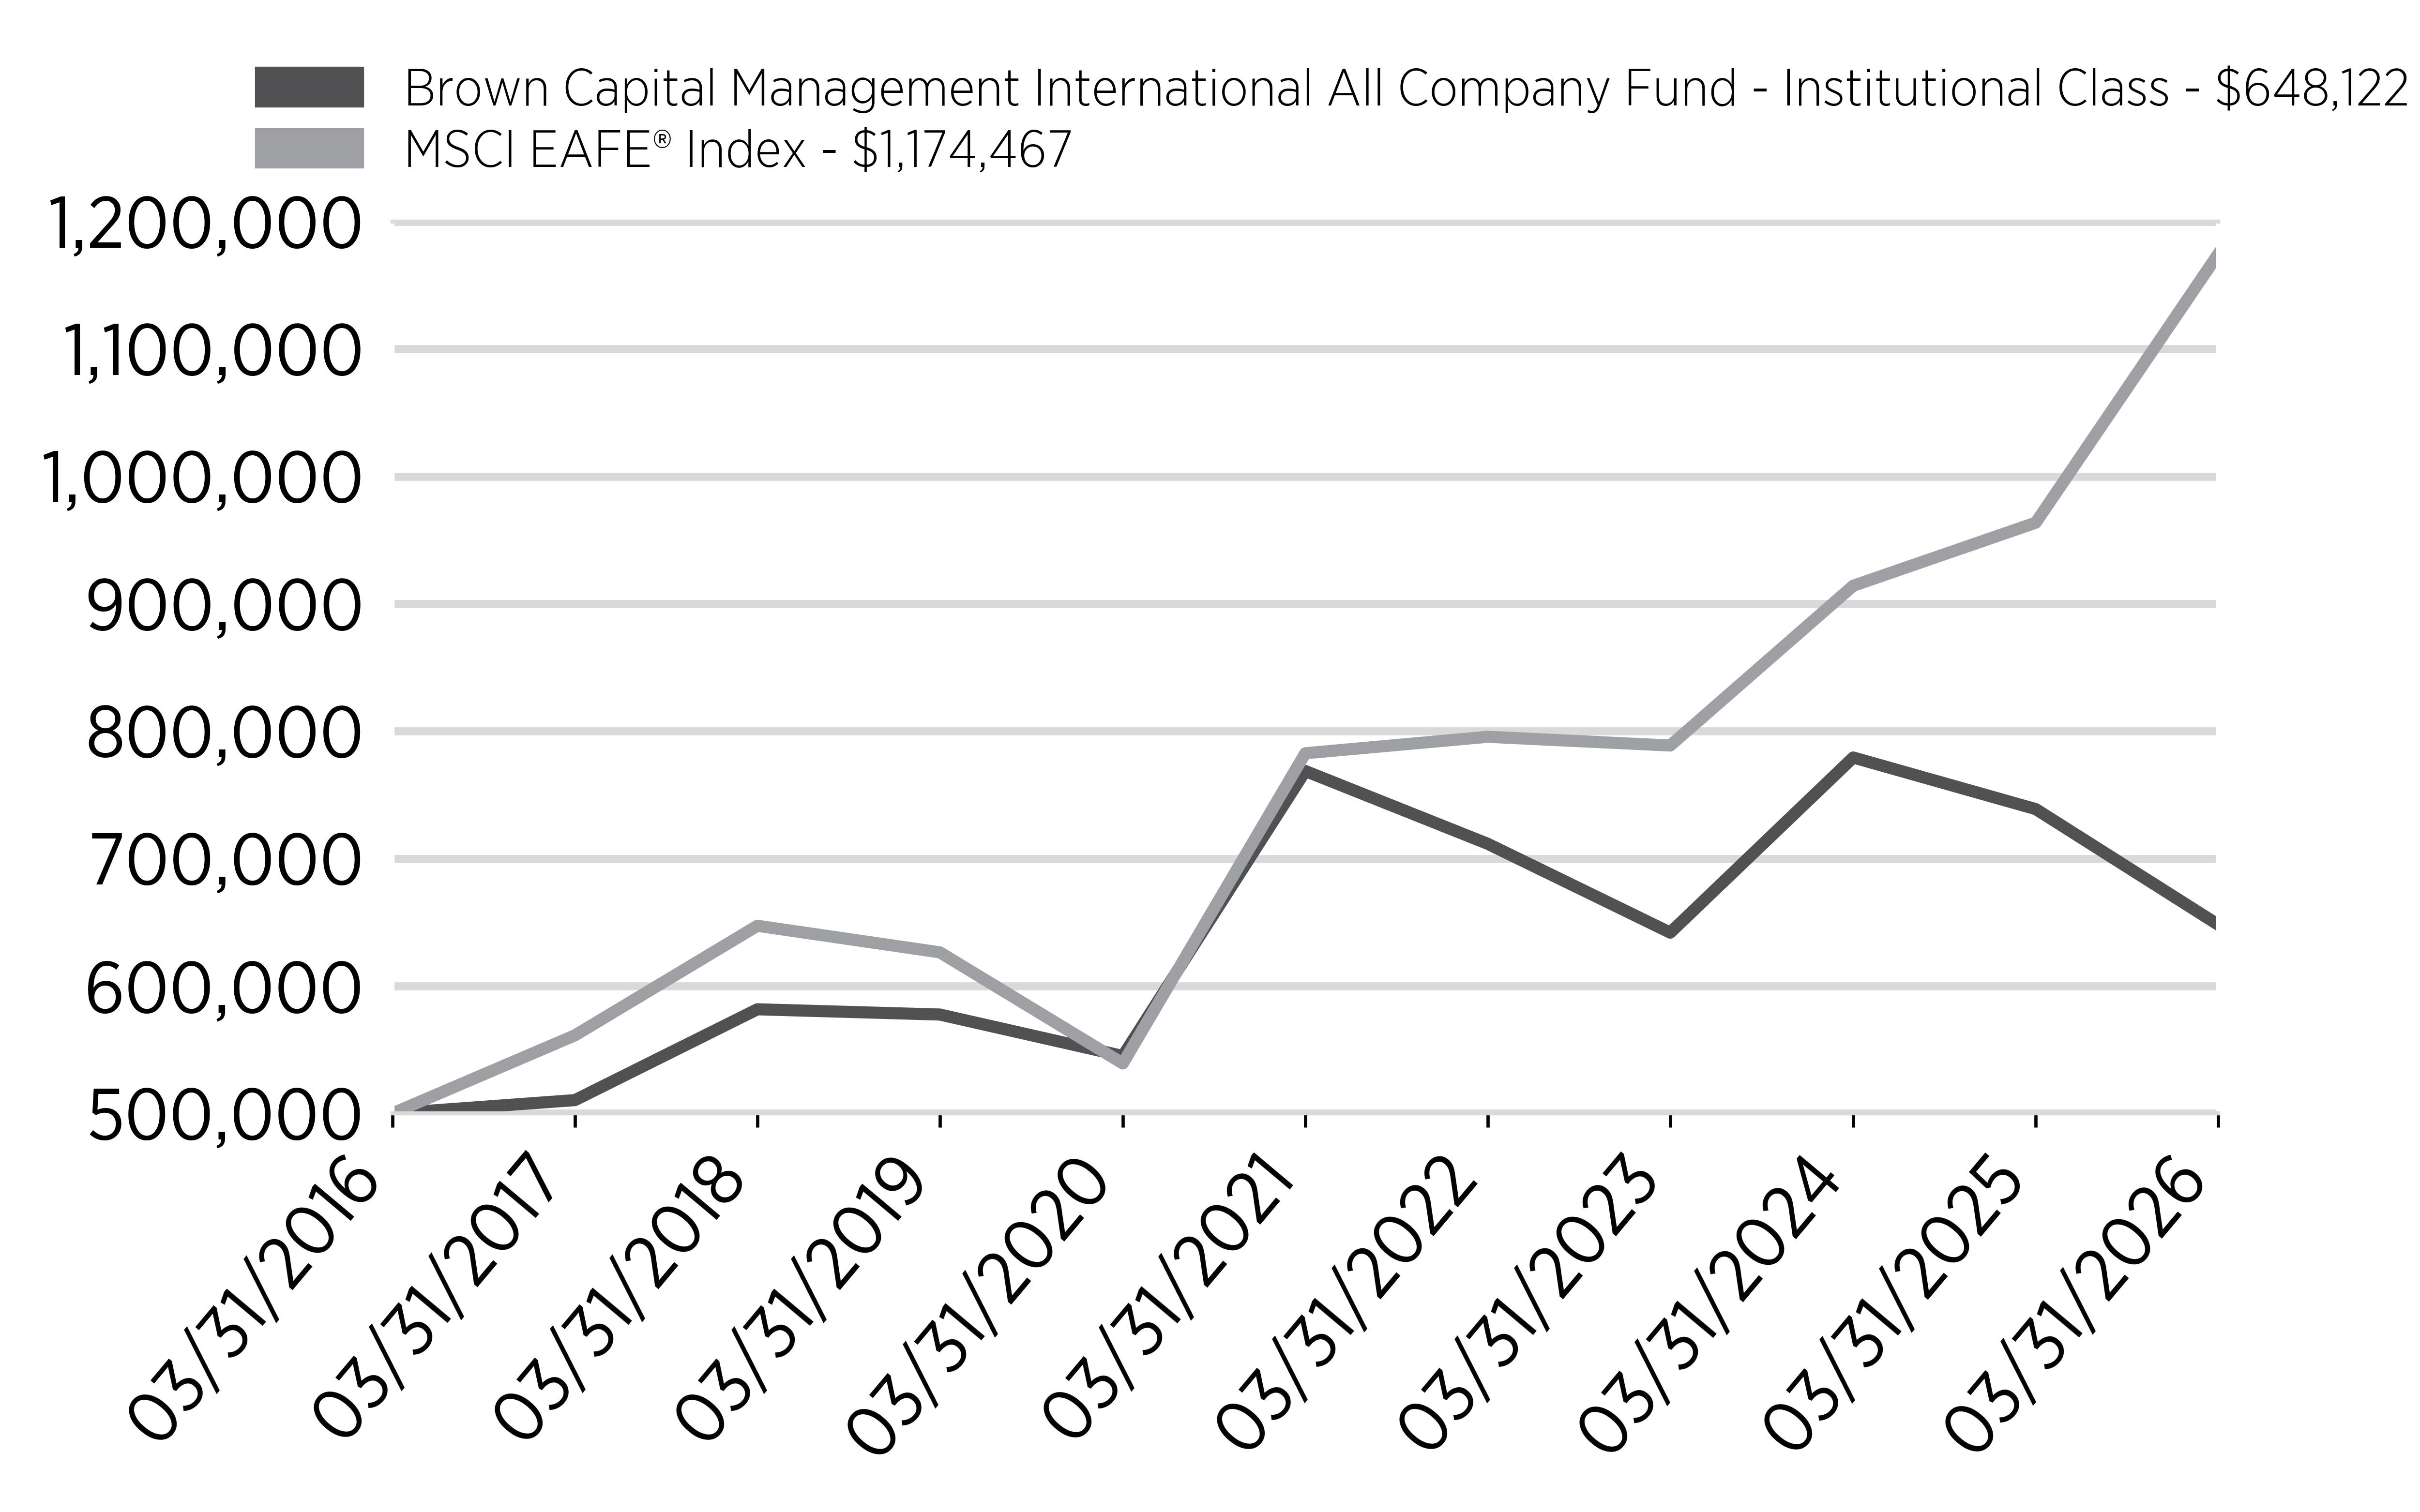
The Brown Capital Management International All Company Fund Institutional Class Shares (the “Fund”) declined 12.28% for the fiscal year ended March 31, 2026, lagging the MSCI EAFE® Index, which rose 21.88%. The underperformance was driven by a rotation away from growth equities, a sharp performance divide related to artificial intelligence (AI) and several stock-specific challenges.
We invest in what we call Exceptional Growth Companies (EGCs) that offer mission-critical products and services, saving their customers time, lives, money and headaches, or providing exceptional value to consumers. While market conditions were unfavorable, we believe our EGCs retain the competitive positioning, pricing power and financial strength to navigate periods of volatility.
While market sentiment was challenging, the fundamentals of many of our holdings remained solid, with continued revenue growth, resilient margins and ongoing execution against long-term strategies. Despite this, share prices declined across portions of the portfolio, particularly among software and platform businesses, as investors reassessed the potential impact of AI and rotated toward more cyclical areas of the market.
Top contributors included Camtek and ASML, both of which benefited from strong demand tied to AI-related semiconductor investment. Among the detractors were MonotaRO and Flutter Entertainment, which declined amid moderating growth expectations, margin pressures and broader weakness in growth stocks.
We added several new positions during the year, including Apotea, Hub24 and Nu Holdings, and exited holdings such as AutoStore, Tecan and CyberArk as we reassessed fundamentals and redeployed capital into higher-conviction opportunities.
Thank you for your continued support.
Cumulative Performance
(based on a hypothetical $500,000 investment)
Annual Performance
Average Annual Total Return
|
|
1
Year |
5
Years |
10
Years |
|---|---|---|---|
|
Brown
Capital Management International
All
Company Fund - Institutional Class |
-12.28% |
-3.36% |
2.63% |
|
MSCI
EAFE® Index |
21.88% |
8.46% |
8.91% |
Key Fund Statistics
(as of March 31, 2026)
|
Fund
Net Assets |
$46,792,886 |
|
Number
of Holdings |
41 |
|
Total
Net Advisory Fee |
$87,374 |
|
Portfolio
Turnover Rate |
15% |
Sector Breakdown
|
Top
10 Holdings |
|
|---|---|
|
ASML
Holding NV |
|
|
AJ
Bell plc |
|
|
REA
Group Ltd. |
|
|
Givaudan
SA |
|
|
Novonesis
A/S |
|
|
Camtek
Ltd. |
|
|
MercadoLibre,
Inc. |
|
|
The
Descartes Systems Group, Inc. |
|
|
First
American Treasury Obligations Fund - X Class |
|
|
Azimut
Holding S.p.A. |
Material Changes
Fund Liquidation
On May 22, 2026, the Board of Trustees of Brown Capital Management Mutual Funds approved a Plan of Termination and Liquidation (the "Plan") for the Brown Capital Management International All Company Fund ("Fund"). The Brown Capital Management International All Company Fund commenced operations on May 28, 1999. Brown Capital Management, LLC (the "Advisor"), the Fund's investment advisor, recommended that the Board approve the Plan due to factors such as the Fund's underperformance and diminished assets under management, limited growth opportunities, and the Advisor's indication that it does not desire to continue subsidizing the Fund's expenses. As a result, the Board concluded that it is in the best interests of the Fund and its shareholders to terminate and liquidate the Fund. The Fund is expected to terminate as a series of the Trust and liquidate on or about June 30, 2026 (the "Termination Date").
Effective May 26, 2026, the Fund is closed to new and subsequent investments. Any remaining shareholders on the Termination Date will receive a distribution of their remaining investment value in the Fund, after the payment of certain Fund liabilities as provided for in the Plan. The sale or liquidation of your Fund shares will generally be a taxable event. You should consult your tax adviser about your tax situation as concerns the Fund's termination and liquidation.
As shareholders redeem shares of the Fund between May 26, 2026 and the Termination Date, the Fund may not be able to maintain its investment objective and other investment policies. Accordingly, the Fund may deviate from its investment objective and other investment policies during the period between May 26, 2026 and the Termination Date.
What were the Fund costs for the period?
(based on a hypothetical $10,000 investment)
|
Class
Name |
Costs
of a $10,000 investment |
Costs
paid as a percentage of a $10,000 investment |
|---|---|---|
|
Investor
Class |
$122 |
1.32% |
How did the Fund Perform?
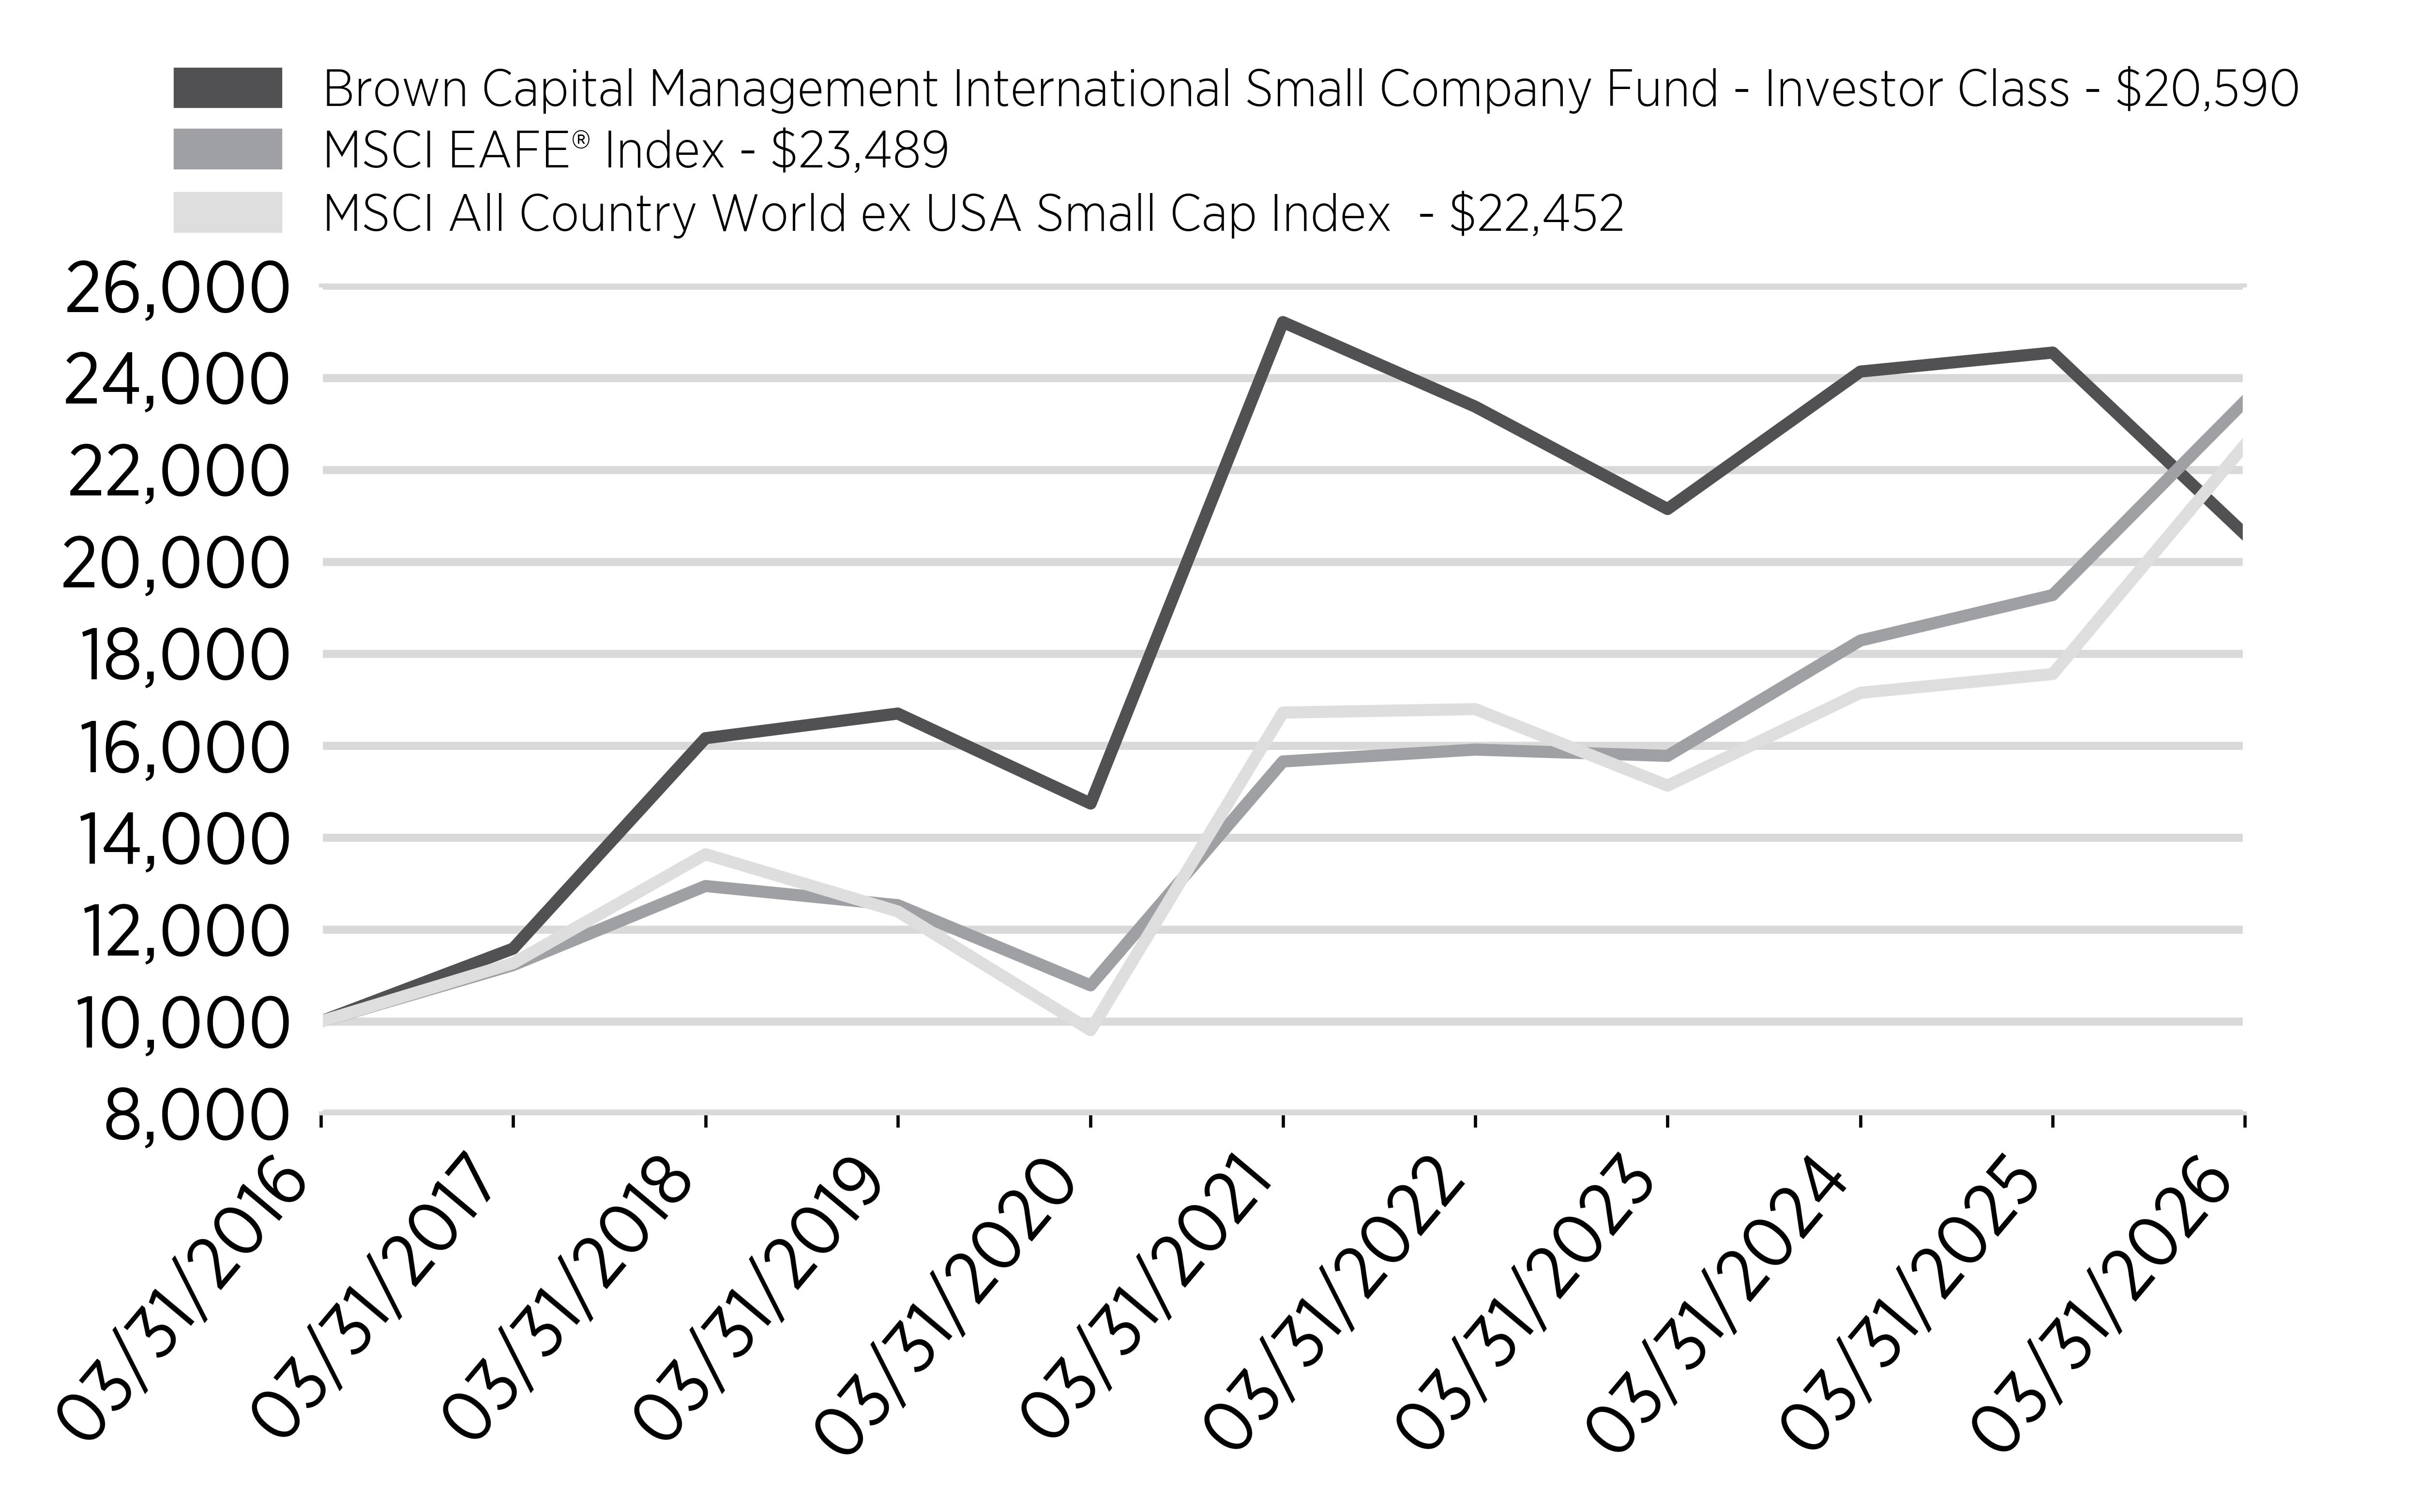
The Brown Capital Management International Small Company Fund Investor Class Shares (the “Fund”) returned -16.11% for the fiscal year ended March 31, 2026, compared with +21.88% for the MSCI EAFE® Index and +28.41% for the MSCI All Country World ex USA Small Cap Index. These disappointing results reflect our most challenging period of relative underperformance since the Fund’s inception in 2015.
At the core of our underperformance was a disconnect between company fundamentals and stock price behavior. Across much of the portfolio, our holdings delivered solid operational results, including double-digit revenue growth, strong profitability and continued market share gains. However, stock prices declined as investor sentiment shifted away from growth equities and toward more cyclical sectors.
The market’s reaction to artificial intelligence (AI) was a major driver of this dynamic. Companies tied to AI infrastructure performed strongly, while many software, platform and data-driven businesses experienced significant valuation compression. We estimate that 17 holdings in the portfolio that are exposed to this AI derating are trading at a 75% discount to their 10-year historical average on a free cash flow basis, as of March 31, 2026. In our view, many of these companies are well positioned to benefit from AI, given their proprietary data, embedded workflows and system-of-record characteristics.
Top contributors to return included Camtek and CyberArk. Camtek benefited from strong demand in semiconductor applications tied to AI, while CyberArk’s performance was driven by both solid fundamentals and its acquisition at a premium valuation. Among the largest detractors were Hemnet and VusionGroup on concerns of fundamental weakness.
During the year, we added several new holdings, including Hub24 and Cellebrite, broadening the portfolio’s exposure to financial technology and digital intelligence. We also exited positions such as YouGov and M3 following a reassessment of their long-term prospects.
Cumulative Performance
(based on a hypothetical $10,000 investment)
Annual Performance
Average Annual Total Return
|
|
1
Year |
5
Years |
10
Years |
|---|---|---|---|
|
Brown
Capital Management International
Small
Company Fund - Investor Class |
-16.11% |
-3.97% |
7.49% |
|
MSCI
EAFE® Index |
21.88% |
8.46% |
8.91% |
|
MSCI
All Country World ex USA
Small
Cap Index |
28.41% |
6.16% |
8.47% |
Key Fund Statistics
(as of March 31, 2026)
|
Fund
Net Assets |
$1,264,877,658 |
|
Number
of Holdings |
37 |
|
Total
Net Advisory Fee |
$20,450,704 |
|
Portfolio
Turnover Rate |
16% |
Sector Breakdown
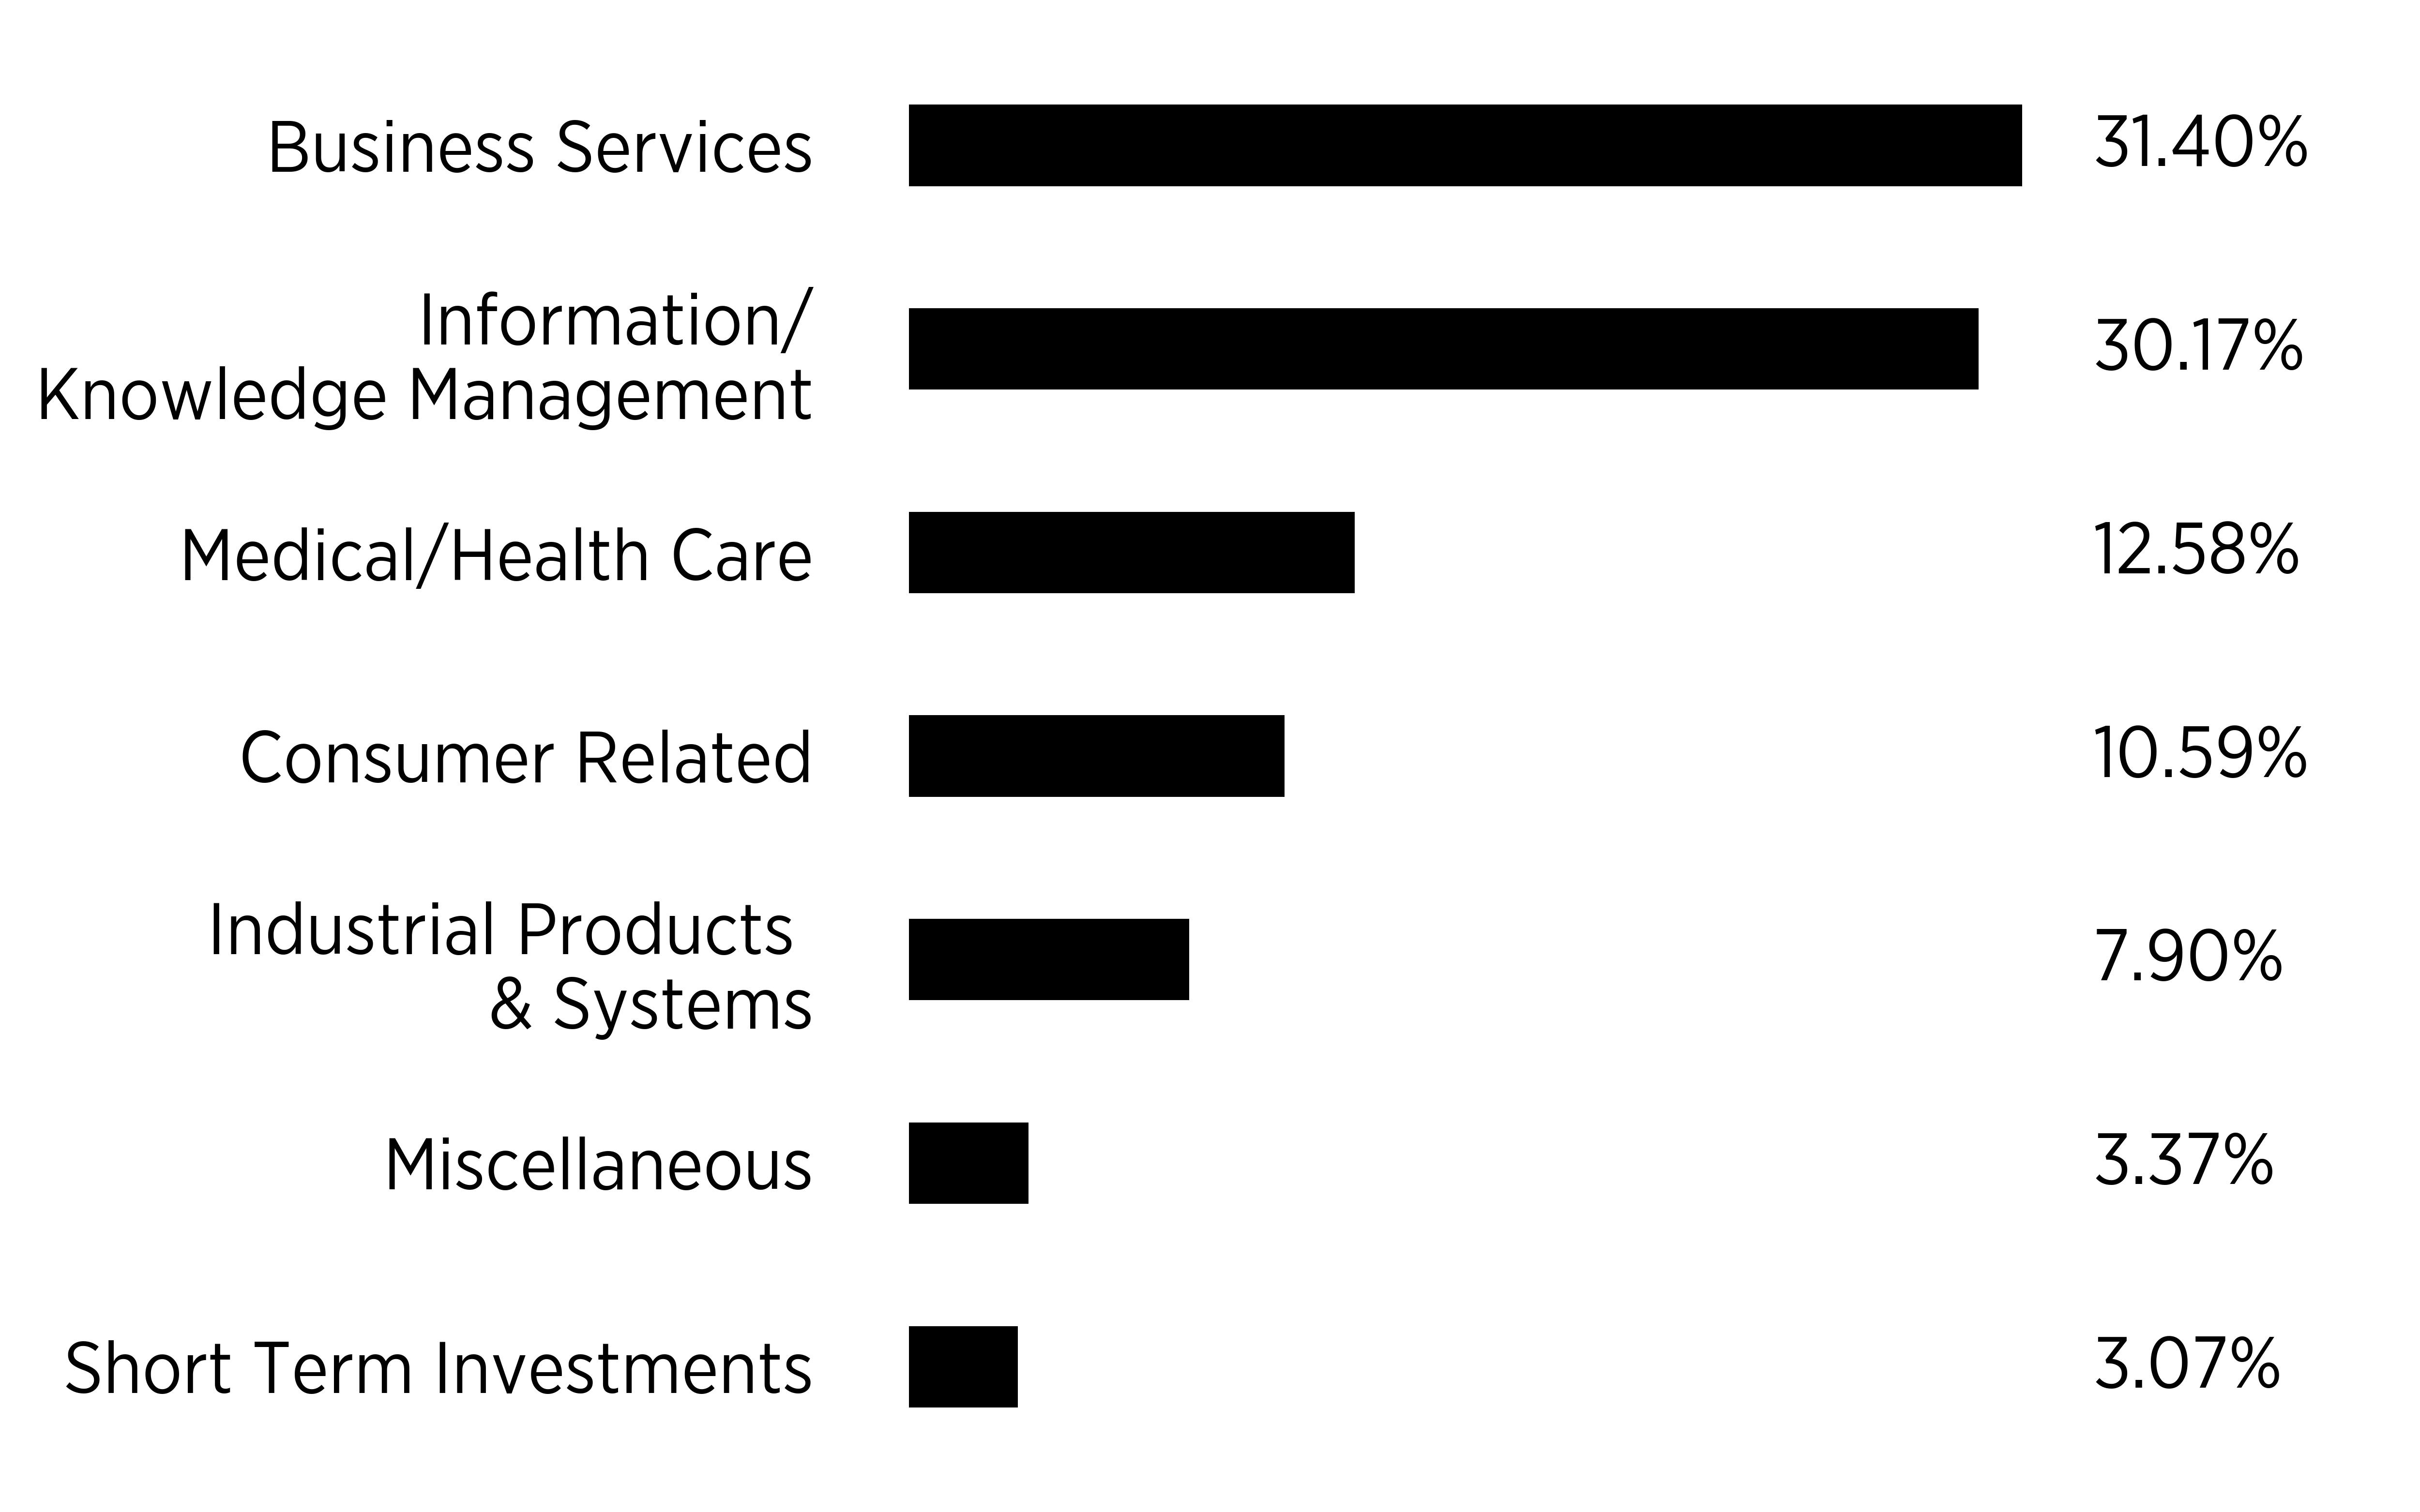
|
Top
10 Holdings |
|
|---|---|
|
The
Descartes Systems Group, Inc. |
|
|
Kinaxis,
Inc. |
|
|
REA
Group Ltd. |
|
|
Interparfums
SA |
|
|
Sectra
AB |
|
|
AJ
Bell plc |
|
|
Towa
Pharmaceutical Co. Ltd. |
|
|
Hiday
Hidaka Corp. |
|
|
Camtek
Ltd. |
|
|
Ambu
A/S |
Material Changes
Large Redemptions
Subsequent to March 31, 2026, the Fund experienced shareholder redemptions exceeding 25% of the Fund’s Net Assets as of March 31, 2026.
What were the Fund costs for the period?
(based on a hypothetical $10,000 investment)
|
Class
Name |
Costs
of a $10,000 investment |
Costs
paid as a percentage of a $10,000 investment |
|---|---|---|
|
Institutional
Class |
$98 |
1.07% |
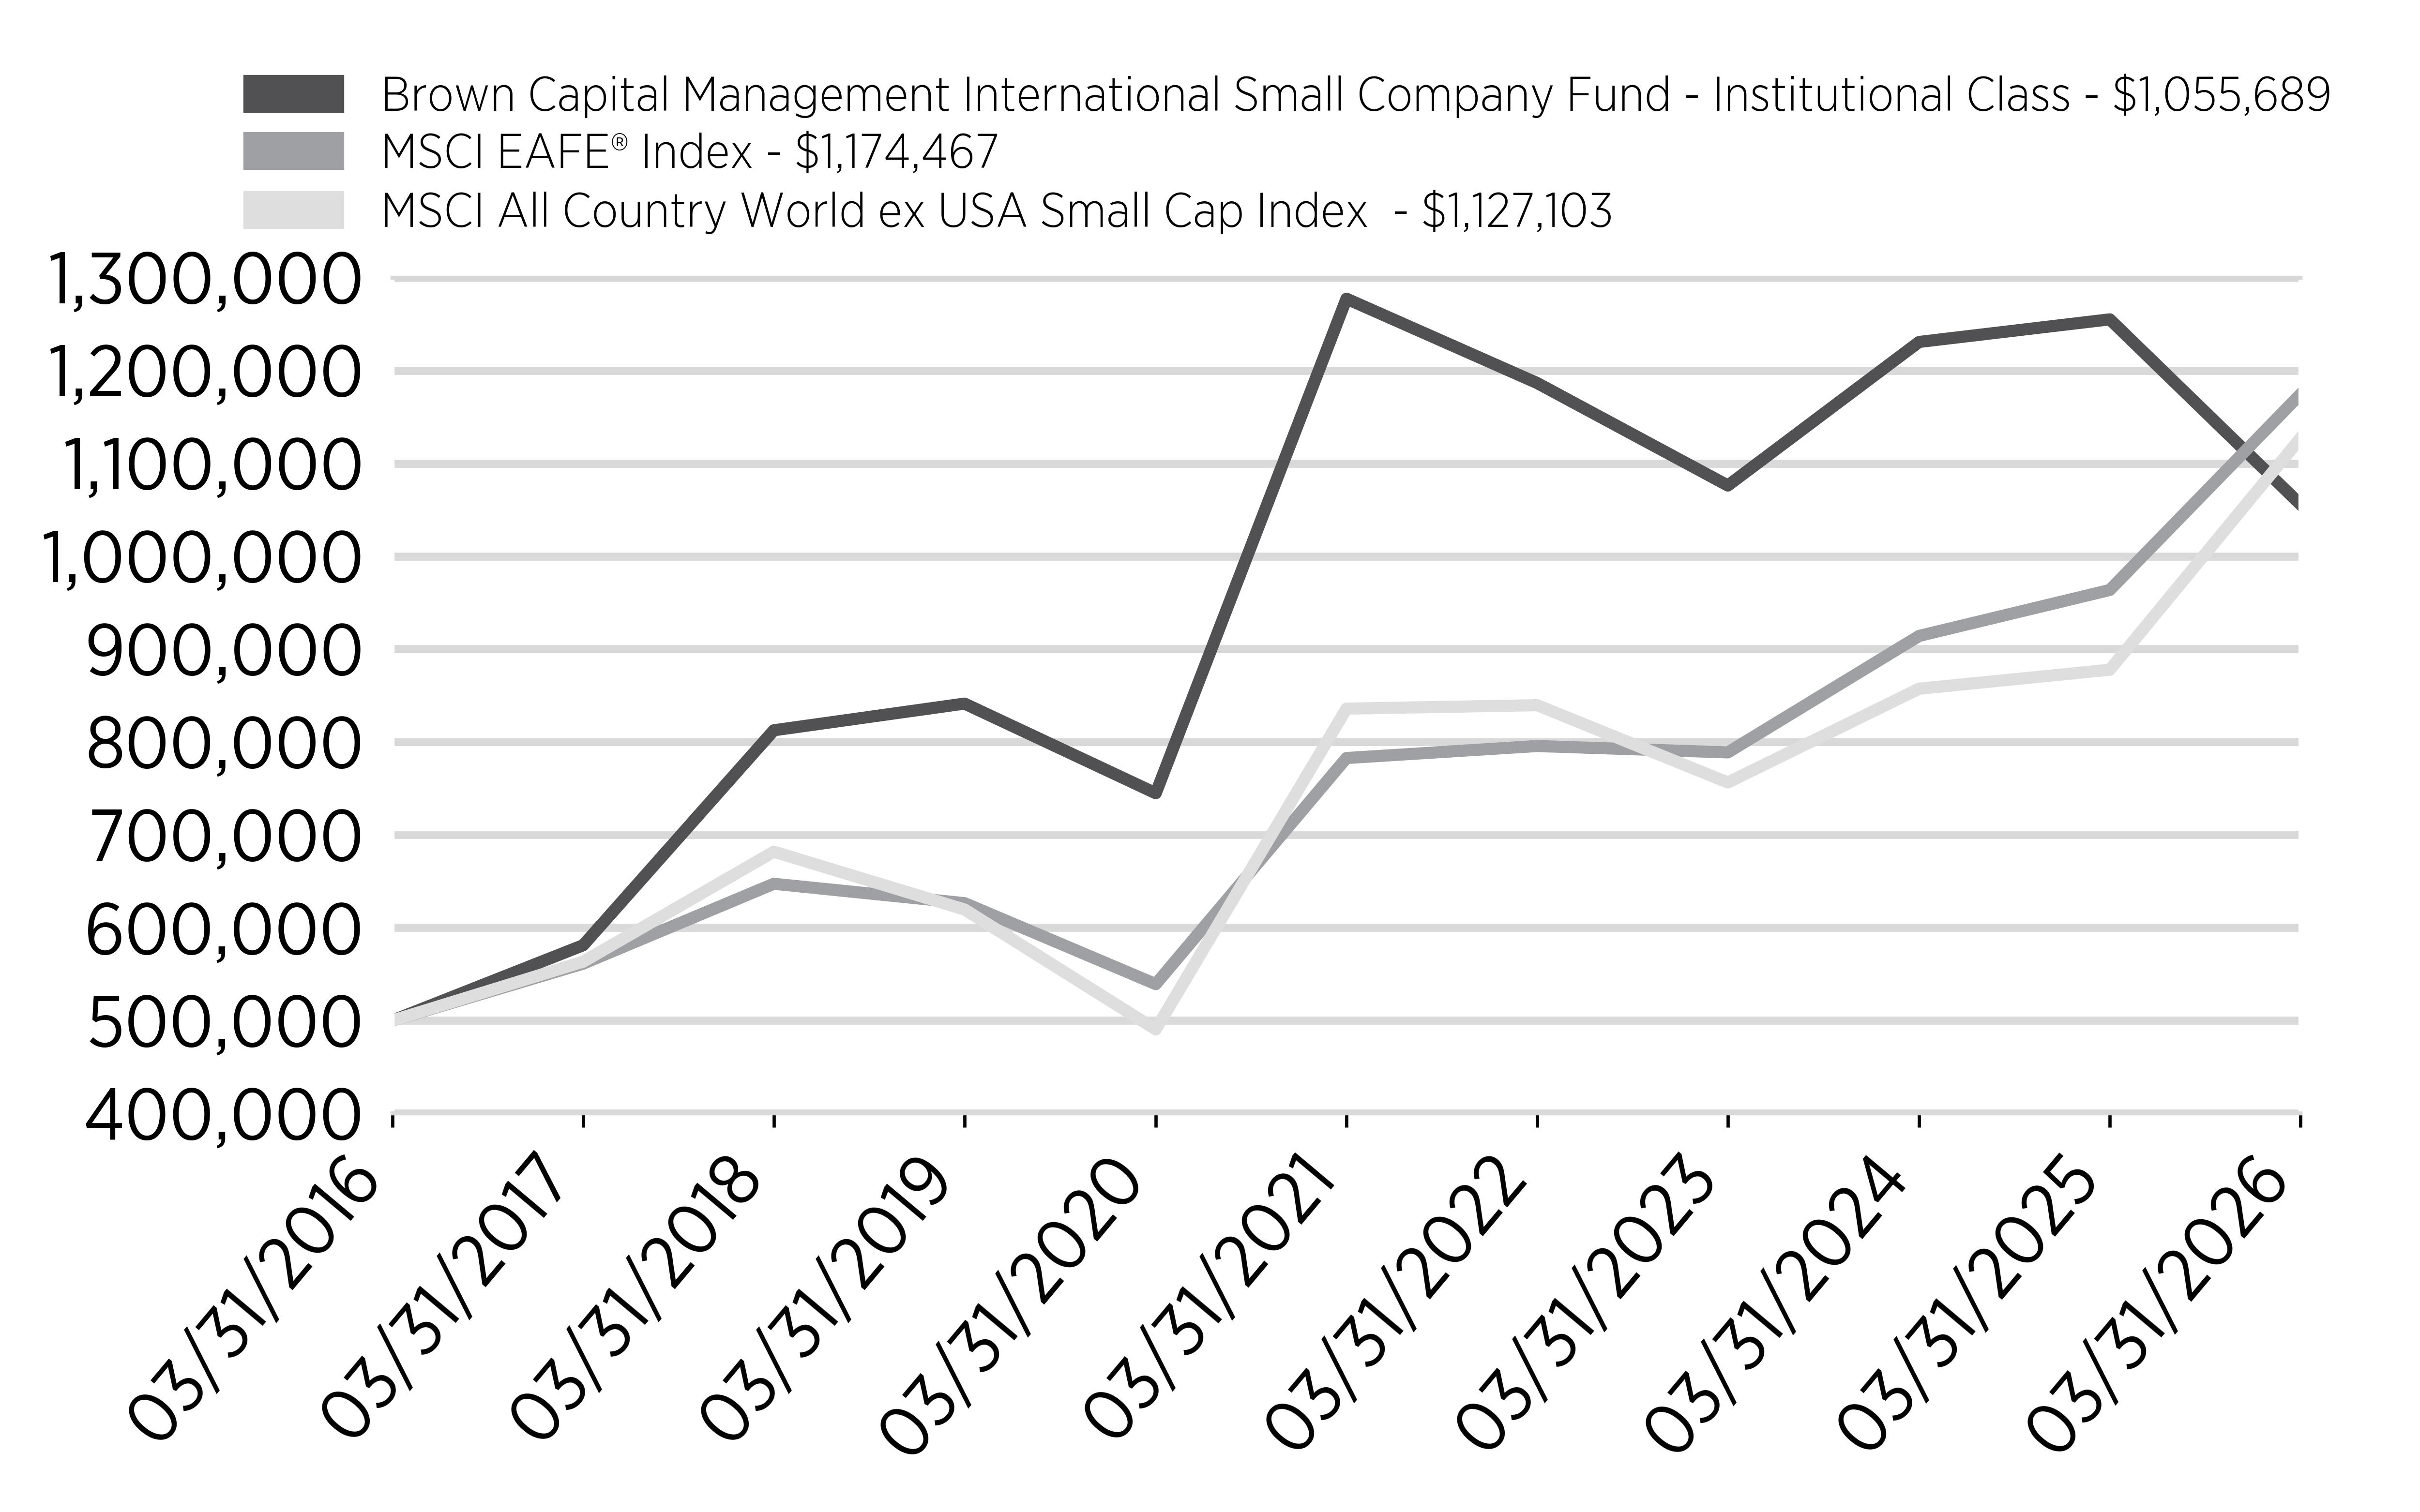
How did the Fund Perform?
The Brown Capital Management International Small Company Institutional Class Shares (the “Fund”) returned -15.88% for the fiscal year ended March 31, 2026, compared with +21.88% for the MSCI EAFE® Index and +28.41% for the MSCI All Country World ex USA Small Cap Index. These disappointing results reflect our most challenging period of relative underperformance since the Fund’s inception in 2015.
At the core of our underperformance was a disconnect between company fundamentals and stock price behavior. Across much of the portfolio, our holdings delivered solid operational results, including double-digit revenue growth, strong profitability and continued market share gains. However, stock prices declined as investor sentiment shifted away from growth equities and toward more cyclical sectors.
The market’s reaction to artificial intelligence (AI) was a major driver of this dynamic. Companies tied to AI infrastructure performed strongly, while many software, platform and data-driven businesses experienced significant valuation compression. We estimate that 17 holdings in the portfolio that are exposed to this AI derating are trading at a 75% discount to their 10-year historical average on a free cash flow basis, as of March 31, 2026. In our view, many of these companies are well positioned to benefit from AI, given their proprietary data, embedded workflows and system-of-record characteristics.
Top contributors to return included Camtek and CyberArk. Camtek benefited from strong demand in semiconductor applications tied to AI, while CyberArk’s performance was driven by both solid fundamentals and its acquisition at a premium valuation. Among the largest detractors were Hemnet and VusionGroup on concerns of fundamental weakness.
During the year, we added several new holdings, including Hub24 and Cellebrite, broadening the portfolio’s exposure to financial technology and digital intelligence. We also exited positions such as YouGov and M3 following a reassessment of their long-term prospects.
Cumulative Performance
(based on a hypothetical $500,000 investment)
Annual Performance
Average Annual Total Return
|
|
1
Year |
5
Years |
10
Years |
|---|---|---|---|
|
Brown
Capital Management International
Small
Company Fund - Institutional Class |
-15.88% |
-3.74% |
7.76% |
|
MSCI
EAFE® Index |
21.88% |
8.46% |
8.91% |
|
MSCI
All Country World ex USA
Small
Cap Index |
28.41% |
6.16% |
8.47% |
Key Fund Statistics
(as of March 31, 2026)
|
Fund
Net Assets |
$1,264,877,658 |
|
Number
of Holdings |
37 |
|
Total
Net Advisory Fee |
$20,450,704 |
|
Portfolio
Turnover Rate |
16% |
Sector Breakdown
|
Top
10 Holdings |
|
|---|---|
|
The
Descartes Systems Group, Inc. |
|
|
Kinaxis,
Inc. |
|
|
REA
Group Ltd. |
|
|
Interparfums
SA |
|
|
Sectra
AB |
|
|
AJ
Bell plc |
|
|
Towa
Pharmaceutical Co. Ltd. |
|
|
Hiday
Hidaka Corp. |
|
|
Camtek
Ltd. |
|
|
Ambu
A/S |
Material Changes
Large Redemptions
Subsequent to March 31, 2026, the Fund experienced shareholder redemptions exceeding 25% of the Fund’s Net Assets as of March 31, 2026.