Shareholder Report
|
6 Months Ended |
|
Mar. 31, 2026
USD ($)
Holding
|
|---|
| Shareholder Report [Line Items] |
|
| Document Type |
N-CSRS
|
| Amendment Flag |
false
|
| Registrant Name |
SEI INSTITUTIONAL INTERNATIONAL TRUST
|
| Entity Central Index Key |
0000835597
|
| Entity Investment Company Type |
N-1A
|
| Document Period End Date |
Mar. 31, 2026
|
| C000017607 |
|
| Shareholder Report [Line Items] |
|
| Fund Name |
International Equity Fund
|
| Class Name |
Class F
|
| Trading Symbol |
SEITX
|
| Annual or Semi-Annual Statement [Text Block] |
Semi-Annual Shareholder Report
|
| Shareholder Report Annual or Semi-Annual |
semi-annual shareholder report
|
| Additional Information [Text Block] |
This semi-annual shareholder report contains important information about Class F Shares of the International Equity Fund (the "Fund") for the period from October 1, 2025 to March 31, 2026. You can find additional information about the Fund at https://www.seic.com/mutual-fund-documentation/prospectuses-and-reports. You can also request this information by contacting us at 610-676-1000.
|
| Additional Information Phone Number |
610-676-1000
|
| Additional Information Website |
https://www.seic.com/mutual-fund-documentation/prospectuses-and-reports
|
| Expenses [Text Block] |
What were the Fund costs for the last six months?(based on a hypothetical $10,000 investment) Table SummaryFund Name | Costs of a $10,000 investment | Costs paid as a percentage of a $10,000 investment |
|---|
International Equity Fund, Class F Shares | $55 | 1.07% |
|---|
|
| Expenses Paid, Amount |
$ 55
|
| Expense Ratio, Percent |
1.07%
|
| AssetsNet |
$ 3,471,188,000
|
| Holdings Count | Holding |
1,008
|
| Advisory Fees Paid, Amount |
$ 9,211
|
| InvestmentCompanyPortfolioTurnover |
36.00%
|
| Additional Fund Statistics [Text Block] |
Key Fund Statistics as of March 31, 2026Table Summary | Total Net Assets (000's) | Number of Holdings | Total Advisory Fees Paid (000's) | Portfolio Turnover Rate |
|---|
| $3,471,188 | 1,008 | $9,211 | 36% |
|---|
|
| Holdings [Text Block] |
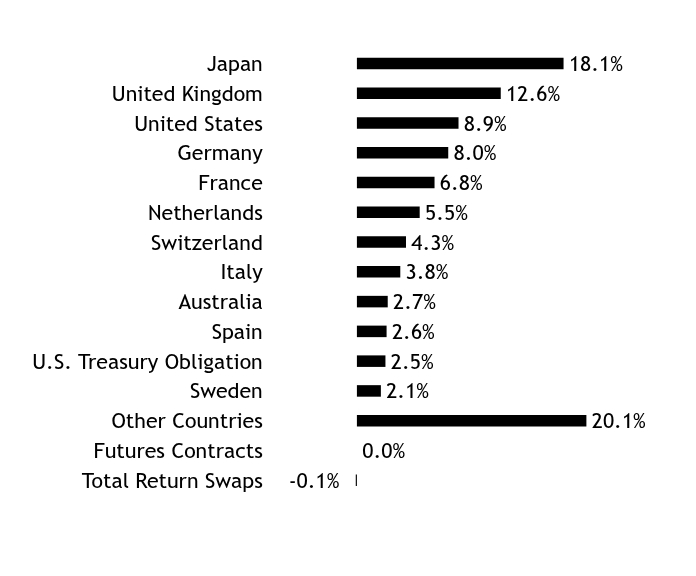
Asset/Country WeightingsFootnote Reference*Table SummaryValue | Value |
|---|
Total Return Swaps | -0.1% | Futures Contracts | 0.0% | Other Countries | 20.1% | Sweden | 2.1% | U.S. Treasury Obligation | 2.5% | Spain | 2.6% | Australia | 2.7% | Italy | 3.8% | Switzerland | 4.3% | Netherlands | 5.5% | France | 6.8% | Germany | 8.0% | United States | 8.9% | United Kingdom | 12.6% | Japan | 18.1% | | Footnote | Description | Footnote* | Percentages are calculated based on total net assets. |
|
| Largest Holdings [Text Block] |
Table SummaryHolding Name | | | Percentage of
Total Net AssetsFootnote Reference(A) |
|---|
U.S. Treasury Bill, 3.59%, 8/27/2026 | | | 2.5% | Novartis AG | | | 1.7% | Roche Holding AG | | | 1.4% | HSBC Holdings PLC | | | 1.3% | Equinor ASA | | | 1.1% | GSK PLC | | | 1.1% | ING Groep NV | | | 1.0% | Sanofi SA | | | 0.8% | BASF SE | | | 0.8% | Daimler Truck Holding AG | | | 0.8% | | Footnote | Description | Footnote(A) | Cash Equivalents are not shown in the top ten chart. |
|
| C000017606 |
|
| Shareholder Report [Line Items] |
|
| Fund Name |
International Equity Fund
|
| Class Name |
Class I
|
| Trading Symbol |
SEEIX
|
| Annual or Semi-Annual Statement [Text Block] |
Semi-Annual Shareholder Report
|
| Shareholder Report Annual or Semi-Annual |
semi-annual shareholder report
|
| Additional Information [Text Block] |
This semi-annual shareholder report contains important information about Class I Shares of the International Equity Fund (the "Fund") for the period from October 1, 2025 to March 31, 2026. You can find additional information about the Fund at https://www.seic.com/mutual-fund-documentation/prospectuses-and-reports. You can also request this information by contacting us at 610-676-1000.
|
| Additional Information Phone Number |
610-676-1000
|
| Additional Information Website |
https://www.seic.com/mutual-fund-documentation/prospectuses-and-reports
|
| Expenses [Text Block] |
What were the Fund costs for the last six months?(based on a hypothetical $10,000 investment) Table SummaryFund Name | Costs of a $10,000 investment | Costs paid as a percentage of a $10,000 investment |
|---|
International Equity Fund, Class I Shares | $68 | 1.32% |
|---|
|
| Expenses Paid, Amount |
$ 68
|
| Expense Ratio, Percent |
1.32%
|
| AssetsNet |
$ 3,471,188,000
|
| Holdings Count | Holding |
1,008
|
| Advisory Fees Paid, Amount |
$ 9,211
|
| InvestmentCompanyPortfolioTurnover |
36.00%
|
| Additional Fund Statistics [Text Block] |
Key Fund Statistics as of March 31, 2026Table Summary | Total Net Assets (000's) | Number of Holdings | Total Advisory Fees Paid (000's) | Portfolio Turnover Rate |
|---|
| $3,471,188 | 1,008 | $9,211 | 36% |
|---|
|
| Holdings [Text Block] |
Asset/Country WeightingsFootnote Reference*Table SummaryValue | Value |
|---|
Total Return Swaps | -0.1% | Futures Contracts | 0.0% | Other Countries | 20.1% | Sweden | 2.1% | U.S. Treasury Obligation | 2.5% | Spain | 2.6% | Australia | 2.7% | Italy | 3.8% | Switzerland | 4.3% | Netherlands | 5.5% | France | 6.8% | Germany | 8.0% | United States | 8.9% | United Kingdom | 12.6% | Japan | 18.1% | | Footnote | Description | Footnote* | Percentages are calculated based on total net assets. |
|
| Largest Holdings [Text Block] |
Table SummaryHolding Name | | | Percentage of
Total Net AssetsFootnote Reference(A) |
|---|
U.S. Treasury Bill, 3.59%, 8/27/2026 | | | 2.5% | Novartis AG | | | 1.7% | Roche Holding AG | | | 1.4% | HSBC Holdings PLC | | | 1.3% | Equinor ASA | | | 1.1% | GSK PLC | | | 1.1% | ING Groep NV | | | 1.0% | Sanofi SA | | | 0.8% | BASF SE | | | 0.8% | Daimler Truck Holding AG | | | 0.8% | | Footnote | Description | Footnote(A) | Cash Equivalents are not shown in the top ten chart. |
|
| C000147407 |
|
| Shareholder Report [Line Items] |
|
| Fund Name |
International Equity Fund
|
| Class Name |
Class Y
|
| Trading Symbol |
SEFCX
|
| Annual or Semi-Annual Statement [Text Block] |
Semi-Annual Shareholder Report
|
| Shareholder Report Annual or Semi-Annual |
semi-annual shareholder report
|
| Additional Information [Text Block] |
This semi-annual shareholder report contains important information about Class Y Shares of the International Equity Fund (the "Fund") for the period from October 1, 2025 to March 31, 2026. You can find additional information about the Fund at https://www.seic.com/mutual-fund-documentation/prospectuses-and-reports. You can also request this information by contacting us at 610-676-1000.
|
| Additional Information Phone Number |
610-676-1000
|
| Additional Information Website |
https://www.seic.com/mutual-fund-documentation/prospectuses-and-reports
|
| Expenses [Text Block] |
What were the Fund costs for the last six months?(based on a hypothetical $10,000 investment) Table SummaryFund Name | Costs of a $10,000 investment | Costs paid as a percentage of a $10,000 investment |
|---|
International Equity Fund, Class Y Shares | $43 | 0.83% |
|---|
|
| Expenses Paid, Amount |
$ 43
|
| Expense Ratio, Percent |
0.83%
|
| AssetsNet |
$ 3,471,188,000
|
| Holdings Count | Holding |
1,008
|
| Advisory Fees Paid, Amount |
$ 9,211
|
| InvestmentCompanyPortfolioTurnover |
36.00%
|
| Additional Fund Statistics [Text Block] |
Key Fund Statistics as of March 31, 2026Table Summary | Total Net Assets (000's) | Number of Holdings | Total Advisory Fees Paid (000's) | Portfolio Turnover Rate |
|---|
| $3,471,188 | 1,008 | $9,211 | 36% |
|---|
|
| Holdings [Text Block] |
Asset/Country WeightingsFootnote Reference*Table SummaryValue | Value |
|---|
Total Return Swaps | -0.1% | Futures Contracts | 0.0% | Other Countries | 20.1% | Sweden | 2.1% | U.S. Treasury Obligation | 2.5% | Spain | 2.6% | Australia | 2.7% | Italy | 3.8% | Switzerland | 4.3% | Netherlands | 5.5% | France | 6.8% | Germany | 8.0% | United States | 8.9% | United Kingdom | 12.6% | Japan | 18.1% | | Footnote | Description | Footnote* | Percentages are calculated based on total net assets. |
|
| Largest Holdings [Text Block] |
Table SummaryHolding Name | | | Percentage of
Total Net AssetsFootnote Reference(A) |
|---|
U.S. Treasury Bill, 3.59%, 8/27/2026 | | | 2.5% | Novartis AG | | | 1.7% | Roche Holding AG | | | 1.4% | HSBC Holdings PLC | | | 1.3% | Equinor ASA | | | 1.1% | GSK PLC | | | 1.1% | ING Groep NV | | | 1.0% | Sanofi SA | | | 0.8% | BASF SE | | | 0.8% | Daimler Truck Holding AG | | | 0.8% | | Footnote | Description | Footnote(A) | Cash Equivalents are not shown in the top ten chart. |
|
| C000017609 |
|
| Shareholder Report [Line Items] |
|
| Fund Name |
Emerging Markets Equity Fund
|
| Class Name |
Class F
|
| Trading Symbol |
SIEMX
|
| Annual or Semi-Annual Statement [Text Block] |
Semi-Annual Shareholder Report
|
| Shareholder Report Annual or Semi-Annual |
semi-annual shareholder report
|
| Additional Information [Text Block] |
This semi-annual shareholder report contains important information about Class F Shares of the Emerging Markets Equity Fund (the "Fund") for the period from October 1, 2025 to March 31, 2026. You can find additional information about the Fund at https://www.seic.com/mutual-fund-documentation/prospectuses-and-reports. You can also request this information by contacting us at 610-676-1000.
|
| Additional Information Phone Number |
610-676-1000
|
| Additional Information Website |
https://www.seic.com/mutual-fund-documentation/prospectuses-and-reports
|
| Expenses [Text Block] |
What were the Fund costs for the last six months?(based on a hypothetical $10,000 investment) Table SummaryFund Name | Costs of a $10,000 investment | Costs paid as a percentage of a $10,000 investment |
|---|
Emerging Markets Equity Fund, Class F Shares | $62 | 1.20% |
|---|
|
| Expenses Paid, Amount |
$ 62
|
| Expense Ratio, Percent |
1.20%
|
| AssetsNet |
$ 1,543,748,000
|
| Holdings Count | Holding |
462
|
| Advisory Fees Paid, Amount |
$ 5,636
|
| InvestmentCompanyPortfolioTurnover |
37.00%
|
| Additional Fund Statistics [Text Block] |
Key Fund Statistics as of March 31, 2026Table Summary | Total Net Assets (000's) | Number of Holdings | Total Advisory Fees Paid (000's) | Portfolio Turnover Rate |
|---|
| $1,543,748 | 462 | $5,636 | 37% |
|---|
|
| Holdings [Text Block] |
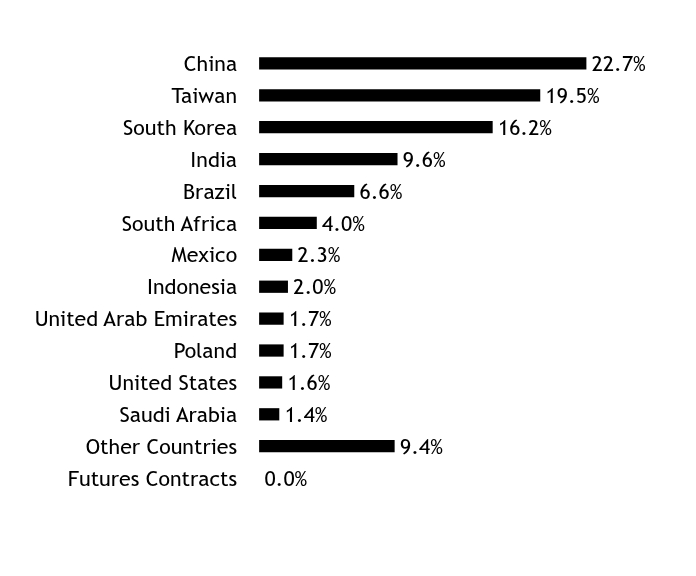
Asset/Country WeightingsFootnote Reference*Table SummaryValue | Value |
|---|
Futures Contracts | 0.0% | Other Countries | 9.4% | Saudi Arabia | 1.4% | United States | 1.6% | Poland | 1.7% | United Arab Emirates | 1.7% | Indonesia | 2.0% | Mexico | 2.3% | South Africa | 4.0% | Brazil | 6.6% | India | 9.6% | South Korea | 16.2% | Taiwan | 19.5% | China | 22.7% | | Footnote | Description | Footnote* | Percentages are calculated based on total net assets. |
|
| Largest Holdings [Text Block] |
Table SummaryHolding Name | | | Percentage of
Total Net AssetsFootnote Reference(A) |
|---|
Taiwan Semiconductor Manufacturing Co Ltd | | | 9.9% | Samsung Electronics Co Ltd | | | 4.5% | Tencent Holdings Ltd | | | 3.0% | SK hynix Inc | | | 2.4% | Alibaba Group Holding Ltd | | | 2.2% | Taiwan Semiconductor Manufacturing Co Ltd ADR | | | 1.5% | Samsung Electronics Co Ltd, Preference | | | 1.5% | Naspers Ltd, Cl N | | | 1.1% | Delta Electronics Inc | | | 1.0% | Grupo Financiero Banorte SAB de CV, Cl O | | | 1.0% | | Footnote | Description | Footnote(A) | Cash Equivalents are not shown in the top ten chart. |
|
| C000147409 |
|
| Shareholder Report [Line Items] |
|
| Fund Name |
Emerging Markets Equity Fund
|
| Class Name |
Class Y
|
| Trading Symbol |
SEQFX
|
| Annual or Semi-Annual Statement [Text Block] |
Semi-Annual Shareholder Report
|
| Shareholder Report Annual or Semi-Annual |
semi-annual shareholder report
|
| Additional Information [Text Block] |
This semi-annual shareholder report contains important information about Class Y Shares of the Emerging Markets Equity Fund (the "Fund") for the period from October 1, 2025 to March 31, 2026. You can find additional information about the Fund at https://www.seic.com/mutual-fund-documentation/prospectuses-and-reports. You can also request this information by contacting us at 610-676-1000.
|
| Additional Information Phone Number |
610-676-1000
|
| Additional Information Website |
https://www.seic.com/mutual-fund-documentation/prospectuses-and-reports
|
| Expenses [Text Block] |
What were the Fund costs for the last six months?(based on a hypothetical $10,000 investment) Table SummaryFund Name | Costs of a $10,000 investment | Costs paid as a percentage of a $10,000 investment |
|---|
Emerging Markets Equity Fund, Class Y Shares | $50 | 0.95% |
|---|
|
| Expenses Paid, Amount |
$ 50
|
| Expense Ratio, Percent |
0.95%
|
| AssetsNet |
$ 1,543,748,000
|
| Holdings Count | Holding |
462
|
| Advisory Fees Paid, Amount |
$ 5,636
|
| InvestmentCompanyPortfolioTurnover |
37.00%
|
| Additional Fund Statistics [Text Block] |
Key Fund Statistics as of March 31, 2026Table Summary | Total Net Assets (000's) | Number of Holdings | Total Advisory Fees Paid (000's) | Portfolio Turnover Rate |
|---|
| $1,543,748 | 462 | $5,636 | 37% |
|---|
|
| Holdings [Text Block] |
Asset/Country WeightingsFootnote Reference*Table SummaryValue | Value |
|---|
Futures Contracts | 0.0% | Other Countries | 9.4% | Saudi Arabia | 1.4% | United States | 1.6% | Poland | 1.7% | United Arab Emirates | 1.7% | Indonesia | 2.0% | Mexico | 2.3% | South Africa | 4.0% | Brazil | 6.6% | India | 9.6% | South Korea | 16.2% | Taiwan | 19.5% | China | 22.7% | | Footnote | Description | Footnote* | Percentages are calculated based on total net assets. |
|
| Largest Holdings [Text Block] |
Table SummaryHolding Name | | | Percentage of
Total Net AssetsFootnote Reference(A) |
|---|
Taiwan Semiconductor Manufacturing Co Ltd | | | 9.9% | Samsung Electronics Co Ltd | | | 4.5% | Tencent Holdings Ltd | | | 3.0% | SK hynix Inc | | | 2.4% | Alibaba Group Holding Ltd | | | 2.2% | Taiwan Semiconductor Manufacturing Co Ltd ADR | | | 1.5% | Samsung Electronics Co Ltd, Preference | | | 1.5% | Naspers Ltd, Cl N | | | 1.1% | Delta Electronics Inc | | | 1.0% | Grupo Financiero Banorte SAB de CV, Cl O | | | 1.0% | | Footnote | Description | Footnote(A) | Cash Equivalents are not shown in the top ten chart. |
|
| C000017608 |
|
| Shareholder Report [Line Items] |
|
| Fund Name |
International Fixed Income Fund
|
| Class Name |
Class F
|
| Trading Symbol |
SEFIX
|
| Annual or Semi-Annual Statement [Text Block] |
Semi-Annual Shareholder Report
|
| Shareholder Report Annual or Semi-Annual |
semi-annual shareholder report
|
| Additional Information [Text Block] |
This semi-annual shareholder report contains important information about Class F Shares of the International Fixed Income Fund (the "Fund") for the period from October 1, 2025 to March 31, 2026. You can find additional information about the Fund at https://www.seic.com/mutual-fund-documentation/prospectuses-and-reports. You can also request this information by contacting us at 610-676-1000.
|
| Additional Information Phone Number |
610-676-1000
|
| Additional Information Website |
https://www.seic.com/mutual-fund-documentation/prospectuses-and-reports
|
| Expenses [Text Block] |
What were the Fund costs for the last six months?(based on a hypothetical $10,000 investment) Table SummaryFund Name | Costs of a $10,000 investment | Costs paid as a percentage of a $10,000 investment |
|---|
International Fixed Income Fund, Class F Shares | $48 | 0.96% |
|---|
|
| Expenses Paid, Amount |
$ 48
|
| Expense Ratio, Percent |
0.96%
|
| AssetsNet |
$ 388,452,000
|
| Holdings Count | Holding |
565
|
| Advisory Fees Paid, Amount |
$ 574
|
| InvestmentCompanyPortfolioTurnover |
110.00%
|
| Additional Fund Statistics [Text Block] |
Key Fund Statistics as of March 31, 2026Table Summary | Total Net Assets (000's) | Number of Holdings | Total Advisory Fees Paid (000's) | Portfolio Turnover Rate |
|---|
| $388,452 | 565 | $574 | 110% |
|---|
|
| Holdings [Text Block] |
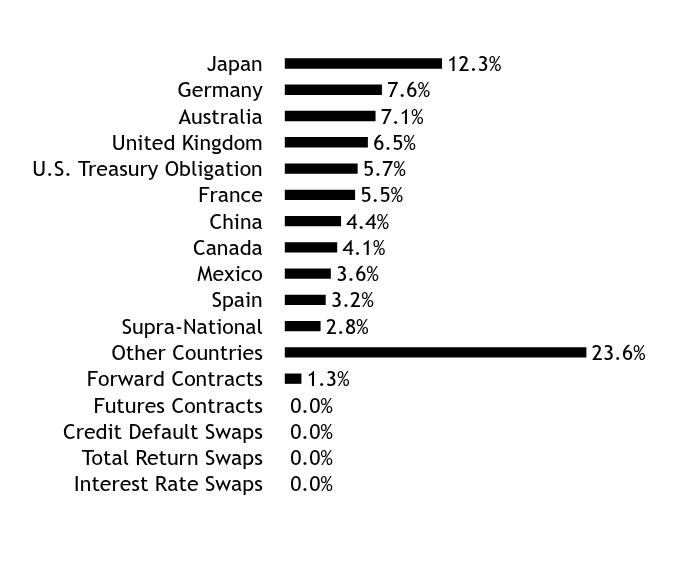
Asset/Country WeightingsFootnote Reference*Table SummaryValue | Value |
|---|
Interest Rate Swaps | 0.0% | Total Return Swaps | 0.0% | Credit Default Swaps | 0.0% | Futures Contracts | 0.0% | Forward Contracts | 1.3% | Other Countries | 23.6% | Supra-National | 2.8% | Spain | 3.2% | Mexico | 3.6% | Canada | 4.1% | China | 4.4% | France | 5.5% | U.S. Treasury Obligation | 5.7% | United Kingdom | 6.5% | Australia | 7.1% | Germany | 7.6% | Japan | 12.3% | | Footnote | Description | Footnote* | Percentages are calculated based on total net assets. |
|
| Largest Holdings [Text Block] |
Table SummaryHolding Name | Coupon Rate | Maturity Date | Percentage of Total
Net AssetsFootnote Reference(A) |
|---|
Japan Government Thirty Year Bond | 2.300%
| 03/20/40
| 3.8% | French Republic Government Bond | 3.500%
| 11/25/33
| 3.6% | German Federal Government Bond | 2.600%
| 05/15/41
| 3.0% | United Kingdom Gilt | 4.750%
| 10/22/35
| 3.0% | Spanish Government Bond | 3.000%
| 01/31/33
| 2.6% | U.S. Treasury Note | 4.500%
| 02/15/44
| 2.3% | Japan Government Two Year Bond | 0.800%
| 03/01/27
| 1.8% | U.S. Treasury Note | 3.750%
| 04/30/27
| 1.7% | U.S. Treasury Note | 2.250%
| 11/15/27
| 1.7% | Province of British Columbia Canada | 4.000%
| 06/18/35
| 1.6% | | Footnote | Description | Footnote(A) | Short-Term Investments are not shown in the top ten chart. |
|
| C000147408 |
|
| Shareholder Report [Line Items] |
|
| Fund Name |
International Fixed Income Fund
|
| Class Name |
Class Y
|
| Trading Symbol |
SIFIX
|
| Annual or Semi-Annual Statement [Text Block] |
Semi-Annual Shareholder Report
|
| Shareholder Report Annual or Semi-Annual |
semi-annual shareholder report
|
| Additional Information [Text Block] |
This semi-annual shareholder report contains important information about Class Y Shares of the International Fixed Income Fund (the "Fund") for the period from October 1, 2025 to March 31, 2026. You can find additional information about the Fund at https://www.seic.com/mutual-fund-documentation/prospectuses-and-reports. You can also request this information by contacting us at 610-676-1000.
|
| Additional Information Phone Number |
610-676-1000
|
| Additional Information Website |
https://www.seic.com/mutual-fund-documentation/prospectuses-and-reports
|
| Expenses [Text Block] |
What were the Fund costs for the last six months?(based on a hypothetical $10,000 investment) Table SummaryFund Name | Costs of a $10,000 investment | Costs paid as a percentage of a $10,000 investment |
|---|
International Fixed Income Fund, Class Y Shares | $35 | 0.71% |
|---|
|
| Expenses Paid, Amount |
$ 35
|
| Expense Ratio, Percent |
0.71%
|
| AssetsNet |
$ 388,452,000
|
| Holdings Count | Holding |
565
|
| Advisory Fees Paid, Amount |
$ 574
|
| InvestmentCompanyPortfolioTurnover |
110.00%
|
| Additional Fund Statistics [Text Block] |
Key Fund Statistics as of March 31, 2026Table Summary | Total Net Assets (000's) | Number of Holdings | Total Advisory Fees Paid (000's) | Portfolio Turnover Rate |
|---|
| $388,452 | 565 | $574 | 110% |
|---|
|
| Holdings [Text Block] |
Asset/Country WeightingsFootnote Reference*Table SummaryValue | Value |
|---|
Interest Rate Swaps | 0.0% | Total Return Swaps | 0.0% | Credit Default Swaps | 0.0% | Futures Contracts | 0.0% | Forward Contracts | 1.3% | Other Countries | 23.6% | Supra-National | 2.8% | Spain | 3.2% | Mexico | 3.6% | Canada | 4.1% | China | 4.4% | France | 5.5% | U.S. Treasury Obligation | 5.7% | United Kingdom | 6.5% | Australia | 7.1% | Germany | 7.6% | Japan | 12.3% | | Footnote | Description | Footnote* | Percentages are calculated based on total net assets. |
|
| Largest Holdings [Text Block] |
Table SummaryHolding Name | Coupon Rate | Maturity Date | Percentage of Total
Net AssetsFootnote Reference(A) |
|---|
Japan Government Thirty Year Bond | 2.300%
| 03/20/40
| 3.8% | French Republic Government Bond | 3.500%
| 11/25/33
| 3.6% | German Federal Government Bond | 2.600%
| 05/15/41
| 3.0% | United Kingdom Gilt | 4.750%
| 10/22/35
| 3.0% | Spanish Government Bond | 3.000%
| 01/31/33
| 2.6% | U.S. Treasury Note | 4.500%
| 02/15/44
| 2.3% | Japan Government Two Year Bond | 0.800%
| 03/01/27
| 1.8% | U.S. Treasury Note | 3.750%
| 04/30/27
| 1.7% | U.S. Treasury Note | 2.250%
| 11/15/27
| 1.7% | Province of British Columbia Canada | 4.000%
| 06/18/35
| 1.6% | | Footnote | Description | Footnote(A) | Short-Term Investments are not shown in the top ten chart. |
|
| C000017610 |
|
| Shareholder Report [Line Items] |
|
| Fund Name |
Emerging Markets Debt Fund
|
| Class Name |
Class F
|
| Trading Symbol |
SITEX
|
| Annual or Semi-Annual Statement [Text Block] |
Semi-Annual Shareholder Report
|
| Shareholder Report Annual or Semi-Annual |
semi-annual shareholder report
|
| Additional Information [Text Block] |
This semi-annual shareholder report contains important information about Class F Shares of the Emerging Markets Debt Fund (the "Fund") for the period from October 1, 2025 to March 31, 2026. You can find additional information about the Fund at https://www.seic.com/mutual-fund-documentation/prospectuses-and-reports. You can also request this information by contacting us at 610-676-1000.
|
| Additional Information Phone Number |
610-676-1000
|
| Additional Information Website |
https://www.seic.com/mutual-fund-documentation/prospectuses-and-reports
|
| Expenses [Text Block] |
What were the Fund costs for the last six months?(based on a hypothetical $10,000 investment) Table SummaryFund Name | Costs of a $10,000 investment | Costs paid as a percentage of a $10,000 investment |
|---|
Emerging Markets Debt Fund, Class F Shares | $52 | 1.02% |
|---|
|
| Expenses Paid, Amount |
$ 52
|
| Expense Ratio, Percent |
1.02%
|
| AssetsNet |
$ 936,762,000
|
| Holdings Count | Holding |
1,042
|
| Advisory Fees Paid, Amount |
$ 1,767
|
| InvestmentCompanyPortfolioTurnover |
41.00%
|
| Additional Fund Statistics [Text Block] |
Key Fund Statistics as of March 31, 2026Table Summary | Total Net Assets (000's) | Number of Holdings | Total Advisory Fees Paid (000's) | Portfolio Turnover Rate |
|---|
| $936,762 | 1,042 | $1,767 | 41% |
|---|
|
| Holdings [Text Block] |
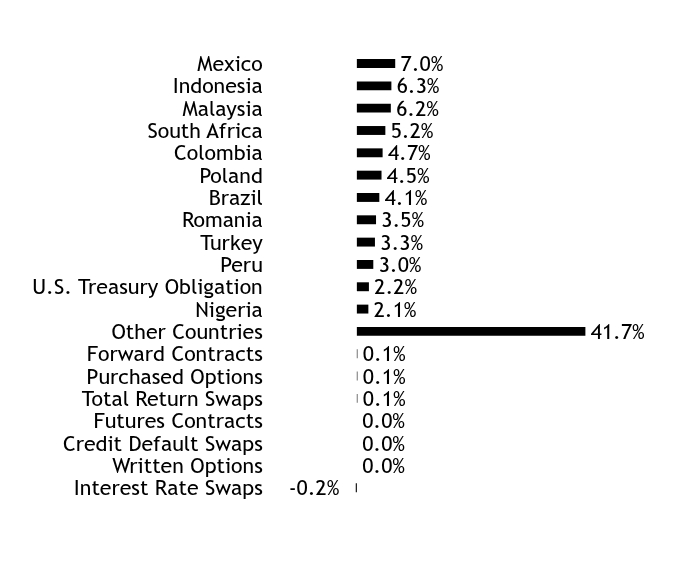
Asset/Country WeightingsFootnote Reference*Table SummaryValue | Value |
|---|
Interest Rate Swaps | -0.2% | Written Options | 0.0% | Credit Default Swaps | 0.0% | Futures Contracts | 0.0% | Total Return Swaps | 0.1% | Purchased Options | 0.1% | Forward Contracts | 0.1% | Other Countries | 41.7% | Nigeria | 2.1% | U.S. Treasury Obligation | 2.2% | Peru | 3.0% | Turkey | 3.3% | Romania | 3.5% | Brazil | 4.1% | Poland | 4.5% | Colombia | 4.7% | South Africa | 5.2% | Malaysia | 6.2% | Indonesia | 6.3% | Mexico | 7.0% | | Footnote | Description | Footnote* | Percentages are calculated based on total net assets. |
|
| Largest Holdings [Text Block] |
Table SummaryHolding Name | Coupon Rate | Maturity Date | Percentage of Total
Net Assets |
|---|
Republic of South Africa Government Bond, ZAR | 8.750%
| 02/28/48
| 1.2% | Peru Government Bond | 5.400%
| 08/12/34
| 1.1% | Malaysia Government Bond | 3.900%
| 11/30/26
| 1.0% | Petroleos Mexicanos | 7.690%
| 01/23/50
| 1.0% | Mexican Bonos | 8.500%
| 03/01/29
| 0.8% | Republic of South Africa Government Bond, ZAR | 8.750%
| 01/31/44
| 0.8% | Mexican Bonos | 8.500%
| 02/28/30
| 0.8% | Republic of Poland Government Bond | 1.750%
| 04/25/32
| 0.8% | Brazilian Government International Bond | 7.250%
| 01/12/56
| 0.8% | Mexican Bonos | 8.000%
| 04/15/32
| 0.8% | |
| C000147410 |
|
| Shareholder Report [Line Items] |
|
| Fund Name |
Emerging Markets Debt Fund
|
| Class Name |
Class Y
|
| Trading Symbol |
SIEDX
|
| Annual or Semi-Annual Statement [Text Block] |
Semi-Annual Shareholder Report
|
| Shareholder Report Annual or Semi-Annual |
semi-annual shareholder report
|
| Additional Information [Text Block] |
This semi-annual shareholder report contains important information about Class Y Shares of the Emerging Markets Debt Fund (the "Fund") for the period from October 1, 2025 to March 31, 2026. You can find additional information about the Fund at https://www.seic.com/mutual-fund-documentation/prospectuses-and-reports. You can also request this information by contacting us at 610-676-1000.
|
| Additional Information Phone Number |
610-676-1000
|
| Additional Information Website |
https://www.seic.com/mutual-fund-documentation/prospectuses-and-reports
|
| Expenses [Text Block] |
What were the Fund costs for the last six months?(based on a hypothetical $10,000 investment) Table SummaryFund Name | Costs of a $10,000 investment | Costs paid as a percentage of a $10,000 investment |
|---|
Emerging Markets Debt Fund, Class Y Shares | $39 | 0.77% |
|---|
|
| Expenses Paid, Amount |
$ 39
|
| Expense Ratio, Percent |
0.77%
|
| AssetsNet |
$ 936,762,000
|
| Holdings Count | Holding |
1,042
|
| Advisory Fees Paid, Amount |
$ 1,767
|
| InvestmentCompanyPortfolioTurnover |
41.00%
|
| Additional Fund Statistics [Text Block] |
Key Fund Statistics as of March 31, 2026Table Summary | Total Net Assets (000's) | Number of Holdings | Total Advisory Fees Paid (000's) | Portfolio Turnover Rate |
|---|
| $936,762 | 1,042 | $1,767 | 41% |
|---|
|
| Holdings [Text Block] |
Asset/Country WeightingsFootnote Reference*Table SummaryValue | Value |
|---|
Interest Rate Swaps | -0.2% | Written Options | 0.0% | Credit Default Swaps | 0.0% | Futures Contracts | 0.0% | Total Return Swaps | 0.1% | Purchased Options | 0.1% | Forward Contracts | 0.1% | Other Countries | 41.7% | Nigeria | 2.1% | U.S. Treasury Obligation | 2.2% | Peru | 3.0% | Turkey | 3.3% | Romania | 3.5% | Brazil | 4.1% | Poland | 4.5% | Colombia | 4.7% | South Africa | 5.2% | Malaysia | 6.2% | Indonesia | 6.3% | Mexico | 7.0% | | Footnote | Description | Footnote* | Percentages are calculated based on total net assets. |
|
| Largest Holdings [Text Block] |
Table SummaryHolding Name | Coupon Rate | Maturity Date | Percentage of Total
Net Assets |
|---|
Republic of South Africa Government Bond, ZAR | 8.750%
| 02/28/48
| 1.2% | Peru Government Bond | 5.400%
| 08/12/34
| 1.1% | Malaysia Government Bond | 3.900%
| 11/30/26
| 1.0% | Petroleos Mexicanos | 7.690%
| 01/23/50
| 1.0% | Mexican Bonos | 8.500%
| 03/01/29
| 0.8% | Republic of South Africa Government Bond, ZAR | 8.750%
| 01/31/44
| 0.8% | Mexican Bonos | 8.500%
| 02/28/30
| 0.8% | Republic of Poland Government Bond | 1.750%
| 04/25/32
| 0.8% | Brazilian Government International Bond | 7.250%
| 01/12/56
| 0.8% | Mexican Bonos | 8.000%
| 04/15/32
| 0.8% | |