Shareholder Report
Mar. 31, 2026
USD ($)
Holding
This report describes changes to the Fund that occurred during the reporting period.
Fund Expenses
(Based on a hypothetical $10,000 investment)
| Fund (Class) | Costs of a $10,000 investment | Costs paid as a percentage of a $10,000 investment |
| Aspiriant Risk-Managed Equity Allocation Fund (Advisor class/RMEAX) |
$31 | 0.29% |
Management’s Discussion of Fund Performance
SUMMARY OF RESULTS
The Aspiriant Risk-Managed Equity Allocation Fund ("Equity Allocation Fund" or the "Fund") returned 11.94% for the fiscal year ended March 31, 2026. Over the same period, Equity Allocation Fund's benchmark, the MSCI ACWI Index, returned 20.01% and MSCI ACWI Minimum Volatility Index returned 3.86%.
TOP PERFORMANCE CONTRIBUTORS
* Underlying funds with allocations to emerging markets
* Underlying funds with allocations to international developed markets
TOP PERFORMANCE DETRACTORS
* Underlying funds with a low volatility mandate
* Private funds with long/short exposures
* Sub-advisers and underlying funds with quality strategies
The below-referenced indices do not reflect the deduction of fees and taxes associated with a mutual fund, such as investment management and fund accounting fees. Investors cannot invest directly in an index, although they can invest in their underlying securities.
The MSCI ACWI Index is a free float-adjusted market capitalization weighted index that is designed to measure the equity performance of developed and emerging markets.
MSCI ACWI Minimum Volatility Index is composed of developed and emerging market equities that, in the aggregate, have lower volatility characteristics relative to the broader developed and emerging equity markets.
Fund Performance
The following graph and chart compare the initial and subsequent account values at the end of each of the most recently completed 10 fiscal years of the Fund, or for the life of the Fund, if shorter. It assumes a $10,000 initial investment at the beginning of the first fiscal year in an appropriate, broad-based securities market index for the same period.
GROWTH OF $10,000
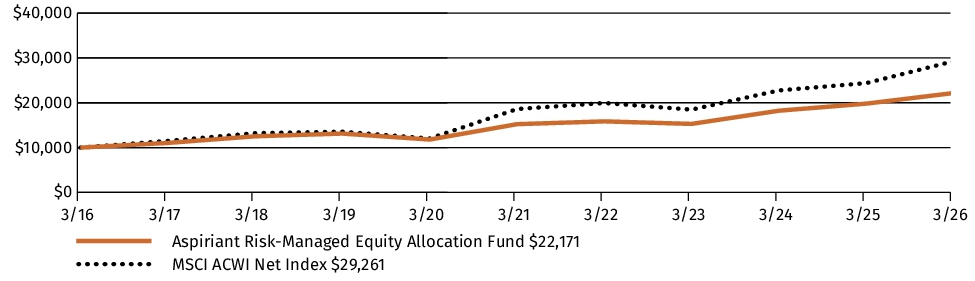
| AVERAGE ANNUAL TOTAL RETURN | 1 Year | 5 Years | 10 Years |
| Aspiriant Risk-Managed Equity Allocation Fund (Advisor class/RMEAX) | 11.94% | 7.80% | 8.29% |
| MSCI ACWI Net | 20.01% | 9.49% | 11.33% |
The graph and table do not reflect the deduction of taxes that a shareholder would pay on Fund distributions or redemption of Fund shares.
Visit https://aspiriantfunds.com/aspiriant-risk-managed-equity-allocation-fund/fund-performance/ for the most recent performance information.
Key Fund Statistics
The following table outlines key fund statistics that you should pay attention to.
| Fund net assets | $1,283,088,169 |
| Total number of portfolio holdings | 119 |
| Total advisory fees paid (net) | $2,168,575 |
| Portfolio turnover rate as of the end of the reporting period | 21% |
Graphical Representation of Holdings
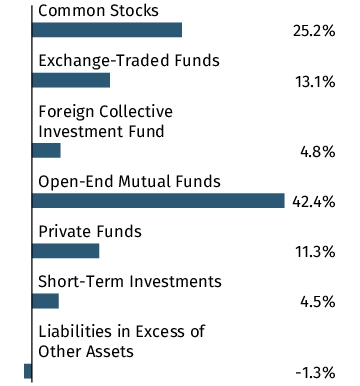
The tables below show the investment makeup of the Fund, representing percentage of the total net assets of the Fund. The Top Ten Holdings exclude short-term holdings, if any. The Top Ten Holdings table may not reflect the total exposure to an issuer.
Top Ten Holdings
| GMO Quality Fund - Class VI | 33.4% |
| Schwab Fundamental Emerging Markets Equity ETF | 7.7% |
| RIEF Strategic Partners Fund LLC - Series SB | 7.4% |
| Baillie Gifford Emerging Markets Equities Fund - Class K | 5.0% |
| GMO Equity Dislocation Investment Fund - Class A | 4.8% |
| AQR Large Cap Defensive Style Fund - Class R6 | 4.0% |
| Viking Global Equities LP - Class H Interests | 3.9% |
| iShares MSCI Global Min Vol Factor ETF | 3.1% |
| iShares MSCI ACWI ETF | 2.3% |
| Microsoft Corp. | 1.1% |
Asset Allocation
Top Ten Holdings
| GMO Quality Fund - Class VI | 33.4% |
| Schwab Fundamental Emerging Markets Equity ETF | 7.7% |
| RIEF Strategic Partners Fund LLC - Series SB | 7.4% |
| Baillie Gifford Emerging Markets Equities Fund - Class K | 5.0% |
| GMO Equity Dislocation Investment Fund - Class A | 4.8% |
| AQR Large Cap Defensive Style Fund - Class R6 | 4.0% |
| Viking Global Equities LP - Class H Interests | 3.9% |
| iShares MSCI Global Min Vol Factor ETF | 3.1% |
| iShares MSCI ACWI ETF | 2.3% |
| Microsoft Corp. | 1.1% |
Material Fund Changes
Effective October 31, 2025, Aperio Group, LLC no longer serves as a sub-adviser to the Fund. There were no changes to the Fund's investment objective or principal investment strategies as a result of this change, except for the elimination of the utilization of a tax-managed approach.
Changes in and Disagreements with Accountants
On November 18, 2025, the Audit Committee of the Board of Trustees of Aspiriant Trust (the "Board") appointed Tait, Weller & Baker LLP ("Tait") to serve as the independent registered public accounting firm to audit the financial statements of the Aspiriant Risk-Managed Taxable Bond Fund, Aspiriant Risk-Managed Municipal Bond Fund, Aspiriant Defensive Allocation Fund and Aspiriant Risk-Managed Equity Allocation Fund (the "Funds") for the fiscal year ended March 31, 2026. Previously, Deloitte & Touche LLP ("Deloitte") served as the independent registered public accounting firm to the Funds. The selection of Tait does not reflect any disagreements with Deloitte or dissatisfaction by the Funds, the Board, or the Audit Committee with the performance of Deloitte.
This report describes changes to the Fund that occurred during the reporting period.
Fund Expenses
(Based on a hypothetical $10,000 investment)
| Fund (Class) | Costs of a $10,000 investment | Costs paid as a percentage of a $10,000 investment |
| Aspiriant Risk-Managed Municipal Bond Fund (RMMBX) |
$35 | 0.34% |
Management’s Discussion of Fund Performance
SUMMARY OF RESULTS
The Aspiriant Risk-Managed Municipal Bond Fund ("Municipal Bond Fund" or the "Fund") returned 3.78% for the fiscal year ended March 31, 2026. Over the same period, the Municipal Bond Fund's benchmark, the Bloomberg Municipal Bond Index (the "Benchmark"), returned 4.29%. High yield municipal bonds, as measured by the Bloomberg High Yield Municipal Bond Index, returned 2.35% for the one-year period ended March 31, 2026, underperforming investment grade bonds, as measured by the Benchmark.
TOP PERFORMANCE CONTRIBUTORS
* Strong credit fundamentals across issuers
* Persistent investor demand
* Supportive credit environment
TOP PERFORMANCE DETRACTORS
* Credit quality positioning, especially overweight to higher yield bonds
* Duration sensitivity
The below-referenced indices do not reflect the deduction of fees and taxes associated with a mutual fund, such as investment management and fund accounting fees. Investors cannot invest directly in an index, although they can invest in their underlying securities.
The Bloomberg Municipal Bond Index is considered representative of the tax-exempt bond market. It includes most investment-grade tax-exempt bonds that are issued by state and local governments.
The Bloomberg High Yield Municipal Index measures the non-investment-grade and nonrated U.S. dollar-denominated, fixed-rate, tax-exempt bond market within the 50 United States and four other qualifying regions (Washington, D.C.; Puerto Rico; Guam; and the Virgin Islands). The index allows state and local general obligation, revenue, insured, and pre-refunded bonds; however, historically the index has been composed of mostly revenue bonds.
Fund Performance
The following graph and chart compare the initial and subsequent account values at the end of each of the most recently completed 10 fiscal years of the Fund, or for the life of the Fund, if shorter. It assumes a $10,000 initial investment at the beginning of the first fiscal year in an appropriate, broad-based securities market index for the same period.
GROWTH OF $10,000
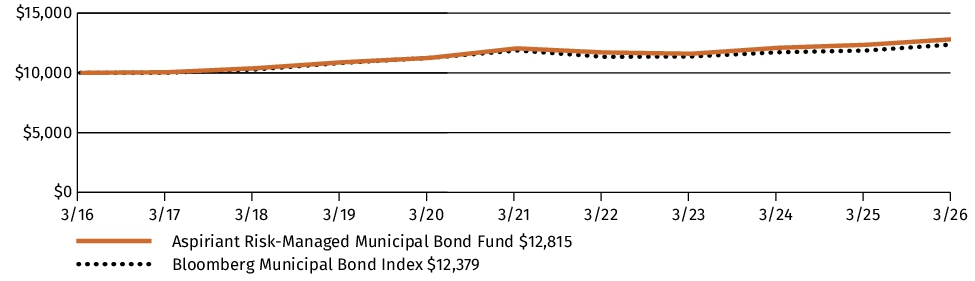
| AVERAGE ANNUAL TOTAL RETURN | 1 Year | 5 Years | 10 Years |
| Aspiriant Risk-Managed Municipal Bond Fund (RMMBX) | 3.78% | 1.24% | 2.51% |
| Bloomberg Municipal Bond Index | 4.29% | 0.84% | 2.16% |
The graph and table do not reflect the deduction of taxes that a shareholder would pay on Fund distributions or redemption of Fund shares.
Visit https://aspiriantfunds.com/aspiriant-risk-managed-municipal-bond-fund/fund-performance/ for the most recent performance information.
Key Fund Statistics
The following table outlines key fund statistics that you should pay attention to.
| Fund net assets | $1,273,596,158 |
| Total number of portfolio holdings | 990 |
| Total advisory fees paid (net) | $2,544,398 |
| Portfolio turnover rate as of the end of the reporting period | 23% |
Graphical Representation of Holdings
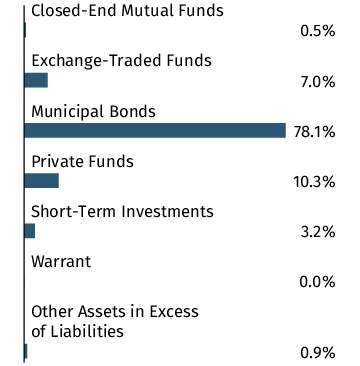
The tables below show the investment makeup of the Fund, representing percentage of the total net assets of the Fund. The Top Ten Holdings exclude short-term holdings, if any. The Top Ten Holdings table may not reflect the total exposure to an issuer. The interest rates presented in the Top Ten Holdings are as of the reporting period end.
Top Ten Holdings
| MacKay Municipal Opportunities Fund, LP - Class A | 8.2% |
| iShares National Muni Bond ETF | 7.0% |
| MacKay Municipal Credit Opportunities Fund, LP - Class A | 2.1% |
| City of New York, 5.25%, 03/1/2053, Call 03/1/2034 | 0.4% |
| Illinois Finance Authority, 5.25%, 05/15/2048, Call 05/15/2033 | 0.4% |
| New Jersey Transportation Trust Fund Authority, 5.00%, 06/15/2048, Call 12/15/2032 | 0.3% |
| Puerto Rico Sales Tax Financing Corp. Sales Tax Revenue, 5.00%, 07/1/2058, Call 07/1/2028 | 0.3% |
| County of Miami-Dade, 5.00%, 07/1/2038, Call 07/1/2026 | 0.3% |
| Regional Transportation District, 5.00%, 11/1/2041, Call 11/1/2026 | 0.3% |
| Metropolitan Atlanta Rapid Transit Authority, 4.00%, 07/1/2035, Call 07/1/2027 | 0.3% |
Asset Allocation
Top Ten Holdings
| MacKay Municipal Opportunities Fund, LP - Class A | 8.2% |
| iShares National Muni Bond ETF | 7.0% |
| MacKay Municipal Credit Opportunities Fund, LP - Class A | 2.1% |
| City of New York, 5.25%, 03/1/2053, Call 03/1/2034 | 0.4% |
| Illinois Finance Authority, 5.25%, 05/15/2048, Call 05/15/2033 | 0.4% |
| New Jersey Transportation Trust Fund Authority, 5.00%, 06/15/2048, Call 12/15/2032 | 0.3% |
| Puerto Rico Sales Tax Financing Corp. Sales Tax Revenue, 5.00%, 07/1/2058, Call 07/1/2028 | 0.3% |
| County of Miami-Dade, 5.00%, 07/1/2038, Call 07/1/2026 | 0.3% |
| Regional Transportation District, 5.00%, 11/1/2041, Call 11/1/2026 | 0.3% |
| Metropolitan Atlanta Rapid Transit Authority, 4.00%, 07/1/2035, Call 07/1/2027 | 0.3% |
Changes in and Disagreements with Accountants
On November 18, 2025, the Audit Committee of the Board of Trustees of Aspiriant Trust (the "Board") appointed Tait, Weller & Baker LLP ("Tait") to serve as the independent registered public accounting firm to audit the financial statements of the Aspiriant Risk-Managed Taxable Bond Fund, Aspiriant Risk-Managed Municipal Bond Fund, Aspiriant Defensive Allocation Fund and Aspiriant Risk-Managed Equity Allocation Fund (the "Funds") for the fiscal year ended March 31, 2026. Previously, Deloitte & Touche LLP ("Deloitte") served as the independent registered public accounting firm to the Funds. The selection of Tait does not reflect any disagreements with Deloitte or dissatisfaction by the Funds, the Board, or the Audit Committee with the performance of Deloitte.
This report describes changes to the Fund that occurred during the reporting period.
Fund Expenses
(Based on a hypothetical $10,000 investment)
| Fund (Class) | Costs of a $10,000 investment | Costs paid as a percentage of a $10,000 investment |
| Aspiriant Defensive Allocation Fund (RMDFX) |
$22 | 0.20% |
Management’s Discussion of Fund Performance
SUMMARY OF RESULTS
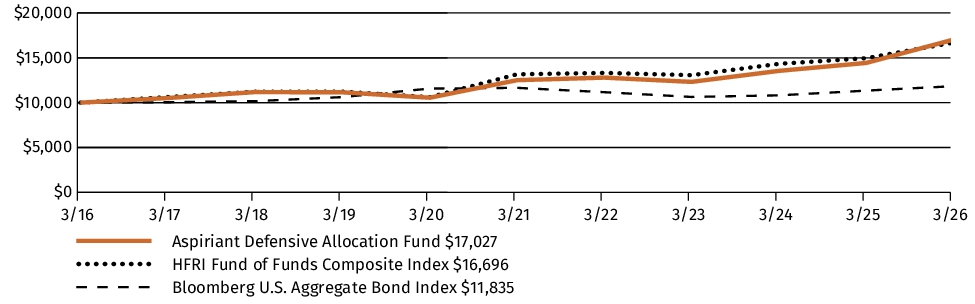
The Aspiriant Defensive Allocation Fund ("Defensive Allocation Fund" or the "Fund") returned 17.99% for the one-year period ended March 31, 2026. Over the same period, the Fund's primary benchmark, the HFRI Fund of Funds Composite Index (the "Benchmark"), returned 11.62%. Over the same period, the Bloomberg U.S. Aggregate Bond Index returned 4.35%.
TOP PERFORMANCE CONTRIBUTORS
* Core Diversifiers with global asset allocation strategies that invest across a wide range of financial markets and geographies
* Underlying funds with allocations to global macro strategies
* Allocation to gold exchange-traded fund
TOP PERFORMANCE DETRACTORS
* Allocation to event-driven strategies
* Allocation to actively traded convertible arbitrage/special situations strategies.
The below-referenced indices do not reflect the deduction of fees and taxes associated with a mutual fund, such as investment management and fund accounting fees. Investors cannot invest directly in an index, although they can invest in their underlying securities.
The HFRI Fund of Funds Composite Index is an index that is a global, equal-weighted index of Fund of Funds that report to HFR Database.
The Bloomberg U.S. Aggregate Bond Index is a broad fixed income, market-value-weighted index generally representative of investment grade fixed-rate debt issues, including government, corporate, asset-backed, and mortgage-backed securities with maturities of at least one year.
Fund Performance
The following graph and chart compare the initial and subsequent account values at the end of each of the most recently completed 10 fiscal years of the Fund, or for the life of the Fund, if shorter. It assumes a $10,000 initial investment at the beginning of the first fiscal year in an appropriate, broad-based securities market index for the same period.
GROWTH OF $10,000
| AVERAGE ANNUAL TOTAL RETURN | 1 Year | 5 Years | 10 Years |
| Aspiriant Defensive Allocation Fund (RMDFX) | 17.99% | 6.37% | 5.47% |
| HFRI Fund of Funds Composite Index | 11.62% | 4.88% | 5.26% |
| Bloomberg U.S. Aggregate Bond Index | 4.35% | 0.31% | 1.70% |
The graph and table do not reflect the deduction of taxes that a shareholder would pay on Fund distributions or redemption of Fund shares.
Visit https://aspiriantfunds.com/aspiriant-defensive-allocation-fund/fund-performance-2/ for the most recent performance information.
Key Fund Statistics
The following table outlines key fund statistics that you should pay attention to.
| Fund net assets | $1,058,284,293 |
| Total number of portfolio holdings | 14 |
| Total advisory fees paid (net) | $1,007,848 |
| Portfolio turnover rate as of the end of the reporting period | 13% |
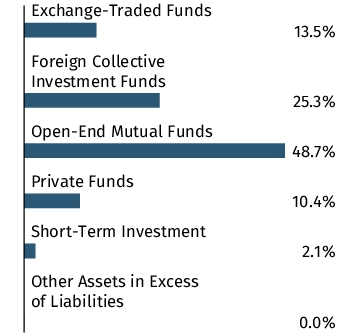
Graphical Representation of Holdings
The tables below show the investment makeup of the Fund, representing percentage of the total net assets of the Fund. The Top Ten Holdings exclude short-term holdings, if any. The Top Ten Holdings table may not reflect the total exposure to an issuer.
Top Ten Holdings
| GMO Benchmark-Free Allocation Fund - Class IV | 26.0% |
| Wilshire Bridgewater Managed Alpha (Ireland) Fund - D3 Shares | 12.6% |
| iShares Gold Trust | 8.8% |
| Lazard Rathmore Alternative Fund - Class E | 6.9% |
| Victory Pioneer Multi-Asset Income Fund - Class R6 | 6.6% |
| JPMorgan Global Allocation Fund - Class R6 | 6.2% |
| Eaton Vance Global Macro Absolute Return Advantage Fund - Class R6 | 6.1% |
| Millennium International, Ltd. - Class GG | 6.0% |
| GMO Equity Dislocation Investment Fund - Class A | 5.8% |
| Elliott Associates, LP - Class C Shares | 4.4% |
Asset Allocation
Top Ten Holdings
| GMO Benchmark-Free Allocation Fund - Class IV | 26.0% |
| Wilshire Bridgewater Managed Alpha (Ireland) Fund - D3 Shares | 12.6% |
| iShares Gold Trust | 8.8% |
| Lazard Rathmore Alternative Fund - Class E | 6.9% |
| Victory Pioneer Multi-Asset Income Fund - Class R6 | 6.6% |
| JPMorgan Global Allocation Fund - Class R6 | 6.2% |
| Eaton Vance Global Macro Absolute Return Advantage Fund - Class R6 | 6.1% |
| Millennium International, Ltd. - Class GG | 6.0% |
| GMO Equity Dislocation Investment Fund - Class A | 5.8% |
| Elliott Associates, LP - Class C Shares | 4.4% |
Changes in and Disagreements with Accountants
On November 18, 2025, the Audit Committee of the Board of Trustees of Aspiriant Trust (the "Board") appointed Tait, Weller & Baker LLP ("Tait") to serve as the independent registered public accounting firm to audit the financial statements of the Aspiriant Risk-Managed Taxable Bond Fund, Aspiriant Risk-Managed Municipal Bond Fund, Aspiriant Defensive Allocation Fund and Aspiriant Risk-Managed Equity Allocation Fund (the "Funds") for the fiscal year ended March 31, 2026. Previously, Deloitte & Touche LLP ("Deloitte") served as the independent registered public accounting firm to the Funds. The selection of Tait does not reflect any disagreements with Deloitte or dissatisfaction by the Funds, the Board, or the Audit Committee with the performance of Deloitte.
This report describes changes to the Fund that occurred during the reporting period.
Fund Expenses
(Based on a hypothetical $10,000 investment)
| Fund (Class) | Costs of a $10,000 investment | Costs paid as a percentage of a $10,000 investment |
| Aspiriant Risk-Managed Taxable Bond Fund (RMTBX) |
$27 | 0.26% |
Management’s Discussion of Fund Performance
SUMMARY OF RESULTS
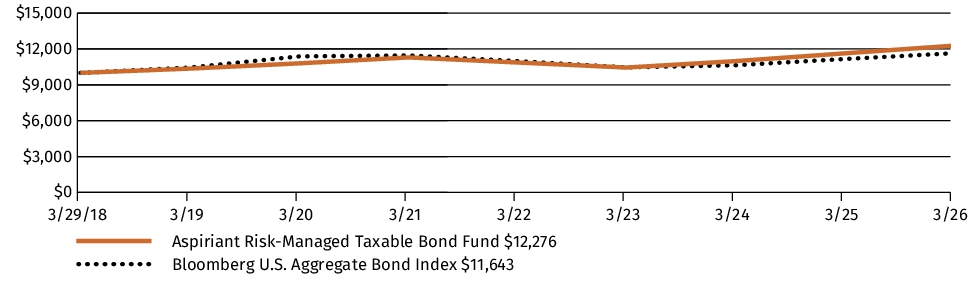
The Aspiriant Risk-Managed Taxable Bond Fund ("Taxable Bond Fund" or the "Fund") returned 5.54% for the fiscal year ended March 31, 2026. Over the same period, Taxable Bond Fund's benchmark, the Bloomberg U.S. Aggregate Bond Index (the "Benchmark"), returned 4.35%. The Fund outperformance was driven in part by its allocations to corporate high-yield bonds and emerging market debt, which returned 7.01% (as measured by the Bloomberg U.S. Corporate High Yield Index) and 9.40% (as measured by J.P. Morgan Emerging Markets Bond Index Global), respectively, for the year ended March 31, 2026.
TOP PERFORMANCE CONTRIBUTORS
* Opportunistic underlying funds with exposures to emerging market debt
* Opportunistic underlying funds with exposures to direct lending
* Opportunistic underlying funds with exposures to higher yield issues
TOP PERFORMANCE DETRACTORS
* Underlying funds with higher exposure to the long end of the yield curve
The below-referenced indices do not reflect the deduction of fees and taxes associated with a mutual fund, such as investment management and fund accounting fees. Investors cannot invest directly in an index, although they can invest in their underlying securities.
The Bloomberg U.S. Aggregate Bond Index is a broad fixed income, market-value-weighted index generally representative of investment grade fixed-rate debt issues, including government, corporate, asset-backed, and mortgage-backed securities with maturities of at least one year.
The Bloomberg U.S. Corporate High Yield Bond Index is an index that measures the USD-denominated, high yield, fixed-rate corporate bond market. Securities are classified as high yield if the middle rating of Moody's, Fitch and S&P is Ba1/BB+/BB+ or below.
The J.P. Morgan Emerging Markets Bond Index Global is an independently maintained and widely published index comprised of U.S. dollar-denominated Eurobonds, traded loans, and legacy Brady bonds issued by sovereign and quasi-sovereign entities.
Fund Performance
The following graph and chart compare the initial and subsequent account values at the end of each of the most recently completed 10 fiscal years of the Fund, or for the life of the Fund, if shorter. It assumes a $10,000 initial investment at the beginning of the first fiscal year in an appropriate, broad-based securities market index for the same period.
GROWTH OF $10,000
| AVERAGE ANNUAL TOTAL RETURN | 1 Year | 5 Years | Since Inception* |
| Aspiriant Risk-Managed Taxable Bond Fund (RMTBX) | 5.54% | 1.69% | 2.59% |
| Bloomberg U.S. Aggregate Bond Index | 4.35% | 0.31% | 1.92% |
|
* |
Commenced operations as of the close of business on March 29, 2018. |
The graph and table do not reflect the deduction of taxes that a shareholder would pay on Fund distributions or redemption of Fund shares.
Visit https://aspiriantfunds.com/aspiriant-risk-managed-taxable-bond-fund-2/fund-performance/ for the most recent performance information.
Key Fund Statistics
The following table outlines key fund statistics that you should pay attention to.
| Fund net assets | $396,253,920 |
| Total number of portfolio holdings | 11 |
| Total advisory fees paid (net) | $269,184 |
| Portfolio turnover rate as of the end of the reporting period | 0% |
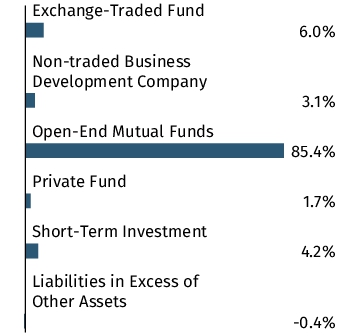
Graphical Representation of Holdings
The tables below show the investment makeup of the Fund, representing percentage of the total net assets of the Fund. The Top Ten Holdings exclude short-term holdings, if any. The Top Ten Holdings table may not reflect the total exposure to an issuer.
Top Ten Holdings
| Vanguard Total Bond Market Index Fund - Institutional Class | 30.0% |
| PIMCO Income Fund - Institutional Class | 16.2% |
| DoubleLine Total Return Bond Fund - I Class | 15.0% |
| TCW MetWest Total Return Bond Fund - Plan Class | 9.9% |
| River Canyon Total Return Bond Fund - Institutional Class | 8.5% |
| Vanguard Long-Term Treasury ETF | 6.0% |
| GMO Emerging Country Debt Fund, Class VI | 5.2% |
| TPG Twin Brook Capital Income Fund - I Class | 3.1% |
| AG Direct Lending Fund IV Annex, LP | 1.7% |
| Vanguard High-Yield Corporate Fund - Admiral Shares | 0.6% |
Asset Allocation
Top Ten Holdings
| Vanguard Total Bond Market Index Fund - Institutional Class | 30.0% |
| PIMCO Income Fund - Institutional Class | 16.2% |
| DoubleLine Total Return Bond Fund - I Class | 15.0% |
| TCW MetWest Total Return Bond Fund - Plan Class | 9.9% |
| River Canyon Total Return Bond Fund - Institutional Class | 8.5% |
| Vanguard Long-Term Treasury ETF | 6.0% |
| GMO Emerging Country Debt Fund, Class VI | 5.2% |
| TPG Twin Brook Capital Income Fund - I Class | 3.1% |
| AG Direct Lending Fund IV Annex, LP | 1.7% |
| Vanguard High-Yield Corporate Fund - Admiral Shares | 0.6% |
Changes in and Disagreements with Accountants
On November 18, 2025, the Audit Committee of the Board of Trustees of Aspiriant Trust (the "Board") appointed Tait, Weller & Baker LLP ("Tait") to serve as the independent registered public accounting firm to audit the financial statements of the Aspiriant Risk-Managed Taxable Bond Fund, Aspiriant Risk-Managed Municipal Bond Fund, Aspiriant Defensive Allocation Fund and Aspiriant Risk-Managed Equity Allocation Fund (the "Funds") for the fiscal year ended March 31, 2026. Previously, Deloitte & Touche LLP ("Deloitte") served as the independent registered public accounting firm to the Funds. The selection of Tait does not reflect any disagreements with Deloitte or dissatisfaction by the Funds, the Board, or the Audit Committee with the performance of Deloitte.