Shareholder Report
|
6 Months Ended |
|
Mar. 31, 2026
USD ($)
Holding
|
|---|
| Shareholder Report [Line Items] |
|
| Document Type |
N-CSRS
|
| Amendment Flag |
false
|
| Registrant Name |
Guggenheim Funds Trust
|
| Entity Central Index Key |
0000088525
|
| Entity Investment Company Type |
N-1A
|
| Document Period End Date |
Mar. 31, 2026
|
| C000250200 |
|
| Shareholder Report [Line Items] |
|
| Fund Name |
Guggenheim Active Investment Series (GAINS) - Core Plus Fund
|
| Class Name |
SMA Class
|
| Trading Symbol |
GUCPX
|
| Annual or Semi-Annual Statement [Text Block] |
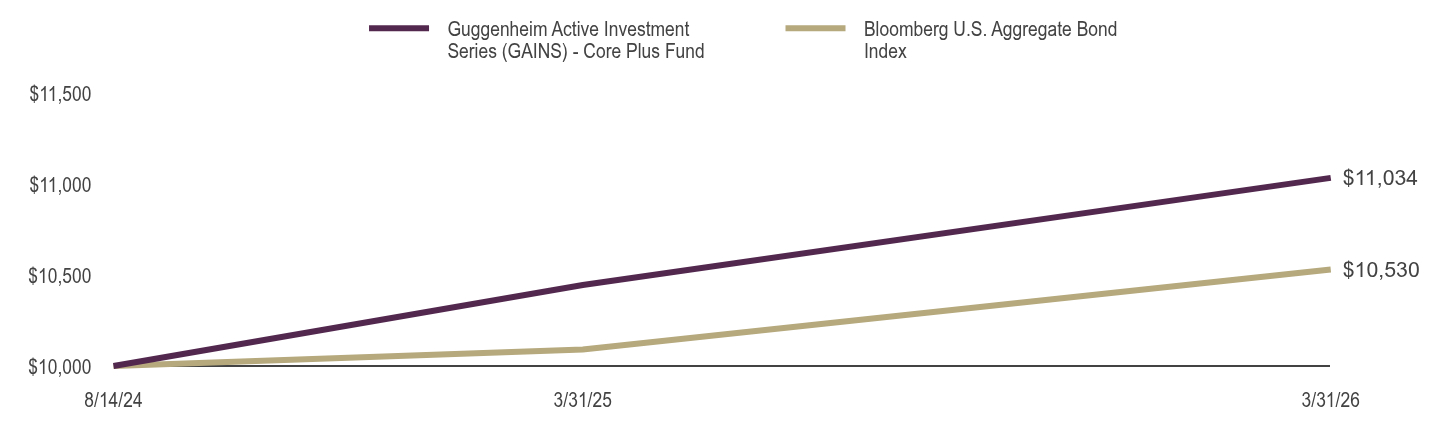
This semi-annual shareholder report contains important information about the Guggenheim Active Investment Series (GAINS) - Core Plus Fund for the period from October 1, 2025 to March 31, 2026.
|
| Shareholder Report Annual or Semi-Annual |
Semi-Annual Shareholder Report
|
| Additional Information [Text Block] |
You can find additional information about the fund at GuggenheimInvestments.com/mutual-funds/literature. You can also request this information by contacting 800 820 0888 or services@guggenheiminvestments.com.
|
| Additional Information Phone Number |
800 820 0888
|
| Additional Information Email |
<span style="box-sizing: border-box; color: rgb(67, 67, 67); display: inline; flex-wrap: nowrap; font-size: 10.6667px; font-weight: 400; grid-area: auto; line-height: 12.8px; margin: 0px; overflow: visible; text-align: left; text-align-last: auto; white-space-collapse: preserve-breaks;">services@guggenheiminvestments.com</span>
|
| Additional Information Website |
<span style="box-sizing: border-box; color: rgb(67, 67, 67); display: inline; flex-wrap: nowrap; font-size: 10.6667px; font-weight: 400; grid-area: auto; line-height: 12.8px; margin: 0px; overflow: visible; text-align: left; text-align-last: auto; white-space-collapse: preserve-breaks;">GuggenheimInvestments.com/mutual-funds/literature</span>
|
| Expenses [Text Block] |
What were the Fund's costs for the last six months? * Based on a hypothetical $10,000 investment Table SummaryClass | Costs of a $10,000 Investment | Costs Paid as a % of a $10,000 Investment** |
|---|
SMA Class | $6 | 0.12% |
|---|
Table Summary* | Excludes expenses of the underlying funds in which the fund invests, if any. |
|---|
** | Annualized |
|---|
|
| Expenses Paid, Amount |
$ 6
|
| Factors Affecting Performance [Text Block] |
What factors materially affected the Fund's performance over the last six months? Positive performance over the period was driven by carry (or earned income). Duration detracted as rates rose over the period. Additionally, spread widening across fixed-income sectors, prompted by heightened geopolitical tensions, detracted from performance. The effect was felt broadly across credit-sensitive holdings. |
| Line Graph [Table Text Block] |
Table Summary | Guggenheim Active Investment Series (GAINS) - Core Plus Fund | Bloomberg U.S. Aggregate Bond Index |
|---|
8/14/24 | $10,000 | $10,000 |
|---|
3/31/25 | $10,445 | $10,091 |
|---|
3/31/26 | $11,034 | $10,530 |
|---|
|
| AssetsNet |
$ 157,055,439
|
| Holdings Count | Holding |
621
|
| InvestmentCompanyPortfolioTurnover |
8.00%
|
| Additional Fund Statistics [Text Block] |
Fund Statistics as of March 31, 2026 - Net Assets$157,055,439
- Total Number of Portfolio Holdings621
- Portfolio Turnover Rate8%
|
| Holdings [Text Block] |
Portfolio Composition by Quality RatingFootnote Reference1 (% of Total Investments) as of March 31, 2026 Table SummaryAAA | 13.5% |
|---|
AA | 28.8% |
|---|
A | 20.0% |
|---|
BBB | 14.9% |
|---|
BB | 10.7% |
|---|
B | 5.6% |
|---|
CCC | 0.7% |
|---|
NRFootnote Referencea | 5.8% |
|---|
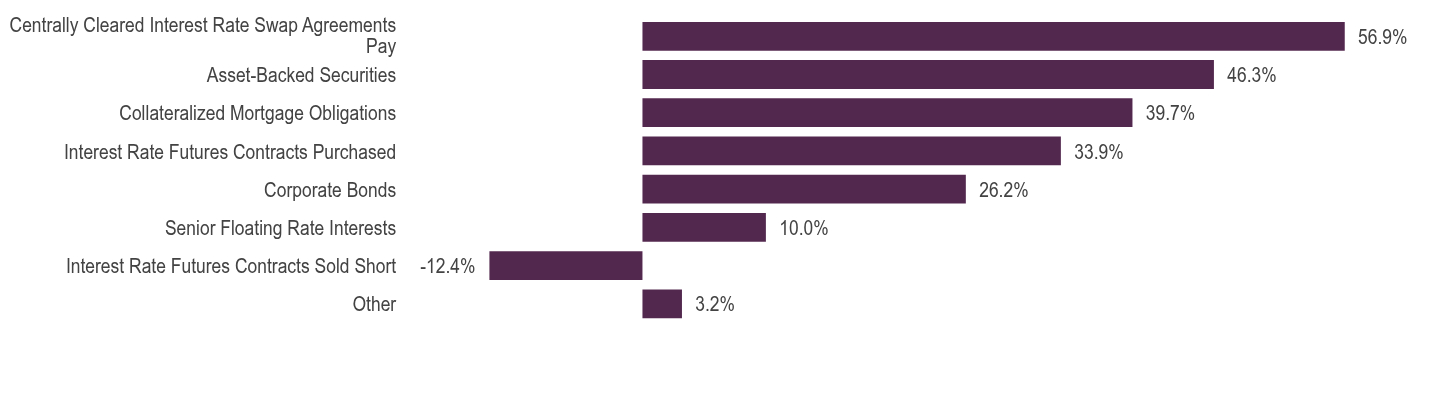
Holdings DiversificationFootnote Reference3 (% of Net Assets) as of March 31, 2026 Table SummaryValue | Value |
|---|
Other | 3.2% | Interest Rate Futures Contracts Sold Short | -12.4% | Senior Floating Rate Interests | 10.0% | Corporate Bonds | 26.2% | Interest Rate Futures Contracts Purchased | 33.9% | Collateralized Mortgage Obligations | 39.7% | Asset-Backed Securities | 46.3% | Centrally Cleared Interest Rate Swap Agreements Pay | 56.9% | |
| Largest Holdings [Text Block] |
10 Largest HoldingsFootnote Reference2 (% of Net Assets) as of March 31, 2026 Table SummaryUniform MBS 30 Year 3.00% due 05/01/56 | 5.2% |
|---|
Uniform MBS 30 Year 5.00% due 06/01/56 | 3.0% |
|---|
Fannie Mae 5.00% due 03/25/55 | 2.2% |
|---|
NLT Trust 2026-NQM1, 6.61% due 02/25/71 | 2.1% |
|---|
KKR CLO 16 Ltd. 16 A2R3, 5.27% (3 Month Term SOFR + 1.60%, Rate Floor: 1.60%) due 10/20/34 | 1.4% |
|---|
Cross Mortgage Trust 2026-NQM3, 5.36% due 03/25/71 | 1.3% |
|---|
Blackstone Strategic Cap Holding II 5.92% (1 Month Term SOFR + 2.25%) due 12/31/33 | 1.2% |
|---|
SG Residential Mortgage Trust 2025-1, 5.25% due 12/25/65 | 1.0% |
|---|
GMAC Commercial Mortgage Asset Corp. 2025-WPAFB, 7.15% due 08/10/36 | 1.0% |
|---|
Golub Capital Partners CLO 49M Ltd. 2020-49A A1R2, 5.19% (3 Month Term SOFR + 1.52%, Rate Floor: 1.52%) due 07/20/38 | 1.0% |
|---|
Total | 19.4% |
|---|
|
| Material Fund Change [Text Block] |
|
| C000250201 |
|
| Shareholder Report [Line Items] |
|
| Fund Name |
Guggenheim Active Investment Series (GAINS) - Limited Duration Fund
|
| Class Name |
SMA Class
|
| Trading Symbol |
GULDX
|
| Annual or Semi-Annual Statement [Text Block] |
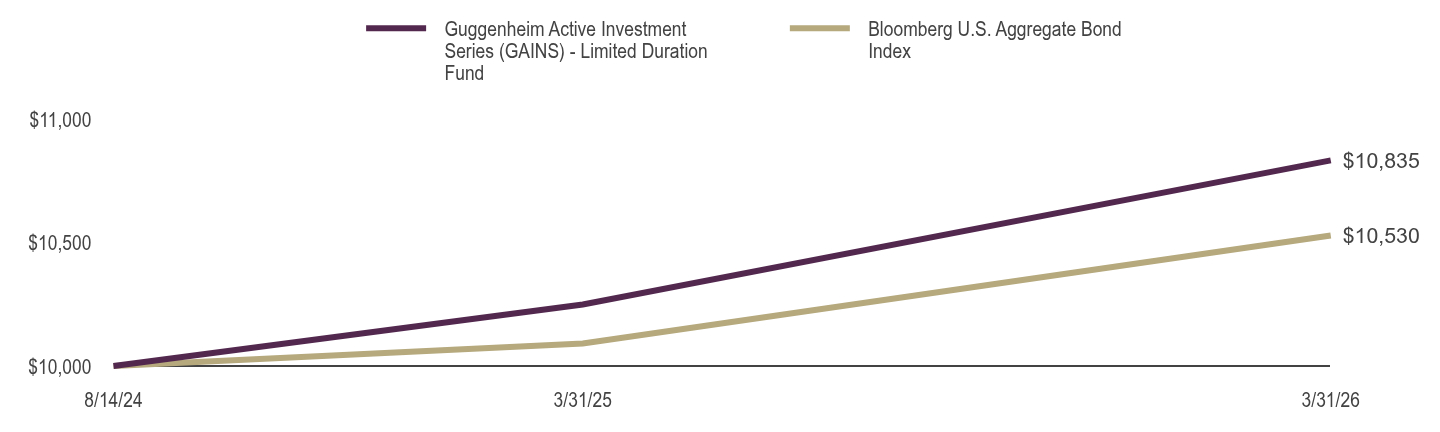
This semi-annual shareholder report contains important information about the Guggenheim Active Investment Series (GAINS) - Limited Duration Fund for the period from October 1, 2025 to March 31, 2026.
|
| Shareholder Report Annual or Semi-Annual |
Semi-Annual Shareholder Report
|
| Additional Information [Text Block] |
You can find additional information about the fund at GuggenheimInvestments.com/mutual-funds/literature. You can also request this information by contacting 800 820 0888 or services@guggenheiminvestments.com.
|
| Additional Information Phone Number |
800 820 0888
|
| Additional Information Email |
<span style="box-sizing: border-box; color: rgb(67, 67, 67); display: inline; flex-wrap: nowrap; font-size: 10.6667px; font-weight: 400; grid-area: auto; line-height: 12.8px; margin: 0px; overflow: visible; text-align: left; text-align-last: auto; white-space-collapse: preserve-breaks;">services@guggenheiminvestments.com</span>
|
| Additional Information Website |
<span style="box-sizing: border-box; color: rgb(67, 67, 67); display: inline; flex-wrap: nowrap; font-size: 10.6667px; font-weight: 400; grid-area: auto; line-height: 12.8px; margin: 0px; overflow: visible; text-align: left; text-align-last: auto; white-space-collapse: preserve-breaks;">GuggenheimInvestments.com/mutual-funds/literature</span>
|
| Expenses [Text Block] |
What were the Fund's costs for the last six months? * Based on a hypothetical $10,000 investment Table SummaryClass | Costs of a $10,000 Investment | Costs Paid as a % of a $10,000 Investment** |
|---|
SMA Class | $5 | 0.09% |
|---|
Table Summary* | Excludes expenses of the underlying funds in which the fund invests, if any. |
|---|
** | Annualized |
|---|
|
| Expenses Paid, Amount |
$ 5
|
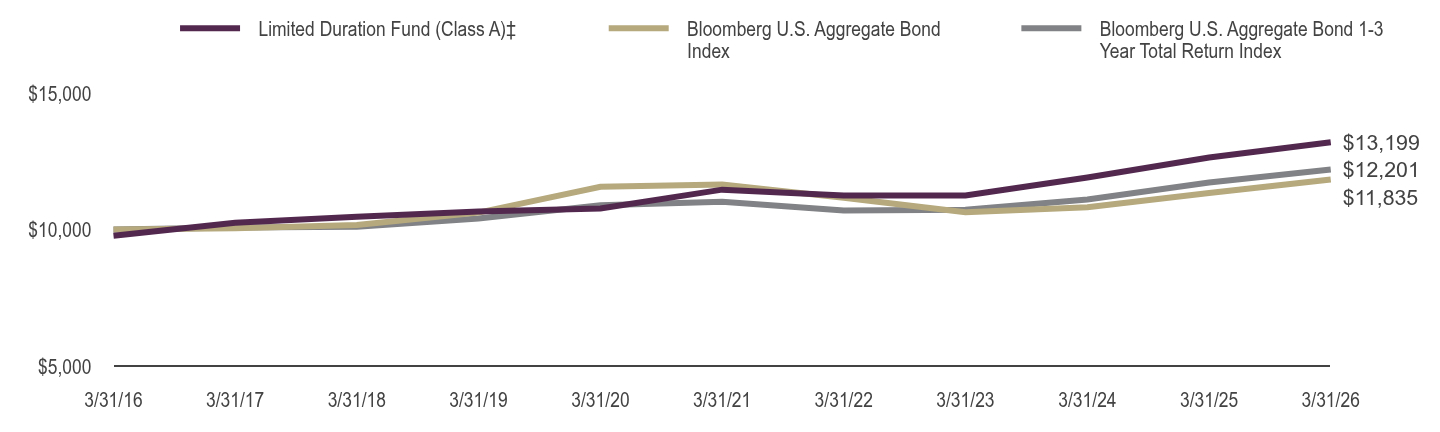
| Factors Affecting Performance [Text Block] |
What factors materially affected the Fund's performance over the last six months? Positive performance over the period was driven by carry (or earned income). Duration detracted as rates rose over the period. Additionally, spread widening across fixed-income sectors, prompted by heightened geopolitical tensions, detracted modestly from performance. The effect was felt broadly across credit-sensitive holdings. |
| Line Graph [Table Text Block] |
Table Summary | Guggenheim Active Investment Series (GAINS) - Limited Duration Fund | Bloomberg U.S. Aggregate Bond Index |
|---|
8/14/24 | $10,000 | $10,000 |
|---|
3/31/25 | $10,250 | $10,091 |
|---|
3/31/26 | $10,835 | $10,530 |
|---|
|
| AssetsNet |
$ 20,648,700
|
| Holdings Count | Holding |
253
|
| InvestmentCompanyPortfolioTurnover |
8.00%
|
| Additional Fund Statistics [Text Block] |
Fund Statistics as of March 31, 2026 - Net Assets$20,648,700
- Total Number of Portfolio Holdings253
- Portfolio Turnover Rate8%
|
| Holdings [Text Block] |
Portfolio Composition by Quality RatingFootnote Reference1 (% of Total Investments) as of March 31, 2026 Table SummaryAAA | 34.9% |
|---|
AA | 23.2% |
|---|
A | 16.7% |
|---|
BBB | 9.6% |
|---|
BB | 6.0% |
|---|
B | 3.9% |
|---|
NRFootnote Referencea | 5.7% |
|---|
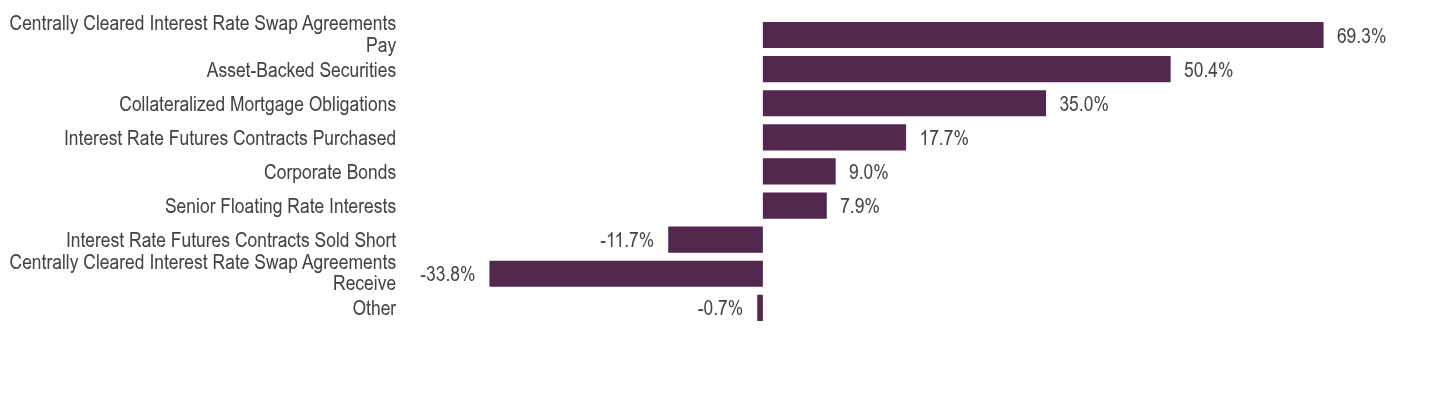
Holdings DiversificationFootnote Reference3 (% of Net Assets) as of March 31, 2026 Table SummaryValue | Value |
|---|
Other | -0.7% | Centrally Cleared Interest Rate Swap Agreements Receive | -33.8% | Interest Rate Futures Contracts Sold Short | -11.7% | Senior Floating Rate Interests | 7.9% | Corporate Bonds | 9.0% | Interest Rate Futures Contracts Purchased | 17.7% | Collateralized Mortgage Obligations | 35.0% | Asset-Backed Securities | 50.4% | Centrally Cleared Interest Rate Swap Agreements Pay | 69.3% | |
| Largest Holdings [Text Block] |
10 Largest HoldingsFootnote Reference2 (% of Net Assets) as of March 31, 2026 Table SummaryOwl Rock CLO X LLC 2023-10A AR, 5.06% (3 Month Term SOFR + 1.39%, Rate Floor: 1.39%) due 04/20/37 | 3.4% |
|---|
Slam Ltd. 2024-1A, 5.34% due 09/15/49 | 2.2% |
|---|
NLT Trust 2026-NQM1, 6.61% due 02/25/71 | 1.8% |
|---|
NLT Trust 2025-NQM1, 7.46% (WAC) due 10/25/70 | 1.6% |
|---|
Owl Rock CLO III Ltd. 2020-3A AR, 5.52% (3 Month Term SOFR + 1.85%, Rate Floor: 1.85%) due 04/20/36 | 1.5% |
|---|
Freddie Mac 5.50% due 02/01/56 | 1.3% |
|---|
Uniform MBS 15 Year 4.50% due 05/01/41 | 1.3% |
|---|
CIFC Funding Ltd. 2022-1A B, 5.47% (3 Month Term SOFR + 1.80%, Rate Floor: 1.80%) due 04/17/35 | 1.2% |
|---|
Palmer Square CLO Ltd. 2024-3A B, 5.27% (3 Month Term SOFR + 1.60%, Rate Floor: 1.60%) due 07/20/37 | 1.2% |
|---|
Golub Capital Partners CLO 46M Ltd. 2019-46A A1R, 5.48% (3 Month Term SOFR + 1.81%, Rate Floor: 1.81%) due 04/20/37 | 1.2% |
|---|
Total | 16.7% |
|---|
|
| Material Fund Change [Text Block] |
|
| C000136517 |
|
| Shareholder Report [Line Items] |
|
| Fund Name |
Guggenheim Core Bond Fund
|
| Class Name |
Class A
|
| Trading Symbol |
SIUSX
|
| Annual or Semi-Annual Statement [Text Block] |
This semi-annual shareholder report contains important information about the Guggenheim Core Bond Fund for the period from October 1, 2025 to March 31, 2026.
|
| Shareholder Report Annual or Semi-Annual |
Semi-Annual Shareholder Report
|
| Additional Information [Text Block] |
You can find additional information about the fund at GuggenheimInvestments.com/mutual-funds/literature. You can also request this information by contacting 800 820 0888 or services@guggenheiminvestments.com.
|
| Additional Information Phone Number |
800 820 0888
|
| Additional Information Email |
<span style="box-sizing: border-box; color: rgb(67, 67, 67); display: inline; flex-wrap: nowrap; font-size: 10.6667px; font-weight: 400; grid-area: auto; line-height: 12.8px; margin: 0px; overflow: visible; text-align: left; text-align-last: auto; white-space-collapse: preserve-breaks;">services@guggenheiminvestments.com</span>
|
| Additional Information Website |
<span style="box-sizing: border-box; color: rgb(67, 67, 67); display: inline; flex-wrap: nowrap; font-size: 10.6667px; font-weight: 400; grid-area: auto; line-height: 12.8px; margin: 0px; overflow: visible; text-align: left; text-align-last: auto; white-space-collapse: preserve-breaks;">GuggenheimInvestments.com/mutual-funds/literature</span>
|
| Expenses [Text Block] |
What were the Fund's costs for the last six months? * Based on a hypothetical $10,000 investment Table SummaryClass | Costs of a $10,000 Investment | Costs Paid as a % of a $10,000 Investment** |
|---|
Class A | $38 | 0.75% |
|---|
Table Summary* | Excludes expenses of the underlying funds in which the fund invests, if any. |
|---|
** | Annualized |
|---|
|
| Expenses Paid, Amount |
$ 38
|
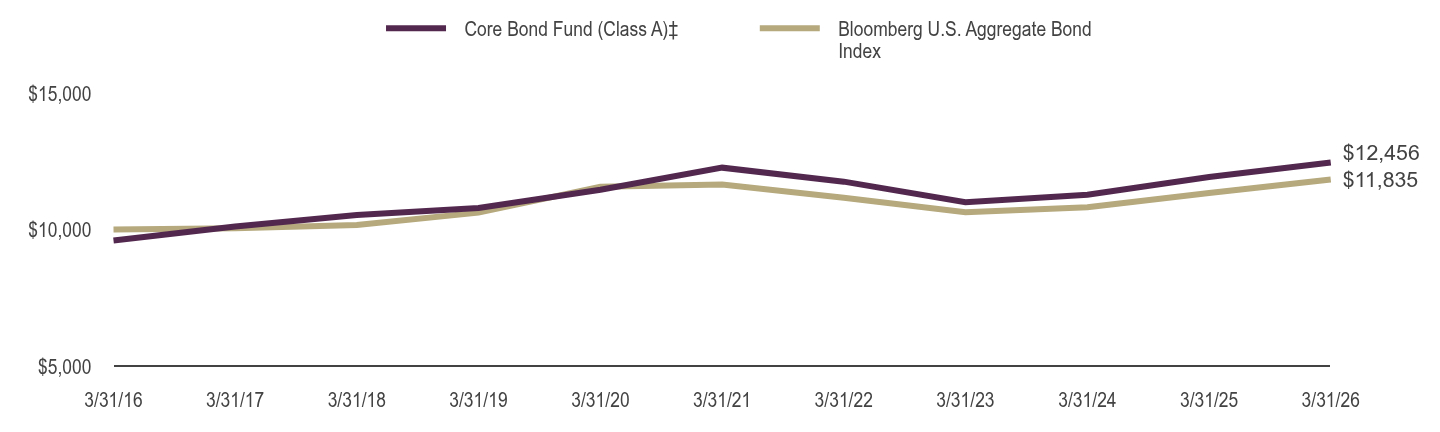
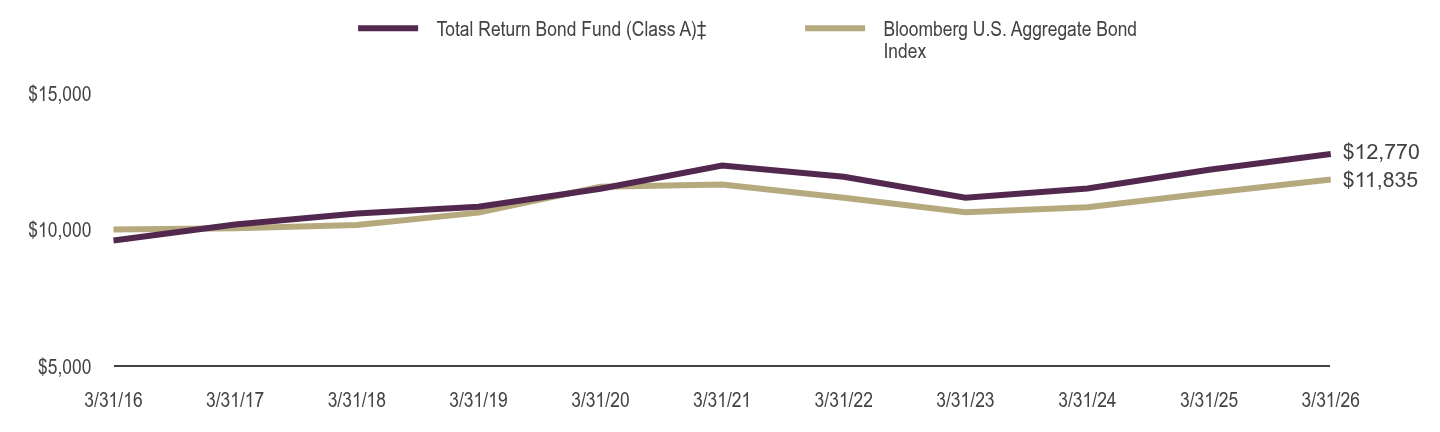
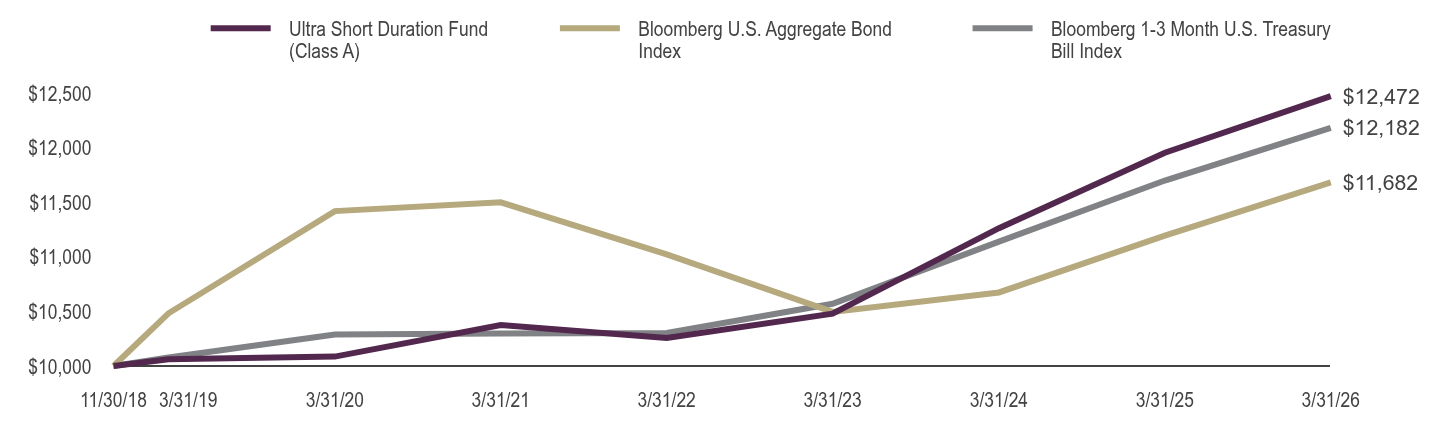
| Factors Affecting Performance [Text Block] |
What factors materially affected the Fund's performance over the last six months? Positive performance over the period was driven by carry (or earned income), attributable to the fund's allocations to high-grade securitized credit sectors. Duration was the largest detractor from performance as rates rose over the period. The net impact of spread movements on performance was roughly neutral, as widening across corporate and structured credit sectors due to heightened geopolitical tensions was largely offset by tightening within the Fund’s Agency residential mortgage-backed securities (RMBS). |
| Line Graph [Table Text Block] |
Table Summary | Core Bond Fund (Class A)‡ | Bloomberg U.S. Aggregate Bond Index |
|---|
3/31/16 | $9,600 | $10,000 |
|---|
3/31/17 | $10,116 | $10,044 |
|---|
3/31/18 | $10,535 | $10,165 |
|---|
3/31/19 | $10,794 | $10,620 |
|---|
3/31/20 | $11,461 | $11,569 |
|---|
3/31/21 | $12,269 | $11,651 |
|---|
3/31/22 | $11,756 | $11,168 |
|---|
3/31/23 | $11,005 | $10,633 |
|---|
3/31/24 | $11,278 | $10,814 |
|---|
3/31/25 | $11,923 | $11,342 |
|---|
3/31/26 | $12,456 | $11,835 |
|---|
|
| AssetsNet |
$ 2,822,914,126
|
| Holdings Count | Holding |
1,131
|
| InvestmentCompanyPortfolioTurnover |
45.00%
|
| Additional Fund Statistics [Text Block] |
Fund Statistics as of March 31, 2026 - Net Assets$2,822,914,126
- Total Number of Portfolio Holdings1,131
- Portfolio Turnover Rate45%
|
| Holdings [Text Block] |
Portfolio Composition by Quality RatingFootnote Reference1 (% of Total Investments) as of March 31, 2026 Table SummaryAAA | 25.6% |
|---|
AA | 41.2% |
|---|
A | 16.1% |
|---|
BBB | 15.3% |
|---|
BB | 0.9% |
|---|
CCC | 0.0% |
|---|
C | 0.0% |
|---|
NRFootnote Referencea | 0.3% |
|---|
Other Investments | 0.6% |
|---|
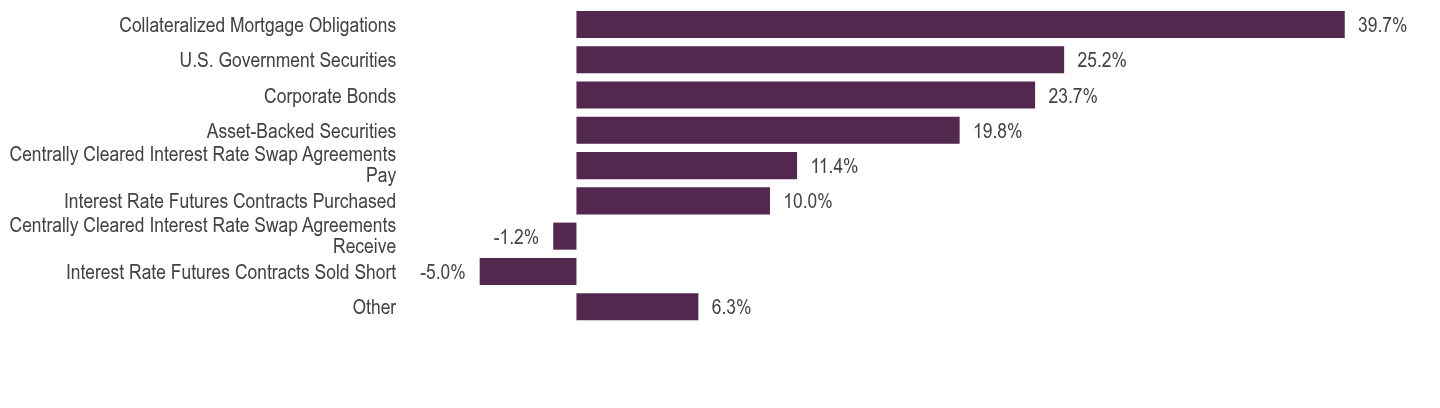
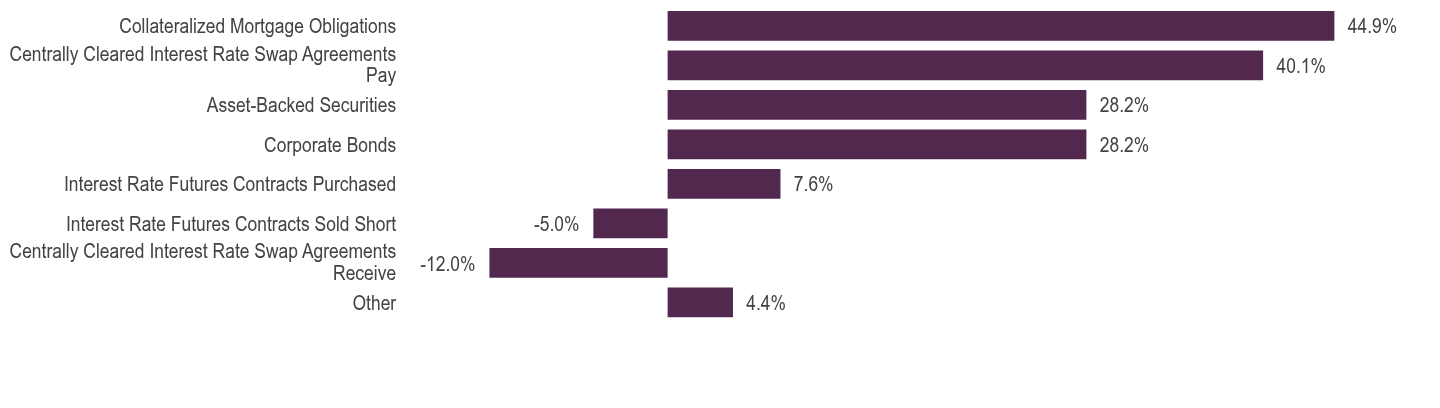
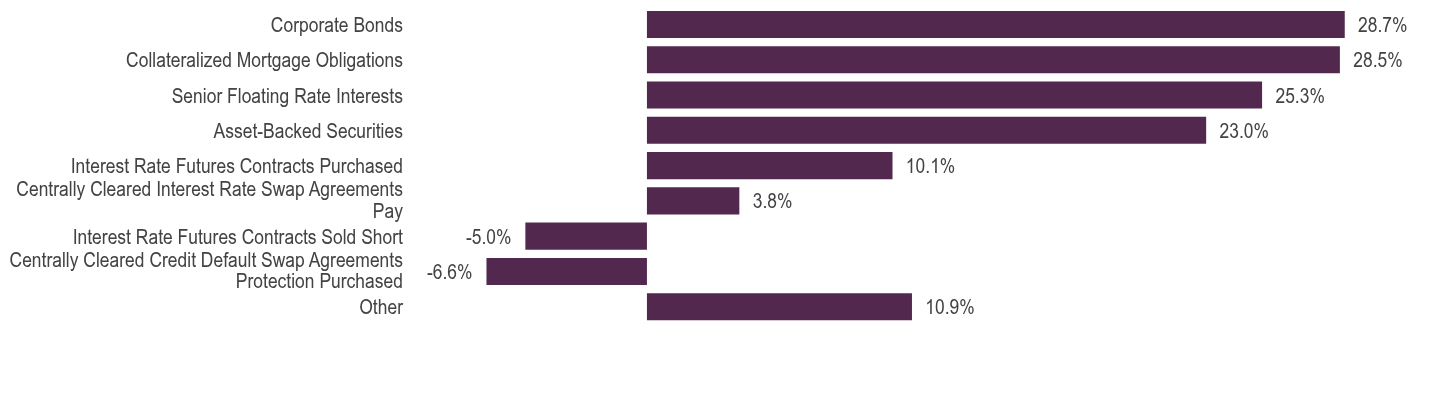
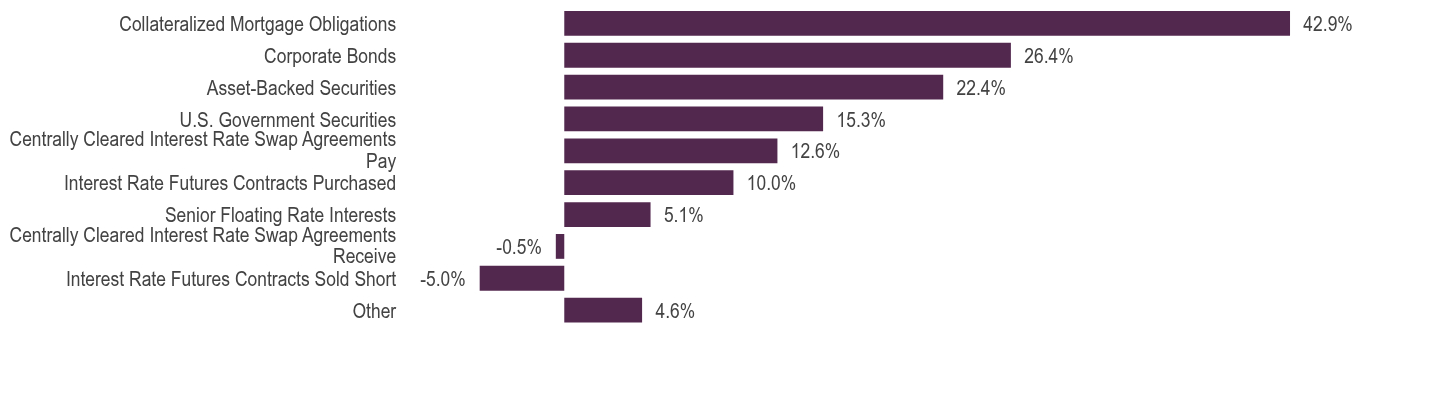
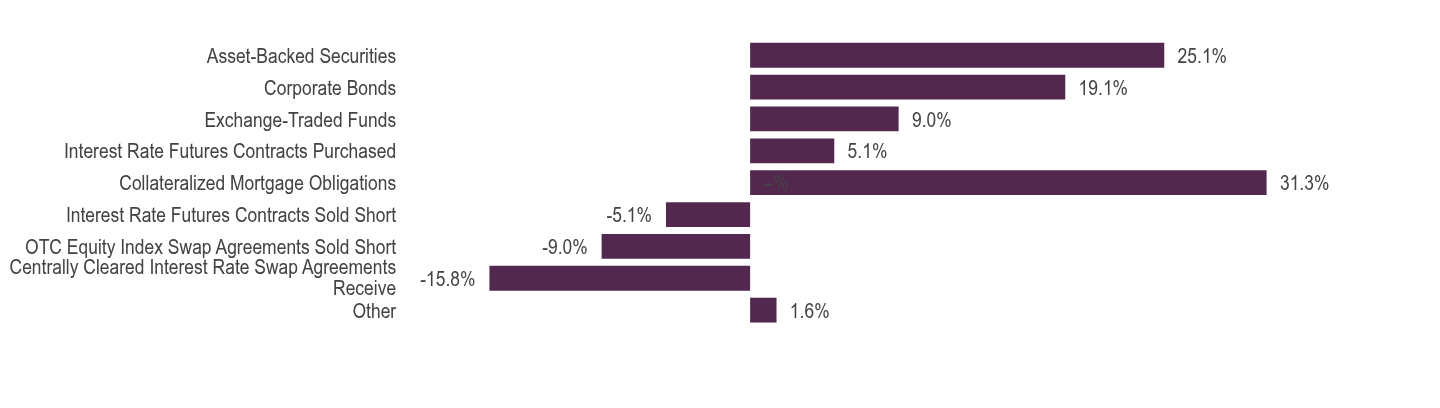
Holdings DiversificationFootnote Reference3 (% of Net Assets) as of March 31, 2026 Table SummaryValue | Value |
|---|
Other | 6.3% | Interest Rate Futures Contracts Sold Short | -5.0% | Centrally Cleared Interest Rate Swap Agreements Receive | -1.2% | Interest Rate Futures Contracts Purchased | 10.0% | Centrally Cleared Interest Rate Swap Agreements Pay | 11.4% | Asset-Backed Securities | 19.8% | Corporate Bonds | 23.7% | U.S. Government Securities | 25.2% | Collateralized Mortgage Obligations | 39.7% | |
| Largest Holdings [Text Block] |
10 Largest HoldingsFootnote Reference2 (% of Net Assets) as of March 31, 2026 Table SummaryUniform MBS 30 Year 5.00% due 06/01/56 | 5.8% |
|---|
Uniform MBS 30 Year 3.00% due 05/01/56 | 3.3% |
|---|
Fannie Mae 5.50% due 11/01/55 | 3.1% |
|---|
U.S. Treasury Bonds 1.75% due 08/15/41 | 2.8% |
|---|
Ginnie Mae 5.00% due 06/20/56 | 2.5% |
|---|
U.S. Treasury Notes 3.63% due 03/31/28 | 2.3% |
|---|
U.S. Treasury Notes 4.00% due 07/31/32 | 2.3% |
|---|
U.S. Treasury Notes 4.63% due 04/30/31 | 2.2% |
|---|
Uniform MBS 30 Year 2.50% due 05/01/56 | 2.1% |
|---|
U.S. Treasury Inflation Indexed Bonds 1.88% due 07/15/35 | 1.9% |
|---|
Total | 28.3% |
|---|
|
| Material Fund Change [Text Block] |
|
| C000136519 |
|
| Shareholder Report [Line Items] |
|
| Fund Name |
Guggenheim Core Bond Fund
|
| Class Name |
Class C
|
| Trading Symbol |
SDICX
|
| Annual or Semi-Annual Statement [Text Block] |
This semi-annual shareholder report contains important information about the Guggenheim Core Bond Fund for the period from October 1, 2025 to March 31, 2026.
|
| Shareholder Report Annual or Semi-Annual |
Semi-Annual Shareholder Report
|
| Additional Information [Text Block] |
You can find additional information about the fund at GuggenheimInvestments.com/mutual-funds/literature. You can also request this information by contacting 800 820 0888 or services@guggenheiminvestments.com.
|
| Additional Information Phone Number |
800 820 0888
|
| Additional Information Email |
<span style="box-sizing: border-box; color: rgb(67, 67, 67); display: inline; flex-wrap: nowrap; font-size: 10.6667px; font-weight: 400; grid-area: auto; line-height: 12.8px; margin: 0px; overflow: visible; text-align: left; text-align-last: auto; white-space-collapse: preserve-breaks;">services@guggenheiminvestments.com</span>
|
| Additional Information Website |
<span style="box-sizing: border-box; color: rgb(67, 67, 67); display: inline; flex-wrap: nowrap; font-size: 10.6667px; font-weight: 400; grid-area: auto; line-height: 12.8px; margin: 0px; overflow: visible; text-align: left; text-align-last: auto; white-space-collapse: preserve-breaks;">GuggenheimInvestments.com/mutual-funds/literature</span>
|
| Expenses [Text Block] |
What were the Fund's costs for the last six months? * Based on a hypothetical $10,000 investment Table SummaryClass | Costs of a $10,000 Investment | Costs Paid as a % of a $10,000 Investment** |
|---|
Class C | $75 | 1.50% |
|---|
Table Summary* | Excludes expenses of the underlying funds in which the fund invests, if any. |
|---|
** | Annualized |
|---|
|
| Expenses Paid, Amount |
$ 75
|
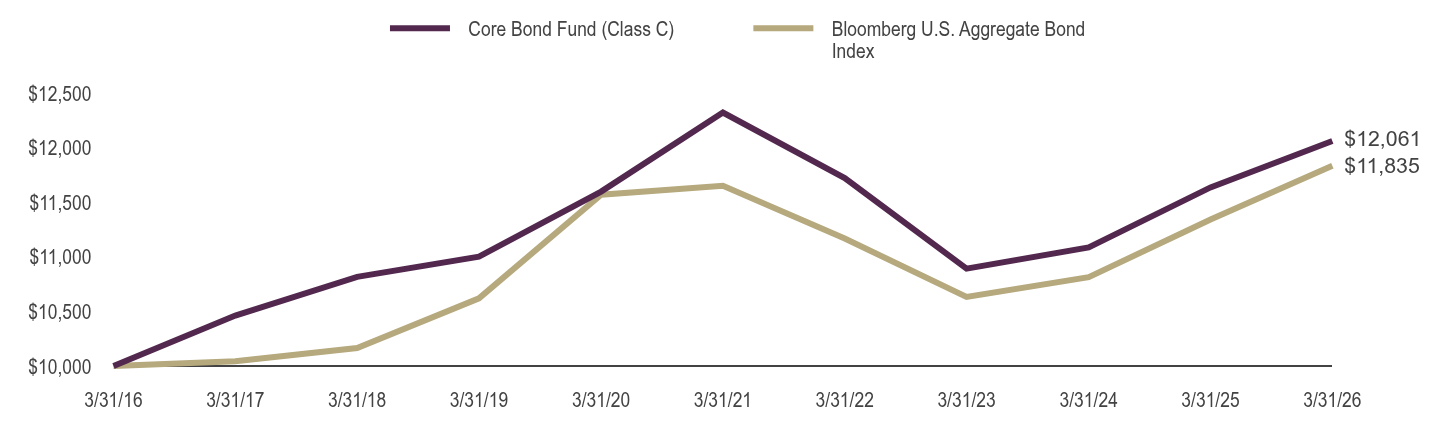
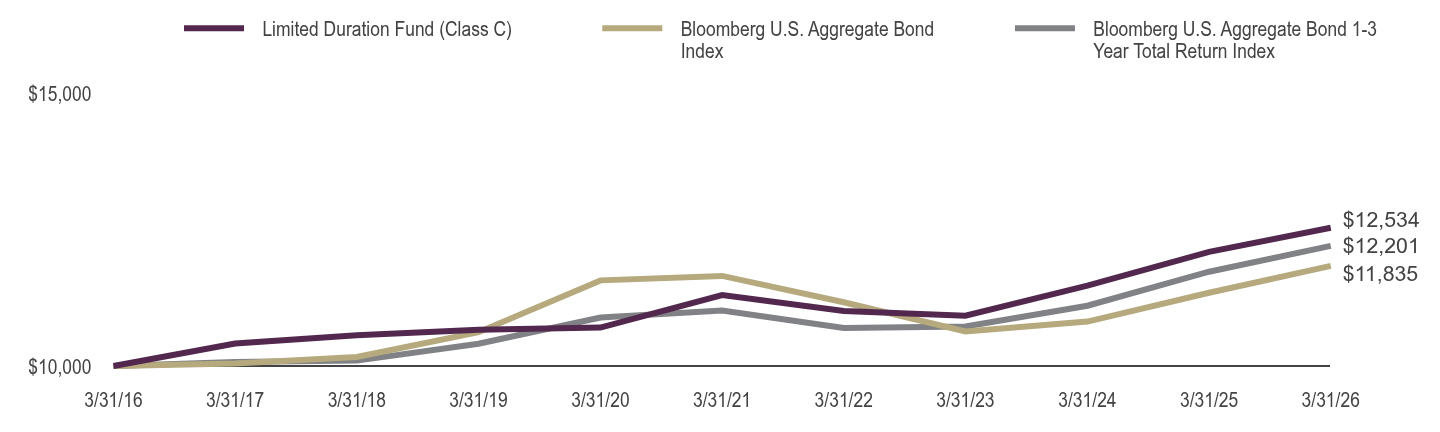
| Factors Affecting Performance [Text Block] |
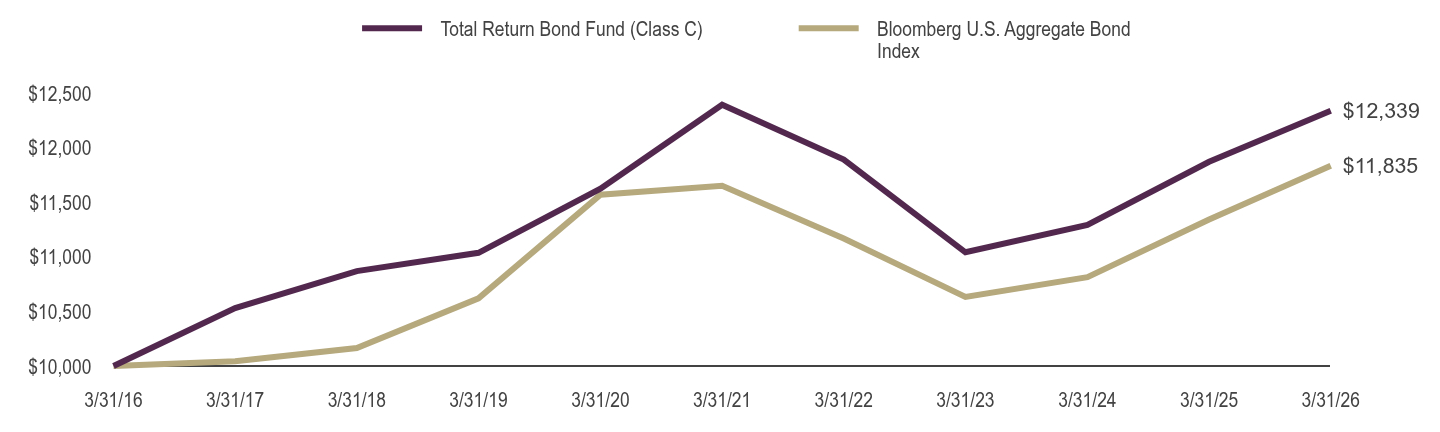
What factors materially affected the Fund's performance over the last six months? Positive performance over the period was driven by carry (or earned income), attributable to the fund's allocations to high-grade securitized credit sectors. Duration was the largest detractor from performance as rates rose over the period. The net impact of spread movements on performance was roughly neutral, as widening across corporate and structured credit sectors due to heightened geopolitical tensions was largely offset by tightening within the Fund’s Agency residential mortgage-backed securities (RMBS). |
| Line Graph [Table Text Block] |
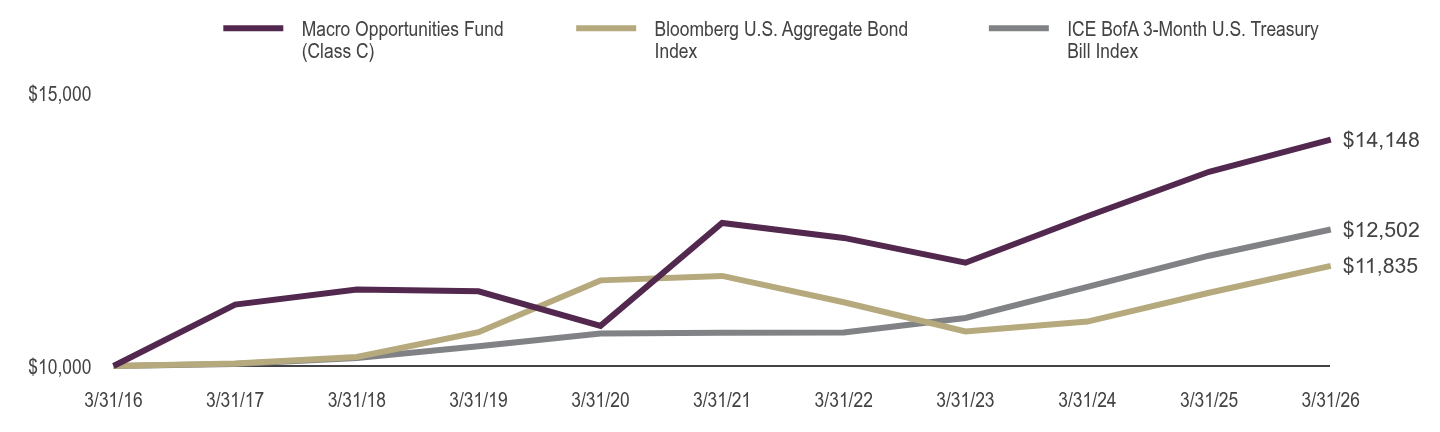
Table Summary | Core Bond Fund (Class C) | Bloomberg U.S. Aggregate Bond Index |
|---|
3/31/16 | $10,000 | $10,000 |
|---|
3/31/17 | $10,462 | $10,044 |
|---|
3/31/18 | $10,817 | $10,165 |
|---|
3/31/19 | $11,002 | $10,620 |
|---|
3/31/20 | $11,598 | $11,569 |
|---|
3/31/21 | $12,322 | $11,651 |
|---|
3/31/22 | $11,722 | $11,168 |
|---|
3/31/23 | $10,892 | $10,633 |
|---|
3/31/24 | $11,086 | $10,814 |
|---|
3/31/25 | $11,636 | $11,342 |
|---|
3/31/26 | $12,061 | $11,835 |
|---|
|
| AssetsNet |
$ 2,822,914,126
|
| Holdings Count | Holding |
1,131
|
| InvestmentCompanyPortfolioTurnover |
45.00%
|
| Additional Fund Statistics [Text Block] |
Fund Statistics as of March 31, 2026 - Net Assets$2,822,914,126
- Total Number of Portfolio Holdings1,131
- Portfolio Turnover Rate45%
|
| Holdings [Text Block] |
Portfolio Composition by Quality RatingFootnote Reference1 (% of Total Investments) as of March 31, 2026 Table SummaryAAA | 25.6% |
|---|
AA | 41.2% |
|---|
A | 16.1% |
|---|
BBB | 15.3% |
|---|
BB | 0.9% |
|---|
CCC | 0.0% |
|---|
C | 0.0% |
|---|
NRFootnote Referencea | 0.3% |
|---|
Other Investments | 0.6% |
|---|
Holdings DiversificationFootnote Reference3 (% of Net Assets) as of March 31, 2026 Table SummaryValue | Value |
|---|
Other | 6.3% | Interest Rate Futures Contracts Sold Short | -5.0% | Centrally Cleared Interest Rate Swap Agreements Receive | -1.2% | Interest Rate Futures Contracts Purchased | 10.0% | Centrally Cleared Interest Rate Swap Agreements Pay | 11.4% | Asset-Backed Securities | 19.8% | Corporate Bonds | 23.7% | U.S. Government Securities | 25.2% | Collateralized Mortgage Obligations | 39.7% | |
| Largest Holdings [Text Block] |
10 Largest HoldingsFootnote Reference2 (% of Net Assets) as of March 31, 2026 Table SummaryUniform MBS 30 Year 5.00% due 06/01/56 | 5.8% |
|---|
Uniform MBS 30 Year 3.00% due 05/01/56 | 3.3% |
|---|
Fannie Mae 5.50% due 11/01/55 | 3.1% |
|---|
U.S. Treasury Bonds 1.75% due 08/15/41 | 2.8% |
|---|
Ginnie Mae 5.00% due 06/20/56 | 2.5% |
|---|
U.S. Treasury Notes 3.63% due 03/31/28 | 2.3% |
|---|
U.S. Treasury Notes 4.00% due 07/31/32 | 2.3% |
|---|
U.S. Treasury Notes 4.63% due 04/30/31 | 2.2% |
|---|
Uniform MBS 30 Year 2.50% due 05/01/56 | 2.1% |
|---|
U.S. Treasury Inflation Indexed Bonds 1.88% due 07/15/35 | 1.9% |
|---|
Total | 28.3% |
|---|
|
| Material Fund Change [Text Block] |
|
| C000155968 |
|
| Shareholder Report [Line Items] |
|
| Fund Name |
Guggenheim Core Bond Fund
|
| Class Name |
Class P
|
| Trading Symbol |
SIUPX
|
| Annual or Semi-Annual Statement [Text Block] |
This semi-annual shareholder report contains important information about the Guggenheim Core Bond Fund for the period from October 1, 2025 to March 31, 2026.
|
| Shareholder Report Annual or Semi-Annual |
Semi-Annual Shareholder Report
|
| Additional Information [Text Block] |
You can find additional information about the fund at GuggenheimInvestments.com/mutual-funds/literature. You can also request this information by contacting 800 820 0888 or services@guggenheiminvestments.com.
|
| Additional Information Phone Number |
800 820 0888
|
| Additional Information Email |
<span style="box-sizing: border-box; color: rgb(67, 67, 67); display: inline; flex-wrap: nowrap; font-size: 10.6667px; font-weight: 400; grid-area: auto; line-height: 12.8px; margin: 0px; overflow: visible; text-align: left; text-align-last: auto; white-space-collapse: preserve-breaks;">services@guggenheiminvestments.com</span>
|
| Additional Information Website |
<span style="box-sizing: border-box; color: rgb(67, 67, 67); display: inline; flex-wrap: nowrap; font-size: 10.6667px; font-weight: 400; grid-area: auto; line-height: 12.8px; margin: 0px; overflow: visible; text-align: left; text-align-last: auto; white-space-collapse: preserve-breaks;">GuggenheimInvestments.com/mutual-funds/literature</span>
|
| Expenses [Text Block] |
What were the Fund's costs for the last six months? * Based on a hypothetical $10,000 investment Table SummaryClass | Costs of a $10,000 Investment | Costs Paid as a % of a $10,000 Investment** |
|---|
Class P | $38 | 0.75% |
|---|
Table Summary* | Excludes expenses of the underlying funds in which the fund invests, if any. |
|---|
** | Annualized |
|---|
|
| Expenses Paid, Amount |
$ 38
|
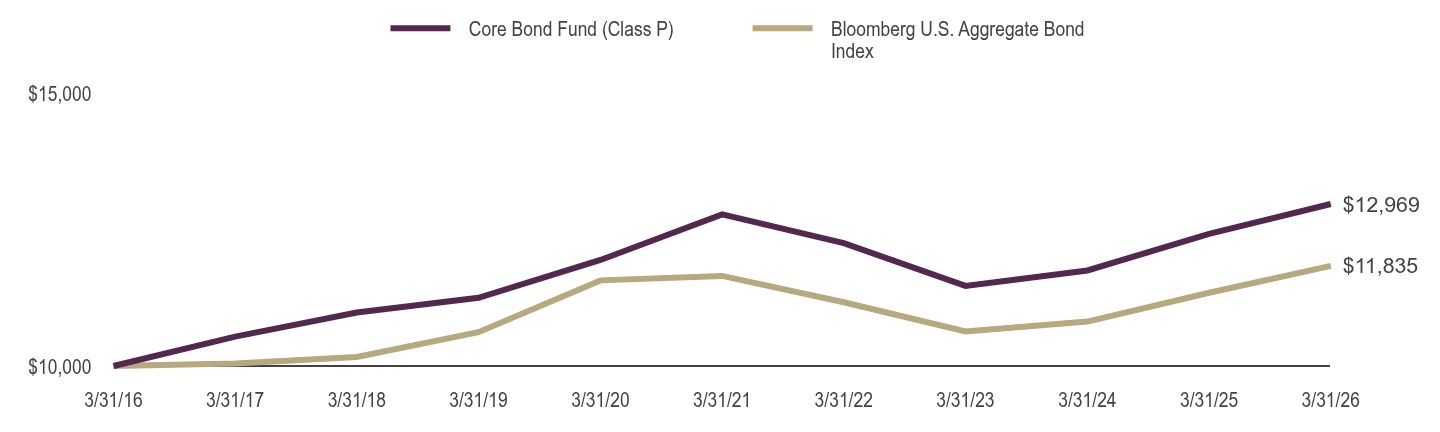
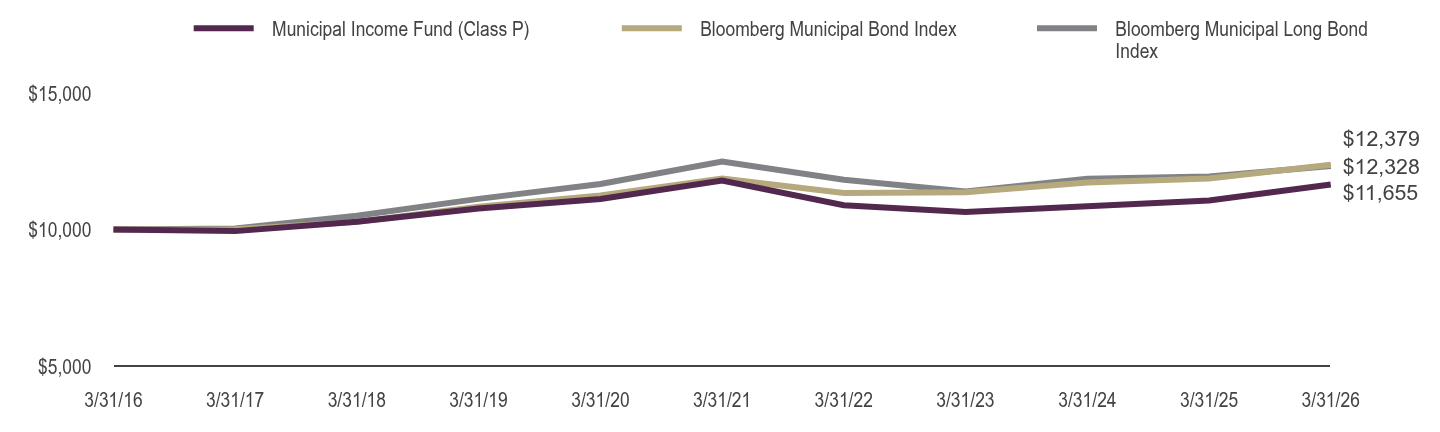
| Factors Affecting Performance [Text Block] |
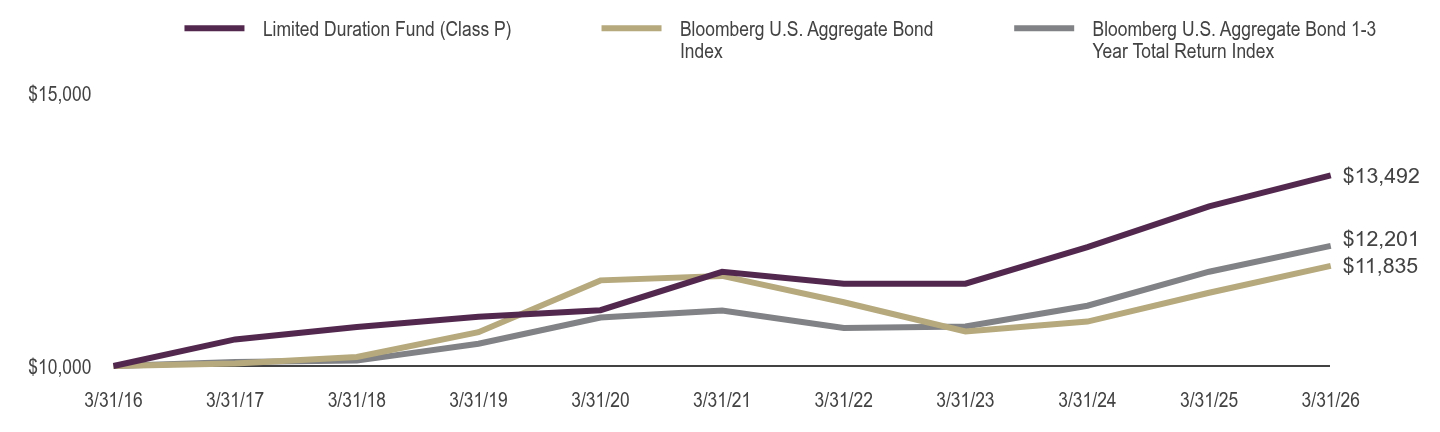
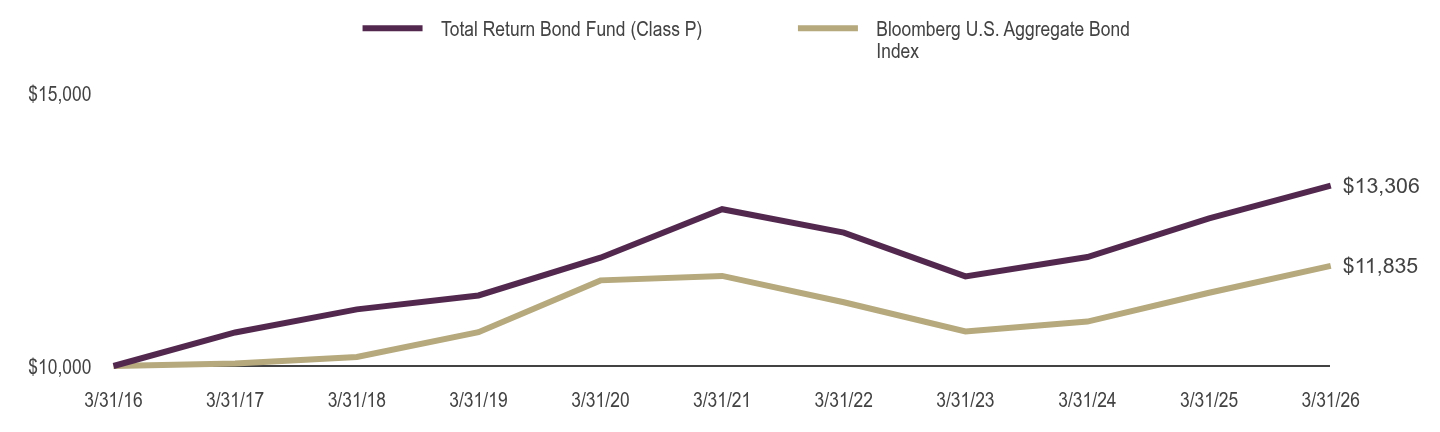
What factors materially affected the Fund's performance over the last six months? Positive performance over the period was driven by carry (or earned income), attributable to the fund's allocations to high-grade securitized credit sectors. Duration was the largest detractor from performance as rates rose over the period. The net impact of spread movements on performance was roughly neutral, as widening across corporate and structured credit sectors due to heightened geopolitical tensions was largely offset by tightening within the Fund’s Agency residential mortgage-backed securities (RMBS). |
| Line Graph [Table Text Block] |
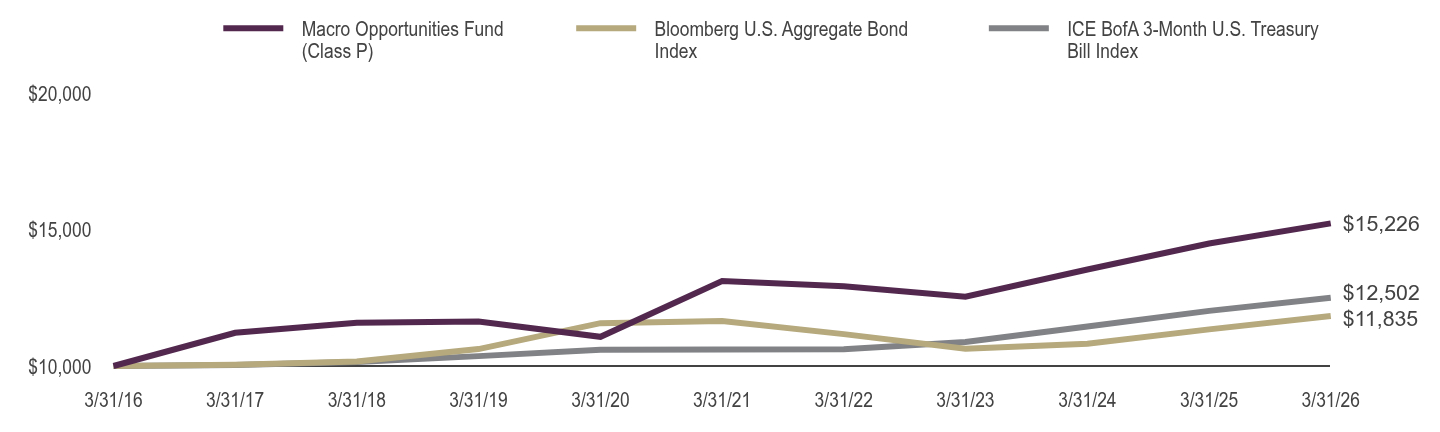
Table Summary | Core Bond Fund (Class P) | Bloomberg U.S. Aggregate Bond Index |
|---|
3/31/16 | $10,000 | $10,000 |
|---|
3/31/17 | $10,539 | $10,044 |
|---|
3/31/18 | $10,980 | $10,165 |
|---|
3/31/19 | $11,250 | $10,620 |
|---|
3/31/20 | $11,943 | $11,569 |
|---|
3/31/21 | $12,779 | $11,651 |
|---|
3/31/22 | $12,251 | $11,168 |
|---|
3/31/23 | $11,467 | $10,633 |
|---|
3/31/24 | $11,750 | $10,814 |
|---|
3/31/25 | $12,421 | $11,342 |
|---|
3/31/26 | $12,969 | $11,835 |
|---|
|
| AssetsNet |
$ 2,822,914,126
|
| Holdings Count | Holding |
1,131
|
| InvestmentCompanyPortfolioTurnover |
45.00%
|
| Additional Fund Statistics [Text Block] |
Fund Statistics as of March 31, 2026 - Net Assets$2,822,914,126
- Total Number of Portfolio Holdings1,131
- Portfolio Turnover Rate45%
|
| Holdings [Text Block] |
Portfolio Composition by Quality RatingFootnote Reference1 (% of Total Investments) as of March 31, 2026 Table SummaryAAA | 25.6% |
|---|
AA | 41.2% |
|---|
A | 16.1% |
|---|
BBB | 15.3% |
|---|
BB | 0.9% |
|---|
CCC | 0.0% |
|---|
C | 0.0% |
|---|
NRFootnote Referencea | 0.3% |
|---|
Other Investments | 0.6% |
|---|
Holdings DiversificationFootnote Reference3 (% of Net Assets) as of March 31, 2026 Table SummaryValue | Value |
|---|
Other | 6.3% | Interest Rate Futures Contracts Sold Short | -5.0% | Centrally Cleared Interest Rate Swap Agreements Receive | -1.2% | Interest Rate Futures Contracts Purchased | 10.0% | Centrally Cleared Interest Rate Swap Agreements Pay | 11.4% | Asset-Backed Securities | 19.8% | Corporate Bonds | 23.7% | U.S. Government Securities | 25.2% | Collateralized Mortgage Obligations | 39.7% | |
| Largest Holdings [Text Block] |
10 Largest HoldingsFootnote Reference2 (% of Net Assets) as of March 31, 2026 Table SummaryUniform MBS 30 Year 5.00% due 06/01/56 | 5.8% |
|---|
Uniform MBS 30 Year 3.00% due 05/01/56 | 3.3% |
|---|
Fannie Mae 5.50% due 11/01/55 | 3.1% |
|---|
U.S. Treasury Bonds 1.75% due 08/15/41 | 2.8% |
|---|
Ginnie Mae 5.00% due 06/20/56 | 2.5% |
|---|
U.S. Treasury Notes 3.63% due 03/31/28 | 2.3% |
|---|
U.S. Treasury Notes 4.00% due 07/31/32 | 2.3% |
|---|
U.S. Treasury Notes 4.63% due 04/30/31 | 2.2% |
|---|
Uniform MBS 30 Year 2.50% due 05/01/56 | 2.1% |
|---|
U.S. Treasury Inflation Indexed Bonds 1.88% due 07/15/35 | 1.9% |
|---|
Total | 28.3% |
|---|
|
| Material Fund Change [Text Block] |
|
| C000136520 |
|
| Shareholder Report [Line Items] |
|
| Fund Name |
Guggenheim Core Bond Fund
|
| Class Name |
Institutional Class
|
| Trading Symbol |
GIUSX
|
| Annual or Semi-Annual Statement [Text Block] |
This semi-annual shareholder report contains important information about the Guggenheim Core Bond Fund for the period from October 1, 2025 to March 31, 2026.
|
| Shareholder Report Annual or Semi-Annual |
Semi-Annual Shareholder Report
|
| Additional Information [Text Block] |
You can find additional information about the fund at GuggenheimInvestments.com/mutual-funds/literature. You can also request this information by contacting 800 820 0888 or services@guggenheiminvestments.com.
|
| Additional Information Phone Number |
800 820 0888
|
| Additional Information Email |
<span style="box-sizing: border-box; color: rgb(67, 67, 67); display: inline; flex-wrap: nowrap; font-size: 10.6667px; font-weight: 400; grid-area: auto; line-height: 12.8px; margin: 0px; overflow: visible; text-align: left; text-align-last: auto; white-space-collapse: preserve-breaks;">services@guggenheiminvestments.com</span>
|
| Additional Information Website |
<span style="box-sizing: border-box; color: rgb(67, 67, 67); display: inline; flex-wrap: nowrap; font-size: 10.6667px; font-weight: 400; grid-area: auto; line-height: 12.8px; margin: 0px; overflow: visible; text-align: left; text-align-last: auto; white-space-collapse: preserve-breaks;">GuggenheimInvestments.com/mutual-funds/literature</span>
|
| Expenses [Text Block] |
What were the Fund's costs for the last six months? * Based on a hypothetical $10,000 investment Table SummaryClass | Costs of a $10,000 Investment | Costs Paid as a % of a $10,000 Investment** |
|---|
Institutional Class | $23 | 0.46% |
|---|
Table Summary* | Excludes expenses of the underlying funds in which the fund invests, if any. |
|---|
** | Annualized |
|---|
|
| Expenses Paid, Amount |
$ 23
|
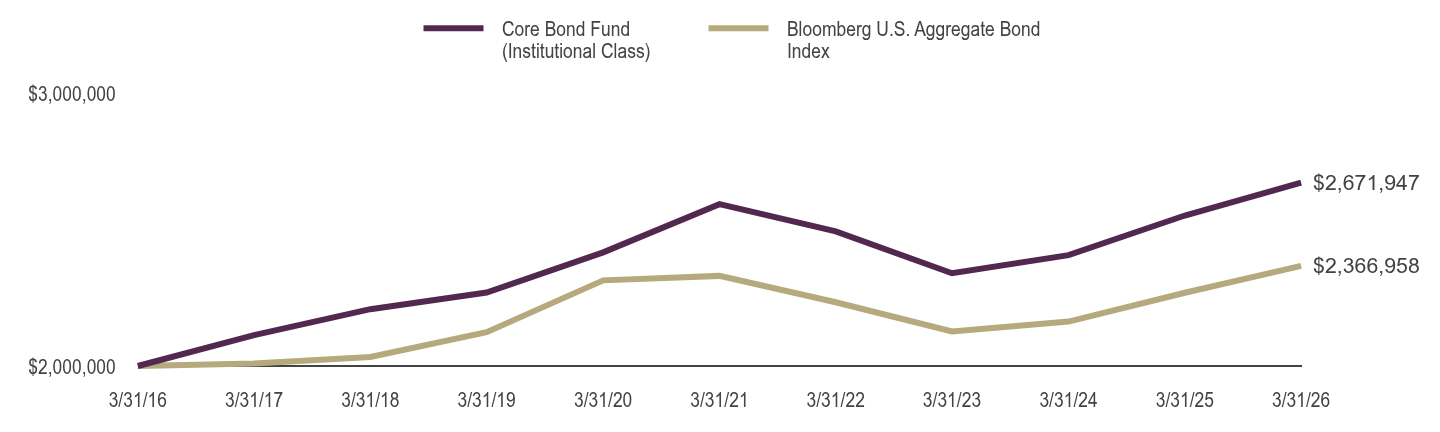
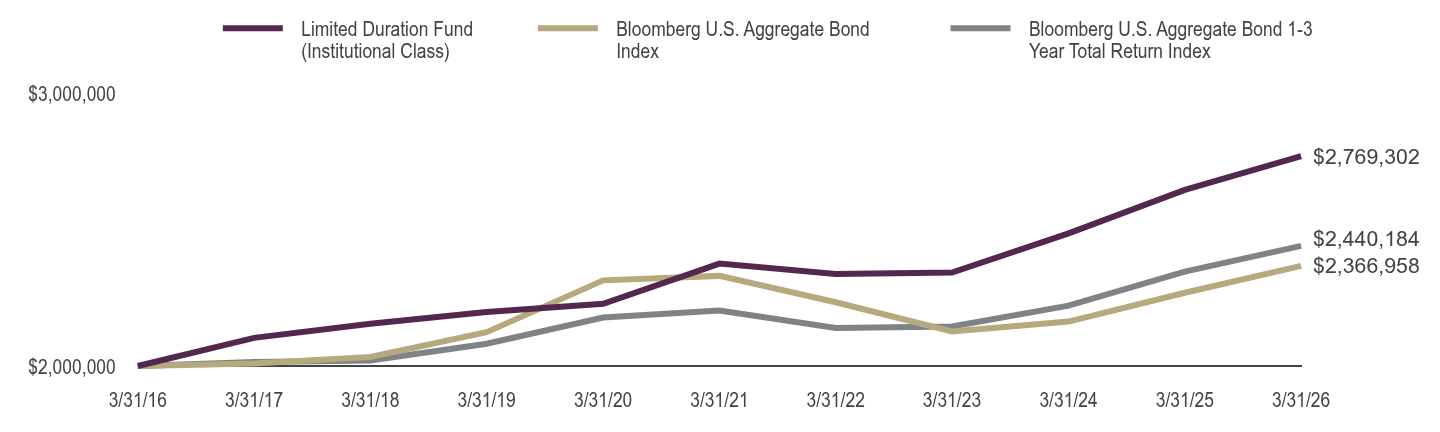
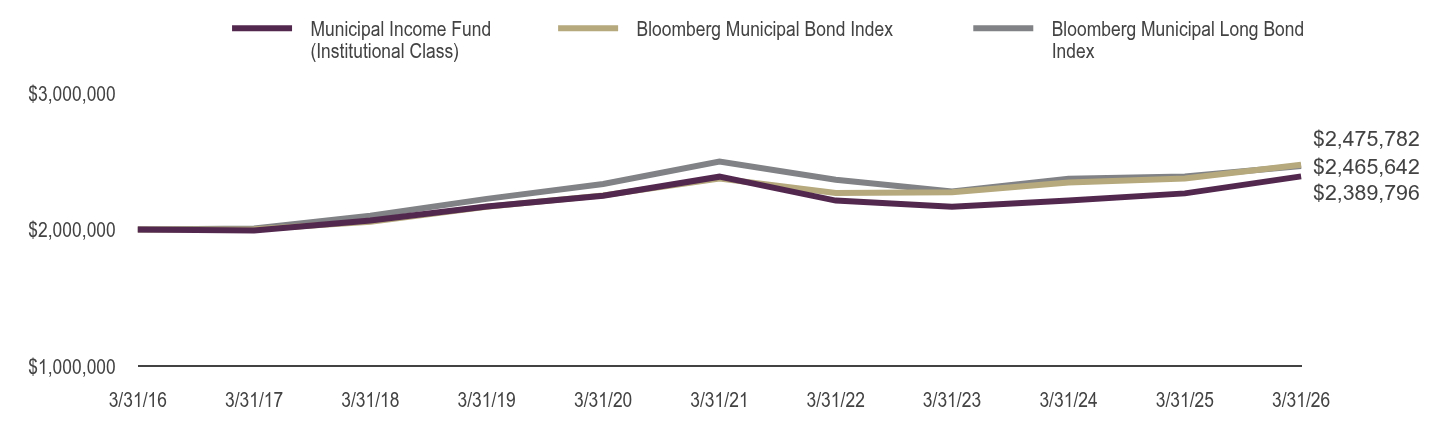
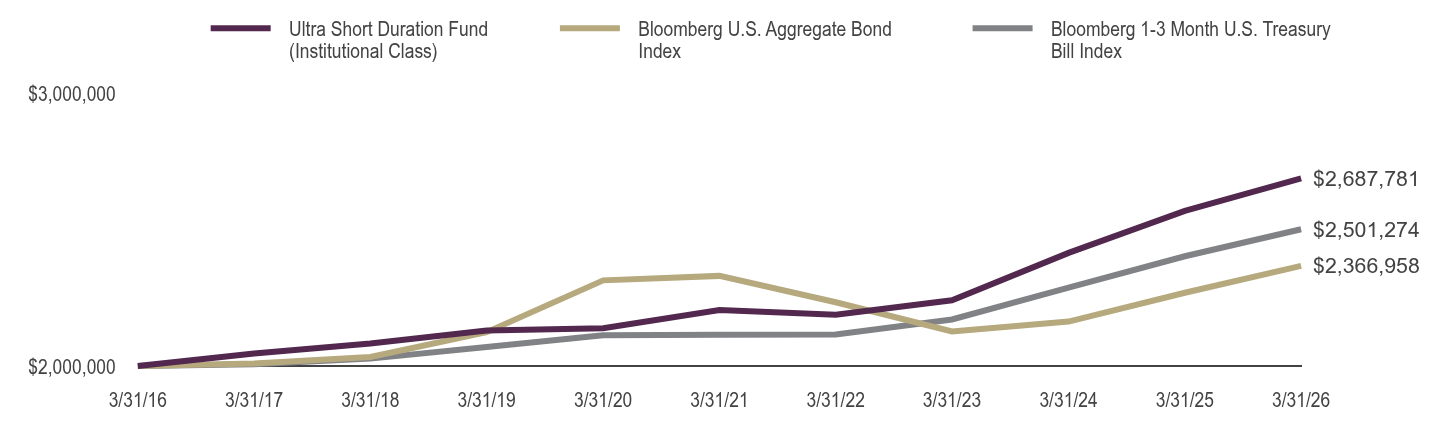
| Factors Affecting Performance [Text Block] |
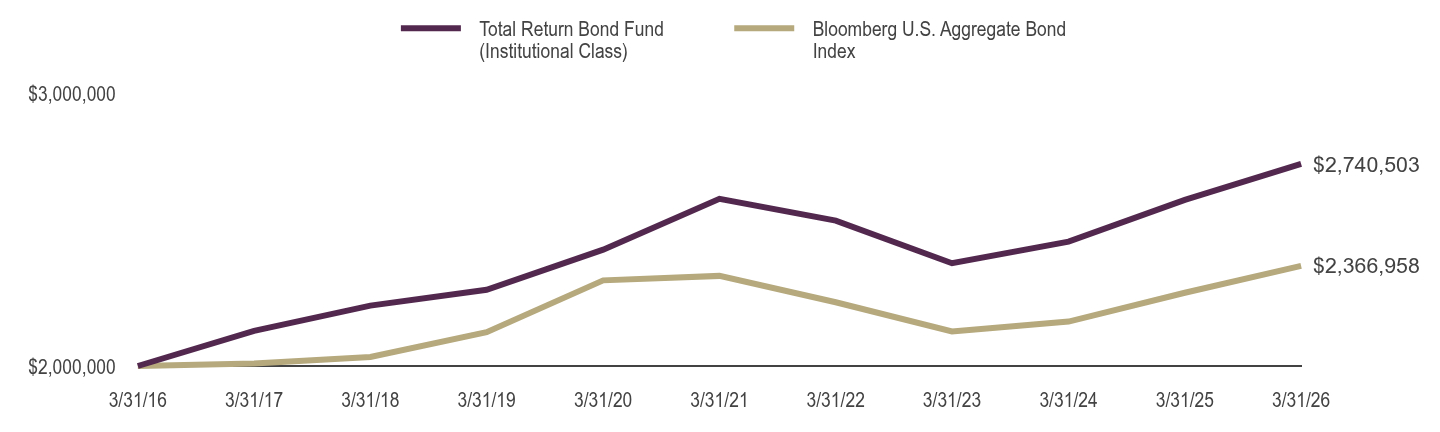
What factors materially affected the Fund's performance over the last six months? Positive performance over the period was driven by carry (or earned income), attributable to the fund's allocations to high-grade securitized credit sectors. Duration was the largest detractor from performance as rates rose over the period. The net impact of spread movements on performance was roughly neutral, as widening across corporate and structured credit sectors due to heightened geopolitical tensions was largely offset by tightening within the Fund’s Agency residential mortgage-backed securities (RMBS). |
| Line Graph [Table Text Block] |
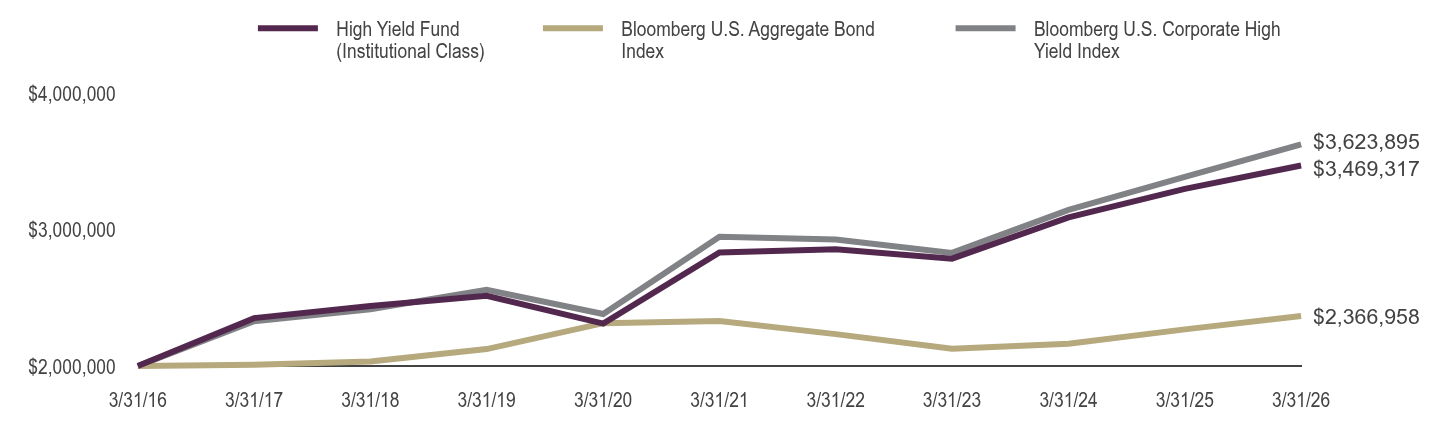
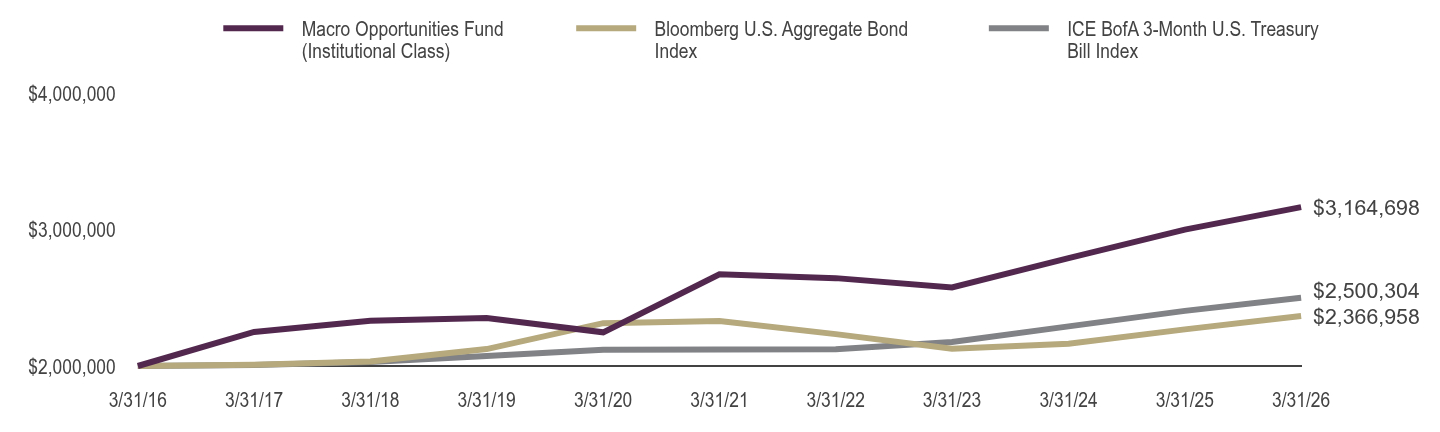
Table Summary | Core Bond Fund (Institutional Class) | Bloomberg U.S. Aggregate Bond Index |
|---|
3/31/16 | $2,000,000 | $2,000,000 |
|---|
3/31/17 | $2,113,208 | $2,008,812 |
|---|
3/31/18 | $2,208,211 | $2,032,978 |
|---|
3/31/19 | $2,269,078 | $2,124,067 |
|---|
3/31/20 | $2,416,413 | $2,313,827 |
|---|
3/31/21 | $2,593,295 | $2,330,260 |
|---|
3/31/22 | $2,493,162 | $2,233,505 |
|---|
3/31/23 | $2,339,980 | $2,126,668 |
|---|
3/31/24 | $2,406,449 | $2,162,781 |
|---|
3/31/25 | $2,551,553 | $2,268,317 |
|---|
3/31/26 | $2,671,947 | $2,366,958 |
|---|
|
| AssetsNet |
$ 2,822,914,126
|
| Holdings Count | Holding |
1,131
|
| InvestmentCompanyPortfolioTurnover |
45.00%
|
| Additional Fund Statistics [Text Block] |
Fund Statistics as of March 31, 2026 - Net Assets$2,822,914,126
- Total Number of Portfolio Holdings1,131
- Portfolio Turnover Rate45%
|
| Holdings [Text Block] |
Portfolio Composition by Quality RatingFootnote Reference1 (% of Total Investments) as of March 31, 2026 Table SummaryAAA | 25.6% |
|---|
AA | 41.2% |
|---|
A | 16.1% |
|---|
BBB | 15.3% |
|---|
BB | 0.9% |
|---|
CCC | 0.0% |
|---|
C | 0.0% |
|---|
NRFootnote Referencea | 0.3% |
|---|
Other Investments | 0.6% |
|---|
Holdings DiversificationFootnote Reference3 (% of Net Assets) as of March 31, 2026 Table SummaryValue | Value |
|---|
Other | 6.3% | Interest Rate Futures Contracts Sold Short | -5.0% | Centrally Cleared Interest Rate Swap Agreements Receive | -1.2% | Interest Rate Futures Contracts Purchased | 10.0% | Centrally Cleared Interest Rate Swap Agreements Pay | 11.4% | Asset-Backed Securities | 19.8% | Corporate Bonds | 23.7% | U.S. Government Securities | 25.2% | Collateralized Mortgage Obligations | 39.7% | |
| Largest Holdings [Text Block] |
10 Largest HoldingsFootnote Reference2 (% of Net Assets) as of March 31, 2026 Table SummaryUniform MBS 30 Year 5.00% due 06/01/56 | 5.8% |
|---|
Uniform MBS 30 Year 3.00% due 05/01/56 | 3.3% |
|---|
Fannie Mae 5.50% due 11/01/55 | 3.1% |
|---|
U.S. Treasury Bonds 1.75% due 08/15/41 | 2.8% |
|---|
Ginnie Mae 5.00% due 06/20/56 | 2.5% |
|---|
U.S. Treasury Notes 3.63% due 03/31/28 | 2.3% |
|---|
U.S. Treasury Notes 4.00% due 07/31/32 | 2.3% |
|---|
U.S. Treasury Notes 4.63% due 04/30/31 | 2.2% |
|---|
Uniform MBS 30 Year 2.50% due 05/01/56 | 2.1% |
|---|
U.S. Treasury Inflation Indexed Bonds 1.88% due 07/15/35 | 1.9% |
|---|
Total | 28.3% |
|---|
|
| Material Fund Change [Text Block] |
|
| C000136510 |
|
| Shareholder Report [Line Items] |
|
| Fund Name |
Guggenheim Floating Rate Strategies Fund
|
| Class Name |
Class A
|
| Trading Symbol |
GIFAX
|
| Annual or Semi-Annual Statement [Text Block] |
This semi-annual shareholder report contains important information about the Guggenheim Floating Rate Strategies Fund for the period from October 1, 2025 to March 31, 2026.
|
| Shareholder Report Annual or Semi-Annual |
Semi-Annual Shareholder Report
|
| Additional Information [Text Block] |
You can find additional information about the fund at GuggenheimInvestments.com/mutual-funds/literature. You can also request this information by contacting 800 820 0888 or services@guggenheiminvestments.com.
|
| Additional Information Phone Number |
800 820 0888
|
| Additional Information Email |
<span style="box-sizing: border-box; color: rgb(67, 67, 67); display: inline; flex-wrap: nowrap; font-size: 10.6667px; font-weight: 400; grid-area: auto; line-height: 12.8px; margin: 0px; overflow: visible; text-align: left; text-align-last: auto; white-space-collapse: preserve-breaks;">services@guggenheiminvestments.com</span>
|
| Additional Information Website |
<span style="box-sizing: border-box; color: rgb(67, 67, 67); display: inline; flex-wrap: nowrap; font-size: 10.6667px; font-weight: 400; grid-area: auto; line-height: 12.8px; margin: 0px; overflow: visible; text-align: left; text-align-last: auto; white-space-collapse: preserve-breaks;">GuggenheimInvestments.com/mutual-funds/literature</span>
|
| Expenses [Text Block] |
What were the Fund's costs for the last six months? * Based on a hypothetical $10,000 investment Table SummaryClass | Costs of a $10,000 Investment | Costs Paid as a % of a $10,000 Investment** |
|---|
Class A | $50 | 1.00% |
|---|
Table Summary* | Excludes expenses of the underlying funds in which the fund invests, if any. |
|---|
** | Annualized |
|---|
|
| Expenses Paid, Amount |
$ 50
|
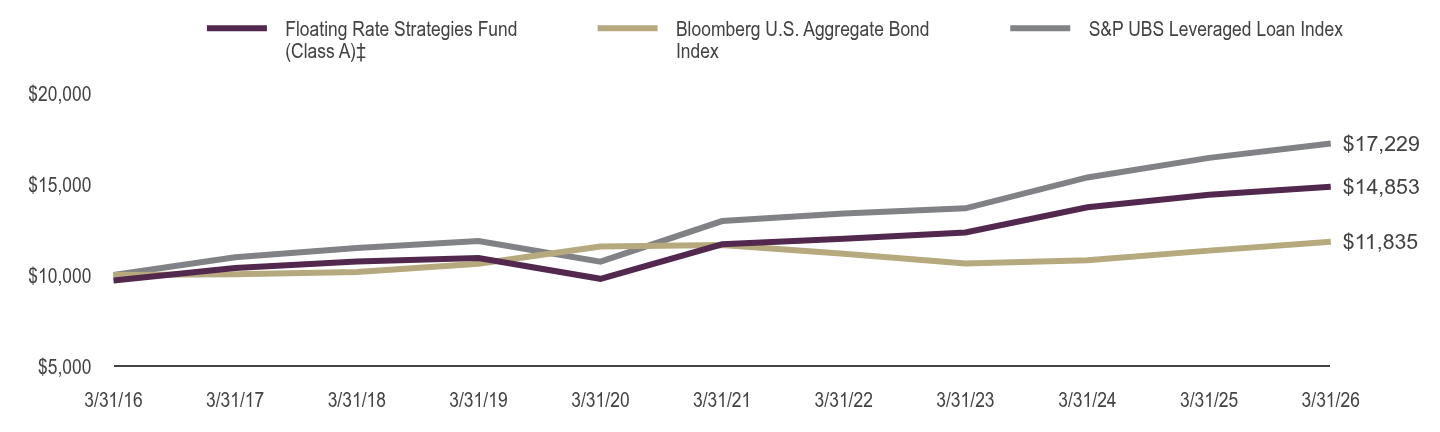
| Factors Affecting Performance [Text Block] |
What factors materially affected the Fund's performance over the last six months? Absolute returns for the reporting period were split between a positive coupon-driven quarter in Q4 2025 and a volatile Q1 2026 that saw negative total returns driven by the broad-based selloff of the software sector. The floating rate coupon helped buoy price volatility and contributed to positive absolute performance. The fund’s relative performance was primarily driven by the fund’s large underweight to the technology sector. Solid credit selection in bank loans broadly also contributed, especially in CCCs. The fund’s up in quality positioning was also positive, namely an overweight to BBs. Lingering idiosyncratic issues were the main detractors to performance, namely the mark down of restructured positions in the consumer sector. |
| Line Graph [Table Text Block] |
Table Summary | Floating Rate Strategies Fund (Class A)‡ | Bloomberg U.S. Aggregate Bond Index | S&P UBS Leveraged Loan Index |
|---|
3/31/16 | $9,700 | $10,000 | $10,000 |
|---|
3/31/17 | $10,382 | $10,044 | $10,974 |
|---|
3/31/18 | $10,746 | $10,165 | $11,483 |
|---|
3/31/19 | $10,931 | $10,620 | $11,865 |
|---|
3/31/20 | $9,793 | $11,569 | $10,737 |
|---|
3/31/21 | $11,689 | $11,651 | $12,967 |
|---|
3/31/22 | $11,999 | $11,168 | $13,384 |
|---|
3/31/23 | $12,339 | $10,633 | $13,669 |
|---|
3/31/24 | $13,727 | $10,814 | $15,364 |
|---|
3/31/25 | $14,418 | $11,342 | $16,442 |
|---|
3/31/26 | $14,853 | $11,835 | $17,229 |
|---|
|
| AssetsNet |
$ 532,593,338
|
| Holdings Count | Holding |
323
|
| InvestmentCompanyPortfolioTurnover |
21.00%
|
| Additional Fund Statistics [Text Block] |
Fund Statistics as of March 31, 2026 - Net Assets$532,593,338
- Total Number of Portfolio Holdings323
- Portfolio Turnover Rate21%
|
| Holdings [Text Block] |
Portfolio Composition by Quality RatingFootnote Reference1 (% of Total Investments) as of March 31, 2026 Table SummaryAAA | 3.8% |
|---|
AA | 0.4% |
|---|
A | 3.5% |
|---|
BBB | 9.6% |
|---|
BB | 34.4% |
|---|
B | 40.4% |
|---|
CCC | 5.1% |
|---|
NRFootnote Referencea | 2.8% |
|---|
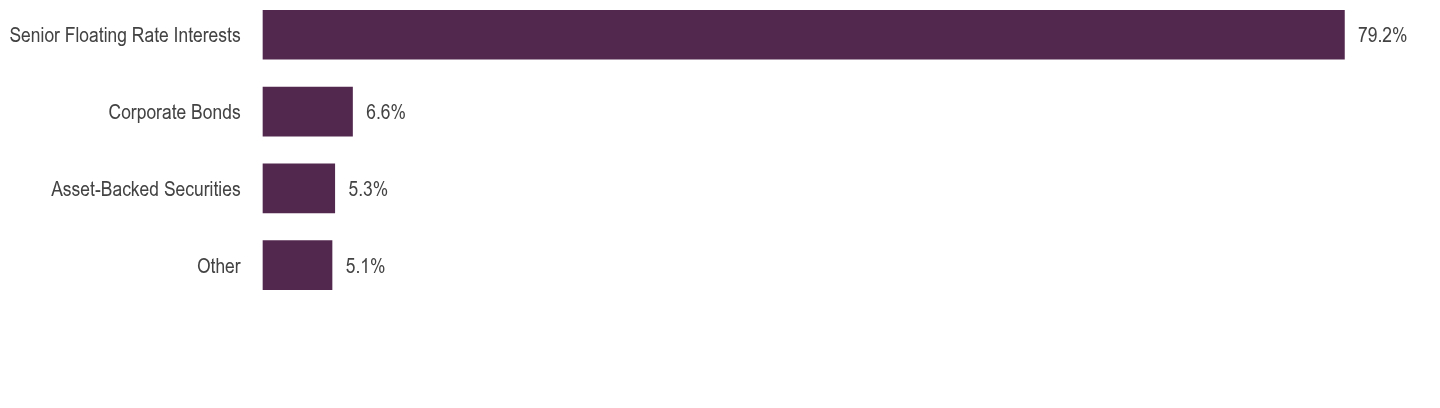
Holdings DiversificationFootnote Reference3 (% of Net Assets) as of March 31, 2026 Table SummaryValue | Value |
|---|
Other | 5.1% | Asset-Backed Securities | 5.3% | Corporate Bonds | 6.6% | Senior Floating Rate Interests | 79.2% | |
| Largest Holdings [Text Block] |
10 Largest HoldingsFootnote Reference2 (% of Net Assets) as of March 31, 2026 Table SummarySPDR Blackstone Senior Loan ETF | 1.8% |
|---|
Allwyn Entertainment Financing US LLC 5.67% (3 Month Term SOFR + 2.00%) due 06/02/31 | 1.1% |
|---|
Virgin Media Bristol LLC 7.05% (6 Month Term SOFR + 3.18%) due 03/02/31 | 1.0% |
|---|
Nexus Buyer LLC 7.17% (1 Month Term SOFR + 3.50%) due 07/31/31 | 0.9% |
|---|
Flutter Financing BV 5.45% (3 Month Term SOFR + 1.75%, Rate Floor: 0.50%) due 11/30/30 | 0.9% |
|---|
Fertitta Entertainment LLC / Fertitta Entertainment Finance Co., Inc. 4.63% due 01/15/29 | 0.9% |
|---|
Dermatology Intermediate Holdings III, Inc. 7.92% (3 Month Term SOFR + 4.25%, Rate Floor: 0.50%) due 03/30/29 | 0.9% |
|---|
Boxer Parent Co., Inc. 6.67% (3 Month Term SOFR + 3.00%) due 07/30/31 | 0.9% |
|---|
Jane Street Group LLC 5.67% (3 Month Term SOFR + 2.00%) due 12/15/31 | 0.9% |
|---|
Six Flags Entertainment Corp. 5.67% (1 Month Term SOFR + 2.00%) due 05/01/31 | 0.8% |
|---|
Total | 10.1% |
|---|
|
| Material Fund Change [Text Block] |
|
| C000136511 |
|
| Shareholder Report [Line Items] |
|
| Fund Name |
Guggenheim Floating Rate Strategies Fund
|
| Class Name |
Class C
|
| Trading Symbol |
GIFCX
|
| Annual or Semi-Annual Statement [Text Block] |
This semi-annual shareholder report contains important information about the Guggenheim Floating Rate Strategies Fund for the period from October 1, 2025 to March 31, 2026.
|
| Shareholder Report Annual or Semi-Annual |
Semi-Annual Shareholder Report
|
| Additional Information [Text Block] |
You can find additional information about the fund at GuggenheimInvestments.com/mutual-funds/literature. You can also request this information by contacting 800 820 0888 or services@guggenheiminvestments.com.
|
| Additional Information Phone Number |
800 820 0888
|
| Additional Information Email |
<span style="box-sizing: border-box; color: rgb(67, 67, 67); display: inline; flex-wrap: nowrap; font-size: 10.6667px; font-weight: 400; grid-area: auto; line-height: 12.8px; margin: 0px; overflow: visible; text-align: left; text-align-last: auto; white-space-collapse: preserve-breaks;">services@guggenheiminvestments.com</span>
|
| Additional Information Website |
<span style="box-sizing: border-box; color: rgb(67, 67, 67); display: inline; flex-wrap: nowrap; font-size: 10.6667px; font-weight: 400; grid-area: auto; line-height: 12.8px; margin: 0px; overflow: visible; text-align: left; text-align-last: auto; white-space-collapse: preserve-breaks;">GuggenheimInvestments.com/mutual-funds/literature</span>
|
| Expenses [Text Block] |
What were the Fund's costs for the last six months? * Based on a hypothetical $10,000 investment Table SummaryClass | Costs of a $10,000 Investment | Costs Paid as a % of a $10,000 Investment** |
|---|
Class C | $87 | 1.75% |
|---|
Table Summary* | Excludes expenses of the underlying funds in which the fund invests, if any. |
|---|
** | Annualized |
|---|
|
| Expenses Paid, Amount |
$ 87
|
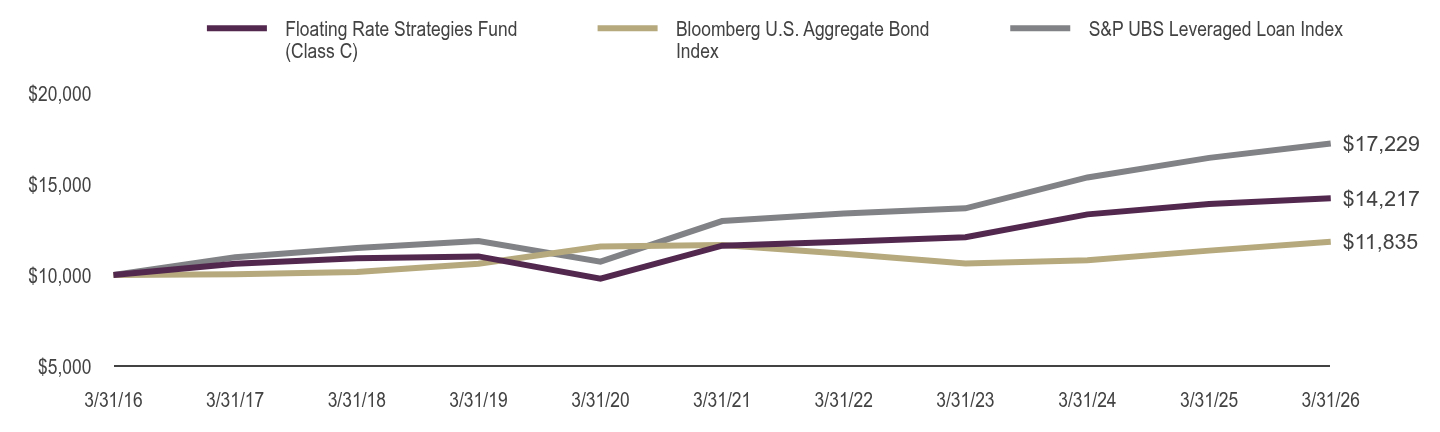
| Factors Affecting Performance [Text Block] |
What factors materially affected the Fund's performance over the last six months? Absolute returns for the reporting period were split between a positive coupon-driven quarter in Q4 2025 and a volatile Q1 2026 that saw negative total returns driven by the broad-based selloff of the software sector. The floating rate coupon helped buoy price volatility and contributed to positive absolute performance. The fund’s relative performance was primarily driven by the fund’s large underweight to the technology sector. Solid credit selection in bank loans broadly also contributed, especially in CCCs. The fund’s up in quality positioning was also positive, namely an overweight to BBs. Lingering idiosyncratic issues were the main detractors to performance, namely the mark down of restructured positions in the consumer sector. |
| Line Graph [Table Text Block] |
Table Summary | Floating Rate Strategies Fund (Class C) | Bloomberg U.S. Aggregate Bond Index | S&P UBS Leveraged Loan Index |
|---|
3/31/16 | $10,000 | $10,000 | $10,000 |
|---|
3/31/17 | $10,626 | $10,044 | $10,974 |
|---|
3/31/18 | $10,918 | $10,165 | $11,483 |
|---|
3/31/19 | $11,024 | $10,620 | $11,865 |
|---|
3/31/20 | $9,801 | $11,569 | $10,737 |
|---|
3/31/21 | $11,613 | $11,651 | $12,967 |
|---|
3/31/22 | $11,832 | $11,168 | $13,384 |
|---|
3/31/23 | $12,078 | $10,633 | $13,669 |
|---|
3/31/24 | $13,336 | $10,814 | $15,364 |
|---|
3/31/25 | $13,904 | $11,342 | $16,442 |
|---|
3/31/26 | $14,217 | $11,835 | $17,229 |
|---|
|
| AssetsNet |
$ 532,593,338
|
| Holdings Count | Holding |
323
|
| InvestmentCompanyPortfolioTurnover |
21.00%
|
| Additional Fund Statistics [Text Block] |
Fund Statistics as of March 31, 2026 - Net Assets$532,593,338
- Total Number of Portfolio Holdings323
- Portfolio Turnover Rate21%
|
| Holdings [Text Block] |
Portfolio Composition by Quality RatingFootnote Reference1 (% of Total Investments) as of March 31, 2026 Table SummaryAAA | 3.8% |
|---|
AA | 0.4% |
|---|
A | 3.5% |
|---|
BBB | 9.6% |
|---|
BB | 34.4% |
|---|
B | 40.4% |
|---|
CCC | 5.1% |
|---|
NRFootnote Referencea | 2.8% |
|---|
Holdings DiversificationFootnote Reference3 (% of Net Assets) as of March 31, 2026 Table SummaryValue | Value |
|---|
Other | 5.1% | Asset-Backed Securities | 5.3% | Corporate Bonds | 6.6% | Senior Floating Rate Interests | 79.2% | |
| Largest Holdings [Text Block] |
10 Largest HoldingsFootnote Reference2 (% of Net Assets) as of March 31, 2026 Table SummarySPDR Blackstone Senior Loan ETF | 1.8% |
|---|
Allwyn Entertainment Financing US LLC 5.67% (3 Month Term SOFR + 2.00%) due 06/02/31 | 1.1% |
|---|
Virgin Media Bristol LLC 7.05% (6 Month Term SOFR + 3.18%) due 03/02/31 | 1.0% |
|---|
Nexus Buyer LLC 7.17% (1 Month Term SOFR + 3.50%) due 07/31/31 | 0.9% |
|---|
Flutter Financing BV 5.45% (3 Month Term SOFR + 1.75%, Rate Floor: 0.50%) due 11/30/30 | 0.9% |
|---|
Fertitta Entertainment LLC / Fertitta Entertainment Finance Co., Inc. 4.63% due 01/15/29 | 0.9% |
|---|
Dermatology Intermediate Holdings III, Inc. 7.92% (3 Month Term SOFR + 4.25%, Rate Floor: 0.50%) due 03/30/29 | 0.9% |
|---|
Boxer Parent Co., Inc. 6.67% (3 Month Term SOFR + 3.00%) due 07/30/31 | 0.9% |
|---|
Jane Street Group LLC 5.67% (3 Month Term SOFR + 2.00%) due 12/15/31 | 0.9% |
|---|
Six Flags Entertainment Corp. 5.67% (1 Month Term SOFR + 2.00%) due 05/01/31 | 0.8% |
|---|
Total | 10.1% |
|---|
|
| Material Fund Change [Text Block] |
|
| C000155966 |
|
| Shareholder Report [Line Items] |
|
| Fund Name |
Guggenheim Floating Rate Strategies Fund
|
| Class Name |
Class P
|
| Trading Symbol |
GIFPX
|
| Annual or Semi-Annual Statement [Text Block] |
This semi-annual shareholder report contains important information about the Guggenheim Floating Rate Strategies Fund for the period from October 1, 2025 to March 31, 2026.
|
| Shareholder Report Annual or Semi-Annual |
Semi-Annual Shareholder Report
|
| Additional Information [Text Block] |
You can find additional information about the fund at GuggenheimInvestments.com/mutual-funds/literature. You can also request this information by contacting 800 820 0888 or services@guggenheiminvestments.com.
|
| Additional Information Phone Number |
800 820 0888
|
| Additional Information Email |
<span style="box-sizing: border-box; color: rgb(67, 67, 67); display: inline; flex-wrap: nowrap; font-size: 10.6667px; font-weight: 400; grid-area: auto; line-height: 12.8px; margin: 0px; overflow: visible; text-align: left; text-align-last: auto; white-space-collapse: preserve-breaks;">services@guggenheiminvestments.com</span>
|
| Additional Information Website |
<span style="box-sizing: border-box; color: rgb(67, 67, 67); display: inline; flex-wrap: nowrap; font-size: 10.6667px; font-weight: 400; grid-area: auto; line-height: 12.8px; margin: 0px; overflow: visible; text-align: left; text-align-last: auto; white-space-collapse: preserve-breaks;">GuggenheimInvestments.com/mutual-funds/literature</span>
|
| Expenses [Text Block] |
What were the Fund's costs for the last six months? * Based on a hypothetical $10,000 investment Table SummaryClass | Costs of a $10,000 Investment | Costs Paid as a % of a $10,000 Investment** |
|---|
Class P | $50 | 1.00% |
|---|
Table Summary* | Excludes expenses of the underlying funds in which the fund invests, if any. |
|---|
** | Annualized |
|---|
|
| Expenses Paid, Amount |
$ 50
|
| Factors Affecting Performance [Text Block] |
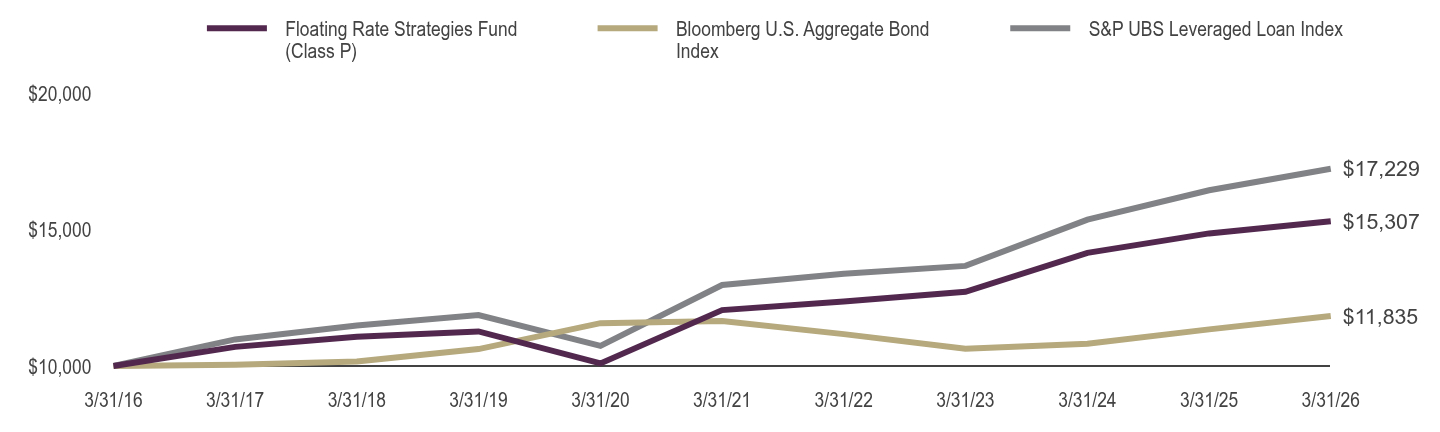
What factors materially affected the Fund's performance over the last six months? Absolute returns for the reporting period were split between a positive coupon-driven quarter in Q4 2025 and a volatile Q1 2026 that saw negative total returns driven by the broad-based selloff of the software sector. The floating rate coupon helped buoy price volatility and contributed to positive absolute performance. The fund’s relative performance was primarily driven by the fund’s large underweight to the technology sector. Solid credit selection in bank loans broadly also contributed, especially in CCCs. The fund’s up in quality positioning was also positive, namely an overweight to BBs. Lingering idiosyncratic issues were the main detractors to performance, namely the mark down of restructured positions in the consumer sector. |
| Line Graph [Table Text Block] |
Table Summary | Floating Rate Strategies Fund (Class P) | Bloomberg U.S. Aggregate Bond Index | S&P UBS Leveraged Loan Index |
|---|
3/31/16 | $10,000 | $10,000 | $10,000 |
|---|
3/31/17 | $10,701 | $10,044 | $10,974 |
|---|
3/31/18 | $11,076 | $10,165 | $11,483 |
|---|
3/31/19 | $11,267 | $10,620 | $11,865 |
|---|
3/31/20 | $10,094 | $11,569 | $10,737 |
|---|
3/31/21 | $12,048 | $11,651 | $12,967 |
|---|
3/31/22 | $12,367 | $11,168 | $13,384 |
|---|
3/31/23 | $12,718 | $10,633 | $13,669 |
|---|
3/31/24 | $14,147 | $10,814 | $15,364 |
|---|
3/31/25 | $14,859 | $11,342 | $16,442 |
|---|
3/31/26 | $15,307 | $11,835 | $17,229 |
|---|
|
| AssetsNet |
$ 532,593,338
|
| Holdings Count | Holding |
323
|
| InvestmentCompanyPortfolioTurnover |
21.00%
|
| Additional Fund Statistics [Text Block] |
Fund Statistics as of March 31, 2026 - Net Assets$532,593,338
- Total Number of Portfolio Holdings323
- Portfolio Turnover Rate21%
|
| Holdings [Text Block] |
Portfolio Composition by Quality RatingFootnote Reference1 (% of Total Investments) as of March 31, 2026 Table SummaryAAA | 3.8% |
|---|
AA | 0.4% |
|---|
A | 3.5% |
|---|
BBB | 9.6% |
|---|
BB | 34.4% |
|---|
B | 40.4% |
|---|
CCC | 5.1% |
|---|
NRFootnote Referencea | 2.8% |
|---|
Holdings DiversificationFootnote Reference3 (% of Net Assets) as of March 31, 2026 Table SummaryValue | Value |
|---|
Other | 5.1% | Asset-Backed Securities | 5.3% | Corporate Bonds | 6.6% | Senior Floating Rate Interests | 79.2% | |
| Largest Holdings [Text Block] |
10 Largest HoldingsFootnote Reference2 (% of Net Assets) as of March 31, 2026 Table SummarySPDR Blackstone Senior Loan ETF | 1.8% |
|---|
Allwyn Entertainment Financing US LLC 5.67% (3 Month Term SOFR + 2.00%) due 06/02/31 | 1.1% |
|---|
Virgin Media Bristol LLC 7.05% (6 Month Term SOFR + 3.18%) due 03/02/31 | 1.0% |
|---|
Nexus Buyer LLC 7.17% (1 Month Term SOFR + 3.50%) due 07/31/31 | 0.9% |
|---|
Flutter Financing BV 5.45% (3 Month Term SOFR + 1.75%, Rate Floor: 0.50%) due 11/30/30 | 0.9% |
|---|
Fertitta Entertainment LLC / Fertitta Entertainment Finance Co., Inc. 4.63% due 01/15/29 | 0.9% |
|---|
Dermatology Intermediate Holdings III, Inc. 7.92% (3 Month Term SOFR + 4.25%, Rate Floor: 0.50%) due 03/30/29 | 0.9% |
|---|
Boxer Parent Co., Inc. 6.67% (3 Month Term SOFR + 3.00%) due 07/30/31 | 0.9% |
|---|
Jane Street Group LLC 5.67% (3 Month Term SOFR + 2.00%) due 12/15/31 | 0.9% |
|---|
Six Flags Entertainment Corp. 5.67% (1 Month Term SOFR + 2.00%) due 05/01/31 | 0.8% |
|---|
Total | 10.1% |
|---|
|
| Material Fund Change [Text Block] |
|
| C000136512 |
|
| Shareholder Report [Line Items] |
|
| Fund Name |
Guggenheim Floating Rate Strategies Fund
|
| Class Name |
Institutional Class
|
| Trading Symbol |
GIFIX
|
| Annual or Semi-Annual Statement [Text Block] |
This semi-annual shareholder report contains important information about the Guggenheim Floating Rate Strategies Fund for the period from October 1, 2025 to March 31, 2026.
|
| Shareholder Report Annual or Semi-Annual |
Semi-Annual Shareholder Report
|
| Additional Information [Text Block] |
You can find additional information about the fund at GuggenheimInvestments.com/mutual-funds/literature. You can also request this information by contacting 800 820 0888 or services@guggenheiminvestments.com.
|
| Additional Information Phone Number |
800 820 0888
|
| Additional Information Email |
<span style="box-sizing: border-box; color: rgb(67, 67, 67); display: inline; flex-wrap: nowrap; font-size: 10.6667px; font-weight: 400; grid-area: auto; line-height: 12.8px; margin: 0px; overflow: visible; text-align: left; text-align-last: auto; white-space-collapse: preserve-breaks;">services@guggenheiminvestments.com</span>
|
| Additional Information Website |
<span style="box-sizing: border-box; color: rgb(67, 67, 67); display: inline; flex-wrap: nowrap; font-size: 10.6667px; font-weight: 400; grid-area: auto; line-height: 12.8px; margin: 0px; overflow: visible; text-align: left; text-align-last: auto; white-space-collapse: preserve-breaks;">GuggenheimInvestments.com/mutual-funds/literature</span>
|
| Expenses [Text Block] |
What were the Fund's costs for the last six months? * Based on a hypothetical $10,000 investment Table SummaryClass | Costs of a $10,000 Investment | Costs Paid as a % of a $10,000 Investment** |
|---|
Institutional Class | $38 | 0.76% |
|---|
Table Summary* | Excludes expenses of the underlying funds in which the fund invests, if any. |
|---|
** | Annualized |
|---|
|
| Expenses Paid, Amount |
$ 38
|
| Factors Affecting Performance [Text Block] |
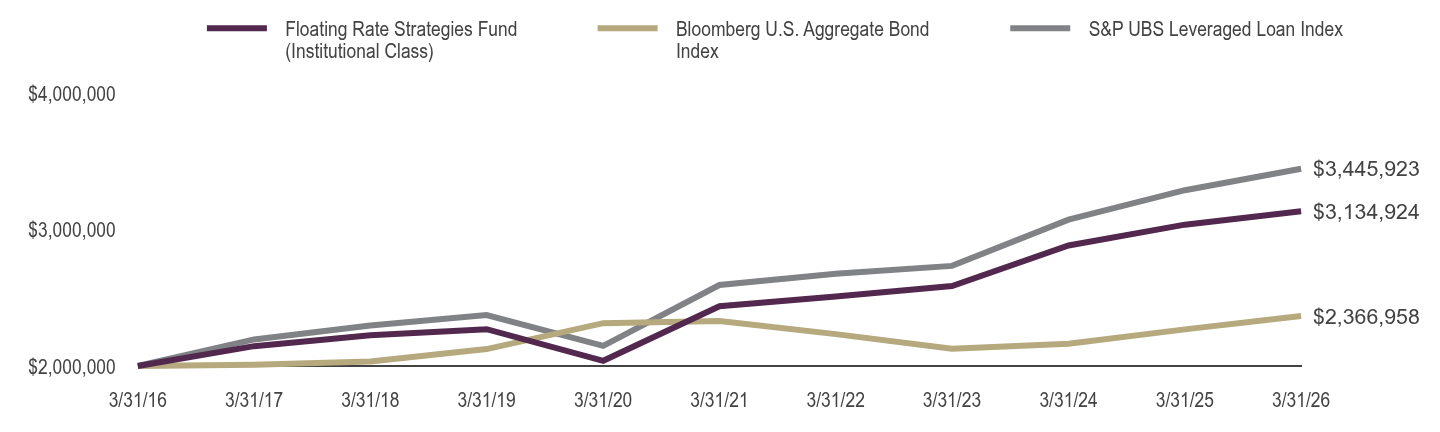
What factors materially affected the Fund's performance over the last six months? Absolute returns for the reporting period were split between a positive coupon-driven quarter in Q4 2025 and a volatile Q1 2026 that saw negative total returns driven by the broad-based selloff of the software sector. The floating rate coupon helped buoy price volatility and contributed to positive absolute performance. The fund’s relative performance was primarily driven by the fund’s large underweight to the technology sector. Solid credit selection in bank loans broadly also contributed, especially in CCCs. The fund’s up in quality positioning was also positive, namely an overweight to BBs. Lingering idiosyncratic issues were the main detractors to performance, namely the mark down of restructured positions in the consumer sector. |
| Line Graph [Table Text Block] |
Table Summary | Floating Rate Strategies Fund (Institutional Class) | Bloomberg U.S. Aggregate Bond Index | S&P UBS Leveraged Loan Index |
|---|
3/31/16 | $2,000,000 | $2,000,000 | $2,000,000 |
|---|
3/31/17 | $2,145,366 | $2,008,812 | $2,194,832 |
|---|
3/31/18 | $2,225,891 | $2,032,978 | $2,296,639 |
|---|
3/31/19 | $2,269,702 | $2,124,067 | $2,373,062 |
|---|
3/31/20 | $2,038,311 | $2,313,827 | $2,147,382 |
|---|
3/31/21 | $2,438,403 | $2,330,260 | $2,593,386 |
|---|
3/31/22 | $2,509,866 | $2,233,505 | $2,676,931 |
|---|
3/31/23 | $2,586,237 | $2,126,668 | $2,733,753 |
|---|
3/31/24 | $2,883,642 | $2,162,781 | $3,072,807 |
|---|
3/31/25 | $3,035,977 | $2,268,317 | $3,288,419 |
|---|
3/31/26 | $3,134,924 | $2,366,958 | $3,445,923 |
|---|
|
| AssetsNet |
$ 532,593,338
|
| Holdings Count | Holding |
323
|
| InvestmentCompanyPortfolioTurnover |
21.00%
|
| Additional Fund Statistics [Text Block] |
Fund Statistics as of March 31, 2026 - Net Assets$532,593,338
- Total Number of Portfolio Holdings323
- Portfolio Turnover Rate21%
|
| Holdings [Text Block] |
Portfolio Composition by Quality RatingFootnote Reference1 (% of Total Investments) as of March 31, 2026 Table SummaryAAA | 3.8% |
|---|
AA | 0.4% |
|---|
A | 3.5% |
|---|
BBB | 9.6% |
|---|
BB | 34.4% |
|---|
B | 40.4% |
|---|
CCC | 5.1% |
|---|
NRFootnote Referencea | 2.8% |
|---|
Holdings DiversificationFootnote Reference3 (% of Net Assets) as of March 31, 2026 Table SummaryValue | Value |
|---|
Other | 5.1% | Asset-Backed Securities | 5.3% | Corporate Bonds | 6.6% | Senior Floating Rate Interests | 79.2% | |
| Largest Holdings [Text Block] |
10 Largest HoldingsFootnote Reference2 (% of Net Assets) as of March 31, 2026 Table SummarySPDR Blackstone Senior Loan ETF | 1.8% |
|---|
Allwyn Entertainment Financing US LLC 5.67% (3 Month Term SOFR + 2.00%) due 06/02/31 | 1.1% |
|---|
Virgin Media Bristol LLC 7.05% (6 Month Term SOFR + 3.18%) due 03/02/31 | 1.0% |
|---|
Nexus Buyer LLC 7.17% (1 Month Term SOFR + 3.50%) due 07/31/31 | 0.9% |
|---|
Flutter Financing BV 5.45% (3 Month Term SOFR + 1.75%, Rate Floor: 0.50%) due 11/30/30 | 0.9% |
|---|
Fertitta Entertainment LLC / Fertitta Entertainment Finance Co., Inc. 4.63% due 01/15/29 | 0.9% |
|---|
Dermatology Intermediate Holdings III, Inc. 7.92% (3 Month Term SOFR + 4.25%, Rate Floor: 0.50%) due 03/30/29 | 0.9% |
|---|
Boxer Parent Co., Inc. 6.67% (3 Month Term SOFR + 3.00%) due 07/30/31 | 0.9% |
|---|
Jane Street Group LLC 5.67% (3 Month Term SOFR + 2.00%) due 12/15/31 | 0.9% |
|---|
Six Flags Entertainment Corp. 5.67% (1 Month Term SOFR + 2.00%) due 05/01/31 | 0.8% |
|---|
Total | 10.1% |
|---|
|
| Material Fund Change [Text Block] |
|
| C000152101 |
|
| Shareholder Report [Line Items] |
|
| Fund Name |
Guggenheim Floating Rate Strategies Fund
|
| Class Name |
Class R6
|
| Trading Symbol |
GIFSX
|
| Annual or Semi-Annual Statement [Text Block] |
This semi-annual shareholder report contains important information about the Guggenheim Floating Rate Strategies Fund for the period from October 1, 2025 to March 31, 2026.
|
| Shareholder Report Annual or Semi-Annual |
Semi-Annual Shareholder Report
|
| Additional Information [Text Block] |
You can find additional information about the fund at GuggenheimInvestments.com/mutual-funds/literature. You can also request this information by contacting 800 820 0888 or services@guggenheiminvestments.com.
|
| Additional Information Phone Number |
800 820 0888
|
| Additional Information Email |
<span style="box-sizing: border-box; color: rgb(67, 67, 67); display: inline; flex-wrap: nowrap; font-size: 10.6667px; font-weight: 400; grid-area: auto; line-height: 12.8px; margin: 0px; overflow: visible; text-align: left; text-align-last: auto; white-space-collapse: preserve-breaks;">services@guggenheiminvestments.com</span>
|
| Additional Information Website |
<span style="box-sizing: border-box; color: rgb(67, 67, 67); display: inline; flex-wrap: nowrap; font-size: 10.6667px; font-weight: 400; grid-area: auto; line-height: 12.8px; margin: 0px; overflow: visible; text-align: left; text-align-last: auto; white-space-collapse: preserve-breaks;">GuggenheimInvestments.com/mutual-funds/literature</span>
|
| Expenses [Text Block] |
What were the Fund's costs for the last six months? * Based on a hypothetical $10,000 investment Table SummaryClass | Costs of a $10,000 Investment | Costs Paid as a % of a $10,000 Investment** |
|---|
Class R6 | $38 | 0.76% |
|---|
Table Summary* | Excludes expenses of the underlying funds in which the fund invests, if any. |
|---|
** | Annualized |
|---|
|
| Expenses Paid, Amount |
$ 38
|
| Factors Affecting Performance [Text Block] |
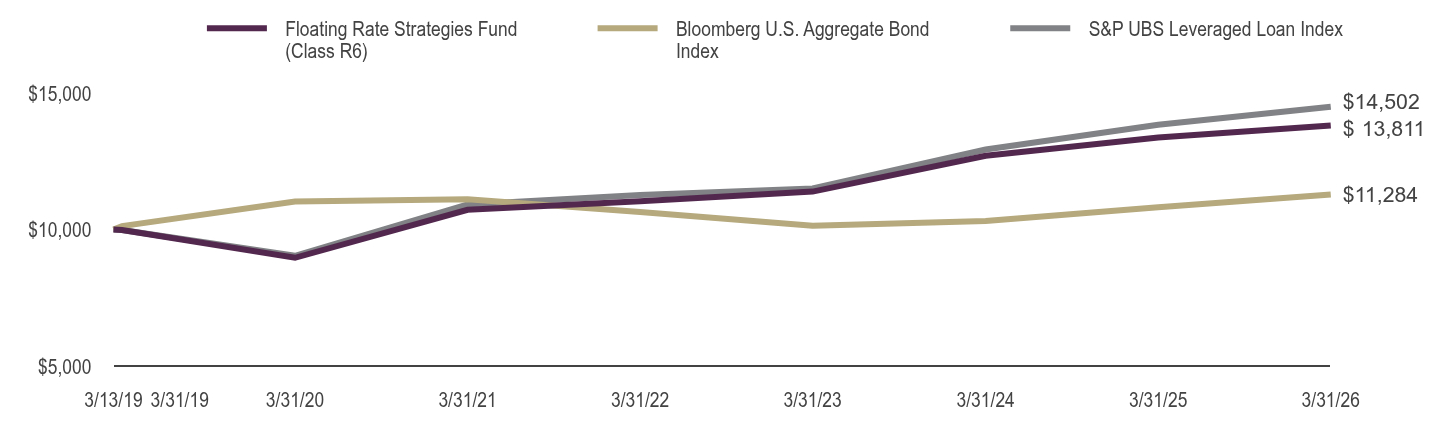
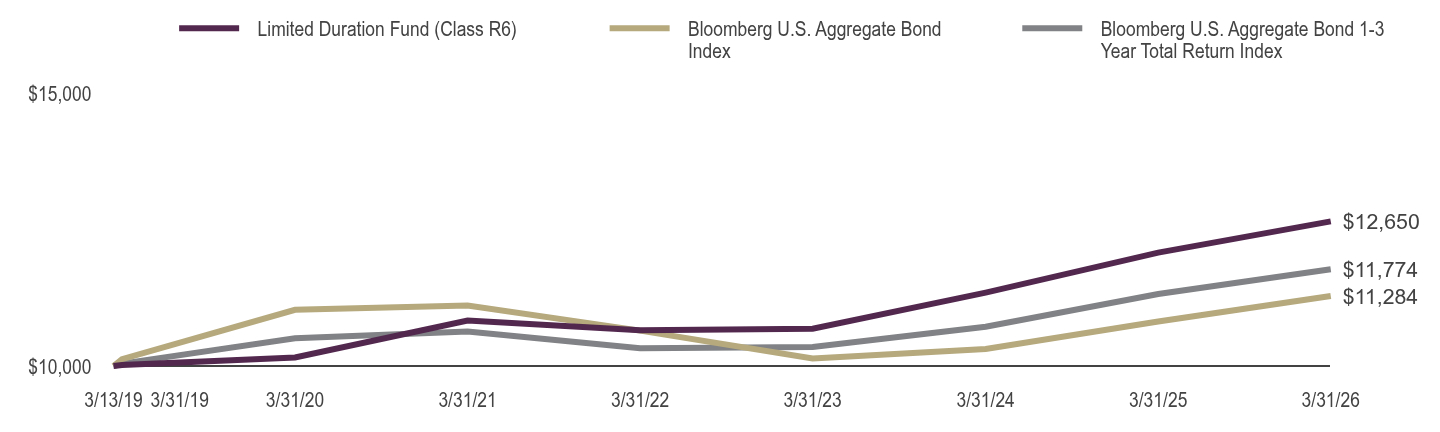
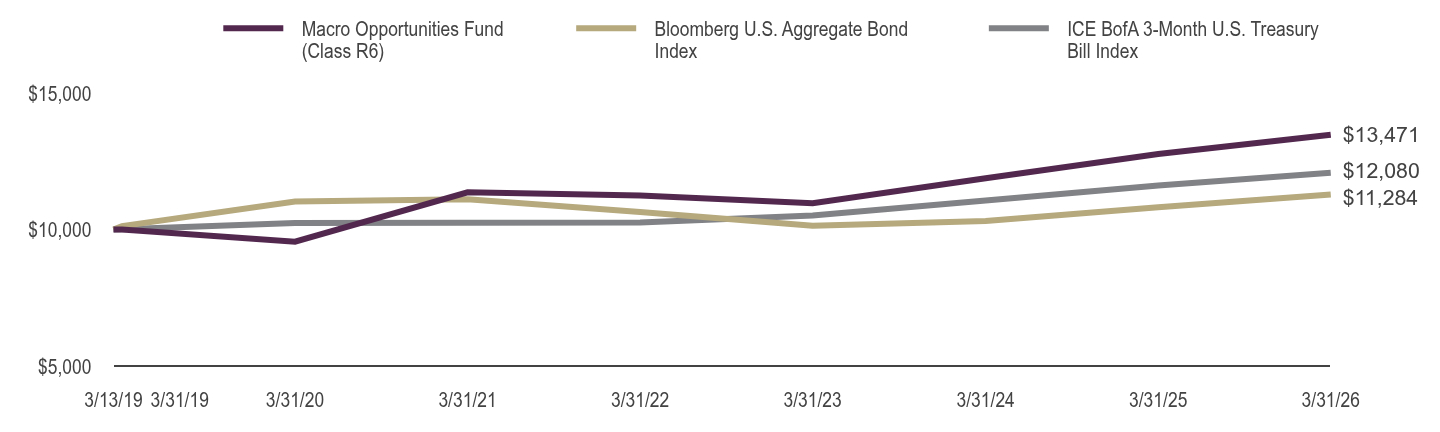
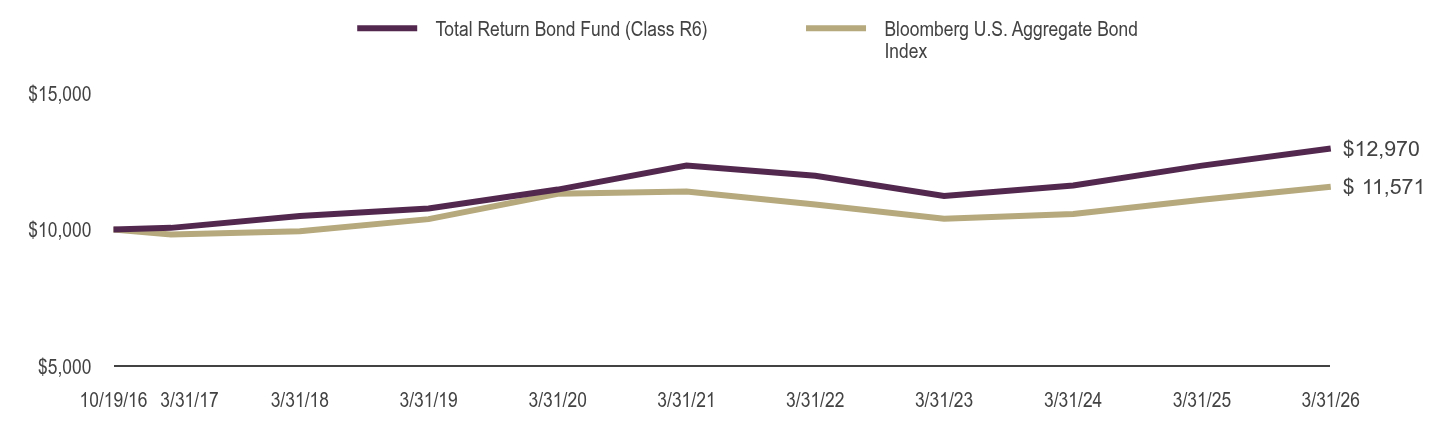
What factors materially affected the Fund's performance over the last six months? Absolute returns for the reporting period were split between a positive coupon-driven quarter in Q4 2025 and a volatile Q1 2026 that saw negative total returns driven by the broad-based selloff of the software sector. The floating rate coupon helped buoy price volatility and contributed to positive absolute performance. The fund’s relative performance was primarily driven by the fund’s large underweight to the technology sector. Solid credit selection in bank loans broadly also contributed, especially in CCCs. The fund’s up in quality positioning was also positive, namely an overweight to BBs. Lingering idiosyncratic issues were the main detractors to performance, namely the mark down of restructured positions in the consumer sector. |
| Line Graph [Table Text Block] |
Table Summary | Floating Rate Strategies Fund (Class R6) | Bloomberg U.S. Aggregate Bond Index | S&P UBS Leveraged Loan Index |
|---|
3/13/19 | $10,000 | $10,000 | $10,000 |
|---|
3/31/19 | $9,983 | $10,126 | $9,987 |
|---|
3/31/20 | $8,966 | $11,030 | $9,038 |
|---|
3/31/21 | $10,725 | $11,109 | $10,915 |
|---|
3/31/22 | $11,038 | $10,648 | $11,267 |
|---|
3/31/23 | $11,391 | $10,139 | $11,508 |
|---|
3/31/24 | $12,704 | $10,311 | $12,935 |
|---|
3/31/25 | $13,374 | $10,814 | $13,844 |
|---|
3/31/26 | $13,811 | $11,284 | $14,502 |
|---|
|
| AssetsNet |
$ 532,593,338
|
| Holdings Count | Holding |
323
|
| InvestmentCompanyPortfolioTurnover |
21.00%
|
| Additional Fund Statistics [Text Block] |
Fund Statistics as of March 31, 2026 - Net Assets$532,593,338
- Total Number of Portfolio Holdings323
- Portfolio Turnover Rate21%
|
| Holdings [Text Block] |
Portfolio Composition by Quality RatingFootnote Reference1 (% of Total Investments) as of March 31, 2026 Table SummaryAAA | 3.8% |
|---|
AA | 0.4% |
|---|
A | 3.5% |
|---|
BBB | 9.6% |
|---|
BB | 34.4% |
|---|
B | 40.4% |
|---|
CCC | 5.1% |
|---|
NRFootnote Referencea | 2.8% |
|---|
Holdings DiversificationFootnote Reference3 (% of Net Assets) as of March 31, 2026 Table SummaryValue | Value |
|---|
Other | 5.1% | Asset-Backed Securities | 5.3% | Corporate Bonds | 6.6% | Senior Floating Rate Interests | 79.2% | |
| Largest Holdings [Text Block] |
10 Largest HoldingsFootnote Reference2 (% of Net Assets) as of March 31, 2026 Table SummarySPDR Blackstone Senior Loan ETF | 1.8% |
|---|
Allwyn Entertainment Financing US LLC 5.67% (3 Month Term SOFR + 2.00%) due 06/02/31 | 1.1% |
|---|
Virgin Media Bristol LLC 7.05% (6 Month Term SOFR + 3.18%) due 03/02/31 | 1.0% |
|---|
Nexus Buyer LLC 7.17% (1 Month Term SOFR + 3.50%) due 07/31/31 | 0.9% |
|---|
Flutter Financing BV 5.45% (3 Month Term SOFR + 1.75%, Rate Floor: 0.50%) due 11/30/30 | 0.9% |
|---|
Fertitta Entertainment LLC / Fertitta Entertainment Finance Co., Inc. 4.63% due 01/15/29 | 0.9% |
|---|
Dermatology Intermediate Holdings III, Inc. 7.92% (3 Month Term SOFR + 4.25%, Rate Floor: 0.50%) due 03/30/29 | 0.9% |
|---|
Boxer Parent Co., Inc. 6.67% (3 Month Term SOFR + 3.00%) due 07/30/31 | 0.9% |
|---|
Jane Street Group LLC 5.67% (3 Month Term SOFR + 2.00%) due 12/15/31 | 0.9% |
|---|
Six Flags Entertainment Corp. 5.67% (1 Month Term SOFR + 2.00%) due 05/01/31 | 0.8% |
|---|
Total | 10.1% |
|---|
|
| Material Fund Change [Text Block] |
|
| C000136514 |
|
| Shareholder Report [Line Items] |
|
| Fund Name |
Guggenheim High Yield Fund
|
| Class Name |
Class A
|
| Trading Symbol |
SIHAX
|
| Annual or Semi-Annual Statement [Text Block] |
This semi-annual shareholder report contains important information about the Guggenheim High Yield Fund for the period from October 1, 2025 to March 31, 2026.
|
| Shareholder Report Annual or Semi-Annual |
Semi-Annual Shareholder Report
|
| Additional Information [Text Block] |
You can find additional information about the fund at GuggenheimInvestments.com/mutual-funds/literature. You can also request this information by contacting 800 820 0888 or services@guggenheiminvestments.com.
|
| Additional Information Phone Number |
800 820 0888
|
| Additional Information Email |
<span style="box-sizing: border-box; color: rgb(67, 67, 67); display: inline; flex-wrap: nowrap; font-size: 10.6667px; font-weight: 400; grid-area: auto; line-height: 12.8px; margin: 0px; overflow: visible; text-align: left; text-align-last: auto; white-space-collapse: preserve-breaks;">services@guggenheiminvestments.com</span>
|
| Additional Information Website |
<span style="box-sizing: border-box; color: rgb(67, 67, 67); display: inline; flex-wrap: nowrap; font-size: 10.6667px; font-weight: 400; grid-area: auto; line-height: 12.8px; margin: 0px; overflow: visible; text-align: left; text-align-last: auto; white-space-collapse: preserve-breaks;">GuggenheimInvestments.com/mutual-funds/literature</span>
|
| Expenses [Text Block] |
What were the Fund's costs for the last six months? * Based on a hypothetical $10,000 investment Table SummaryClass | Costs of a $10,000 Investment | Costs Paid as a % of a $10,000 Investment** |
|---|
Class A | $45 | 0.91% |
|---|
Table Summary* | Excludes expenses of the underlying funds in which the fund invests, if any. |
|---|
** | Annualized |
|---|
|
| Expenses Paid, Amount |
$ 45
|
| Factors Affecting Performance [Text Block] |
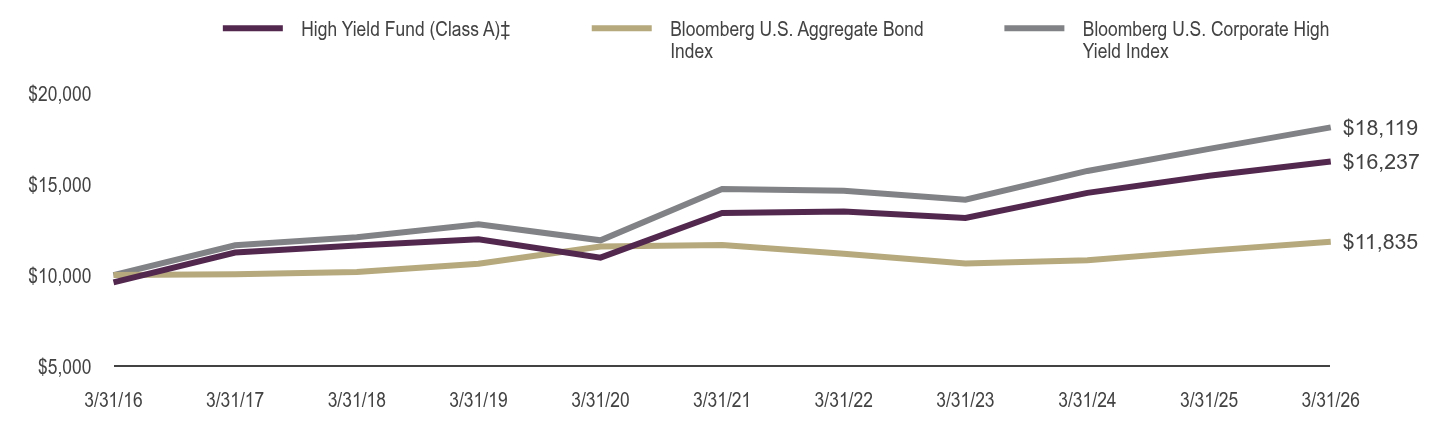
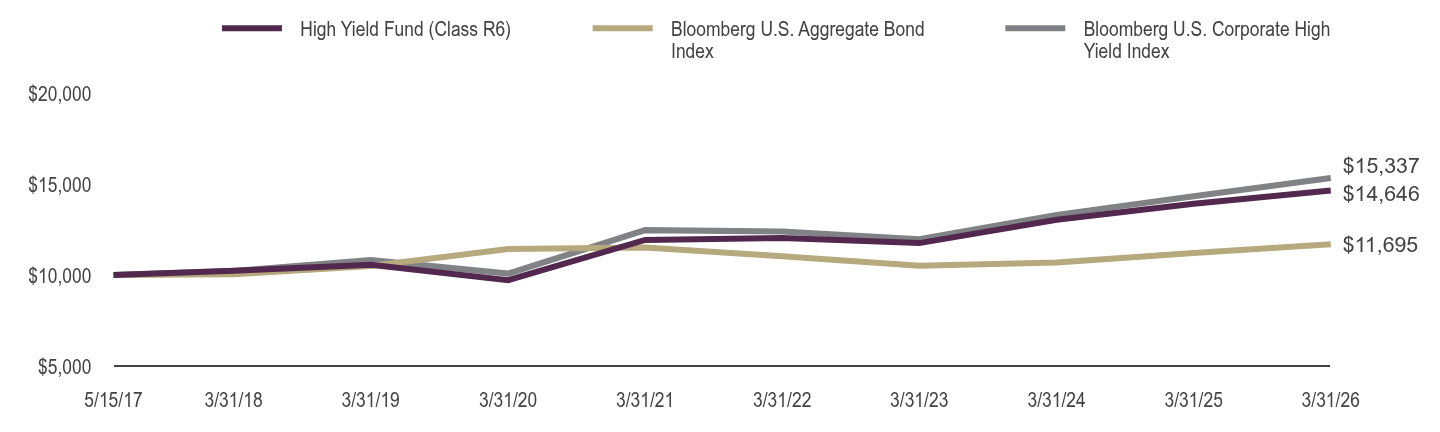
What factors materially affected the Fund's performance over the last six months? The primary contributor to fund performance was strong credit selection in the capital goods sector, as the fund avoided weaker credits in the benchmark. The bank loan allocation, while providing portfolio diversification and seniority benefits, was a detractor on a relative basis as loans slightly underperformed bonds. In addition, the underweight to energy was a drag as it was the top performing sector amid higher oil prices and the conflict in the Middle East. |
| Line Graph [Table Text Block] |
Table Summary | High Yield Fund (Class A)‡ | Bloomberg U.S. Aggregate Bond Index | Bloomberg U.S. Corporate High Yield Index |
|---|
3/31/16 | $9,600 | $10,000 | $10,000 |
|---|
3/31/17 | $11,239 | $10,044 | $11,639 |
|---|
3/31/18 | $11,624 | $10,165 | $12,079 |
|---|
3/31/19 | $11,963 | $10,620 | $12,796 |
|---|
3/31/20 | $10,954 | $11,569 | $11,908 |
|---|
3/31/21 | $13,412 | $11,651 | $14,732 |
|---|
3/31/22 | $13,492 | $11,168 | $14,635 |
|---|
3/31/23 | $13,137 | $10,633 | $14,146 |
|---|
3/31/24 | $14,519 | $10,814 | $15,723 |
|---|
3/31/25 | $15,463 | $11,342 | $16,933 |
|---|
3/31/26 | $16,237 | $11,835 | $18,119 |
|---|
|
| AssetsNet |
$ 164,476,925
|
| Holdings Count | Holding |
323
|
| InvestmentCompanyPortfolioTurnover |
26.00%
|
| Additional Fund Statistics [Text Block] |
Fund Statistics as of March 31, 2026 - Net Assets$164,476,925
- Total Number of Portfolio Holdings323
- Portfolio Turnover Rate26%
|
| Holdings [Text Block] |
Portfolio Composition by Quality RatingFootnote Reference1 (% of Total Investments) as of March 31, 2026 Table SummaryBBB | 6.2% |
|---|
BB | 53.3% |
|---|
B | 30.4% |
|---|
CCC | 6.5% |
|---|
NRFootnote Referencea | 1.4% |
|---|
Other Investments | 2.2% |
|---|
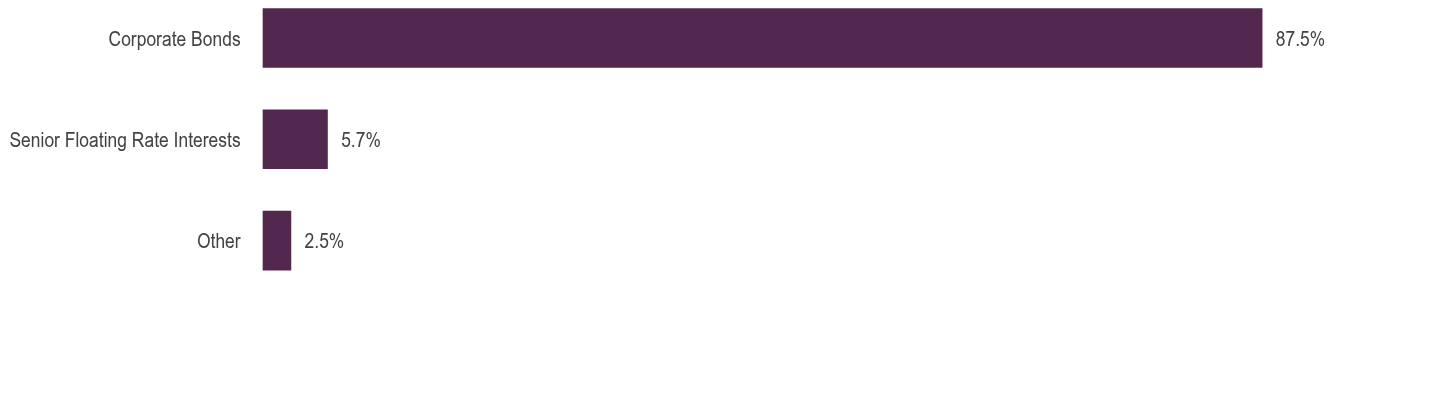
Holdings DiversificationFootnote Reference3 (% of Net Assets) as of March 31, 2026 Table SummaryValue | Value |
|---|
Other | 2.5% | Senior Floating Rate Interests | 5.7% | Corporate Bonds | 87.5% | |
| Largest Holdings [Text Block] |
10 Largest HoldingsFootnote Reference2 (% of Net Assets) as of March 31, 2026 Table SummaryCPI CG, Inc. 10.00% due 07/15/29 | 1.0% |
|---|
ITT Holdings LLC 6.50% due 08/01/29 | 0.9% |
|---|
Wolverine World Wide, Inc. 4.00% due 08/15/29 | 0.8% |
|---|
Trinity Industries, Inc. 7.75% due 07/15/28 | 0.8% |
|---|
PetSmart LLC / PetSmart Finance Corp. 7.50% due 09/15/32 | 0.8% |
|---|
Enviri Corp. 5.75% due 07/31/27 | 0.8% |
|---|
Nassau Companies of New York 7.88% due 07/15/30 | 0.8% |
|---|
TransMontaigne Partners LLC 8.50% due 06/15/30 | 0.8% |
|---|
Ardonagh Finco Ltd. 7.75% due 02/15/31 | 0.8% |
|---|
New Enterprise Stone & Lime Company, Inc. 9.75% due 07/15/28 | 0.7% |
|---|
Total | 8.2% |
|---|
|
| Material Fund Change [Text Block] |
|
| C000136516 |
|
| Shareholder Report [Line Items] |
|
| Fund Name |
Guggenheim High Yield Fund
|
| Class Name |
Class C
|
| Trading Symbol |
SIHSX
|
| Annual or Semi-Annual Statement [Text Block] |
This semi-annual shareholder report contains important information about the Guggenheim High Yield Fund for the period from October 1, 2025 to March 31, 2026.
|
| Shareholder Report Annual or Semi-Annual |
Semi-Annual Shareholder Report
|
| Additional Information [Text Block] |
You can find additional information about the fund at GuggenheimInvestments.com/mutual-funds/literature. You can also request this information by contacting 800 820 0888 or services@guggenheiminvestments.com.
|
| Additional Information Phone Number |
800 820 0888
|
| Additional Information Email |
<span style="box-sizing: border-box; color: rgb(67, 67, 67); display: inline; flex-wrap: nowrap; font-size: 10.6667px; font-weight: 400; grid-area: auto; line-height: 12.8px; margin: 0px; overflow: visible; text-align: left; text-align-last: auto; white-space-collapse: preserve-breaks;">services@guggenheiminvestments.com</span>
|
| Additional Information Website |
<span style="box-sizing: border-box; color: rgb(67, 67, 67); display: inline; flex-wrap: nowrap; font-size: 10.6667px; font-weight: 400; grid-area: auto; line-height: 12.8px; margin: 0px; overflow: visible; text-align: left; text-align-last: auto; white-space-collapse: preserve-breaks;">GuggenheimInvestments.com/mutual-funds/literature</span>
|
| Expenses [Text Block] |
What were the Fund's costs for the last six months? * Based on a hypothetical $10,000 investment Table SummaryClass | Costs of a $10,000 Investment | Costs Paid as a % of a $10,000 Investment** |
|---|
Class C | $83 | 1.66% |
|---|
Table Summary* | Excludes expenses of the underlying funds in which the fund invests, if any. |
|---|
** | Annualized |
|---|
|
| Expenses Paid, Amount |
$ 83
|
| Factors Affecting Performance [Text Block] |
What factors materially affected the Fund's performance over the last six months? The primary contributor to fund performance was strong credit selection in the capital goods sector, as the fund avoided weaker credits in the benchmark. The bank loan allocation, while providing portfolio diversification and seniority benefits, was a detractor on a relative basis as loans slightly underperformed bonds. In addition, the underweight to energy was a drag as it was the top performing sector amid higher oil prices and the conflict in the Middle East. |
| Line Graph [Table Text Block] |
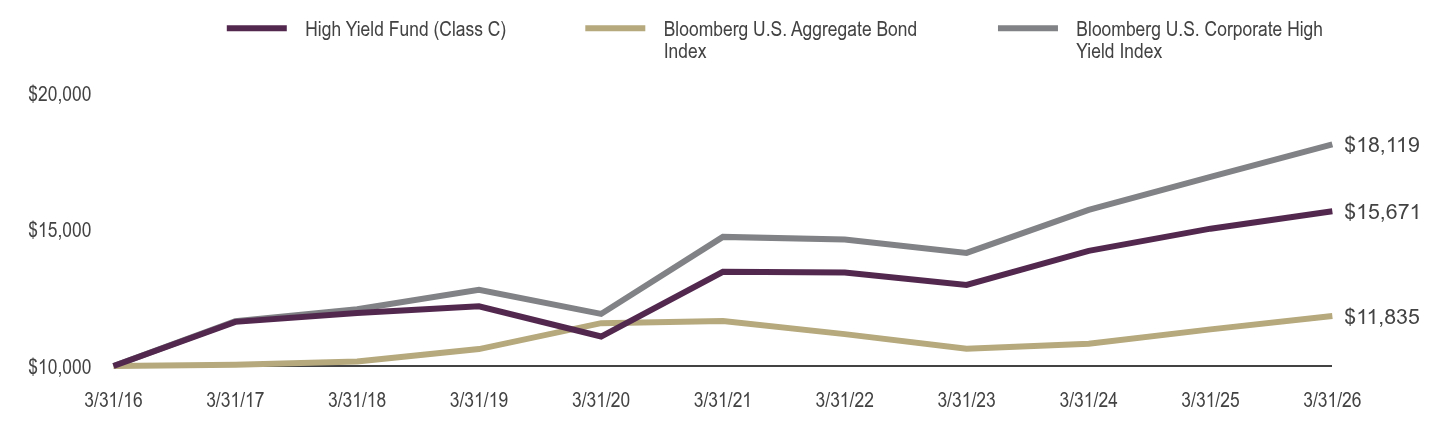
Table Summary | High Yield Fund (Class C) | Bloomberg U.S. Aggregate Bond Index | Bloomberg U.S. Corporate High Yield Index |
|---|
3/31/16 | $10,000 | $10,000 | $10,000 |
|---|
3/31/17 | $11,618 | $10,044 | $11,639 |
|---|
3/31/18 | $11,940 | $10,165 | $12,079 |
|---|
3/31/19 | $12,189 | $10,620 | $12,796 |
|---|
3/31/20 | $11,080 | $11,569 | $11,908 |
|---|
3/31/21 | $13,453 | $11,651 | $14,732 |
|---|
3/31/22 | $13,423 | $11,168 | $14,635 |
|---|
3/31/23 | $12,968 | $10,633 | $14,146 |
|---|
3/31/24 | $14,220 | $10,814 | $15,723 |
|---|
3/31/25 | $15,033 | $11,342 | $16,933 |
|---|
3/31/26 | $15,671 | $11,835 | $18,119 |
|---|
|
| AssetsNet |
$ 164,476,925
|
| Holdings Count | Holding |
323
|
| InvestmentCompanyPortfolioTurnover |
26.00%
|
| Additional Fund Statistics [Text Block] |
Fund Statistics as of March 31, 2026 - Net Assets$164,476,925
- Total Number of Portfolio Holdings323
- Portfolio Turnover Rate26%
|
| Holdings [Text Block] |
Portfolio Composition by Quality RatingFootnote Reference1 (% of Total Investments) as of March 31, 2026 Table SummaryBBB | 6.2% |
|---|
BB | 53.3% |
|---|
B | 30.4% |
|---|
CCC | 6.5% |
|---|
NRFootnote Referencea | 1.4% |
|---|
Other Investments | 2.2% |
|---|
Holdings DiversificationFootnote Reference3 (% of Net Assets) as of March 31, 2026 Table SummaryValue | Value |
|---|
Other | 2.5% | Senior Floating Rate Interests | 5.7% | Corporate Bonds | 87.5% | |
| Largest Holdings [Text Block] |
10 Largest HoldingsFootnote Reference2 (% of Net Assets) as of March 31, 2026 Table SummaryCPI CG, Inc. 10.00% due 07/15/29 | 1.0% |
|---|
ITT Holdings LLC 6.50% due 08/01/29 | 0.9% |
|---|
Wolverine World Wide, Inc. 4.00% due 08/15/29 | 0.8% |
|---|
Trinity Industries, Inc. 7.75% due 07/15/28 | 0.8% |
|---|
PetSmart LLC / PetSmart Finance Corp. 7.50% due 09/15/32 | 0.8% |
|---|
Enviri Corp. 5.75% due 07/31/27 | 0.8% |
|---|
Nassau Companies of New York 7.88% due 07/15/30 | 0.8% |
|---|
TransMontaigne Partners LLC 8.50% due 06/15/30 | 0.8% |
|---|
Ardonagh Finco Ltd. 7.75% due 02/15/31 | 0.8% |
|---|
New Enterprise Stone & Lime Company, Inc. 9.75% due 07/15/28 | 0.7% |
|---|
Total | 8.2% |
|---|
|
| Material Fund Change [Text Block] |
|
| C000155967 |
|
| Shareholder Report [Line Items] |
|
| Fund Name |
Guggenheim High Yield Fund
|
| Class Name |
Class P
|
| Trading Symbol |
SIHPX
|
| Annual or Semi-Annual Statement [Text Block] |
This semi-annual shareholder report contains important information about the Guggenheim High Yield Fund for the period from October 1, 2025 to March 31, 2026.
|
| Shareholder Report Annual or Semi-Annual |
Semi-Annual Shareholder Report
|
| Additional Information [Text Block] |
You can find additional information about the fund at GuggenheimInvestments.com/mutual-funds/literature. You can also request this information by contacting 800 820 0888 or services@guggenheiminvestments.com.
|
| Additional Information Phone Number |
800 820 0888
|
| Additional Information Email |
<span style="box-sizing: border-box; color: rgb(67, 67, 67); display: inline; flex-wrap: nowrap; font-size: 10.6667px; font-weight: 400; grid-area: auto; line-height: 12.8px; margin: 0px; overflow: visible; text-align: left; text-align-last: auto; white-space-collapse: preserve-breaks;">services@guggenheiminvestments.com</span>
|
| Additional Information Website |
<span style="box-sizing: border-box; color: rgb(67, 67, 67); display: inline; flex-wrap: nowrap; font-size: 10.6667px; font-weight: 400; grid-area: auto; line-height: 12.8px; margin: 0px; overflow: visible; text-align: left; text-align-last: auto; white-space-collapse: preserve-breaks;">GuggenheimInvestments.com/mutual-funds/literature</span>
|
| Expenses [Text Block] |
What were the Fund's costs for the last six months? * Based on a hypothetical $10,000 investment Table SummaryClass | Costs of a $10,000 Investment | Costs Paid as a % of a $10,000 Investment** |
|---|
Class P | $45 | 0.91% |
|---|
Table Summary* | Excludes expenses of the underlying funds in which the fund invests, if any. |
|---|
** | Annualized |
|---|
|
| Expenses Paid, Amount |
$ 45
|
| Factors Affecting Performance [Text Block] |
What factors materially affected the Fund's performance over the last six months? The primary contributor to fund performance was strong credit selection in the capital goods sector, as the fund avoided weaker credits in the benchmark. The bank loan allocation, while providing portfolio diversification and seniority benefits, was a detractor on a relative basis as loans slightly underperformed bonds. In addition, the underweight to energy was a drag as it was the top performing sector amid higher oil prices and the conflict in the Middle East. |
| Line Graph [Table Text Block] |
Table Summary | High Yield Fund (Class P) | Bloomberg U.S. Aggregate Bond Index | Bloomberg U.S. Corporate High Yield Index |
|---|
3/31/16 | $10,000 | $10,000 | $10,000 |
|---|
3/31/17 | $11,726 | $10,044 | $11,639 |
|---|
3/31/18 | $12,129 | $10,165 | $12,079 |
|---|
3/31/19 | $12,466 | $10,620 | $12,796 |
|---|
3/31/20 | $11,427 | $11,569 | $11,908 |
|---|
3/31/21 | $13,966 | $11,651 | $14,732 |
|---|
3/31/22 | $14,032 | $11,168 | $14,635 |
|---|
3/31/23 | $13,665 | $10,633 | $14,146 |
|---|
3/31/24 | $15,104 | $10,814 | $15,723 |
|---|
3/31/25 | $16,087 | $11,342 | $16,933 |
|---|
3/31/26 | $16,879 | $11,835 | $18,119 |
|---|
|
| AssetsNet |
$ 164,476,925
|
| Holdings Count | Holding |
323
|
| InvestmentCompanyPortfolioTurnover |
26.00%
|
| Additional Fund Statistics [Text Block] |
Fund Statistics as of March 31, 2026 - Net Assets$164,476,925
- Total Number of Portfolio Holdings323
- Portfolio Turnover Rate26%
|
| Holdings [Text Block] |
Portfolio Composition by Quality RatingFootnote Reference1 (% of Total Investments) as of March 31, 2026 Table SummaryBBB | 6.2% |
|---|
BB | 53.3% |
|---|
B | 30.4% |
|---|
CCC | 6.5% |
|---|
NRFootnote Referencea | 1.4% |
|---|
Other Investments | 2.2% |
|---|
Holdings DiversificationFootnote Reference3 (% of Net Assets) as of March 31, 2026 Table SummaryValue | Value |
|---|
Other | 2.5% | Senior Floating Rate Interests | 5.7% | Corporate Bonds | 87.5% | |
| Largest Holdings [Text Block] |
10 Largest HoldingsFootnote Reference2 (% of Net Assets) as of March 31, 2026 Table SummaryCPI CG, Inc. 10.00% due 07/15/29 | 1.0% |
|---|
ITT Holdings LLC 6.50% due 08/01/29 | 0.9% |
|---|
Wolverine World Wide, Inc. 4.00% due 08/15/29 | 0.8% |
|---|
Trinity Industries, Inc. 7.75% due 07/15/28 | 0.8% |
|---|
PetSmart LLC / PetSmart Finance Corp. 7.50% due 09/15/32 | 0.8% |
|---|
Enviri Corp. 5.75% due 07/31/27 | 0.8% |
|---|
Nassau Companies of New York 7.88% due 07/15/30 | 0.8% |
|---|
TransMontaigne Partners LLC 8.50% due 06/15/30 | 0.8% |
|---|
Ardonagh Finco Ltd. 7.75% due 02/15/31 | 0.8% |
|---|
New Enterprise Stone & Lime Company, Inc. 9.75% due 07/15/28 | 0.7% |
|---|
Total | 8.2% |
|---|
|
| Material Fund Change [Text Block] |
|
| C000136513 |
|
| Shareholder Report [Line Items] |
|
| Fund Name |
Guggenheim High Yield Fund
|
| Class Name |
Institutional Class
|
| Trading Symbol |
SHYIX
|
| Annual or Semi-Annual Statement [Text Block] |
This semi-annual shareholder report contains important information about the Guggenheim High Yield Fund for the period from October 1, 2025 to March 31, 2026.
|
| Shareholder Report Annual or Semi-Annual |
Semi-Annual Shareholder Report
|
| Additional Information [Text Block] |
You can find additional information about the fund at GuggenheimInvestments.com/mutual-funds/literature. You can also request this information by contacting 800 820 0888 or services@guggenheiminvestments.com.
|
| Additional Information Phone Number |
800 820 0888
|
| Additional Information Email |
<span style="box-sizing: border-box; color: rgb(67, 67, 67); display: inline; flex-wrap: nowrap; font-size: 10.6667px; font-weight: 400; grid-area: auto; line-height: 12.8px; margin: 0px; overflow: visible; text-align: left; text-align-last: auto; white-space-collapse: preserve-breaks;">services@guggenheiminvestments.com</span>
|
| Additional Information Website |
<span style="box-sizing: border-box; color: rgb(67, 67, 67); display: inline; flex-wrap: nowrap; font-size: 10.6667px; font-weight: 400; grid-area: auto; line-height: 12.8px; margin: 0px; overflow: visible; text-align: left; text-align-last: auto; white-space-collapse: preserve-breaks;">GuggenheimInvestments.com/mutual-funds/literature</span>
|
| Expenses [Text Block] |
What were the Fund's costs for the last six months? * Based on a hypothetical $10,000 investment Table SummaryClass | Costs of a $10,000 Investment | Costs Paid as a % of a $10,000 Investment** |
|---|
Institutional Class | $33 | 0.66% |
|---|
Table Summary* | Excludes expenses of the underlying funds in which the fund invests, if any. |
|---|
** | Annualized |
|---|
|
| Expenses Paid, Amount |
$ 33
|
| Factors Affecting Performance [Text Block] |
What factors materially affected the Fund's performance over the last six months? The primary contributor to fund performance was strong credit selection in the capital goods sector, as the fund avoided weaker credits in the benchmark. The bank loan allocation, while providing portfolio diversification and seniority benefits, was a detractor on a relative basis as loans slightly underperformed bonds. In addition, the underweight to energy was a drag as it was the top performing sector amid higher oil prices and the conflict in the Middle East. |
| Line Graph [Table Text Block] |
Table Summary | High Yield Fund (Institutional Class) | Bloomberg U.S. Aggregate Bond Index | Bloomberg U.S. Corporate High Yield Index |
|---|
3/31/16 | $2,000,000 | $2,000,000 | $2,000,000 |
|---|
3/31/17 | $2,351,022 | $2,008,812 | $2,327,771 |
|---|
3/31/18 | $2,439,735 | $2,032,978 | $2,415,780 |
|---|
3/31/19 | $2,514,341 | $2,124,067 | $2,559,109 |
|---|
3/31/20 | $2,311,180 | $2,313,827 | $2,381,603 |
|---|
3/31/21 | $2,832,366 | $2,330,260 | $2,946,461 |
|---|
3/31/22 | $2,855,572 | $2,233,505 | $2,927,042 |
|---|
3/31/23 | $2,786,513 | $2,126,668 | $2,829,136 |
|---|
3/31/24 | $3,089,743 | $2,162,781 | $3,144,648 |
|---|
3/31/25 | $3,298,049 | $2,268,317 | $3,386,508 |
|---|
3/31/26 | $3,469,317 | $2,366,958 | $3,623,895 |
|---|
|
| AssetsNet |
$ 164,476,925
|
| Holdings Count | Holding |
323
|
| InvestmentCompanyPortfolioTurnover |
26.00%
|
| Additional Fund Statistics [Text Block] |
Fund Statistics as of March 31, 2026 - Net Assets$164,476,925
- Total Number of Portfolio Holdings323
- Portfolio Turnover Rate26%
|
| Holdings [Text Block] |
Portfolio Composition by Quality RatingFootnote Reference1 (% of Total Investments) as of March 31, 2026 Table SummaryBBB | 6.2% |
|---|
BB | 53.3% |
|---|
B | 30.4% |
|---|
CCC | 6.5% |
|---|
NRFootnote Referencea | 1.4% |
|---|
Other Investments | 2.2% |
|---|
Holdings DiversificationFootnote Reference3 (% of Net Assets) as of March 31, 2026 Table SummaryValue | Value |
|---|
Other | 2.5% | Senior Floating Rate Interests | 5.7% | Corporate Bonds | 87.5% | |
| Largest Holdings [Text Block] |
10 Largest HoldingsFootnote Reference2 (% of Net Assets) as of March 31, 2026 Table SummaryCPI CG, Inc. 10.00% due 07/15/29 | 1.0% |
|---|
ITT Holdings LLC 6.50% due 08/01/29 | 0.9% |
|---|
Wolverine World Wide, Inc. 4.00% due 08/15/29 | 0.8% |
|---|
Trinity Industries, Inc. 7.75% due 07/15/28 | 0.8% |
|---|
PetSmart LLC / PetSmart Finance Corp. 7.50% due 09/15/32 | 0.8% |
|---|
Enviri Corp. 5.75% due 07/31/27 | 0.8% |
|---|
Nassau Companies of New York 7.88% due 07/15/30 | 0.8% |
|---|
TransMontaigne Partners LLC 8.50% due 06/15/30 | 0.8% |
|---|
Ardonagh Finco Ltd. 7.75% due 02/15/31 | 0.8% |
|---|
New Enterprise Stone & Lime Company, Inc. 9.75% due 07/15/28 | 0.7% |
|---|
Total | 8.2% |
|---|
|
| Material Fund Change [Text Block] |
|
| C000152102 |
|
| Shareholder Report [Line Items] |
|
| Fund Name |
Guggenheim High Yield Fund
|
| Class Name |
Class R6
|
| Trading Symbol |
SHYSX
|
| Annual or Semi-Annual Statement [Text Block] |
This semi-annual shareholder report contains important information about the Guggenheim High Yield Fund for the period from October 1, 2025 to March 31, 2026.
|
| Shareholder Report Annual or Semi-Annual |
Semi-Annual Shareholder Report
|
| Additional Information [Text Block] |
You can find additional information about the fund at GuggenheimInvestments.com/mutual-funds/literature. You can also request this information by contacting 800 820 0888 or services@guggenheiminvestments.com.
|
| Additional Information Phone Number |
800 820 0888
|
| Additional Information Email |
<span style="box-sizing: border-box; color: rgb(67, 67, 67); display: inline; flex-wrap: nowrap; font-size: 10.6667px; font-weight: 400; grid-area: auto; line-height: 12.8px; margin: 0px; overflow: visible; text-align: left; text-align-last: auto; white-space-collapse: preserve-breaks;">services@guggenheiminvestments.com</span>
|
| Additional Information Website |
<span style="box-sizing: border-box; color: rgb(67, 67, 67); display: inline; flex-wrap: nowrap; font-size: 10.6667px; font-weight: 400; grid-area: auto; line-height: 12.8px; margin: 0px; overflow: visible; text-align: left; text-align-last: auto; white-space-collapse: preserve-breaks;">GuggenheimInvestments.com/mutual-funds/literature</span>
|
| Expenses [Text Block] |
What were the Fund's costs for the last six months? * Based on a hypothetical $10,000 investment Table SummaryClass | Costs of a $10,000 Investment | Costs Paid as a % of a $10,000 Investment** |
|---|
Class R6 | $33 | 0.66% |
|---|
Table Summary* | Excludes expenses of the underlying funds in which the fund invests, if any. |
|---|
** | Annualized |
|---|
|
| Expenses Paid, Amount |
$ 33
|
| Factors Affecting Performance [Text Block] |
What factors materially affected the Fund's performance over the last six months? The primary contributor to fund performance was strong credit selection in the capital goods sector, as the fund avoided weaker credits in the benchmark. The bank loan allocation, while providing portfolio diversification and seniority benefits, was a detractor on a relative basis as loans slightly underperformed bonds. In addition, the underweight to energy was a drag as it was the top performing sector amid higher oil prices and the conflict in the Middle East. |
| Line Graph [Table Text Block] |
Table Summary | High Yield Fund (Class R6) | Bloomberg U.S. Aggregate Bond Index | Bloomberg U.S. Corporate High Yield Index |
|---|
5/15/17 | $10,000 | $10,000 | $10,000 |
|---|
3/31/18 | $10,236 | $10,045 | $10,224 |
|---|
3/31/19 | $10,562 | $10,495 | $10,830 |
|---|
3/31/20 | $9,717 | $11,432 | $10,079 |
|---|
3/31/21 | $11,927 | $11,513 | $12,469 |
|---|
3/31/22 | $12,038 | $11,036 | $12,387 |
|---|
3/31/23 | $11,756 | $10,508 | $11,972 |
|---|
3/31/24 | $13,035 | $10,687 | $13,307 |
|---|
3/31/25 | $13,919 | $11,208 | $14,330 |
|---|
3/31/26 | $14,646 | $11,695 | $15,337 |
|---|
|
| AssetsNet |
$ 164,476,925
|
| Holdings Count | Holding |
323
|
| InvestmentCompanyPortfolioTurnover |
26.00%
|
| Additional Fund Statistics [Text Block] |
Fund Statistics as of March 31, 2026 - Net Assets$164,476,925
- Total Number of Portfolio Holdings323
- Portfolio Turnover Rate26%
|
| Holdings [Text Block] |
Portfolio Composition by Quality RatingFootnote Reference1 (% of Total Investments) as of March 31, 2026 Table SummaryBBB | 6.2% |
|---|
BB | 53.3% |
|---|
B | 30.4% |
|---|
CCC | 6.5% |
|---|
NRFootnote Referencea | 1.4% |
|---|
Other Investments | 2.2% |
|---|
Holdings DiversificationFootnote Reference3 (% of Net Assets) as of March 31, 2026 Table SummaryValue | Value |
|---|
Other | 2.5% | Senior Floating Rate Interests | 5.7% | Corporate Bonds | 87.5% | |
| Largest Holdings [Text Block] |
10 Largest HoldingsFootnote Reference2 (% of Net Assets) as of March 31, 2026 Table SummaryCPI CG, Inc. 10.00% due 07/15/29 | 1.0% |
|---|
ITT Holdings LLC 6.50% due 08/01/29 | 0.9% |
|---|
Wolverine World Wide, Inc. 4.00% due 08/15/29 | 0.8% |
|---|
Trinity Industries, Inc. 7.75% due 07/15/28 | 0.8% |
|---|
PetSmart LLC / PetSmart Finance Corp. 7.50% due 09/15/32 | 0.8% |
|---|
Enviri Corp. 5.75% due 07/31/27 | 0.8% |
|---|
Nassau Companies of New York 7.88% due 07/15/30 | 0.8% |
|---|
TransMontaigne Partners LLC 8.50% due 06/15/30 | 0.8% |
|---|
Ardonagh Finco Ltd. 7.75% due 02/15/31 | 0.8% |
|---|
New Enterprise Stone & Lime Company, Inc. 9.75% due 07/15/28 | 0.7% |
|---|
Total | 8.2% |
|---|
|
| Material Fund Change [Text Block] |
|
| C000136507 |
|
| Shareholder Report [Line Items] |
|
| Fund Name |
Guggenheim Limited Duration Fund
|
| Class Name |
Class A
|
| Trading Symbol |
GILDX
|
| Annual or Semi-Annual Statement [Text Block] |
This semi-annual shareholder report contains important information about the Guggenheim Limited Duration Fund for the period from October 1, 2025 to March 31, 2026.
|
| Shareholder Report Annual or Semi-Annual |
Semi-Annual Shareholder Report
|
| Additional Information [Text Block] |
You can find additional information about the fund at GuggenheimInvestments.com/mutual-funds/literature. You can also request this information by contacting 800 820 0888 or services@guggenheiminvestments.com.
|
| Additional Information Phone Number |
800 820 0888
|
| Additional Information Email |
<span style="box-sizing: border-box; color: rgb(67, 67, 67); display: inline; flex-wrap: nowrap; font-size: 10.6667px; font-weight: 400; grid-area: auto; line-height: 12.8px; margin: 0px; overflow: visible; text-align: left; text-align-last: auto; white-space-collapse: preserve-breaks;">services@guggenheiminvestments.com</span>
|
| Additional Information Website |
<span style="box-sizing: border-box; color: rgb(67, 67, 67); display: inline; flex-wrap: nowrap; font-size: 10.6667px; font-weight: 400; grid-area: auto; line-height: 12.8px; margin: 0px; overflow: visible; text-align: left; text-align-last: auto; white-space-collapse: preserve-breaks;">GuggenheimInvestments.com/mutual-funds/literature</span>
|
| Expenses [Text Block] |
What were the Fund's costs for the last six months? * Based on a hypothetical $10,000 investment Table SummaryClass | Costs of a $10,000 Investment | Costs Paid as a % of a $10,000 Investment** |
|---|
Class A | $36 | 0.71% |
|---|
Table Summary* | Excludes expenses of the underlying funds in which the fund invests, if any. |
|---|
** | Annualized |
|---|
|
| Expenses Paid, Amount |
$ 36
|
| Factors Affecting Performance [Text Block] |
What factors materially affected the Fund's performance over the last six months? Positive performance over the period was driven by carry (or earned income), attributable to the fund's allocations to high-grade securitized credit sectors. Duration was the largest detractor from performance as rates rose over the period. Additionally, spread widening across fixed income-sectors, prompted by heightened geopolitical tensions, detracted modestly from performance. The effect was felt broadly across credit-sensitive holdings, though spread tightening within Agency and non-Agency residential mortgage-backed securities (RMBS) sectors helped mitigate the overall impact of spread widening. |
| Line Graph [Table Text Block] |
Table Summary | Limited Duration Fund (Class A)‡ | Bloomberg U.S. Aggregate Bond Index | Bloomberg U.S. Aggregate Bond 1-3 Year Total Return Index |
|---|
3/31/16 | $9,775 | $10,000 | $10,000 |
|---|
3/31/17 | $10,251 | $10,044 | $10,074 |
|---|
3/31/18 | $10,474 | $10,165 | $10,099 |
|---|
3/31/19 | $10,658 | $10,620 | $10,407 |
|---|
3/31/20 | $10,775 | $11,569 | $10,889 |
|---|
3/31/21 | $11,463 | $11,651 | $11,018 |
|---|
3/31/22 | $11,247 | $11,168 | $10,698 |
|---|
3/31/23 | $11,249 | $10,633 | $10,723 |
|---|
3/31/24 | $11,905 | $10,814 | $11,105 |
|---|
3/31/25 | $12,639 | $11,342 | $11,728 |
|---|
3/31/26 | $13,199 | $11,835 | $12,201 |
|---|
|
| AssetsNet |
$ 5,769,853,184
|
| Holdings Count | Holding |
919
|
| InvestmentCompanyPortfolioTurnover |
23.00%
|
| Additional Fund Statistics [Text Block] |
Fund Statistics as of March 31, 2026 - Net Assets$5,769,853,184
- Total Number of Portfolio Holdings919
- Portfolio Turnover Rate23%
|
| Holdings [Text Block] |
Portfolio Composition by Quality RatingFootnote Reference1 (% of Total Investments) as of March 31, 2026 Table SummaryAAA | 26.3% |
|---|
AA | 27.8% |
|---|
A | 17.3% |
|---|
BBB | 15.3% |
|---|
BB | 5.1% |
|---|
B | 0.9% |
|---|
CCC | 0.4% |
|---|
CC | 0.1% |
|---|
NRFootnote Referencea | 4.7% |
|---|
Other Investments | 2.1% |
|---|
Holdings DiversificationFootnote Reference3 (% of Net Assets) as of March 31, 2026 Table SummaryValue | Value |
|---|
Other | 4.4% | Centrally Cleared Interest Rate Swap Agreements Receive | -12.0% | Interest Rate Futures Contracts Sold Short | -5.0% | Interest Rate Futures Contracts Purchased | 7.6% | Corporate Bonds | 28.2% | Asset-Backed Securities | 28.2% | Centrally Cleared Interest Rate Swap Agreements Pay | 40.1% | Collateralized Mortgage Obligations | 44.9% | |
| Largest Holdings [Text Block] |
10 Largest HoldingsFootnote Reference2 (% of Net Assets) as of March 31, 2026 Table SummaryUniform MBS 15 Year 4.50% due 05/01/41 | 7.5% |
|---|
Uniform MBS 15 Year 4.50% due 06/01/41 | 2.4% |
|---|
Uniform MBS 30 Year 5.00% due 06/01/56 | 1.0% |
|---|
Uniform MBS 30 Year 5.50% due 06/01/56 | 0.8% |
|---|
Freddie Mac 5.50% due 02/01/56 | 0.8% |
|---|
Freddie Mac 5.00% due 07/25/55 | 0.8% |
|---|
Freddie Mac 5.00% due 06/01/55 | 0.8% |
|---|
Golub Capital Partners CLO 54M, LP 2021-54A A1R, 5.13% (3 Month Term SOFR + 1.47%, Rate Floor: 1.47%) due 08/05/37 | 0.7% |
|---|
NLT Trust 2025-NQM1, 7.46% (WAC) due 10/25/70 | 0.7% |
|---|
Guggenheim Ultra Short Duration Fund — Institutional Class | 0.6% |
|---|
Total | 16.1% |
|---|
|
| Material Fund Change [Text Block] |
|
| C000136508 |
|
| Shareholder Report [Line Items] |
|
| Fund Name |
Guggenheim Limited Duration Fund
|
| Class Name |
Class C
|
| Trading Symbol |
GILFX
|
| Annual or Semi-Annual Statement [Text Block] |
This semi-annual shareholder report contains important information about the Guggenheim Limited Duration Fund for the period from October 1, 2025 to March 31, 2026.
|
| Shareholder Report Annual or Semi-Annual |
Semi-Annual Shareholder Report
|
| Additional Information [Text Block] |
You can find additional information about the fund at GuggenheimInvestments.com/mutual-funds/literature. You can also request this information by contacting 800 820 0888 or services@guggenheiminvestments.com.
|
| Additional Information Phone Number |
800 820 0888
|
| Additional Information Email |
<span style="box-sizing: border-box; color: rgb(67, 67, 67); display: inline; flex-wrap: nowrap; font-size: 10.6667px; font-weight: 400; grid-area: auto; line-height: 12.8px; margin: 0px; overflow: visible; text-align: left; text-align-last: auto; white-space-collapse: preserve-breaks;">services@guggenheiminvestments.com</span>
|
| Additional Information Website |
<span style="box-sizing: border-box; color: rgb(67, 67, 67); display: inline; flex-wrap: nowrap; font-size: 10.6667px; font-weight: 400; grid-area: auto; line-height: 12.8px; margin: 0px; overflow: visible; text-align: left; text-align-last: auto; white-space-collapse: preserve-breaks;">GuggenheimInvestments.com/mutual-funds/literature</span>
|
| Expenses [Text Block] |
What were the Fund's costs for the last six months? * Based on a hypothetical $10,000 investment Table SummaryClass | Costs of a $10,000 Investment | Costs Paid as a % of a $10,000 Investment** |
|---|
Class C | $73 | 1.46% |
|---|
Table Summary* | Excludes expenses of the underlying funds in which the fund invests, if any. |
|---|
** | Annualized |
|---|
|
| Expenses Paid, Amount |
$ 73
|
| Factors Affecting Performance [Text Block] |
What factors materially affected the Fund's performance over the last six months? Positive performance over the period was driven by carry (or earned income), attributable to the fund's allocations to high-grade securitized credit sectors. Duration was the largest detractor from performance as rates rose over the period. Additionally, spread widening across fixed income-sectors, prompted by heightened geopolitical tensions, detracted modestly from performance. The effect was felt broadly across credit-sensitive holdings, though spread tightening within Agency and non-Agency residential mortgage-backed securities (RMBS) sectors helped mitigate the overall impact of spread widening. |
| Line Graph [Table Text Block] |
Table Summary | Limited Duration Fund (Class C) | Bloomberg U.S. Aggregate Bond Index | Bloomberg U.S. Aggregate Bond 1-3 Year Total Return Index |
|---|
3/31/16 | $10,000 | $10,000 | $10,000 |
|---|
3/31/17 | $10,411 | $10,044 | $10,074 |
|---|
3/31/18 | $10,562 | $10,165 | $10,099 |
|---|
3/31/19 | $10,664 | $10,620 | $10,407 |
|---|
3/31/20 | $10,705 | $11,569 | $10,889 |
|---|
3/31/21 | $11,299 | $11,651 | $11,018 |
|---|
3/31/22 | $11,008 | $11,168 | $10,698 |
|---|
3/31/23 | $10,923 | $10,633 | $10,723 |
|---|
3/31/24 | $11,474 | $10,814 | $11,105 |
|---|
3/31/25 | $12,092 | $11,342 | $11,728 |
|---|
3/31/26 | $12,534 | $11,835 | $12,201 |
|---|
|
| AssetsNet |
$ 5,769,853,184
|
| Holdings Count | Holding |
919
|
| InvestmentCompanyPortfolioTurnover |
23.00%
|
| Additional Fund Statistics [Text Block] |
Fund Statistics as of March 31, 2026 - Net Assets$5,769,853,184
- Total Number of Portfolio Holdings919
- Portfolio Turnover Rate23%
|
| Holdings [Text Block] |
Portfolio Composition by Quality RatingFootnote Reference1 (% of Total Investments) as of March 31, 2026 Table SummaryAAA | 26.3% |
|---|
AA | 27.8% |
|---|
A | 17.3% |
|---|
BBB | 15.3% |
|---|
BB | 5.1% |
|---|
B | 0.9% |
|---|
CCC | 0.4% |
|---|
CC | 0.1% |
|---|
NRFootnote Referencea | 4.7% |
|---|
Other Investments | 2.1% |
|---|
Holdings DiversificationFootnote Reference3 (% of Net Assets) as of March 31, 2026 Table SummaryValue | Value |
|---|
Other | 4.4% | Centrally Cleared Interest Rate Swap Agreements Receive | -12.0% | Interest Rate Futures Contracts Sold Short | -5.0% | Interest Rate Futures Contracts Purchased | 7.6% | Corporate Bonds | 28.2% | Asset-Backed Securities | 28.2% | Centrally Cleared Interest Rate Swap Agreements Pay | 40.1% | Collateralized Mortgage Obligations | 44.9% | |
| Largest Holdings [Text Block] |
10 Largest HoldingsFootnote Reference2 (% of Net Assets) as of March 31, 2026 Table SummaryUniform MBS 15 Year 4.50% due 05/01/41 | 7.5% |
|---|
Uniform MBS 15 Year 4.50% due 06/01/41 | 2.4% |
|---|
Uniform MBS 30 Year 5.00% due 06/01/56 | 1.0% |
|---|
Uniform MBS 30 Year 5.50% due 06/01/56 | 0.8% |
|---|
Freddie Mac 5.50% due 02/01/56 | 0.8% |
|---|
Freddie Mac 5.00% due 07/25/55 | 0.8% |
|---|
Freddie Mac 5.00% due 06/01/55 | 0.8% |
|---|
Golub Capital Partners CLO 54M, LP 2021-54A A1R, 5.13% (3 Month Term SOFR + 1.47%, Rate Floor: 1.47%) due 08/05/37 | 0.7% |
|---|
NLT Trust 2025-NQM1, 7.46% (WAC) due 10/25/70 | 0.7% |
|---|
Guggenheim Ultra Short Duration Fund — Institutional Class | 0.6% |
|---|
Total | 16.1% |
|---|
|
| Material Fund Change [Text Block] |
|
| C000155965 |
|
| Shareholder Report [Line Items] |
|
| Fund Name |
Guggenheim Limited Duration Fund
|
| Class Name |
Class P
|
| Trading Symbol |
GILPX
|
| Annual or Semi-Annual Statement [Text Block] |
This semi-annual shareholder report contains important information about the Guggenheim Limited Duration Fund for the period from October 1, 2025 to March 31, 2026.
|
| Shareholder Report Annual or Semi-Annual |
Semi-Annual Shareholder Report
|
| Additional Information [Text Block] |
You can find additional information about the fund at GuggenheimInvestments.com/mutual-funds/literature. You can also request this information by contacting 800 820 0888 or services@guggenheiminvestments.com.
|
| Additional Information Phone Number |
800 820 0888
|
| Additional Information Email |
<span style="box-sizing: border-box; color: rgb(67, 67, 67); display: inline; flex-wrap: nowrap; font-size: 10.6667px; font-weight: 400; grid-area: auto; line-height: 12.8px; margin: 0px; overflow: visible; text-align: left; text-align-last: auto; white-space-collapse: preserve-breaks;">services@guggenheiminvestments.com</span>
|
| Additional Information Website |
<span style="box-sizing: border-box; color: rgb(67, 67, 67); display: inline; flex-wrap: nowrap; font-size: 10.6667px; font-weight: 400; grid-area: auto; line-height: 12.8px; margin: 0px; overflow: visible; text-align: left; text-align-last: auto; white-space-collapse: preserve-breaks;">GuggenheimInvestments.com/mutual-funds/literature</span>
|
| Expenses [Text Block] |
What were the Fund's costs for the last six months? * Based on a hypothetical $10,000 investment Table SummaryClass | Costs of a $10,000 Investment | Costs Paid as a % of a $10,000 Investment** |
|---|
Class P | $36 | 0.71% |
|---|
Table Summary* | Excludes expenses of the underlying funds in which the fund invests, if any. |
|---|
** | Annualized |
|---|
|
| Expenses Paid, Amount |
$ 36
|
| Factors Affecting Performance [Text Block] |
What factors materially affected the Fund's performance over the last six months? Positive performance over the period was driven by carry (or earned income), attributable to the fund's allocations to high-grade securitized credit sectors. Duration was the largest detractor from performance as rates rose over the period. Additionally, spread widening across fixed income-sectors, prompted by heightened geopolitical tensions, detracted modestly from performance. The effect was felt broadly across credit-sensitive holdings, though spread tightening within Agency and non-Agency residential mortgage-backed securities (RMBS) sectors helped mitigate the overall impact of spread widening. |
| Line Graph [Table Text Block] |
Table Summary | Limited Duration Fund (Class P) | Bloomberg U.S. Aggregate Bond Index | Bloomberg U.S. Aggregate Bond 1-3 Year Total Return Index |
|---|
3/31/16 | $10,000 | $10,000 | $10,000 |
|---|
3/31/17 | $10,487 | $10,044 | $10,074 |
|---|
3/31/18 | $10,715 | $10,165 | $10,099 |
|---|
3/31/19 | $10,903 | $10,620 | $10,407 |
|---|
3/31/20 | $11,023 | $11,569 | $10,889 |
|---|
3/31/21 | $11,726 | $11,651 | $11,018 |
|---|
3/31/22 | $11,506 | $11,168 | $10,698 |
|---|
3/31/23 | $11,508 | $10,633 | $10,723 |
|---|
3/31/24 | $12,179 | $10,814 | $11,105 |
|---|
3/31/25 | $12,925 | $11,342 | $11,728 |
|---|
3/31/26 | $13,492 | $11,835 | $12,201 |
|---|
|
| AssetsNet |
$ 5,769,853,184
|
| Holdings Count | Holding |
919
|
| InvestmentCompanyPortfolioTurnover |
23.00%
|
| Additional Fund Statistics [Text Block] |
Fund Statistics as of March 31, 2026 - Net Assets$5,769,853,184
- Total Number of Portfolio Holdings919
- Portfolio Turnover Rate23%
|
| Holdings [Text Block] |
Portfolio Composition by Quality RatingFootnote Reference1 (% of Total Investments) as of March 31, 2026 Table SummaryAAA | 26.3% |
|---|
AA | 27.8% |
|---|
A | 17.3% |
|---|
BBB | 15.3% |
|---|
BB | 5.1% |
|---|
B | 0.9% |
|---|
CCC | 0.4% |
|---|
CC | 0.1% |
|---|
NRFootnote Referencea | 4.7% |
|---|
Other Investments | 2.1% |
|---|
Holdings DiversificationFootnote Reference3 (% of Net Assets) as of March 31, 2026 Table SummaryValue | Value |
|---|
Other | 4.4% | Centrally Cleared Interest Rate Swap Agreements Receive | -12.0% | Interest Rate Futures Contracts Sold Short | -5.0% | Interest Rate Futures Contracts Purchased | 7.6% | Corporate Bonds | 28.2% | Asset-Backed Securities | 28.2% | Centrally Cleared Interest Rate Swap Agreements Pay | 40.1% | Collateralized Mortgage Obligations | 44.9% | |
| Largest Holdings [Text Block] |
10 Largest HoldingsFootnote Reference2 (% of Net Assets) as of March 31, 2026 Table SummaryUniform MBS 15 Year 4.50% due 05/01/41 | 7.5% |
|---|
Uniform MBS 15 Year 4.50% due 06/01/41 | 2.4% |
|---|
Uniform MBS 30 Year 5.00% due 06/01/56 | 1.0% |
|---|
Uniform MBS 30 Year 5.50% due 06/01/56 | 0.8% |
|---|
Freddie Mac 5.50% due 02/01/56 | 0.8% |
|---|
Freddie Mac 5.00% due 07/25/55 | 0.8% |
|---|
Freddie Mac 5.00% due 06/01/55 | 0.8% |
|---|
Golub Capital Partners CLO 54M, LP 2021-54A A1R, 5.13% (3 Month Term SOFR + 1.47%, Rate Floor: 1.47%) due 08/05/37 | 0.7% |
|---|
NLT Trust 2025-NQM1, 7.46% (WAC) due 10/25/70 | 0.7% |
|---|
Guggenheim Ultra Short Duration Fund — Institutional Class | 0.6% |
|---|
Total | 16.1% |
|---|
|
| Material Fund Change [Text Block] |
|
| C000136509 |
|
| Shareholder Report [Line Items] |
|
| Fund Name |
Guggenheim Limited Duration Fund
|
| Class Name |
Institutional Class
|
| Trading Symbol |
GILHX
|
| Annual or Semi-Annual Statement [Text Block] |
This semi-annual shareholder report contains important information about the Guggenheim Limited Duration Fund for the period from October 1, 2025 to March 31, 2026.
|
| Shareholder Report Annual or Semi-Annual |
Semi-Annual Shareholder Report
|
| Additional Information [Text Block] |
You can find additional information about the fund at GuggenheimInvestments.com/mutual-funds/literature. You can also request this information by contacting 800 820 0888 or services@guggenheiminvestments.com.
|
| Additional Information Phone Number |
800 820 0888
|
| Additional Information Email |
<span style="box-sizing: border-box; color: rgb(67, 67, 67); display: inline; flex-wrap: nowrap; font-size: 10.6667px; font-weight: 400; grid-area: auto; line-height: 12.8px; margin: 0px; overflow: visible; text-align: left; text-align-last: auto; white-space-collapse: preserve-breaks;">services@guggenheiminvestments.com</span>
|
| Additional Information Website |
<span style="box-sizing: border-box; color: rgb(67, 67, 67); display: inline; flex-wrap: nowrap; font-size: 10.6667px; font-weight: 400; grid-area: auto; line-height: 12.8px; margin: 0px; overflow: visible; text-align: left; text-align-last: auto; white-space-collapse: preserve-breaks;">GuggenheimInvestments.com/mutual-funds/literature</span>
|
| Expenses [Text Block] |
What were the Fund's costs for the last six months? * Based on a hypothetical $10,000 investment Table SummaryClass | Costs of a $10,000 Investment | Costs Paid as a % of a $10,000 Investment** |
|---|
Institutional Class | $23 | 0.46% |
|---|
Table Summary* | Excludes expenses of the underlying funds in which the fund invests, if any. |
|---|
** | Annualized |
|---|
|
| Expenses Paid, Amount |
$ 23
|
| Factors Affecting Performance [Text Block] |
What factors materially affected the Fund's performance over the last six months? Positive performance over the period was driven by carry (or earned income), attributable to the fund's allocations to high-grade securitized credit sectors. Duration was the largest detractor from performance as rates rose over the period. Additionally, spread widening across fixed income-sectors, prompted by heightened geopolitical tensions, detracted modestly from performance. The effect was felt broadly across credit-sensitive holdings, though spread tightening within Agency and non-Agency residential mortgage-backed securities (RMBS) sectors helped mitigate the overall impact of spread widening. |
| Line Graph [Table Text Block] |
Table Summary | Limited Duration Fund (Institutional Class) | Bloomberg U.S. Aggregate Bond Index | Bloomberg U.S. Aggregate Bond 1-3 Year Total Return Index |
|---|
3/31/16 | $2,000,000 | $2,000,000 | $2,000,000 |
|---|
3/31/17 | $2,102,994 | $2,008,812 | $2,014,822 |
|---|
3/31/18 | $2,155,056 | $2,032,978 | $2,019,841 |
|---|
3/31/19 | $2,197,491 | $2,124,067 | $2,081,481 |
|---|
3/31/20 | $2,228,004 | $2,313,827 | $2,177,783 |
|---|
3/31/21 | $2,375,161 | $2,330,260 | $2,203,662 |
|---|
3/31/22 | $2,337,285 | $2,233,505 | $2,139,513 |
|---|
3/31/23 | $2,342,433 | $2,126,668 | $2,144,689 |
|---|
3/31/24 | $2,486,296 | $2,162,781 | $2,220,994 |
|---|
3/31/25 | $2,645,292 | $2,268,317 | $2,345,606 |
|---|
3/31/26 | $2,769,302 | $2,366,958 | $2,440,184 |
|---|
|
| AssetsNet |
$ 5,769,853,184
|
| Holdings Count | Holding |
919
|
| InvestmentCompanyPortfolioTurnover |
23.00%
|
| Additional Fund Statistics [Text Block] |
Fund Statistics as of March 31, 2026 - Net Assets$5,769,853,184
- Total Number of Portfolio Holdings919
- Portfolio Turnover Rate23%
|
| Holdings [Text Block] |
Portfolio Composition by Quality RatingFootnote Reference1 (% of Total Investments) as of March 31, 2026 Table SummaryAAA | 26.3% |
|---|
AA | 27.8% |
|---|
A | 17.3% |
|---|
BBB | 15.3% |
|---|
BB | 5.1% |
|---|
B | 0.9% |
|---|
CCC | 0.4% |
|---|
CC | 0.1% |
|---|
NRFootnote Referencea | 4.7% |
|---|
Other Investments | 2.1% |
|---|
Holdings DiversificationFootnote Reference3 (% of Net Assets) as of March 31, 2026 Table SummaryValue | Value |
|---|
Other | 4.4% | Centrally Cleared Interest Rate Swap Agreements Receive | -12.0% | Interest Rate Futures Contracts Sold Short | -5.0% | Interest Rate Futures Contracts Purchased | 7.6% | Corporate Bonds | 28.2% | Asset-Backed Securities | 28.2% | Centrally Cleared Interest Rate Swap Agreements Pay | 40.1% | Collateralized Mortgage Obligations | 44.9% | |
| Largest Holdings [Text Block] |
10 Largest HoldingsFootnote Reference2 (% of Net Assets) as of March 31, 2026 Table SummaryUniform MBS 15 Year 4.50% due 05/01/41 | 7.5% |
|---|
Uniform MBS 15 Year 4.50% due 06/01/41 | 2.4% |
|---|
Uniform MBS 30 Year 5.00% due 06/01/56 | 1.0% |
|---|
Uniform MBS 30 Year 5.50% due 06/01/56 | 0.8% |
|---|
Freddie Mac 5.50% due 02/01/56 | 0.8% |
|---|
Freddie Mac 5.00% due 07/25/55 | 0.8% |
|---|
Freddie Mac 5.00% due 06/01/55 | 0.8% |
|---|
Golub Capital Partners CLO 54M, LP 2021-54A A1R, 5.13% (3 Month Term SOFR + 1.47%, Rate Floor: 1.47%) due 08/05/37 | 0.7% |
|---|
NLT Trust 2025-NQM1, 7.46% (WAC) due 10/25/70 | 0.7% |
|---|
Guggenheim Ultra Short Duration Fund — Institutional Class | 0.6% |
|---|
Total | 16.1% |
|---|
|
| Material Fund Change [Text Block] |
|
| C000152100 |
|
| Shareholder Report [Line Items] |
|
| Fund Name |
Guggenheim Limited Duration Fund
|
| Class Name |
Class R6
|
| Trading Symbol |
GIKRX
|
| Annual or Semi-Annual Statement [Text Block] |
This semi-annual shareholder report contains important information about the Guggenheim Limited Duration Fund for the period from October 1, 2025 to March 31, 2026.
|
| Shareholder Report Annual or Semi-Annual |
Semi-Annual Shareholder Report
|
| Additional Information [Text Block] |
You can find additional information about the fund at GuggenheimInvestments.com/mutual-funds/literature. You can also request this information by contacting 800 820 0888 or services@guggenheiminvestments.com.
|
| Additional Information Phone Number |
800 820 0888
|
| Additional Information Email |
<span style="box-sizing: border-box; color: rgb(67, 67, 67); display: inline; flex-wrap: nowrap; font-size: 10.6667px; font-weight: 400; grid-area: auto; line-height: 12.8px; margin: 0px; overflow: visible; text-align: left; text-align-last: auto; white-space-collapse: preserve-breaks;">services@guggenheiminvestments.com</span>
|
| Additional Information Website |
<span style="box-sizing: border-box; color: rgb(67, 67, 67); display: inline; flex-wrap: nowrap; font-size: 10.6667px; font-weight: 400; grid-area: auto; line-height: 12.8px; margin: 0px; overflow: visible; text-align: left; text-align-last: auto; white-space-collapse: preserve-breaks;">GuggenheimInvestments.com/mutual-funds/literature</span>
|
| Expenses [Text Block] |
What were the Fund's costs for the last six months? * Based on a hypothetical $10,000 investment Table SummaryClass | Costs of a $10,000 Investment | Costs Paid as a % of a $10,000 Investment** |
|---|
Class R6 | $21 | 0.41% |
|---|
Table Summary* | Excludes expenses of the underlying funds in which the fund invests, if any. |
|---|
** | Annualized |
|---|
|
| Expenses Paid, Amount |
$ 21
|
| Factors Affecting Performance [Text Block] |
What factors materially affected the Fund's performance over the last six months? Positive performance over the period was driven by carry (or earned income), attributable to the fund's allocations to high-grade securitized credit sectors. Duration was the largest detractor from performance as rates rose over the period. Additionally, spread widening across fixed income-sectors, prompted by heightened geopolitical tensions, detracted modestly from performance. The effect was felt broadly across credit-sensitive holdings, though spread tightening within Agency and non-Agency residential mortgage-backed securities (RMBS) sectors helped mitigate the overall impact of spread widening. |
| Line Graph [Table Text Block] |
Table Summary | Limited Duration Fund (Class R6) | Bloomberg U.S. Aggregate Bond Index | Bloomberg U.S. Aggregate Bond 1-3 Year Total Return Index |
|---|
3/13/19 | $10,000 | $10,000 | $10,000 |
|---|
3/31/19 | $10,019 | $10,126 | $10,044 |
|---|
3/31/20 | $10,157 | $11,030 | $10,509 |
|---|
3/31/21 | $10,833 | $11,109 | $10,634 |
|---|
3/31/22 | $10,656 | $10,648 | $10,325 |
|---|
3/31/23 | $10,684 | $10,139 | $10,349 |
|---|
3/31/24 | $11,345 | $10,311 | $10,718 |
|---|
3/31/25 | $12,077 | $10,814 | $11,319 |
|---|
3/31/26 | $12,650 | $11,284 | $11,774 |
|---|
|
| AssetsNet |
$ 5,769,853,184
|
| Holdings Count | Holding |
919
|
| InvestmentCompanyPortfolioTurnover |
23.00%
|
| Additional Fund Statistics [Text Block] |
Fund Statistics as of March 31, 2026 - Net Assets$5,769,853,184
- Total Number of Portfolio Holdings919
- Portfolio Turnover Rate23%
|
| Holdings [Text Block] |
Portfolio Composition by Quality RatingFootnote Reference1 (% of Total Investments) as of March 31, 2026 Table SummaryAAA | 26.3% |
|---|
AA | 27.8% |
|---|
A | 17.3% |
|---|
BBB | 15.3% |
|---|
BB | 5.1% |
|---|
B | 0.9% |
|---|
CCC | 0.4% |
|---|
CC | 0.1% |
|---|
NRFootnote Referencea | 4.7% |
|---|
Other Investments | 2.1% |
|---|
Holdings DiversificationFootnote Reference3 (% of Net Assets) as of March 31, 2026 Table SummaryValue | Value |
|---|
Other | 4.4% | Centrally Cleared Interest Rate Swap Agreements Receive | -12.0% | Interest Rate Futures Contracts Sold Short | -5.0% | Interest Rate Futures Contracts Purchased | 7.6% | Corporate Bonds | 28.2% | Asset-Backed Securities | 28.2% | Centrally Cleared Interest Rate Swap Agreements Pay | 40.1% | Collateralized Mortgage Obligations | 44.9% | |
| Largest Holdings [Text Block] |
10 Largest HoldingsFootnote Reference2 (% of Net Assets) as of March 31, 2026 Table SummaryUniform MBS 15 Year 4.50% due 05/01/41 | 7.5% |
|---|
Uniform MBS 15 Year 4.50% due 06/01/41 | 2.4% |
|---|
Uniform MBS 30 Year 5.00% due 06/01/56 | 1.0% |
|---|
Uniform MBS 30 Year 5.50% due 06/01/56 | 0.8% |
|---|
Freddie Mac 5.50% due 02/01/56 | 0.8% |
|---|
Freddie Mac 5.00% due 07/25/55 | 0.8% |
|---|
Freddie Mac 5.00% due 06/01/55 | 0.8% |
|---|
Golub Capital Partners CLO 54M, LP 2021-54A A1R, 5.13% (3 Month Term SOFR + 1.47%, Rate Floor: 1.47%) due 08/05/37 | 0.7% |
|---|
NLT Trust 2025-NQM1, 7.46% (WAC) due 10/25/70 | 0.7% |
|---|
Guggenheim Ultra Short Duration Fund — Institutional Class | 0.6% |
|---|
Total | 16.1% |
|---|
|
| Material Fund Change [Text Block] |
|
| C000136521 |
|
| Shareholder Report [Line Items] |
|
| Fund Name |
Guggenheim Macro Opportunities Fund
|
| Class Name |
Class A
|
| Trading Symbol |
GIOAX
|
| Annual or Semi-Annual Statement [Text Block] |
This semi-annual shareholder report contains important information about the Guggenheim Macro Opportunities Fund for the period from October 1, 2025 to March 31, 2026.
|
| Shareholder Report Annual or Semi-Annual |
Semi-Annual Shareholder Report
|
| Additional Information [Text Block] |
You can find additional information about the fund at GuggenheimInvestments.com/mutual-funds/literature. You can also request this information by contacting 800 820 0888 or services@guggenheiminvestments.com.
|
| Additional Information Phone Number |
800 820 0888
|
| Additional Information Email |
<span style="box-sizing: border-box; color: rgb(67, 67, 67); display: inline; flex-wrap: nowrap; font-size: 10.6667px; font-weight: 400; grid-area: auto; line-height: 12.8px; margin: 0px; overflow: visible; text-align: left; text-align-last: auto; white-space-collapse: preserve-breaks;">services@guggenheiminvestments.com</span>
|
| Additional Information Website |
<span style="box-sizing: border-box; color: rgb(67, 67, 67); display: inline; flex-wrap: nowrap; font-size: 10.6667px; font-weight: 400; grid-area: auto; line-height: 12.8px; margin: 0px; overflow: visible; text-align: left; text-align-last: auto; white-space-collapse: preserve-breaks;">GuggenheimInvestments.com/mutual-funds/literature</span>
|
| Expenses [Text Block] |
What were the Fund's costs for the last six months? * Based on a hypothetical $10,000 investment Table SummaryClass | Costs of a $10,000 Investment | Costs Paid as a % of a $10,000 Investment** |
|---|
Class A | $64 | 1.27% |
|---|
Table Summary* | Excludes expenses of the underlying funds in which the fund invests, if any. |
|---|
** | Annualized |
|---|
|
| Expenses Paid, Amount |
$ 64
|
| Factors Affecting Performance [Text Block] |
What factors materially affected the Fund's performance over the last six months? Positive performance over the period was driven by carry (or earned income). Spread widening in below investment-grade corporate credit and collateralized loan obligations (CLOs), driven by heightened geopolitical tensions, was the largest detractor from performance. Additionally, duration detracted as rates rose over the period. |
| Line Graph [Table Text Block] |
Table Summary | Macro Opportunities Fund (Class A)‡ | Bloomberg U.S. Aggregate Bond Index | ICE BofA 3-Month U.S. Treasury Bill Index |
|---|
3/31/16 | $9,600 | $10,000 | $10,000 |
|---|
3/31/17 | $10,756 | $10,044 | $10,036 |
|---|
3/31/18 | $11,107 | $10,165 | $10,147 |
|---|
3/31/19 | $11,154 | $10,620 | $10,362 |
|---|
3/31/20 | $10,613 | $11,569 | $10,596 |
|---|
3/31/21 | $12,574 | $11,651 | $10,609 |
|---|
3/31/22 | $12,393 | $11,168 | $10,615 |
|---|
3/31/23 | $12,026 | $10,633 | $10,881 |
|---|
3/31/24 | $12,982 | $10,814 | $11,451 |
|---|
3/31/25 | $13,906 | $11,342 | $12,021 |
|---|
3/31/26 | $14,624 | $11,835 | $12,502 |
|---|
|
| AssetsNet |
$ 9,272,822,004
|
| Holdings Count | Holding |
1,284
|
| InvestmentCompanyPortfolioTurnover |
26.00%
|
| Additional Fund Statistics [Text Block] |
Fund Statistics as of March 31, 2026 - Net Assets$9,272,822,004
- Total Number of Portfolio Holdings1,284
- Portfolio Turnover Rate26%
|
| Holdings [Text Block] |
Portfolio Composition by Quality RatingFootnote Reference1 (% of Total Investments) as of March 31, 2026 Table SummaryAAA | 2.9% |
|---|
AA | 18.8% |
|---|
A | 15.3% |
|---|
BBB | 15.4% |
|---|
BB | 15.0% |
|---|
B | 20.8% |
|---|
CCC | 2.7% |
|---|
CC | 0.3% |
|---|
NRFootnote Referencea | 8.8% |
|---|
Consolidated Holdings DiversificationFootnote Reference3 (% of Net Assets) as of March 31, 2026 Table SummaryValue | Value |
|---|
Other | 10.9% | Centrally Cleared Credit Default Swap Agreements Protection Purchased | -6.6% | Interest Rate Futures Contracts Sold Short | -5.0% | Centrally Cleared Interest Rate Swap Agreements Pay | 3.8% | Interest Rate Futures Contracts Purchased | 10.1% | Asset-Backed Securities | 23.0% | Senior Floating Rate Interests | 25.3% | Collateralized Mortgage Obligations | 28.5% | Corporate Bonds | 28.7% | |
| Largest Holdings [Text Block] |
10 Largest HoldingsFootnote Reference2 (% of Net Assets) as of March 31, 2026 Table SummaryUniform MBS 30 Year 5.00% due 06/01/56 | 11.5% |
|---|
Uniform MBS 30 Year 5.50% due 06/01/56 | 2.5% |
|---|
Guggenheim Limited Duration Fund — Class R6 | 1.5% |
|---|
Uniform MBS 30 Year 3.00% due 05/01/56 | 1.3% |
|---|
Australia Government Bond 4.25% due 03/21/36 | 1.2% |
|---|
Freddie Mac 5.50% due 02/01/56 | 0.8% |
|---|
Fannie Mae 5.50% due 05/01/55 | 0.7% |
|---|
NLT Trust 2025-NQM1, 7.46% (WAC) due 10/25/70 | 0.7% |
|---|
Guggenheim Ultra Short Duration Fund — Institutional Class | 0.6% |
|---|
NLT Trust 2026-NQM1, 5.40% (WAC) due 02/25/71 | 0.5% |
|---|
Total | 21.3% |
|---|
|
| Material Fund Change [Text Block] |
|
| C000136522 |
|
| Shareholder Report [Line Items] |
|
| Fund Name |
Guggenheim Macro Opportunities Fund
|
| Class Name |
Class C
|
| Trading Symbol |
GIOCX
|
| Annual or Semi-Annual Statement [Text Block] |
This semi-annual shareholder report contains important information about the Guggenheim Macro Opportunities Fund for the period from October 1, 2025 to March 31, 2026.
|
| Shareholder Report Annual or Semi-Annual |
Semi-Annual Shareholder Report
|
| Additional Information [Text Block] |
You can find additional information about the fund at GuggenheimInvestments.com/mutual-funds/literature. You can also request this information by contacting 800 820 0888 or services@guggenheiminvestments.com.
|
| Additional Information Phone Number |
800 820 0888
|
| Additional Information Email |
<span style="box-sizing: border-box; color: rgb(67, 67, 67); display: inline; flex-wrap: nowrap; font-size: 10.6667px; font-weight: 400; grid-area: auto; line-height: 12.8px; margin: 0px; overflow: visible; text-align: left; text-align-last: auto; white-space-collapse: preserve-breaks;">services@guggenheiminvestments.com</span>
|
| Additional Information Website |
<span style="box-sizing: border-box; color: rgb(67, 67, 67); display: inline; flex-wrap: nowrap; font-size: 10.6667px; font-weight: 400; grid-area: auto; line-height: 12.8px; margin: 0px; overflow: visible; text-align: left; text-align-last: auto; white-space-collapse: preserve-breaks;">GuggenheimInvestments.com/mutual-funds/literature</span>
|
| Expenses [Text Block] |
What were the Fund's costs for the last six months? * Based on a hypothetical $10,000 investment Table SummaryClass | Costs of a $10,000 Investment | Costs Paid as a % of a $10,000 Investment** |
|---|
Class C | $101 | 2.02% |
|---|
Table Summary* | Excludes expenses of the underlying funds in which the fund invests, if any. |
|---|
** | Annualized |
|---|
|
| Expenses Paid, Amount |
$ 101
|
| Factors Affecting Performance [Text Block] |
What factors materially affected the Fund's performance over the last six months? Positive performance over the period was driven by carry (or earned income). Spread widening in below investment-grade corporate credit and collateralized loan obligations (CLOs), driven by heightened geopolitical tensions, was the largest detractor from performance. Additionally, duration detracted as rates rose over the period. |
| Line Graph [Table Text Block] |
Table Summary | Macro Opportunities Fund (Class C) | Bloomberg U.S. Aggregate Bond Index | ICE BofA 3-Month U.S. Treasury Bill Index |
|---|
3/31/16 | $10,000 | $10,000 | $10,000 |
|---|
3/31/17 | $11,126 | $10,044 | $10,036 |
|---|
3/31/18 | $11,400 | $10,165 | $10,147 |
|---|
3/31/19 | $11,368 | $10,620 | $10,362 |
|---|
3/31/20 | $10,735 | $11,569 | $10,596 |
|---|
3/31/21 | $12,621 | $11,651 | $10,609 |
|---|
3/31/22 | $12,347 | $11,168 | $10,615 |
|---|
3/31/23 | $11,892 | $10,633 | $10,881 |
|---|
3/31/24 | $12,743 | $10,814 | $11,451 |
|---|
3/31/25 | $13,559 | $11,342 | $12,021 |
|---|
3/31/26 | $14,148 | $11,835 | $12,502 |
|---|
|
| AssetsNet |
$ 9,272,822,004
|
| Holdings Count | Holding |
1,284
|
| InvestmentCompanyPortfolioTurnover |
26.00%
|
| Additional Fund Statistics [Text Block] |
Fund Statistics as of March 31, 2026 - Net Assets$9,272,822,004
- Total Number of Portfolio Holdings1,284
- Portfolio Turnover Rate26%
|
| Holdings [Text Block] |
Portfolio Composition by Quality RatingFootnote Reference1 (% of Total Investments) as of March 31, 2026 Table SummaryAAA | 2.9% |
|---|
AA | 18.8% |
|---|
A | 15.3% |
|---|
BBB | 15.4% |
|---|
BB | 15.0% |
|---|
B | 20.8% |
|---|
CCC | 2.7% |
|---|
CC | 0.3% |
|---|
NRFootnote Referencea | 8.8% |
|---|
Consolidated Holdings DiversificationFootnote Reference3 (% of Net Assets) as of March 31, 2026 Table SummaryValue | Value |
|---|
Other | 10.9% | Centrally Cleared Credit Default Swap Agreements Protection Purchased | -6.6% | Interest Rate Futures Contracts Sold Short | -5.0% | Centrally Cleared Interest Rate Swap Agreements Pay | 3.8% | Interest Rate Futures Contracts Purchased | 10.1% | Asset-Backed Securities | 23.0% | Senior Floating Rate Interests | 25.3% | Collateralized Mortgage Obligations | 28.5% | Corporate Bonds | 28.7% | |
| Largest Holdings [Text Block] |
10 Largest HoldingsFootnote Reference2 (% of Net Assets) as of March 31, 2026 Table SummaryUniform MBS 30 Year 5.00% due 06/01/56 | 11.5% |
|---|
Uniform MBS 30 Year 5.50% due 06/01/56 | 2.5% |
|---|
Guggenheim Limited Duration Fund — Class R6 | 1.5% |
|---|
Uniform MBS 30 Year 3.00% due 05/01/56 | 1.3% |
|---|
Australia Government Bond 4.25% due 03/21/36 | 1.2% |
|---|
Freddie Mac 5.50% due 02/01/56 | 0.8% |
|---|
Fannie Mae 5.50% due 05/01/55 | 0.7% |
|---|
NLT Trust 2025-NQM1, 7.46% (WAC) due 10/25/70 | 0.7% |
|---|
Guggenheim Ultra Short Duration Fund — Institutional Class | 0.6% |
|---|
NLT Trust 2026-NQM1, 5.40% (WAC) due 02/25/71 | 0.5% |
|---|
Total | 21.3% |
|---|
|
| Material Fund Change [Text Block] |
|
| C000155969 |
|
| Shareholder Report [Line Items] |
|
| Fund Name |
Guggenheim Macro Opportunities Fund
|
| Class Name |
Class P
|
| Trading Symbol |
GIOPX
|
| Annual or Semi-Annual Statement [Text Block] |
This semi-annual shareholder report contains important information about the Guggenheim Macro Opportunities Fund for the period from October 1, 2025 to March 31, 2026.
|
| Shareholder Report Annual or Semi-Annual |
Semi-Annual Shareholder Report
|
| Additional Information [Text Block] |
You can find additional information about the fund at GuggenheimInvestments.com/mutual-funds/literature. You can also request this information by contacting 800 820 0888 or services@guggenheiminvestments.com.
|
| Additional Information Phone Number |
800 820 0888
|
| Additional Information Email |
<span style="box-sizing: border-box; color: rgb(67, 67, 67); display: inline; flex-wrap: nowrap; font-size: 10.6667px; font-weight: 400; grid-area: auto; line-height: 12.8px; margin: 0px; overflow: visible; text-align: left; text-align-last: auto; white-space-collapse: preserve-breaks;">services@guggenheiminvestments.com</span>
|
| Additional Information Website |
<span style="box-sizing: border-box; color: rgb(67, 67, 67); display: inline; flex-wrap: nowrap; font-size: 10.6667px; font-weight: 400; grid-area: auto; line-height: 12.8px; margin: 0px; overflow: visible; text-align: left; text-align-last: auto; white-space-collapse: preserve-breaks;">GuggenheimInvestments.com/mutual-funds/literature</span>
|
| Expenses [Text Block] |
What were the Fund's costs for the last six months? * Based on a hypothetical $10,000 investment Table SummaryClass | Costs of a $10,000 Investment | Costs Paid as a % of a $10,000 Investment** |
|---|
Class P | $66 | 1.32% |
|---|
Table Summary* | Excludes expenses of the underlying funds in which the fund invests, if any. |
|---|
** | Annualized |
|---|
|
| Expenses Paid, Amount |
$ 66
|
| Factors Affecting Performance [Text Block] |
What factors materially affected the Fund's performance over the last six months? Positive performance over the period was driven by carry (or earned income). Spread widening in below investment-grade corporate credit and collateralized loan obligations (CLOs), driven by heightened geopolitical tensions, was the largest detractor from performance. Additionally, duration detracted as rates rose over the period. |
| Line Graph [Table Text Block] |
Table Summary | Macro Opportunities Fund (Class P) | Bloomberg U.S. Aggregate Bond Index | ICE BofA 3-Month U.S. Treasury Bill Index |
|---|
3/31/16 | $10,000 | $10,000 | $10,000 |
|---|
3/31/17 | $11,219 | $10,044 | $10,036 |
|---|
3/31/18 | $11,584 | $10,165 | $10,147 |
|---|
3/31/19 | $11,633 | $10,620 | $10,362 |
|---|
3/31/20 | $11,069 | $11,569 | $10,596 |
|---|
3/31/21 | $13,112 | $11,651 | $10,609 |
|---|
3/31/22 | $12,923 | $11,168 | $10,615 |
|---|
3/31/23 | $12,541 | $10,633 | $10,881 |
|---|
3/31/24 | $13,536 | $10,814 | $11,451 |
|---|
3/31/25 | $14,488 | $11,342 | $12,021 |
|---|
3/31/26 | $15,226 | $11,835 | $12,502 |
|---|
|
| AssetsNet |
$ 9,272,822,004
|
| Holdings Count | Holding |
1,284
|
| InvestmentCompanyPortfolioTurnover |
26.00%
|
| Additional Fund Statistics [Text Block] |
Fund Statistics as of March 31, 2026 - Net Assets$9,272,822,004
- Total Number of Portfolio Holdings1,284
- Portfolio Turnover Rate26%
|
| Holdings [Text Block] |
Portfolio Composition by Quality RatingFootnote Reference1 (% of Total Investments) as of March 31, 2026 Table SummaryAAA | 2.9% |
|---|
AA | 18.8% |
|---|
A | 15.3% |
|---|
BBB | 15.4% |
|---|
BB | 15.0% |
|---|
B | 20.8% |
|---|
CCC | 2.7% |
|---|
CC | 0.3% |
|---|
NRFootnote Referencea | 8.8% |
|---|
Consolidated Holdings DiversificationFootnote Reference3 (% of Net Assets) as of March 31, 2026 Table SummaryValue | Value |
|---|
Other | 10.9% | Centrally Cleared Credit Default Swap Agreements Protection Purchased | -6.6% | Interest Rate Futures Contracts Sold Short | -5.0% | Centrally Cleared Interest Rate Swap Agreements Pay | 3.8% | Interest Rate Futures Contracts Purchased | 10.1% | Asset-Backed Securities | 23.0% | Senior Floating Rate Interests | 25.3% | Collateralized Mortgage Obligations | 28.5% | Corporate Bonds | 28.7% | |
| Largest Holdings [Text Block] |
10 Largest HoldingsFootnote Reference2 (% of Net Assets) as of March 31, 2026 Table SummaryUniform MBS 30 Year 5.00% due 06/01/56 | 11.5% |
|---|
Uniform MBS 30 Year 5.50% due 06/01/56 | 2.5% |
|---|
Guggenheim Limited Duration Fund — Class R6 | 1.5% |
|---|
Uniform MBS 30 Year 3.00% due 05/01/56 | 1.3% |
|---|
Australia Government Bond 4.25% due 03/21/36 | 1.2% |
|---|
Freddie Mac 5.50% due 02/01/56 | 0.8% |
|---|
Fannie Mae 5.50% due 05/01/55 | 0.7% |
|---|
NLT Trust 2025-NQM1, 7.46% (WAC) due 10/25/70 | 0.7% |
|---|
Guggenheim Ultra Short Duration Fund — Institutional Class | 0.6% |
|---|
NLT Trust 2026-NQM1, 5.40% (WAC) due 02/25/71 | 0.5% |
|---|
Total | 21.3% |
|---|
|
| Material Fund Change [Text Block] |
|
| C000136523 |
|
| Shareholder Report [Line Items] |
|
| Fund Name |
Guggenheim Macro Opportunities Fund
|
| Class Name |
Institutional Class
|
| Trading Symbol |
GIOIX
|
| Annual or Semi-Annual Statement [Text Block] |
This semi-annual shareholder report contains important information about the Guggenheim Macro Opportunities Fund for the period from October 1, 2025 to March 31, 2026.
|
| Shareholder Report Annual or Semi-Annual |
Semi-Annual Shareholder Report
|
| Additional Information [Text Block] |
You can find additional information about the fund at GuggenheimInvestments.com/mutual-funds/literature. You can also request this information by contacting 800 820 0888 or services@guggenheiminvestments.com.
|
| Additional Information Phone Number |
800 820 0888
|
| Additional Information Email |
<span style="box-sizing: border-box; color: rgb(67, 67, 67); display: inline; flex-wrap: nowrap; font-size: 10.6667px; font-weight: 400; grid-area: auto; line-height: 12.8px; margin: 0px; overflow: visible; text-align: left; text-align-last: auto; white-space-collapse: preserve-breaks;">services@guggenheiminvestments.com</span>
|
| Additional Information Website |
<span style="box-sizing: border-box; color: rgb(67, 67, 67); display: inline; flex-wrap: nowrap; font-size: 10.6667px; font-weight: 400; grid-area: auto; line-height: 12.8px; margin: 0px; overflow: visible; text-align: left; text-align-last: auto; white-space-collapse: preserve-breaks;">GuggenheimInvestments.com/mutual-funds/literature</span>
|
| Expenses [Text Block] |
What were the Fund's costs for the last six months? * Based on a hypothetical $10,000 investment Table SummaryClass | Costs of a $10,000 Investment | Costs Paid as a % of a $10,000 Investment** |
|---|
Institutional Class | $46 | 0.91% |
|---|
Table Summary* | Excludes expenses of the underlying funds in which the fund invests, if any. |
|---|
** | Annualized |
|---|
|
| Expenses Paid, Amount |
$ 46
|
| Factors Affecting Performance [Text Block] |
What factors materially affected the Fund's performance over the last six months? Positive performance over the period was driven by carry (or earned income). Spread widening in below investment-grade corporate credit and collateralized loan obligations (CLOs), driven by heightened geopolitical tensions, was the largest detractor from performance. Additionally, duration detracted as rates rose over the period. |
| Line Graph [Table Text Block] |
Table Summary | Macro Opportunities Fund (Institutional Class) | Bloomberg U.S. Aggregate Bond Index | ICE BofA 3-Month U.S. Treasury Bill Index |
|---|
3/31/16 | $2,000,000 | $2,000,000 | $2,000,000 |
|---|
3/31/17 | $2,249,945 | $2,008,812 | $2,007,125 |
|---|
3/31/18 | $2,332,085 | $2,032,978 | $2,029,397 |
|---|
3/31/19 | $2,351,464 | $2,124,067 | $2,072,494 |
|---|
3/31/20 | $2,246,643 | $2,313,827 | $2,119,211 |
|---|
3/31/21 | $2,671,632 | $2,330,260 | $2,121,702 |
|---|
3/31/22 | $2,644,013 | $2,233,505 | $2,123,034 |
|---|
3/31/23 | $2,575,258 | $2,126,668 | $2,176,210 |
|---|
3/31/24 | $2,790,587 | $2,162,781 | $2,290,295 |
|---|
3/31/25 | $2,999,776 | $2,268,317 | $2,404,176 |
|---|
3/31/26 | $3,164,698 | $2,366,958 | $2,500,304 |
|---|
|
| AssetsNet |
$ 9,272,822,004
|
| Holdings Count | Holding |
1,284
|
| InvestmentCompanyPortfolioTurnover |
26.00%
|
| Additional Fund Statistics [Text Block] |
Fund Statistics as of March 31, 2026 - Net Assets$9,272,822,004
- Total Number of Portfolio Holdings1,284
- Portfolio Turnover Rate26%
|
| Holdings [Text Block] |
Portfolio Composition by Quality RatingFootnote Reference1 (% of Total Investments) as of March 31, 2026 Table SummaryAAA | 2.9% |
|---|
AA | 18.8% |
|---|
A | 15.3% |
|---|
BBB | 15.4% |
|---|
BB | 15.0% |
|---|
B | 20.8% |
|---|
CCC | 2.7% |
|---|
CC | 0.3% |
|---|
NRFootnote Referencea | 8.8% |
|---|
Consolidated Holdings DiversificationFootnote Reference3 (% of Net Assets) as of March 31, 2026 Table SummaryValue | Value |
|---|
Other | 10.9% | Centrally Cleared Credit Default Swap Agreements Protection Purchased | -6.6% | Interest Rate Futures Contracts Sold Short | -5.0% | Centrally Cleared Interest Rate Swap Agreements Pay | 3.8% | Interest Rate Futures Contracts Purchased | 10.1% | Asset-Backed Securities | 23.0% | Senior Floating Rate Interests | 25.3% | Collateralized Mortgage Obligations | 28.5% | Corporate Bonds | 28.7% | |
| Largest Holdings [Text Block] |
10 Largest HoldingsFootnote Reference2 (% of Net Assets) as of March 31, 2026 Table SummaryUniform MBS 30 Year 5.00% due 06/01/56 | 11.5% |
|---|
Uniform MBS 30 Year 5.50% due 06/01/56 | 2.5% |
|---|
Guggenheim Limited Duration Fund — Class R6 | 1.5% |
|---|
Uniform MBS 30 Year 3.00% due 05/01/56 | 1.3% |
|---|
Australia Government Bond 4.25% due 03/21/36 | 1.2% |
|---|
Freddie Mac 5.50% due 02/01/56 | 0.8% |
|---|
Fannie Mae 5.50% due 05/01/55 | 0.7% |
|---|
NLT Trust 2025-NQM1, 7.46% (WAC) due 10/25/70 | 0.7% |
|---|
Guggenheim Ultra Short Duration Fund — Institutional Class | 0.6% |
|---|
NLT Trust 2026-NQM1, 5.40% (WAC) due 02/25/71 | 0.5% |
|---|
Total | 21.3% |
|---|
|
| Material Fund Change [Text Block] |
|
| C000152104 |
|
| Shareholder Report [Line Items] |
|
| Fund Name |
Guggenheim Macro Opportunities Fund
|
| Class Name |
Class R6
|
| Trading Symbol |
GIOSX
|
| Annual or Semi-Annual Statement [Text Block] |
This semi-annual shareholder report contains important information about the Guggenheim Macro Opportunities Fund for the period from October 1, 2025 to March 31, 2026.
|
| Shareholder Report Annual or Semi-Annual |
Semi-Annual Shareholder Report
|
| Additional Information [Text Block] |
You can find additional information about the fund at GuggenheimInvestments.com/mutual-funds/literature. You can also request this information by contacting 800 820 0888 or services@guggenheiminvestments.com.
|
| Additional Information Phone Number |
800 820 0888
|
| Additional Information Email |
<span style="box-sizing: border-box; color: rgb(67, 67, 67); display: inline; flex-wrap: nowrap; font-size: 10.6667px; font-weight: 400; grid-area: auto; line-height: 12.8px; margin: 0px; overflow: visible; text-align: left; text-align-last: auto; white-space-collapse: preserve-breaks;">services@guggenheiminvestments.com</span>
|
| Additional Information Website |
<span style="box-sizing: border-box; color: rgb(67, 67, 67); display: inline; flex-wrap: nowrap; font-size: 10.6667px; font-weight: 400; grid-area: auto; line-height: 12.8px; margin: 0px; overflow: visible; text-align: left; text-align-last: auto; white-space-collapse: preserve-breaks;">GuggenheimInvestments.com/mutual-funds/literature</span>
|
| Expenses [Text Block] |
What were the Fund's costs for the last six months? * Based on a hypothetical $10,000 investment Table SummaryClass | Costs of a $10,000 Investment | Costs Paid as a % of a $10,000 Investment** |
|---|
Class R6 | $46 | 0.91% |
|---|
Table Summary* | Excludes expenses of the underlying funds in which the fund invests, if any. |
|---|
** | Annualized |
|---|
|
| Expenses Paid, Amount |
$ 46
|
| Factors Affecting Performance [Text Block] |
What factors materially affected the Fund's performance over the last six months? Positive performance over the period was driven by carry (or earned income). Spread widening in below investment-grade corporate credit and collateralized loan obligations (CLOs), driven by heightened geopolitical tensions, was the largest detractor from performance. Additionally, duration detracted as rates rose over the period. |
| Line Graph [Table Text Block] |
Table Summary | Macro Opportunities Fund (Class R6) | Bloomberg U.S. Aggregate Bond Index | ICE BofA 3-Month U.S. Treasury Bill Index |
|---|
3/13/19 | $10,000 | $10,000 | $10,000 |
|---|
3/31/19 | $10,005 | $10,126 | $10,013 |
|---|
3/31/20 | $9,556 | $11,030 | $10,238 |
|---|
3/31/21 | $11,367 | $11,109 | $10,251 |
|---|
3/31/22 | $11,249 | $10,648 | $10,257 |
|---|
3/31/23 | $10,961 | $10,139 | $10,514 |
|---|
3/31/24 | $11,878 | $10,311 | $11,065 |
|---|
3/31/25 | $12,769 | $10,814 | $11,615 |
|---|
3/31/26 | $13,471 | $11,284 | $12,080 |
|---|
|
| AssetsNet |
$ 9,272,822,004
|
| Holdings Count | Holding |
1,284
|
| InvestmentCompanyPortfolioTurnover |
26.00%
|
| Additional Fund Statistics [Text Block] |
Fund Statistics as of March 31, 2026 - Net Assets$9,272,822,004
- Total Number of Portfolio Holdings1,284
- Portfolio Turnover Rate26%
|
| Holdings [Text Block] |
Portfolio Composition by Quality RatingFootnote Reference1 (% of Total Investments) as of March 31, 2026 Table SummaryAAA | 2.9% |
|---|
AA | 18.8% |
|---|
A | 15.3% |
|---|
BBB | 15.4% |
|---|
BB | 15.0% |
|---|
B | 20.8% |
|---|
CCC | 2.7% |
|---|
CC | 0.3% |
|---|
NRFootnote Referencea | 8.8% |
|---|
Consolidated Holdings DiversificationFootnote Reference3 (% of Net Assets) as of March 31, 2026 Table SummaryValue | Value |
|---|
Other | 10.9% | Centrally Cleared Credit Default Swap Agreements Protection Purchased | -6.6% | Interest Rate Futures Contracts Sold Short | -5.0% | Centrally Cleared Interest Rate Swap Agreements Pay | 3.8% | Interest Rate Futures Contracts Purchased | 10.1% | Asset-Backed Securities | 23.0% | Senior Floating Rate Interests | 25.3% | Collateralized Mortgage Obligations | 28.5% | Corporate Bonds | 28.7% | |
| Largest Holdings [Text Block] |
10 Largest HoldingsFootnote Reference2 (% of Net Assets) as of March 31, 2026 Table SummaryUniform MBS 30 Year 5.00% due 06/01/56 | 11.5% |
|---|
Uniform MBS 30 Year 5.50% due 06/01/56 | 2.5% |
|---|
Guggenheim Limited Duration Fund — Class R6 | 1.5% |
|---|
Uniform MBS 30 Year 3.00% due 05/01/56 | 1.3% |
|---|
Australia Government Bond 4.25% due 03/21/36 | 1.2% |
|---|
Freddie Mac 5.50% due 02/01/56 | 0.8% |
|---|
Fannie Mae 5.50% due 05/01/55 | 0.7% |
|---|
NLT Trust 2025-NQM1, 7.46% (WAC) due 10/25/70 | 0.7% |
|---|
Guggenheim Ultra Short Duration Fund — Institutional Class | 0.6% |
|---|
NLT Trust 2026-NQM1, 5.40% (WAC) due 02/25/71 | 0.5% |
|---|
Total | 21.3% |
|---|
|
| Material Fund Change [Text Block] |
|
| C000136524 |
|
| Shareholder Report [Line Items] |
|
| Fund Name |
Guggenheim Municipal Income Fund
|
| Class Name |
Class A
|
| Trading Symbol |
GIJAX
|
| Annual or Semi-Annual Statement [Text Block] |
This semi-annual shareholder report contains important information about the Guggenheim Municipal Income Fund for the period from October 1, 2025 to March 31, 2026.
|
| Shareholder Report Annual or Semi-Annual |
Semi-Annual Shareholder Report
|
| Additional Information [Text Block] |
You can find additional information about the fund at GuggenheimInvestments.com/mutual-funds/literature. You can also request this information by contacting 800 820 0888 or services@guggenheiminvestments.com.
|
| Additional Information Phone Number |
800 820 0888
|
| Additional Information Email |
<span style="box-sizing: border-box; color: rgb(67, 67, 67); display: inline; flex-wrap: nowrap; font-size: 10.6667px; font-weight: 400; grid-area: auto; line-height: 12.8px; margin: 0px; overflow: visible; text-align: left; text-align-last: auto; white-space-collapse: preserve-breaks;">services@guggenheiminvestments.com</span>
|
| Additional Information Website |
<span style="box-sizing: border-box; color: rgb(67, 67, 67); display: inline; flex-wrap: nowrap; font-size: 10.6667px; font-weight: 400; grid-area: auto; line-height: 12.8px; margin: 0px; overflow: visible; text-align: left; text-align-last: auto; white-space-collapse: preserve-breaks;">GuggenheimInvestments.com/mutual-funds/literature</span>
|
| Expenses [Text Block] |
What were the Fund's costs for the last six months? * Based on a hypothetical $10,000 investment Table SummaryClass | Costs of a $10,000 Investment | Costs Paid as a % of a $10,000 Investment** |
|---|
Class A | $38 | 0.76% |
|---|
Table Summary* | Excludes expenses of the underlying funds in which the fund invests, if any. |
|---|
** | Annualized |
|---|
|
| Expenses Paid, Amount |
$ 38
|
| Factors Affecting Performance [Text Block] |
What factors materially affected the Fund's performance over the last six months? The fund’s performance was driven by duration positioning and spread compression. Incremental exposure to the long end of the curve has been additive as tax exempts bull flattened throughout the end of 2025. School districts and housing bonds contributed to performance, while transportation and city obligations detracted. At the state level, California contributed to returns while New York detracted. |
| Line Graph [Table Text Block] |
Table Summary | Municipal Income Fund (Class A)‡ | Bloomberg Municipal Bond Index | Bloomberg Municipal Long Bond Index |
|---|
3/31/16 | $9,600 | $10,000 | $10,000 |
|---|
3/31/17 | $9,546 | $10,015 | $10,039 |
|---|
3/31/18 | $9,868 | $10,282 | $10,508 |
|---|
3/31/19 | $10,338 | $10,835 | $11,124 |
|---|
3/31/20 | $10,683 | $11,252 | $11,670 |
|---|
3/31/21 | $11,320 | $11,872 | $12,489 |
|---|
3/31/22 | $10,462 | $11,342 | $11,827 |
|---|
3/31/23 | $10,225 | $11,371 | $11,396 |
|---|
3/31/24 | $10,416 | $11,726 | $11,863 |
|---|
3/31/25 | $10,630 | $11,869 | $11,942 |
|---|
3/31/26 | $11,187 | $12,379 | $12,328 |
|---|
|
| AssetsNet |
$ 40,236,350
|
| Holdings Count | Holding |
110
|
| InvestmentCompanyPortfolioTurnover |
14.00%
|
| Additional Fund Statistics [Text Block] |
Fund Statistics as of March 31, 2026 - Net Assets$40,236,350
- Total Number of Portfolio Holdings110
- Portfolio Turnover Rate14%
|
| Holdings [Text Block] |
Portfolio Composition by Quality RatingFootnote Reference1 (% of Total Investments) as of March 31, 2026 Table SummaryAAA | 18.8% |
|---|
AA | 57.3% |
|---|
A | 14.2% |
|---|
BBB | 6.3% |
|---|
BB | 1.2% |
|---|
NRFootnote Referencea | 0.9% |
|---|
Other Investments | 1.3% |
|---|
Holdings DiversificationFootnote Reference3 (% of Net Assets) as of March 31, 2026 Table SummaryValue | Value |
|---|
Other | 54.0% | Centrally Cleared Interest Rate Swap Agreements Receive | -11.2% | Tennessee | 4.3% | New York | 4.5% | Pennsylvania | 5.3% | Oregon | 6.2% | Michigan | 6.5% | Texas | 7.7% | California | 9.2% | Centrally Cleared Interest Rate Swap Agreements Pay | 14.0% | |
| Largest Holdings [Text Block] |
10 Largest HoldingsFootnote Reference2 (% of Net Assets) as of March 31, 2026 Table SummaryState of Georgia General Obligation Unlimited 5.00% due 01/01/31 | 2.7% |
|---|
Maine Health & Higher Educational Facilities Authority Revenue Bonds 5.25% due 07/01/48 | 2.6% |
|---|
Snohomish County Public Utility District No. 1 Electric System Revenue Bonds 5.25% due 12/01/55 | 2.6% |
|---|
Nebraska Investment Finance Authority Revenue Bonds 4.95% due 09/01/38 | 2.6% |
|---|
Arizona Industrial Development Authority Revenue Bonds 5.50% due 11/01/56 | 2.6% |
|---|
Michigan Technological University Revenue Bonds 5.25% due 10/01/53 | 2.6% |
|---|
Metropolitan Government Nashville & Davidson County Health & Educational Facilities Board Revenue Bonds 2.25% due 07/01/45 | 2.5% |
|---|
Albany Hospital Facility Authority Revenue Bonds 5.38% due 05/15/54 | 2.5% |
|---|
Westchester County Local Development Corp. Revenue Bonds 5.75% due 11/01/53 | 2.0% |
|---|
Newport Mesa Unified School District General Obligation Unlimited due 08/01/39 | 1.9% |
|---|
Total | 24.6% |
|---|
|
| Material Fund Change [Text Block] |
|
| C000136525 |
|
| Shareholder Report [Line Items] |
|
| Fund Name |
Guggenheim Municipal Income Fund
|
| Class Name |
Class C
|
| Trading Symbol |
GIJCX
|
| Annual or Semi-Annual Statement [Text Block] |
This semi-annual shareholder report contains important information about the Guggenheim Municipal Income Fund for the period from October 1, 2025 to March 31, 2026.
|
| Shareholder Report Annual or Semi-Annual |
Semi-Annual Shareholder Report
|
| Additional Information [Text Block] |
You can find additional information about the fund at GuggenheimInvestments.com/mutual-funds/literature. You can also request this information by contacting 800 820 0888 or services@guggenheiminvestments.com.
|
| Additional Information Phone Number |
800 820 0888
|
| Additional Information Email |
<span style="box-sizing: border-box; color: rgb(67, 67, 67); display: inline; flex-wrap: nowrap; font-size: 10.6667px; font-weight: 400; grid-area: auto; line-height: 12.8px; margin: 0px; overflow: visible; text-align: left; text-align-last: auto; white-space-collapse: preserve-breaks;">services@guggenheiminvestments.com</span>
|
| Additional Information Website |
<span style="box-sizing: border-box; color: rgb(67, 67, 67); display: inline; flex-wrap: nowrap; font-size: 10.6667px; font-weight: 400; grid-area: auto; line-height: 12.8px; margin: 0px; overflow: visible; text-align: left; text-align-last: auto; white-space-collapse: preserve-breaks;">GuggenheimInvestments.com/mutual-funds/literature</span>
|
| Expenses [Text Block] |
What were the Fund's costs for the last six months? * Based on a hypothetical $10,000 investment Table SummaryClass | Costs of a $10,000 Investment | Costs Paid as a % of a $10,000 Investment** |
|---|
Class C | $76 | 1.51% |
|---|
Table Summary* | Excludes expenses of the underlying funds in which the fund invests, if any. |
|---|
** | Annualized |
|---|
|
| Expenses Paid, Amount |
$ 76
|
| Factors Affecting Performance [Text Block] |
What factors materially affected the Fund's performance over the last six months? The fund’s performance was driven by duration positioning and spread compression. Incremental exposure to the long end of the curve has been additive as tax exempts bull flattened throughout the end of 2025. School districts and housing bonds contributed to performance, while transportation and city obligations detracted. At the state level, California contributed to returns while New York detracted. |
| Line Graph [Table Text Block] |
Table Summary | Municipal Income Fund (Class C) | Bloomberg Municipal Bond Index | Bloomberg Municipal Long Bond Index |
|---|
3/31/16 | $10,000 | $10,000 | $10,000 |
|---|
3/31/17 | $9,868 | $10,015 | $10,039 |
|---|
3/31/18 | $10,125 | $10,282 | $10,508 |
|---|
3/31/19 | $10,529 | $10,835 | $11,124 |
|---|
3/31/20 | $10,800 | $11,252 | $11,670 |
|---|
3/31/21 | $11,360 | $11,872 | $12,489 |
|---|
3/31/22 | $10,420 | $11,342 | $11,827 |
|---|
3/31/23 | $10,107 | $11,371 | $11,396 |
|---|
3/31/24 | $10,219 | $11,726 | $11,863 |
|---|
3/31/25 | $10,350 | $11,869 | $11,942 |
|---|
3/31/26 | $10,811 | $12,379 | $12,328 |
|---|
|
| AssetsNet |
$ 40,236,350
|
| Holdings Count | Holding |
110
|
| InvestmentCompanyPortfolioTurnover |
14.00%
|
| Additional Fund Statistics [Text Block] |
Fund Statistics as of March 31, 2026 - Net Assets$40,236,350
- Total Number of Portfolio Holdings110
- Portfolio Turnover Rate14%
|
| Holdings [Text Block] |
Portfolio Composition by Quality RatingFootnote Reference1 (% of Total Investments) as of March 31, 2026 Table SummaryAAA | 18.8% |
|---|
AA | 57.3% |
|---|
A | 14.2% |
|---|
BBB | 6.3% |
|---|
BB | 1.2% |
|---|
NRFootnote Referencea | 0.9% |
|---|
Other Investments | 1.3% |
|---|
Holdings DiversificationFootnote Reference3 (% of Net Assets) as of March 31, 2026 Table SummaryValue | Value |
|---|
Other | 54.0% | Centrally Cleared Interest Rate Swap Agreements Receive | -11.2% | Tennessee | 4.3% | New York | 4.5% | Pennsylvania | 5.3% | Oregon | 6.2% | Michigan | 6.5% | Texas | 7.7% | California | 9.2% | Centrally Cleared Interest Rate Swap Agreements Pay | 14.0% | |
| Largest Holdings [Text Block] |
10 Largest HoldingsFootnote Reference2 (% of Net Assets) as of March 31, 2026 Table SummaryState of Georgia General Obligation Unlimited 5.00% due 01/01/31 | 2.7% |
|---|
Maine Health & Higher Educational Facilities Authority Revenue Bonds 5.25% due 07/01/48 | 2.6% |
|---|
Snohomish County Public Utility District No. 1 Electric System Revenue Bonds 5.25% due 12/01/55 | 2.6% |
|---|
Nebraska Investment Finance Authority Revenue Bonds 4.95% due 09/01/38 | 2.6% |
|---|
Arizona Industrial Development Authority Revenue Bonds 5.50% due 11/01/56 | 2.6% |
|---|
Michigan Technological University Revenue Bonds 5.25% due 10/01/53 | 2.6% |
|---|
Metropolitan Government Nashville & Davidson County Health & Educational Facilities Board Revenue Bonds 2.25% due 07/01/45 | 2.5% |
|---|
Albany Hospital Facility Authority Revenue Bonds 5.38% due 05/15/54 | 2.5% |
|---|
Westchester County Local Development Corp. Revenue Bonds 5.75% due 11/01/53 | 2.0% |
|---|
Newport Mesa Unified School District General Obligation Unlimited due 08/01/39 | 1.9% |
|---|
Total | 24.6% |
|---|
|
| Material Fund Change [Text Block] |
|
| C000155970 |
|
| Shareholder Report [Line Items] |
|
| Fund Name |
Guggenheim Municipal Income Fund
|
| Class Name |
Class P
|
| Trading Symbol |
GIJPX
|
| Annual or Semi-Annual Statement [Text Block] |
This semi-annual shareholder report contains important information about the Guggenheim Municipal Income Fund for the period from October 1, 2025 to March 31, 2026.
|
| Shareholder Report Annual or Semi-Annual |
Semi-Annual Shareholder Report
|
| Additional Information [Text Block] |
You can find additional information about the fund at GuggenheimInvestments.com/mutual-funds/literature. You can also request this information by contacting 800 820 0888 or services@guggenheiminvestments.com.
|
| Additional Information Phone Number |
800 820 0888
|
| Additional Information Email |
<span style="box-sizing: border-box; color: rgb(67, 67, 67); display: inline; flex-wrap: nowrap; font-size: 10.6667px; font-weight: 400; grid-area: auto; line-height: 12.8px; margin: 0px; overflow: visible; text-align: left; text-align-last: auto; white-space-collapse: preserve-breaks;">services@guggenheiminvestments.com</span>
|
| Additional Information Website |
<span style="box-sizing: border-box; color: rgb(67, 67, 67); display: inline; flex-wrap: nowrap; font-size: 10.6667px; font-weight: 400; grid-area: auto; line-height: 12.8px; margin: 0px; overflow: visible; text-align: left; text-align-last: auto; white-space-collapse: preserve-breaks;">GuggenheimInvestments.com/mutual-funds/literature</span>
|
| Expenses [Text Block] |
What were the Fund's costs for the last six months? * Based on a hypothetical $10,000 investment Table SummaryClass | Costs of a $10,000 Investment | Costs Paid as a % of a $10,000 Investment** |
|---|
Class P | $38 | 0.76% |
|---|
Table Summary* | Excludes expenses of the underlying funds in which the fund invests, if any. |
|---|
** | Annualized |
|---|
|
| Expenses Paid, Amount |
$ 38
|
| Factors Affecting Performance [Text Block] |
What factors materially affected the Fund's performance over the last six months? The fund’s performance was driven by duration positioning and spread compression. Incremental exposure to the long end of the curve has been additive as tax exempts bull flattened throughout the end of 2025. School districts and housing bonds contributed to performance, while transportation and city obligations detracted. At the state level, California contributed to returns while New York detracted. |
| Line Graph [Table Text Block] |
Table Summary | Municipal Income Fund (Class P) | Bloomberg Municipal Bond Index | Bloomberg Municipal Long Bond Index |
|---|
3/31/16 | $10,000 | $10,000 | $10,000 |
|---|
3/31/17 | $9,943 | $10,015 | $10,039 |
|---|
3/31/18 | $10,283 | $10,282 | $10,508 |
|---|
3/31/19 | $10,772 | $10,835 | $11,124 |
|---|
3/31/20 | $11,123 | $11,252 | $11,670 |
|---|
3/31/21 | $11,795 | $11,872 | $12,489 |
|---|
3/31/22 | $10,892 | $11,342 | $11,827 |
|---|
3/31/23 | $10,645 | $11,371 | $11,396 |
|---|
3/31/24 | $10,854 | $11,726 | $11,863 |
|---|
3/31/25 | $11,067 | $11,869 | $11,942 |
|---|
3/31/26 | $11,655 | $12,379 | $12,328 |
|---|
|
| AssetsNet |
$ 40,236,350
|
| Holdings Count | Holding |
110
|
| InvestmentCompanyPortfolioTurnover |
14.00%
|
| Additional Fund Statistics [Text Block] |
Fund Statistics as of March 31, 2026 - Net Assets$40,236,350
- Total Number of Portfolio Holdings110
- Portfolio Turnover Rate14%
|
| Holdings [Text Block] |
Portfolio Composition by Quality RatingFootnote Reference1 (% of Total Investments) as of March 31, 2026 Table SummaryAAA | 18.8% |
|---|
AA | 57.3% |
|---|
A | 14.2% |
|---|
BBB | 6.3% |
|---|
BB | 1.2% |
|---|
NRFootnote Referencea | 0.9% |
|---|
Other Investments | 1.3% |
|---|
Holdings DiversificationFootnote Reference3 (% of Net Assets) as of March 31, 2026 Table SummaryValue | Value |
|---|
Other | 54.0% | Centrally Cleared Interest Rate Swap Agreements Receive | -11.2% | Tennessee | 4.3% | New York | 4.5% | Pennsylvania | 5.3% | Oregon | 6.2% | Michigan | 6.5% | Texas | 7.7% | California | 9.2% | Centrally Cleared Interest Rate Swap Agreements Pay | 14.0% | |
| Largest Holdings [Text Block] |
10 Largest HoldingsFootnote Reference2 (% of Net Assets) as of March 31, 2026 Table SummaryState of Georgia General Obligation Unlimited 5.00% due 01/01/31 | 2.7% |
|---|
Maine Health & Higher Educational Facilities Authority Revenue Bonds 5.25% due 07/01/48 | 2.6% |
|---|
Snohomish County Public Utility District No. 1 Electric System Revenue Bonds 5.25% due 12/01/55 | 2.6% |
|---|
Nebraska Investment Finance Authority Revenue Bonds 4.95% due 09/01/38 | 2.6% |
|---|
Arizona Industrial Development Authority Revenue Bonds 5.50% due 11/01/56 | 2.6% |
|---|
Michigan Technological University Revenue Bonds 5.25% due 10/01/53 | 2.6% |
|---|
Metropolitan Government Nashville & Davidson County Health & Educational Facilities Board Revenue Bonds 2.25% due 07/01/45 | 2.5% |
|---|
Albany Hospital Facility Authority Revenue Bonds 5.38% due 05/15/54 | 2.5% |
|---|
Westchester County Local Development Corp. Revenue Bonds 5.75% due 11/01/53 | 2.0% |
|---|
Newport Mesa Unified School District General Obligation Unlimited due 08/01/39 | 1.9% |
|---|
Total | 24.6% |
|---|
|
| Material Fund Change [Text Block] |
|
| C000136526 |
|
| Shareholder Report [Line Items] |
|
| Fund Name |
Guggenheim Municipal Income Fund
|
| Class Name |
Institutional Class
|
| Trading Symbol |
GIJIX
|
| Annual or Semi-Annual Statement [Text Block] |
This semi-annual shareholder report contains important information about the Guggenheim Municipal Income Fund for the period from October 1, 2025 to March 31, 2026.
|
| Shareholder Report Annual or Semi-Annual |
Semi-Annual Shareholder Report
|
| Additional Information [Text Block] |
You can find additional information about the fund at GuggenheimInvestments.com/mutual-funds/literature. You can also request this information by contacting 800 820 0888 or services@guggenheiminvestments.com.
|
| Additional Information Phone Number |
800 820 0888
|
| Additional Information Email |
<span style="box-sizing: border-box; color: rgb(67, 67, 67); display: inline; flex-wrap: nowrap; font-size: 10.6667px; font-weight: 400; grid-area: auto; line-height: 12.8px; margin: 0px; overflow: visible; text-align: left; text-align-last: auto; white-space-collapse: preserve-breaks;">services@guggenheiminvestments.com</span>
|
| Additional Information Website |
<span style="box-sizing: border-box; color: rgb(67, 67, 67); display: inline; flex-wrap: nowrap; font-size: 10.6667px; font-weight: 400; grid-area: auto; line-height: 12.8px; margin: 0px; overflow: visible; text-align: left; text-align-last: auto; white-space-collapse: preserve-breaks;">GuggenheimInvestments.com/mutual-funds/literature</span>
|
| Expenses [Text Block] |
What were the Fund's costs for the last six months? * Based on a hypothetical $10,000 investment Table SummaryClass | Costs of a $10,000 Investment | Costs Paid as a % of a $10,000 Investment** |
|---|
Institutional Class | $26 | 0.51% |
|---|
Table Summary* | Excludes expenses of the underlying funds in which the fund invests, if any. |
|---|
** | Annualized |
|---|
|
| Expenses Paid, Amount |
$ 26
|
| Factors Affecting Performance [Text Block] |
What factors materially affected the Fund's performance over the last six months? The fund’s performance was driven by duration positioning and spread compression. Incremental exposure to the long end of the curve has been additive as tax exempts bull flattened throughout the end of 2025. School districts and housing bonds contributed to performance, while transportation and city obligations detracted. At the state level, California contributed to returns while New York detracted. |
| Line Graph [Table Text Block] |
Table Summary | Municipal Income Fund (Institutional Class) | Bloomberg Municipal Bond Index | Bloomberg Municipal Long Bond Index |
|---|
3/31/16 | $2,000,000 | $2,000,000 | $2,000,000 |
|---|
3/31/17 | $1,993,555 | $2,003,081 | $2,007,782 |
|---|
3/31/18 | $2,065,881 | $2,056,336 | $2,101,653 |
|---|
3/31/19 | $2,169,696 | $2,167,066 | $2,224,842 |
|---|
3/31/20 | $2,247,805 | $2,250,474 | $2,334,005 |
|---|
3/31/21 | $2,387,702 | $2,374,438 | $2,497,926 |
|---|
3/31/22 | $2,212,322 | $2,268,321 | $2,365,459 |
|---|
3/31/23 | $2,167,674 | $2,274,180 | $2,279,301 |
|---|
3/31/24 | $2,213,841 | $2,345,281 | $2,372,601 |
|---|
3/31/25 | $2,265,266 | $2,373,886 | $2,388,505 |
|---|
3/31/26 | $2,389,796 | $2,475,782 | $2,465,642 |
|---|
|
| AssetsNet |
$ 40,236,350
|
| Holdings Count | Holding |
110
|
| InvestmentCompanyPortfolioTurnover |
14.00%
|
| Additional Fund Statistics [Text Block] |
Fund Statistics as of March 31, 2026 - Net Assets$40,236,350
- Total Number of Portfolio Holdings110
- Portfolio Turnover Rate14%
|
| Holdings [Text Block] |
Portfolio Composition by Quality RatingFootnote Reference1 (% of Total Investments) as of March 31, 2026 Table SummaryAAA | 18.8% |
|---|
AA | 57.3% |
|---|
A | 14.2% |
|---|
BBB | 6.3% |
|---|
BB | 1.2% |
|---|
NRFootnote Referencea | 0.9% |
|---|
Other Investments | 1.3% |
|---|
Holdings DiversificationFootnote Reference3 (% of Net Assets) as of March 31, 2026 Table SummaryValue | Value |
|---|
Other | 54.0% | Centrally Cleared Interest Rate Swap Agreements Receive | -11.2% | Tennessee | 4.3% | New York | 4.5% | Pennsylvania | 5.3% | Oregon | 6.2% | Michigan | 6.5% | Texas | 7.7% | California | 9.2% | Centrally Cleared Interest Rate Swap Agreements Pay | 14.0% | |
| Largest Holdings [Text Block] |
10 Largest HoldingsFootnote Reference2 (% of Net Assets) as of March 31, 2026 Table SummaryState of Georgia General Obligation Unlimited 5.00% due 01/01/31 | 2.7% |
|---|
Maine Health & Higher Educational Facilities Authority Revenue Bonds 5.25% due 07/01/48 | 2.6% |
|---|
Snohomish County Public Utility District No. 1 Electric System Revenue Bonds 5.25% due 12/01/55 | 2.6% |
|---|
Nebraska Investment Finance Authority Revenue Bonds 4.95% due 09/01/38 | 2.6% |
|---|
Arizona Industrial Development Authority Revenue Bonds 5.50% due 11/01/56 | 2.6% |
|---|
Michigan Technological University Revenue Bonds 5.25% due 10/01/53 | 2.6% |
|---|
Metropolitan Government Nashville & Davidson County Health & Educational Facilities Board Revenue Bonds 2.25% due 07/01/45 | 2.5% |
|---|
Albany Hospital Facility Authority Revenue Bonds 5.38% due 05/15/54 | 2.5% |
|---|
Westchester County Local Development Corp. Revenue Bonds 5.75% due 11/01/53 | 2.0% |
|---|
Newport Mesa Unified School District General Obligation Unlimited due 08/01/39 | 1.9% |
|---|
Total | 24.6% |
|---|
|
| Material Fund Change [Text Block] |
|
| C000136527 |
|
| Shareholder Report [Line Items] |
|
| Fund Name |
Guggenheim Total Return Bond Fund
|
| Class Name |
Class A
|
| Trading Symbol |
GIBAX
|
| Annual or Semi-Annual Statement [Text Block] |
This semi-annual shareholder report contains important information about the Guggenheim Total Return Bond Fund for the period from October 1, 2025 to March 31, 2026.
|
| Shareholder Report Annual or Semi-Annual |
Semi-Annual Shareholder Report
|
| Additional Information [Text Block] |
You can find additional information about the fund at GuggenheimInvestments.com/mutual-funds/literature. You can also request this information by contacting 800 820 0888 or services@guggenheiminvestments.com.
|
| Additional Information Phone Number |
800 820 0888
|
| Additional Information Email |
<span style="box-sizing: border-box; color: rgb(67, 67, 67); display: inline; flex-wrap: nowrap; font-size: 10.6667px; font-weight: 400; grid-area: auto; line-height: 12.8px; margin: 0px; overflow: visible; text-align: left; text-align-last: auto; white-space-collapse: preserve-breaks;">services@guggenheiminvestments.com</span>
|
| Additional Information Website |
<span style="box-sizing: border-box; color: rgb(67, 67, 67); display: inline; flex-wrap: nowrap; font-size: 10.6667px; font-weight: 400; grid-area: auto; line-height: 12.8px; margin: 0px; overflow: visible; text-align: left; text-align-last: auto; white-space-collapse: preserve-breaks;">GuggenheimInvestments.com/mutual-funds/literature</span>
|
| Expenses [Text Block] |
What were the Fund's costs for the last six months? * Based on a hypothetical $10,000 investment Table SummaryClass | Costs of a $10,000 Investment | Costs Paid as a % of a $10,000 Investment** |
|---|
Class A | $38 | 0.75% |
|---|
Table Summary* | Excludes expenses of the underlying funds in which the fund invests, if any. |
|---|
** | Annualized |
|---|
|
| Expenses Paid, Amount |
$ 38
|
| Factors Affecting Performance [Text Block] |
What factors materially affected the Fund's performance over the last six months? Positive performance over the period was driven by carry (or earned income), attributable to the fund's allocations to high-grade securitized credit sectors. Duration was the largest detractor from performance as rates rose over the period. Additionally, spread widening across fixed-income sectors, prompted by heightened geopolitical tensions, detracted modestly from performance. The effect was felt broadly across credit-sensitive holdings, though spread tightening within Agency and non-Agency residential mortgage-backed securities sectors helped mitigate the overall impact of spread widening. |
| Line Graph [Table Text Block] |
Table Summary | Total Return Bond Fund (Class A)‡ | Bloomberg U.S. Aggregate Bond Index |
|---|
3/31/16 | $9,600 | $10,000 |
|---|
3/31/17 | $10,183 | $10,044 |
|---|
3/31/18 | $10,590 | $10,165 |
|---|
3/31/19 | $10,835 | $10,620 |
|---|
3/31/20 | $11,498 | $11,569 |
|---|
3/31/21 | $12,350 | $11,651 |
|---|
3/31/22 | $11,938 | $11,168 |
|---|
3/31/23 | $11,169 | $10,633 |
|---|
3/31/24 | $11,508 | $10,814 |
|---|
3/31/25 | $12,189 | $11,342 |
|---|
3/31/26 | $12,770 | $11,835 |
|---|
|
| AssetsNet |
$ 31,488,134,525
|
| Holdings Count | Holding |
2,044
|
| InvestmentCompanyPortfolioTurnover |
25.00%
|
| Additional Fund Statistics [Text Block] |
Fund Statistics as of March 31, 2026 - Net Assets$31,488,134,525
- Total Number of Portfolio Holdings2,044
- Portfolio Turnover Rate25%
|
| Holdings [Text Block] |
Portfolio Composition by Quality RatingFootnote Reference1 (% of Total Investments) as of March 31, 2026 Table SummaryAAA | 19.1% |
|---|
AA | 36.4% |
|---|
A | 15.9% |
|---|
BBB | 15.2% |
|---|
BB | 4.5% |
|---|
B | 2.3% |
|---|
CCC | 0.9% |
|---|
CC | 0.1% |
|---|
C | 0.1% |
|---|
NRFootnote Referencea | 3.9% |
|---|
Other Investments | 1.6% |
|---|
Holdings DiversificationFootnote Reference3 (% of Net Assets) as of March 31, 2026 Table SummaryValue | Value |
|---|
Other | 4.6% | Interest Rate Futures Contracts Sold Short | -5.0% | Centrally Cleared Interest Rate Swap Agreements Receive | -0.5% | Senior Floating Rate Interests | 5.1% | Interest Rate Futures Contracts Purchased | 10.0% | Centrally Cleared Interest Rate Swap Agreements Pay | 12.6% | U.S. Government Securities | 15.3% | Asset-Backed Securities | 22.4% | Corporate Bonds | 26.4% | Collateralized Mortgage Obligations | 42.9% | |
| Largest Holdings [Text Block] |
10 Largest HoldingsFootnote Reference2 (% of Net Assets) as of March 31, 2026 Table SummaryUniform MBS 30 Year 5.00% due 06/01/56 | 7.3% |
|---|
Uniform MBS 30 Year 3.00% due 05/01/56 | 3.6% |
|---|
Uniform MBS 30 Year 2.50% due 05/01/56 | 2.6% |
|---|
Ginnie Mae 5.00% due 06/20/56 | 2.6% |
|---|
U.S. Treasury Notes 4.00% due 11/15/35 | 1.7% |
|---|
U.S. Treasury Inflation Indexed Bonds 1.88% due 07/15/35 | 1.7% |
|---|
Uniform MBS 30 Year 5.50% due 06/01/56 | 1.6% |
|---|
U.S. Treasury Bonds 4.38% due 11/15/39 | 1.5% |
|---|
U.S. Treasury Bonds due 05/15/51 | 1.4% |
|---|
U.S. Treasury Bonds 1.88% due 02/15/41 | 1.4% |
|---|
Total | 25.4% |
|---|
|
| Material Fund Change [Text Block] |
|
| C000136528 |
|
| Shareholder Report [Line Items] |
|
| Fund Name |
Guggenheim Total Return Bond Fund
|
| Class Name |
Class C
|
| Trading Symbol |
GIBCX
|
| Annual or Semi-Annual Statement [Text Block] |
This semi-annual shareholder report contains important information about the Guggenheim Total Return Bond Fund for the period from October 1, 2025 to March 31, 2026.
|
| Shareholder Report Annual or Semi-Annual |
Semi-Annual Shareholder Report
|
| Additional Information [Text Block] |
You can find additional information about the fund at GuggenheimInvestments.com/mutual-funds/literature. You can also request this information by contacting 800 820 0888 or services@guggenheiminvestments.com.
|
| Additional Information Phone Number |
800 820 0888
|
| Additional Information Email |
<span style="box-sizing: border-box; color: rgb(67, 67, 67); display: inline; flex-wrap: nowrap; font-size: 10.6667px; font-weight: 400; grid-area: auto; line-height: 12.8px; margin: 0px; overflow: visible; text-align: left; text-align-last: auto; white-space-collapse: preserve-breaks;">services@guggenheiminvestments.com</span>
|
| Additional Information Website |
<span style="box-sizing: border-box; color: rgb(67, 67, 67); display: inline; flex-wrap: nowrap; font-size: 10.6667px; font-weight: 400; grid-area: auto; line-height: 12.8px; margin: 0px; overflow: visible; text-align: left; text-align-last: auto; white-space-collapse: preserve-breaks;">GuggenheimInvestments.com/mutual-funds/literature</span>
|
| Expenses [Text Block] |
What were the Fund's costs for the last six months? * Based on a hypothetical $10,000 investment Table SummaryClass | Costs of a $10,000 Investment | Costs Paid as a % of a $10,000 Investment** |
|---|
Class C | $75 | 1.50% |
|---|
Table Summary* | Excludes expenses of the underlying funds in which the fund invests, if any. |
|---|
** | Annualized |
|---|
|
| Expenses Paid, Amount |
$ 75
|
| Factors Affecting Performance [Text Block] |
What factors materially affected the Fund's performance over the last six months? Positive performance over the period was driven by carry (or earned income), attributable to the fund's allocations to high-grade securitized credit sectors. Duration was the largest detractor from performance as rates rose over the period. Additionally, spread widening across fixed-income sectors, prompted by heightened geopolitical tensions, detracted modestly from performance. The effect was felt broadly across credit-sensitive holdings, though spread tightening within Agency and non-Agency residential mortgage-backed securities sectors helped mitigate the overall impact of spread widening. |
| Line Graph [Table Text Block] |
Table Summary | Total Return Bond Fund (Class C) | Bloomberg U.S. Aggregate Bond Index |
|---|
3/31/16 | $10,000 | $10,000 |
|---|
3/31/17 | $10,530 | $10,044 |
|---|
3/31/18 | $10,869 | $10,165 |
|---|
3/31/19 | $11,037 | $10,620 |
|---|
3/31/20 | $11,625 | $11,569 |
|---|
3/31/21 | $12,394 | $11,651 |
|---|
3/31/22 | $11,891 | $11,168 |
|---|
3/31/23 | $11,042 | $10,633 |
|---|
3/31/24 | $11,292 | $10,814 |
|---|
3/31/25 | $11,871 | $11,342 |
|---|
3/31/26 | $12,339 | $11,835 |
|---|
|
| AssetsNet |
$ 31,488,134,525
|
| Holdings Count | Holding |
2,044
|
| InvestmentCompanyPortfolioTurnover |
25.00%
|
| Additional Fund Statistics [Text Block] |
Fund Statistics as of March 31, 2026 - Net Assets$31,488,134,525
- Total Number of Portfolio Holdings2,044
- Portfolio Turnover Rate25%
|
| Holdings [Text Block] |
Portfolio Composition by Quality RatingFootnote Reference1 (% of Total Investments) as of March 31, 2026 Table SummaryAAA | 19.1% |
|---|
AA | 36.4% |
|---|
A | 15.9% |
|---|
BBB | 15.2% |
|---|
BB | 4.5% |
|---|
B | 2.3% |
|---|
CCC | 0.9% |
|---|
CC | 0.1% |
|---|
C | 0.1% |
|---|
NRFootnote Referencea | 3.9% |
|---|
Other Investments | 1.6% |
|---|
Holdings DiversificationFootnote Reference3 (% of Net Assets) as of March 31, 2026 Table SummaryValue | Value |
|---|
Other | 4.6% | Interest Rate Futures Contracts Sold Short | -5.0% | Centrally Cleared Interest Rate Swap Agreements Receive | -0.5% | Senior Floating Rate Interests | 5.1% | Interest Rate Futures Contracts Purchased | 10.0% | Centrally Cleared Interest Rate Swap Agreements Pay | 12.6% | U.S. Government Securities | 15.3% | Asset-Backed Securities | 22.4% | Corporate Bonds | 26.4% | Collateralized Mortgage Obligations | 42.9% | |
| Largest Holdings [Text Block] |
10 Largest HoldingsFootnote Reference2 (% of Net Assets) as of March 31, 2026 Table SummaryUniform MBS 30 Year 5.00% due 06/01/56 | 7.3% |
|---|
Uniform MBS 30 Year 3.00% due 05/01/56 | 3.6% |
|---|
Uniform MBS 30 Year 2.50% due 05/01/56 | 2.6% |
|---|
Ginnie Mae 5.00% due 06/20/56 | 2.6% |
|---|
U.S. Treasury Notes 4.00% due 11/15/35 | 1.7% |
|---|
U.S. Treasury Inflation Indexed Bonds 1.88% due 07/15/35 | 1.7% |
|---|
Uniform MBS 30 Year 5.50% due 06/01/56 | 1.6% |
|---|
U.S. Treasury Bonds 4.38% due 11/15/39 | 1.5% |
|---|
U.S. Treasury Bonds due 05/15/51 | 1.4% |
|---|
U.S. Treasury Bonds 1.88% due 02/15/41 | 1.4% |
|---|
Total | 25.4% |
|---|
|
| Material Fund Change [Text Block] |
|
| C000155971 |
|
| Shareholder Report [Line Items] |
|
| Fund Name |
Guggenheim Total Return Bond Fund
|
| Class Name |
Class P
|
| Trading Symbol |
GIBLX
|
| Annual or Semi-Annual Statement [Text Block] |
This semi-annual shareholder report contains important information about the Guggenheim Total Return Bond Fund for the period from October 1, 2025 to March 31, 2026.
|
| Shareholder Report Annual or Semi-Annual |
Semi-Annual Shareholder Report
|
| Additional Information [Text Block] |
You can find additional information about the fund at GuggenheimInvestments.com/mutual-funds/literature. You can also request this information by contacting 800 820 0888 or services@guggenheiminvestments.com.
|
| Additional Information Phone Number |
800 820 0888
|
| Additional Information Email |
<span style="box-sizing: border-box; color: rgb(67, 67, 67); display: inline; flex-wrap: nowrap; font-size: 10.6667px; font-weight: 400; grid-area: auto; line-height: 12.8px; margin: 0px; overflow: visible; text-align: left; text-align-last: auto; white-space-collapse: preserve-breaks;">services@guggenheiminvestments.com</span>
|
| Additional Information Website |
<span style="box-sizing: border-box; color: rgb(67, 67, 67); display: inline; flex-wrap: nowrap; font-size: 10.6667px; font-weight: 400; grid-area: auto; line-height: 12.8px; margin: 0px; overflow: visible; text-align: left; text-align-last: auto; white-space-collapse: preserve-breaks;">GuggenheimInvestments.com/mutual-funds/literature</span>
|
| Expenses [Text Block] |
What were the Fund's costs for the last six months? * Based on a hypothetical $10,000 investment Table SummaryClass | Costs of a $10,000 Investment | Costs Paid as a % of a $10,000 Investment** |
|---|
Class P | $38 | 0.75% |
|---|
Table Summary* | Excludes expenses of the underlying funds in which the fund invests, if any. |
|---|
** | Annualized |
|---|
|
| Expenses Paid, Amount |
$ 38
|
| Factors Affecting Performance [Text Block] |
What factors materially affected the Fund's performance over the last six months? Positive performance over the period was driven by carry (or earned income), attributable to the fund's allocations to high-grade securitized credit sectors. Duration was the largest detractor from performance as rates rose over the period. Additionally, spread widening across fixed-income sectors, prompted by heightened geopolitical tensions, detracted modestly from performance. The effect was felt broadly across credit-sensitive holdings, though spread tightening within Agency and non-Agency residential mortgage-backed securities sectors helped mitigate the overall impact of spread widening. |
| Line Graph [Table Text Block] |
Table Summary | Total Return Bond Fund (Class P) | Bloomberg U.S. Aggregate Bond Index |
|---|
3/31/16 | $10,000 | $10,000 |
|---|
3/31/17 | $10,615 | $10,044 |
|---|
3/31/18 | $11,038 | $10,165 |
|---|
3/31/19 | $11,293 | $10,620 |
|---|
3/31/20 | $11,984 | $11,569 |
|---|
3/31/21 | $12,873 | $11,651 |
|---|
3/31/22 | $12,443 | $11,168 |
|---|
3/31/23 | $11,642 | $10,633 |
|---|
3/31/24 | $11,996 | $10,814 |
|---|
3/31/25 | $12,706 | $11,342 |
|---|
3/31/26 | $13,306 | $11,835 |
|---|
|
| AssetsNet |
$ 31,488,134,525
|
| Holdings Count | Holding |
2,044
|
| InvestmentCompanyPortfolioTurnover |
25.00%
|
| Additional Fund Statistics [Text Block] |
Fund Statistics as of March 31, 2026 - Net Assets$31,488,134,525
- Total Number of Portfolio Holdings2,044
- Portfolio Turnover Rate25%
|
| Holdings [Text Block] |
Portfolio Composition by Quality RatingFootnote Reference1 (% of Total Investments) as of March 31, 2026 Table SummaryAAA | 19.1% |
|---|
AA | 36.4% |
|---|
A | 15.9% |
|---|
BBB | 15.2% |
|---|
BB | 4.5% |
|---|
B | 2.3% |
|---|
CCC | 0.9% |
|---|
CC | 0.1% |
|---|
C | 0.1% |
|---|
NRFootnote Referencea | 3.9% |
|---|
Other Investments | 1.6% |
|---|
Holdings DiversificationFootnote Reference3 (% of Net Assets) as of March 31, 2026 Table SummaryValue | Value |
|---|
Other | 4.6% | Interest Rate Futures Contracts Sold Short | -5.0% | Centrally Cleared Interest Rate Swap Agreements Receive | -0.5% | Senior Floating Rate Interests | 5.1% | Interest Rate Futures Contracts Purchased | 10.0% | Centrally Cleared Interest Rate Swap Agreements Pay | 12.6% | U.S. Government Securities | 15.3% | Asset-Backed Securities | 22.4% | Corporate Bonds | 26.4% | Collateralized Mortgage Obligations | 42.9% | |
| Largest Holdings [Text Block] |
10 Largest HoldingsFootnote Reference2 (% of Net Assets) as of March 31, 2026 Table SummaryUniform MBS 30 Year 5.00% due 06/01/56 | 7.3% |
|---|
Uniform MBS 30 Year 3.00% due 05/01/56 | 3.6% |
|---|
Uniform MBS 30 Year 2.50% due 05/01/56 | 2.6% |
|---|
Ginnie Mae 5.00% due 06/20/56 | 2.6% |
|---|
U.S. Treasury Notes 4.00% due 11/15/35 | 1.7% |
|---|
U.S. Treasury Inflation Indexed Bonds 1.88% due 07/15/35 | 1.7% |
|---|
Uniform MBS 30 Year 5.50% due 06/01/56 | 1.6% |
|---|
U.S. Treasury Bonds 4.38% due 11/15/39 | 1.5% |
|---|
U.S. Treasury Bonds due 05/15/51 | 1.4% |
|---|
U.S. Treasury Bonds 1.88% due 02/15/41 | 1.4% |
|---|
Total | 25.4% |
|---|
|
| Material Fund Change [Text Block] |
|
| C000136529 |
|
| Shareholder Report [Line Items] |
|
| Fund Name |
Guggenheim Total Return Bond Fund
|
| Class Name |
Institutional Class
|
| Trading Symbol |
GIBIX
|
| Annual or Semi-Annual Statement [Text Block] |
This semi-annual shareholder report contains important information about the Guggenheim Total Return Bond Fund for the period from October 1, 2025 to March 31, 2026.
|
| Shareholder Report Annual or Semi-Annual |
Semi-Annual Shareholder Report
|
| Additional Information [Text Block] |
You can find additional information about the fund at GuggenheimInvestments.com/mutual-funds/literature. You can also request this information by contacting 800 820 0888 or services@guggenheiminvestments.com.
|
| Additional Information Phone Number |
800 820 0888
|
| Additional Information Email |
<span style="box-sizing: border-box; color: rgb(67, 67, 67); display: inline; flex-wrap: nowrap; font-size: 10.6667px; font-weight: 400; grid-area: auto; line-height: 12.8px; margin: 0px; overflow: visible; text-align: left; text-align-last: auto; white-space-collapse: preserve-breaks;">services@guggenheiminvestments.com</span>
|
| Additional Information Website |
<span style="box-sizing: border-box; color: rgb(67, 67, 67); display: inline; flex-wrap: nowrap; font-size: 10.6667px; font-weight: 400; grid-area: auto; line-height: 12.8px; margin: 0px; overflow: visible; text-align: left; text-align-last: auto; white-space-collapse: preserve-breaks;">GuggenheimInvestments.com/mutual-funds/literature</span>
|
| Expenses [Text Block] |
What were the Fund's costs for the last six months? * Based on a hypothetical $10,000 investment Table SummaryClass | Costs of a $10,000 Investment | Costs Paid as a % of a $10,000 Investment** |
|---|
Institutional Class | $23 | 0.46% |
|---|
Table Summary* | Excludes expenses of the underlying funds in which the fund invests, if any. |
|---|
** | Annualized |
|---|
|
| Expenses Paid, Amount |
$ 23
|
| Factors Affecting Performance [Text Block] |
What factors materially affected the Fund's performance over the last six months? Positive performance over the period was driven by carry (or earned income), attributable to the fund's allocations to high-grade securitized credit sectors. Duration was the largest detractor from performance as rates rose over the period. Additionally, spread widening across fixed-income sectors, prompted by heightened geopolitical tensions, detracted modestly from performance. The effect was felt broadly across credit-sensitive holdings, though spread tightening within Agency and non-Agency residential mortgage-backed securities sectors helped mitigate the overall impact of spread widening. |
| Line Graph [Table Text Block] |
Table Summary | Total Return Bond Fund (Institutional Class) | Bloomberg U.S. Aggregate Bond Index |
|---|
3/31/16 | $2,000,000 | $2,000,000 |
|---|
3/31/17 | $2,129,041 | $2,008,812 |
|---|
3/31/18 | $2,221,392 | $2,032,978 |
|---|
3/31/19 | $2,279,123 | $2,124,067 |
|---|
3/31/20 | $2,426,384 | $2,313,827 |
|---|
3/31/21 | $2,612,642 | $2,330,260 |
|---|
3/31/22 | $2,532,798 | $2,233,505 |
|---|
3/31/23 | $2,376,608 | $2,126,668 |
|---|
3/31/24 | $2,455,879 | $2,162,781 |
|---|
3/31/25 | $2,608,468 | $2,268,317 |
|---|
3/31/26 | $2,740,503 | $2,366,958 |
|---|
|
| AssetsNet |
$ 31,488,134,525
|
| Holdings Count | Holding |
2,044
|
| InvestmentCompanyPortfolioTurnover |
25.00%
|
| Additional Fund Statistics [Text Block] |
Fund Statistics as of March 31, 2026 - Net Assets$31,488,134,525
- Total Number of Portfolio Holdings2,044
- Portfolio Turnover Rate25%
|
| Holdings [Text Block] |
Portfolio Composition by Quality RatingFootnote Reference1 (% of Total Investments) as of March 31, 2026 Table SummaryAAA | 19.1% |
|---|
AA | 36.4% |
|---|
A | 15.9% |
|---|
BBB | 15.2% |
|---|
BB | 4.5% |
|---|
B | 2.3% |
|---|
CCC | 0.9% |
|---|
CC | 0.1% |
|---|
C | 0.1% |
|---|
NRFootnote Referencea | 3.9% |
|---|
Other Investments | 1.6% |
|---|
Holdings DiversificationFootnote Reference3 (% of Net Assets) as of March 31, 2026 Table SummaryValue | Value |
|---|
Other | 4.6% | Interest Rate Futures Contracts Sold Short | -5.0% | Centrally Cleared Interest Rate Swap Agreements Receive | -0.5% | Senior Floating Rate Interests | 5.1% | Interest Rate Futures Contracts Purchased | 10.0% | Centrally Cleared Interest Rate Swap Agreements Pay | 12.6% | U.S. Government Securities | 15.3% | Asset-Backed Securities | 22.4% | Corporate Bonds | 26.4% | Collateralized Mortgage Obligations | 42.9% | |
| Largest Holdings [Text Block] |
10 Largest HoldingsFootnote Reference2 (% of Net Assets) as of March 31, 2026 Table SummaryUniform MBS 30 Year 5.00% due 06/01/56 | 7.3% |
|---|
Uniform MBS 30 Year 3.00% due 05/01/56 | 3.6% |
|---|
Uniform MBS 30 Year 2.50% due 05/01/56 | 2.6% |
|---|
Ginnie Mae 5.00% due 06/20/56 | 2.6% |
|---|
U.S. Treasury Notes 4.00% due 11/15/35 | 1.7% |
|---|
U.S. Treasury Inflation Indexed Bonds 1.88% due 07/15/35 | 1.7% |
|---|
Uniform MBS 30 Year 5.50% due 06/01/56 | 1.6% |
|---|
U.S. Treasury Bonds 4.38% due 11/15/39 | 1.5% |
|---|
U.S. Treasury Bonds due 05/15/51 | 1.4% |
|---|
U.S. Treasury Bonds 1.88% due 02/15/41 | 1.4% |
|---|
Total | 25.4% |
|---|
|
| Material Fund Change [Text Block] |
|
| C000152106 |
|
| Shareholder Report [Line Items] |
|
| Fund Name |
Guggenheim Total Return Bond Fund
|
| Class Name |
Class R6
|
| Trading Symbol |
GIBRX
|
| Annual or Semi-Annual Statement [Text Block] |
This semi-annual shareholder report contains important information about the Guggenheim Total Return Bond Fund for the period from October 1, 2025 to March 31, 2026.
|
| Shareholder Report Annual or Semi-Annual |
Semi-Annual Shareholder Report
|
| Additional Information [Text Block] |
You can find additional information about the fund at GuggenheimInvestments.com/mutual-funds/literature. You can also request this information by contacting 800 820 0888 or services@guggenheiminvestments.com.
|
| Additional Information Phone Number |
800 820 0888
|
| Additional Information Email |
<span style="box-sizing: border-box; color: rgb(67, 67, 67); display: inline; flex-wrap: nowrap; font-size: 10.6667px; font-weight: 400; grid-area: auto; line-height: 12.8px; margin: 0px; overflow: visible; text-align: left; text-align-last: auto; white-space-collapse: preserve-breaks;">services@guggenheiminvestments.com</span>
|
| Additional Information Website |
<span style="box-sizing: border-box; color: rgb(67, 67, 67); display: inline; flex-wrap: nowrap; font-size: 10.6667px; font-weight: 400; grid-area: auto; line-height: 12.8px; margin: 0px; overflow: visible; text-align: left; text-align-last: auto; white-space-collapse: preserve-breaks;">GuggenheimInvestments.com/mutual-funds/literature</span>
|
| Expenses [Text Block] |
What were the Fund's costs for the last six months? * Based on a hypothetical $10,000 investment Table SummaryClass | Costs of a $10,000 Investment | Costs Paid as a % of a $10,000 Investment** |
|---|
Class R6 | $21 | 0.41% |
|---|
Table Summary* | Excludes expenses of the underlying funds in which the fund invests, if any. |
|---|
** | Annualized |
|---|
|
| Expenses Paid, Amount |
$ 21
|
| Factors Affecting Performance [Text Block] |
What factors materially affected the Fund's performance over the last six months? Positive performance over the period was driven by carry (or earned income), attributable to the fund's allocations to high-grade securitized credit sectors. Duration was the largest detractor from performance as rates rose over the period. Additionally, spread widening across fixed-income sectors, prompted by heightened geopolitical tensions, detracted modestly from performance. The effect was felt broadly across credit-sensitive holdings, though spread tightening within Agency and non-Agency residential mortgage-backed securities sectors helped mitigate the overall impact of spread widening. |
| Line Graph [Table Text Block] |
Table Summary | Total Return Bond Fund (Class R6) | Bloomberg U.S. Aggregate Bond Index |
|---|
10/19/16 | $10,000 | $10,000 |
|---|
3/31/17 | $10,062 | $9,820 |
|---|
3/31/18 | $10,501 | $9,938 |
|---|
3/31/19 | $10,774 | $10,383 |
|---|
3/31/20 | $11,465 | $11,310 |
|---|
3/31/21 | $12,349 | $11,391 |
|---|
3/31/22 | $11,973 | $10,918 |
|---|
3/31/23 | $11,232 | $10,396 |
|---|
3/31/24 | $11,612 | $10,573 |
|---|
3/31/25 | $12,344 | $11,089 |
|---|
3/31/26 | $12,970 | $11,571 |
|---|
|
| AssetsNet |
$ 31,488,134,525
|
| Holdings Count | Holding |
2,044
|
| InvestmentCompanyPortfolioTurnover |
25.00%
|
| Additional Fund Statistics [Text Block] |
Fund Statistics as of March 31, 2026 - Net Assets$31,488,134,525
- Total Number of Portfolio Holdings2,044
- Portfolio Turnover Rate25%
|
| Holdings [Text Block] |
Portfolio Composition by Quality RatingFootnote Reference1 (% of Total Investments) as of March 31, 2026 Table SummaryAAA | 19.1% |
|---|
AA | 36.4% |
|---|
A | 15.9% |
|---|
BBB | 15.2% |
|---|
BB | 4.5% |
|---|
B | 2.3% |
|---|
CCC | 0.9% |
|---|
CC | 0.1% |
|---|
C | 0.1% |
|---|
NRFootnote Referencea | 3.9% |
|---|
Other Investments | 1.6% |
|---|
Holdings DiversificationFootnote Reference3 (% of Net Assets) as of March 31, 2026 Table SummaryValue | Value |
|---|
Other | 4.6% | Interest Rate Futures Contracts Sold Short | -5.0% | Centrally Cleared Interest Rate Swap Agreements Receive | -0.5% | Senior Floating Rate Interests | 5.1% | Interest Rate Futures Contracts Purchased | 10.0% | Centrally Cleared Interest Rate Swap Agreements Pay | 12.6% | U.S. Government Securities | 15.3% | Asset-Backed Securities | 22.4% | Corporate Bonds | 26.4% | Collateralized Mortgage Obligations | 42.9% | |
| Largest Holdings [Text Block] |
10 Largest HoldingsFootnote Reference2 (% of Net Assets) as of March 31, 2026 Table SummaryUniform MBS 30 Year 5.00% due 06/01/56 | 7.3% |
|---|
Uniform MBS 30 Year 3.00% due 05/01/56 | 3.6% |
|---|
Uniform MBS 30 Year 2.50% due 05/01/56 | 2.6% |
|---|
Ginnie Mae 5.00% due 06/20/56 | 2.6% |
|---|
U.S. Treasury Notes 4.00% due 11/15/35 | 1.7% |
|---|
U.S. Treasury Inflation Indexed Bonds 1.88% due 07/15/35 | 1.7% |
|---|
Uniform MBS 30 Year 5.50% due 06/01/56 | 1.6% |
|---|
U.S. Treasury Bonds 4.38% due 11/15/39 | 1.5% |
|---|
U.S. Treasury Bonds due 05/15/51 | 1.4% |
|---|
U.S. Treasury Bonds 1.88% due 02/15/41 | 1.4% |
|---|
Total | 25.4% |
|---|
|
| Material Fund Change [Text Block] |
|
| C000205703 |
|
| Shareholder Report [Line Items] |
|
| Fund Name |
Guggenheim Ultra Short Duration Fund
|
| Class Name |
Class A
|
| Trading Symbol |
GIYAX
|
| Annual or Semi-Annual Statement [Text Block] |
This semi-annual shareholder report contains important information about the Guggenheim Ultra Short Duration Fund for the period from October 1, 2025 to March 31, 2026.
|
| Shareholder Report Annual or Semi-Annual |
Semi-Annual Shareholder Report
|
| Additional Information [Text Block] |
You can find additional information about the fund at GuggenheimInvestments.com/mutual-funds/literature. You can also request this information by contacting 800 820 0888 or services@guggenheiminvestments.com.
|
| Additional Information Phone Number |
800 820 0888
|
| Additional Information Email |
<span style="box-sizing: border-box; color: rgb(67, 67, 67); display: inline; flex-wrap: nowrap; font-size: 10.6667px; font-weight: 400; grid-area: auto; line-height: 12.8px; margin: 0px; overflow: visible; text-align: left; text-align-last: auto; white-space-collapse: preserve-breaks;">services@guggenheiminvestments.com</span>
|
| Additional Information Website |
<span style="box-sizing: border-box; color: rgb(67, 67, 67); display: inline; flex-wrap: nowrap; font-size: 10.6667px; font-weight: 400; grid-area: auto; line-height: 12.8px; margin: 0px; overflow: visible; text-align: left; text-align-last: auto; white-space-collapse: preserve-breaks;">GuggenheimInvestments.com/mutual-funds/literature</span>
|
| Expenses [Text Block] |
What were the Fund's costs for the last six months? * Based on a hypothetical $10,000 investment Table SummaryClass | Costs of a $10,000 Investment | Costs Paid as a % of a $10,000 Investment** |
|---|
Class A | $29 | 0.58% |
|---|
Table Summary* | Excludes expenses of the underlying funds in which the fund invests, if any. |
|---|
** | Annualized |
|---|
|
| Expenses Paid, Amount |
$ 29
|
| Factors Affecting Performance [Text Block] |
What factors materially affected the Fund's performance over the last six months? Positive performance over the period was driven by carry (or earned income), attributable to the fund's allocations to high-grade securitized credit sectors. Duration detracted modestly as rates rose over the period. Additionally, spread widening across fixed-income sectors, prompted by heightened geopolitical tensions, detracted from performance. The effect was felt broadly across credit-sensitive holdings. |
| Line Graph [Table Text Block] |
Table Summary | Ultra Short Duration Fund (Class A) | Bloomberg U.S. Aggregate Bond Index | Bloomberg 1-3 Month U.S. Treasury Bill Index |
|---|
11/30/18 | $10,000 | $10,000 | $10,000 |
|---|
3/31/19 | $10,062 | $10,483 | $10,078 |
|---|
3/31/20 | $10,086 | $11,419 | $10,288 |
|---|
3/31/21 | $10,375 | $11,500 | $10,297 |
|---|
3/31/22 | $10,256 | $11,023 | $10,302 |
|---|
3/31/23 | $10,479 | $10,496 | $10,570 |
|---|
3/31/24 | $11,263 | $10,674 | $11,139 |
|---|
3/31/25 | $11,954 | $11,195 | $11,699 |
|---|
3/31/26 | $12,472 | $11,682 | $12,182 |
|---|
|
| AssetsNet |
$ 565,821,037
|
| Holdings Count | Holding |
381
|
| InvestmentCompanyPortfolioTurnover |
16.00%
|
| Additional Fund Statistics [Text Block] |
Fund Statistics as of March 31, 2026 - Net Assets$565,821,037
- Total Number of Portfolio Holdings381
- Portfolio Turnover Rate16%
|
| Holdings [Text Block] |
Portfolio Composition by Quality RatingFootnote Reference1 (% of Total Investments) as of March 31, 2026 Table SummaryAAA | 41.5% |
|---|
AA | 19.0% |
|---|
A | 11.9% |
|---|
BBB | 11.8% |
|---|
BB | 3.0% |
|---|
B | 0.5% |
|---|
NRFootnote Referencea | 3.5% |
|---|
Other Investments | 8.8% |
|---|
Holdings DiversificationFootnote Reference3 (% of Net Assets) as of March 31, 2026 Table SummaryValue | Value |
|---|
Other | 1.6% | Centrally Cleared Interest Rate Swap Agreements Receive | -15.8% | OTC Equity Index Swap Agreements Sold Short | -9.0% | Interest Rate Futures Contracts Sold Short | -5.1% | Collateralized Mortgage Obligations | -% | Interest Rate Futures Contracts Purchased | 5.1% | Exchange-Traded Funds | 9.0% | Corporate Bonds | 19.1% | Asset-Backed Securities | 25.1% | Collateralized Mortgage Obligations | 31.3% | |
| Largest Holdings [Text Block] |
10 Largest HoldingsFootnote Reference2 (% of Net Assets) as of March 31, 2026 Table SummarySPDR S&P 500 ETF Trust | 4.6% |
|---|
iShares Core S&P 500 ETF | 4.4% |
|---|
Freddie Mac 5.00% due 12/25/51 | 2.0% |
|---|
BCC Middle Market CLO LLC 2019-1A A1RR, 5.12% (3 Month Term SOFR + 1.45%, Rate Floor: 1.45%) due 07/15/36 | 1.9% |
|---|
Eldridge CLO Ltd. 2025-1A A1, 5.25% (3 Month Term SOFR + 1.33%, Rate Floor: 1.33%) due 10/20/38 | 1.0% |
|---|
Cerberus Loan Funding 51 LLC 2025-2A A, 5.19% (3 Month Term SOFR + 1.52%, Rate Floor: 1.52%) due 10/15/37 | 1.0% |
|---|
FS Rialto 2021-FL3 B, 5.59% (1 Month Term SOFR + 1.91%, Rate Floor: 1.91%) due 11/16/36 | 1.0% |
|---|
Golub Capital Partners CLO 54M, LP 2021-54A A1R, 5.13% (3 Month Term SOFR + 1.47%, Rate Floor: 1.47%) due 08/05/37 | 0.9% |
|---|
OSAT Trust 2021-RPL1, 6.12% due 05/25/65 | 0.9% |
|---|
Oak Street Investment Grade Net Lease Fund 2020-1A, 1.85% due 11/20/50 | 0.8% |
|---|
Total | 18.5% |
|---|
|
| Material Fund Change [Text Block] |
|
| C000205704 |
|
| Shareholder Report [Line Items] |
|
| Fund Name |
Guggenheim Ultra Short Duration Fund
|
| Class Name |
Institutional Class
|
| Trading Symbol |
GIYIX
|
| Annual or Semi-Annual Statement [Text Block] |
This semi-annual shareholder report contains important information about the Guggenheim Ultra Short Duration Fund for the period from October 1, 2025 to March 31, 2026.
|
| Shareholder Report Annual or Semi-Annual |
Semi-Annual Shareholder Report
|
| Additional Information [Text Block] |
You can find additional information about the fund at GuggenheimInvestments.com/mutual-funds/literature. You can also request this information by contacting 800 820 0888 or services@guggenheiminvestments.com.
|
| Additional Information Phone Number |
800 820 0888
|
| Additional Information Email |
<span style="box-sizing: border-box; color: rgb(67, 67, 67); display: inline; flex-wrap: nowrap; font-size: 10.6667px; font-weight: 400; grid-area: auto; line-height: 12.8px; margin: 0px; overflow: visible; text-align: left; text-align-last: auto; white-space-collapse: preserve-breaks;">services@guggenheiminvestments.com</span>
|
| Additional Information Website |
<span style="box-sizing: border-box; color: rgb(67, 67, 67); display: inline; flex-wrap: nowrap; font-size: 10.6667px; font-weight: 400; grid-area: auto; line-height: 12.8px; margin: 0px; overflow: visible; text-align: left; text-align-last: auto; white-space-collapse: preserve-breaks;">GuggenheimInvestments.com/mutual-funds/literature</span>
|
| Expenses [Text Block] |
What were the Fund's costs for the last six months? * Based on a hypothetical $10,000 investment Table SummaryClass | Costs of a $10,000 Investment | Costs Paid as a % of a $10,000 Investment** |
|---|
Institutional Class | $17 | 0.33% |
|---|
Table Summary* | Excludes expenses of the underlying funds in which the fund invests, if any. |
|---|
** | Annualized |
|---|
|
| Expenses Paid, Amount |
$ 17
|
| Factors Affecting Performance [Text Block] |
What factors materially affected the Fund's performance over the last six months? Positive performance over the period was driven by carry (or earned income), attributable to the fund's allocations to high-grade securitized credit sectors. Duration detracted modestly as rates rose over the period. Additionally, spread widening across fixed-income sectors, prompted by heightened geopolitical tensions, detracted from performance. The effect was felt broadly across credit-sensitive holdings. |
| Line Graph [Table Text Block] |
Table Summary | Ultra Short Duration Fund (Institutional Class) | Bloomberg U.S. Aggregate Bond Index | Bloomberg 1-3 Month U.S. Treasury Bill Index |
|---|
3/31/16 | $2,000,000 | $2,000,000 | $2,000,000 |
|---|
3/31/17 | $2,045,884 | $2,008,812 | $2,006,031 |
|---|
3/31/18 | $2,082,598 | $2,032,978 | $2,027,034 |
|---|
3/31/19 | $2,129,712 | $2,124,067 | $2,069,353 |
|---|
3/31/20 | $2,138,487 | $2,313,827 | $2,112,399 |
|---|
3/31/21 | $2,205,334 | $2,330,260 | $2,114,375 |
|---|
3/31/22 | $2,187,758 | $2,233,505 | $2,115,519 |
|---|
3/31/23 | $2,240,969 | $2,126,668 | $2,170,522 |
|---|
3/31/24 | $2,414,573 | $2,162,781 | $2,287,185 |
|---|
3/31/25 | $2,568,588 | $2,268,317 | $2,402,184 |
|---|
3/31/26 | $2,687,781 | $2,366,958 | $2,501,274 |
|---|
|
| AssetsNet |
$ 565,821,037
|
| Holdings Count | Holding |
381
|
| InvestmentCompanyPortfolioTurnover |
16.00%
|
| Additional Fund Statistics [Text Block] |
Fund Statistics as of March 31, 2026 - Net Assets$565,821,037
- Total Number of Portfolio Holdings381
- Portfolio Turnover Rate16%
|
| Holdings [Text Block] |
Portfolio Composition by Quality RatingFootnote Reference1 (% of Total Investments) as of March 31, 2026 Table SummaryAAA | 41.5% |
|---|
AA | 19.0% |
|---|
A | 11.9% |
|---|
BBB | 11.8% |
|---|
BB | 3.0% |
|---|
B | 0.5% |
|---|
NRFootnote Referencea | 3.5% |
|---|
Other Investments | 8.8% |
|---|
Holdings DiversificationFootnote Reference3 (% of Net Assets) as of March 31, 2026 Table SummaryValue | Value |
|---|
Other | 1.6% | Centrally Cleared Interest Rate Swap Agreements Receive | -15.8% | OTC Equity Index Swap Agreements Sold Short | -9.0% | Interest Rate Futures Contracts Sold Short | -5.1% | Collateralized Mortgage Obligations | -% | Interest Rate Futures Contracts Purchased | 5.1% | Exchange-Traded Funds | 9.0% | Corporate Bonds | 19.1% | Asset-Backed Securities | 25.1% | Collateralized Mortgage Obligations | 31.3% | |
| Largest Holdings [Text Block] |
10 Largest HoldingsFootnote Reference2 (% of Net Assets) as of March 31, 2026 Table SummarySPDR S&P 500 ETF Trust | 4.6% |
|---|
iShares Core S&P 500 ETF | 4.4% |
|---|
Freddie Mac 5.00% due 12/25/51 | 2.0% |
|---|
BCC Middle Market CLO LLC 2019-1A A1RR, 5.12% (3 Month Term SOFR + 1.45%, Rate Floor: 1.45%) due 07/15/36 | 1.9% |
|---|
Eldridge CLO Ltd. 2025-1A A1, 5.25% (3 Month Term SOFR + 1.33%, Rate Floor: 1.33%) due 10/20/38 | 1.0% |
|---|
Cerberus Loan Funding 51 LLC 2025-2A A, 5.19% (3 Month Term SOFR + 1.52%, Rate Floor: 1.52%) due 10/15/37 | 1.0% |
|---|
FS Rialto 2021-FL3 B, 5.59% (1 Month Term SOFR + 1.91%, Rate Floor: 1.91%) due 11/16/36 | 1.0% |
|---|
Golub Capital Partners CLO 54M, LP 2021-54A A1R, 5.13% (3 Month Term SOFR + 1.47%, Rate Floor: 1.47%) due 08/05/37 | 0.9% |
|---|
OSAT Trust 2021-RPL1, 6.12% due 05/25/65 | 0.9% |
|---|
Oak Street Investment Grade Net Lease Fund 2020-1A, 1.85% due 11/20/50 | 0.8% |
|---|
Total | 18.5% |
|---|
|
| Material Fund Change [Text Block] |
|