Pay vs Performance Disclosure - USD ($)
|
3 Months Ended |
9 Months Ended |
12 Months Ended |
Mar. 31, 2020 |
Sep. 27, 2025 |
Dec. 31, 2020 |
Dec. 31, 2025 |
Dec. 31, 2024 |
Dec. 31, 2023 |
Dec. 31, 2022 |
Dec. 31, 2021 |
Dec. 31, 2020 |
| Pay vs Performance Disclosure |
|
|
|
|
|
|
|
|
|
| Pay vs Performance Disclosure, Table |
|
|
|
| | | | | | | | | | | | | | | | | | | | | | | | | | | | | | | | | | | | | | | | | | | | | | | | | | | Value of Initial Fixed $100
Investment Based on: | | | | Year | Summary
Compensation
Table
Total for
PEO #1
($) | Summary
Compensation
Table Total
for PEO #2
($) | Compensation
Actually
Paid to PEO
#1
($)(1)(2) | Compensation
Actually
Paid to PEO
#2
($)(1)(2) | Average
Summary
Compensation
Table Total
for Non-PEO
NEOs ($) | Average
Compensation Actually
Paid to
Non-PEO
NEOs
($)(1)(2) | Total
Stockholder
Return
($) | Peer Group
Total
Stockholder
Return
($)(3) | Net
Income
(Loss)
($) | Revenue
($) | | TP 2025 | 10,886,885 | — | 31,514,945 | — | 1,512,874 | 6,072,880 | 40 | 236 | 161,596,000 | 1,173,449,000 | | 2024 | 8,018,778 | — | 776,203 | — | 1,486,011 | (251,549) | 12 | 190 | (176,091,000) | 1,622,796,000 | | 2023 | 5,163,538 | — | 9,485,093 | — | 1,659,676 | 2,566,085 | 31 | 135 | (287,917,000) | 1,368,225,000 | | 2022 | 8,382,861 | — | (19,012,038) | — | 907,013 | (2,114,790) | 17 | 81 | (561,919,000) | 1,008,696,000 | | 2021 | 6,484,064 | — | (29,263,387) | — | 21,246,076 | 217,982 | 151 | 146 | (382,963,000) | 638,370,000 | | 2020 | 21,694,522 | 949,986 | 102,300,236 | 949,986 | 7,145,337 | 16,644,399 | 272 | 115 | (599,392,000) | 217,746,000 |
|
|
|
|
|
|
| Company Selected Measure Name |
|
|
|
Revenue
|
|
|
|
|
|
| Named Executive Officers, Footnote |
|
|
|
Amounts represent compensation actually paid to our PEOs and the average compensation actually paid to our remaining named executive officers for the relevant fiscal year, as determined under SEC rules (and described below), which includes the individuals indicated in the table below for each fiscal year: | | | | | | | | | | | | | Year | PEO #1 | PEO #2 | Non-PEO NEOs | | TP 2025 | David Gandler | -- | John Janedis, Edgar Bronfman, Jr., and Alberto Horihuela Suarez | 2024 | David Gandler | -- | John Janedis, Edgar Bronfman, Jr., and Alberto Horihuela Suarez | | 2023 | David Gandler | -- | John Janedis, Edgar Bronfman, Jr., and Alberto Horihuela Suarez | | 2022 | David Gandler | -- | John Janedis, Edgar Bronfman, Jr., Alberto Horihuela Suarez and Simone Nardi | | 2021 | David Gandler | -- | Edgar Bronfman, Jr. and Alberto Horihuela Suarez | | 2020 | David Gandler | John Textor(a) | Edgar Bronfman, Jr. and Simone Nardi |
(a)John Textor served as our Chief Executive Officer from August 8, 2018 until April 1, 2020, as our Executive Chairman from April 1, 2020 to April 29, 2020 and as a director from August 8, 2018 to July 31, 2020. From April 29, 2020 through October 30, 2020, Mr. Textor served as our Head of Studio. He resigned from all positions with the Company as of October 30, 2020.
|
|
|
|
|
|
| Peer Group Issuers, Footnote |
|
|
|
Fair value or change in fair value, as applicable, of equity awards in the “Compensation Actually Paid” columns was determined by reference to (i) for RSU awards, the closing price per share on the applicable year-end date(s), (ii) for stock options, a Black Scholes value as of the applicable year-end or vesting date(s), determined based on the same methodology as used to determine grant date fair value but using the closing stock price on the applicable revaluation date as the current market price and with an expected term equal to the half- life from vesting to the end of its contractual term, and (iii) for performance-based RSU awards, the closing price per share on the applicable year-end date(s) as adjusted for the probability of achievement of the applicable performance objectives as of each such date. For additional information on the assumptions used to calculate the valuation of the awards, see Note 14 to our consolidated financial statements included in our Annual Report on Form 10-K for the period ended December 31, 2024, which was filed with the SEC on March 3, 2025 and in footnote (3) to the Summary Compensation Table above.
|
|
|
|
|
|
| Adjustment To PEO Compensation, Footnote |
|
|
|
The amounts reported in the “Compensation Actually Paid to PEO #1,” “Compensation Actually Paid to PEO #2,” and “Average Compensation Actually Paid to Non-PEO NEOs” columns do not reflect the actual compensation paid to or realized by our PEOs or our non-PEO NEOs during each applicable year or TP 2025. The calculation of compensation actually paid for purposes of this table includes point-in-time fair values of stock awards and these values will fluctuate based on our stock price, various accounting valuation assumptions and projected performance related to our performance awards. See the Summary Compensation Table for certain other compensation of our PEOs and our non-PEO NEOs for each applicable period and the Option Exercises and Stock Vested table for the value realized by each of them upon the vesting of stock awards during TP 2025. Compensation actually paid to our named executive officers represents the “Total” compensation reported in the Summary Compensation Table for the applicable fiscal year, as adjusted as follows: | | | | | | | | | | | | | | | | | | | | | | | | | | | | | | | | | | | | | | | | | | | 2020 | 2021 | 2022 | 2023 | 2024 | TP 2025 | Adjustments | PEO #1 | PEO #2 | Average Non-PEO NEOs | PEO | Average Non- PEO NEOs | PEO | Average Non-PEO NEOs | PEO | Average Non-PEO NEOs | PEO | Average Non-PEO NEOs | PEO | Average Non-PEO NEOs | Deduction for Amounts Reported under the “Stock Awards” and “Option Awards” Columns in the Summary Compensation Table for Applicable FY | (20,937,563) | — | (6,903,041) | (5,432,006) | (20,891,705) | (7,255,640) | (471,640) | (3,459,074) | (1,072,583) | (4,213,381) | (672,597) | (7,901,641) | (793,691) | Increase based on ASC 718 Fair Value of Awards Granted during Applicable FY that Remain Unvested as of Applicable FY End, determined as of Applicable FY End | 85,959,630 | — | 5,223,616 | 7,255,640 | 1,906,972 | 159,004 | 165,109 | 6,692,957 | 1,065,625 | 2,930,177 | 543,762 | 14,569,733 | 2,169,518 | Increase based on ASC 718 Fair Value of Awards Granted during Applicable FY that Vested during Applicable FY, determined as of Vesting Date | 8,866,650 | — | 10,636,742 | — | — | — | — | — | — | 857,939 | — | — | — | Increase/deduction for Awards Granted during Prior FY that were Outstanding and Unvested as of Applicable FY End, determined based on change in ASC 718 Fair Value from Prior FY End to Applicable FY End | 5,719,127 | — | 465,567 | (32,402,476) | (1,804,638) | (15,911,093) | (1,636,967) | 212,309 | 765,017 | (6,161,145) | (1,403,047) | 13,290,599 | 3,184,178 | Increase/deduction for Awards Granted during Prior FY that Vested During Applicable FY, determined based on change in ASC 718 Fair Value from Prior FY End to Vesting Date | 997,869 | — | 76,179 | (5,168,339) | (238,722) | (4,387,170) | (914,821) | 875,363 | 148,350 | (656,165) | (205,679) | 669,369 | — | Deduction of ASC 718 Fair Value of Awards Granted during Prior FY that were Forfeited during Applicable FY, determined as of Prior FY End | — | — | — | — | — | — | (611,214) | — | — | — | — | — | — |
| | | | | | | | | | | | | | | | | | | | | | | | | | | | | | | | | | | | | | | | | | Increase based on Incremental Fair Value of Options/SARs Modified during Applicable FY | — | — | — | — | — | — | 447,730 | — | — | — | — | — | — | TOTAL ADJUSTMENTS | 80,605,713 | — | 9,499,063 | (35,747,181) | (21,028,093) | (27,394,899) | (3,021,803) | 4,321,555 | 906,409 | (7,242,575) | (1,737,560) | 20,628,060 | 4,560,005 |
|
|
|
|
|
|
| Non-PEO NEO Average Total Compensation Amount |
|
$ 1,512,874
|
|
|
$ 1,486,011
|
$ 1,659,676
|
$ 907,013
|
$ 21,246,076
|
$ 7,145,337
|
| Non-PEO NEO Average Compensation Actually Paid Amount |
|
6,072,880
|
|
|
(251,549)
|
2,566,085
|
(2,114,790)
|
217,982
|
16,644,399
|
| Adjustment to Non-PEO NEO Compensation Footnote |
|
|
|
The amounts reported in the “Compensation Actually Paid to PEO #1,” “Compensation Actually Paid to PEO #2,” and “Average Compensation Actually Paid to Non-PEO NEOs” columns do not reflect the actual compensation paid to or realized by our PEOs or our non-PEO NEOs during each applicable year or TP 2025. The calculation of compensation actually paid for purposes of this table includes point-in-time fair values of stock awards and these values will fluctuate based on our stock price, various accounting valuation assumptions and projected performance related to our performance awards. See the Summary Compensation Table for certain other compensation of our PEOs and our non-PEO NEOs for each applicable period and the Option Exercises and Stock Vested table for the value realized by each of them upon the vesting of stock awards during TP 2025. Compensation actually paid to our named executive officers represents the “Total” compensation reported in the Summary Compensation Table for the applicable fiscal year, as adjusted as follows: | | | | | | | | | | | | | | | | | | | | | | | | | | | | | | | | | | | | | | | | | | | 2020 | 2021 | 2022 | 2023 | 2024 | TP 2025 | Adjustments | PEO #1 | PEO #2 | Average Non-PEO NEOs | PEO | Average Non- PEO NEOs | PEO | Average Non-PEO NEOs | PEO | Average Non-PEO NEOs | PEO | Average Non-PEO NEOs | PEO | Average Non-PEO NEOs | Deduction for Amounts Reported under the “Stock Awards” and “Option Awards” Columns in the Summary Compensation Table for Applicable FY | (20,937,563) | — | (6,903,041) | (5,432,006) | (20,891,705) | (7,255,640) | (471,640) | (3,459,074) | (1,072,583) | (4,213,381) | (672,597) | (7,901,641) | (793,691) | Increase based on ASC 718 Fair Value of Awards Granted during Applicable FY that Remain Unvested as of Applicable FY End, determined as of Applicable FY End | 85,959,630 | — | 5,223,616 | 7,255,640 | 1,906,972 | 159,004 | 165,109 | 6,692,957 | 1,065,625 | 2,930,177 | 543,762 | 14,569,733 | 2,169,518 | Increase based on ASC 718 Fair Value of Awards Granted during Applicable FY that Vested during Applicable FY, determined as of Vesting Date | 8,866,650 | — | 10,636,742 | — | — | — | — | — | — | 857,939 | — | — | — | Increase/deduction for Awards Granted during Prior FY that were Outstanding and Unvested as of Applicable FY End, determined based on change in ASC 718 Fair Value from Prior FY End to Applicable FY End | 5,719,127 | — | 465,567 | (32,402,476) | (1,804,638) | (15,911,093) | (1,636,967) | 212,309 | 765,017 | (6,161,145) | (1,403,047) | 13,290,599 | 3,184,178 | Increase/deduction for Awards Granted during Prior FY that Vested During Applicable FY, determined based on change in ASC 718 Fair Value from Prior FY End to Vesting Date | 997,869 | — | 76,179 | (5,168,339) | (238,722) | (4,387,170) | (914,821) | 875,363 | 148,350 | (656,165) | (205,679) | 669,369 | — | Deduction of ASC 718 Fair Value of Awards Granted during Prior FY that were Forfeited during Applicable FY, determined as of Prior FY End | — | — | — | — | — | — | (611,214) | — | — | — | — | — | — |
| | | | | | | | | | | | | | | | | | | | | | | | | | | | | | | | | | | | | | | | | | Increase based on Incremental Fair Value of Options/SARs Modified during Applicable FY | — | — | — | — | — | — | 447,730 | — | — | — | — | — | — | TOTAL ADJUSTMENTS | 80,605,713 | — | 9,499,063 | (35,747,181) | (21,028,093) | (27,394,899) | (3,021,803) | 4,321,555 | 906,409 | (7,242,575) | (1,737,560) | 20,628,060 | 4,560,005 |
|
|
|
|
|
|
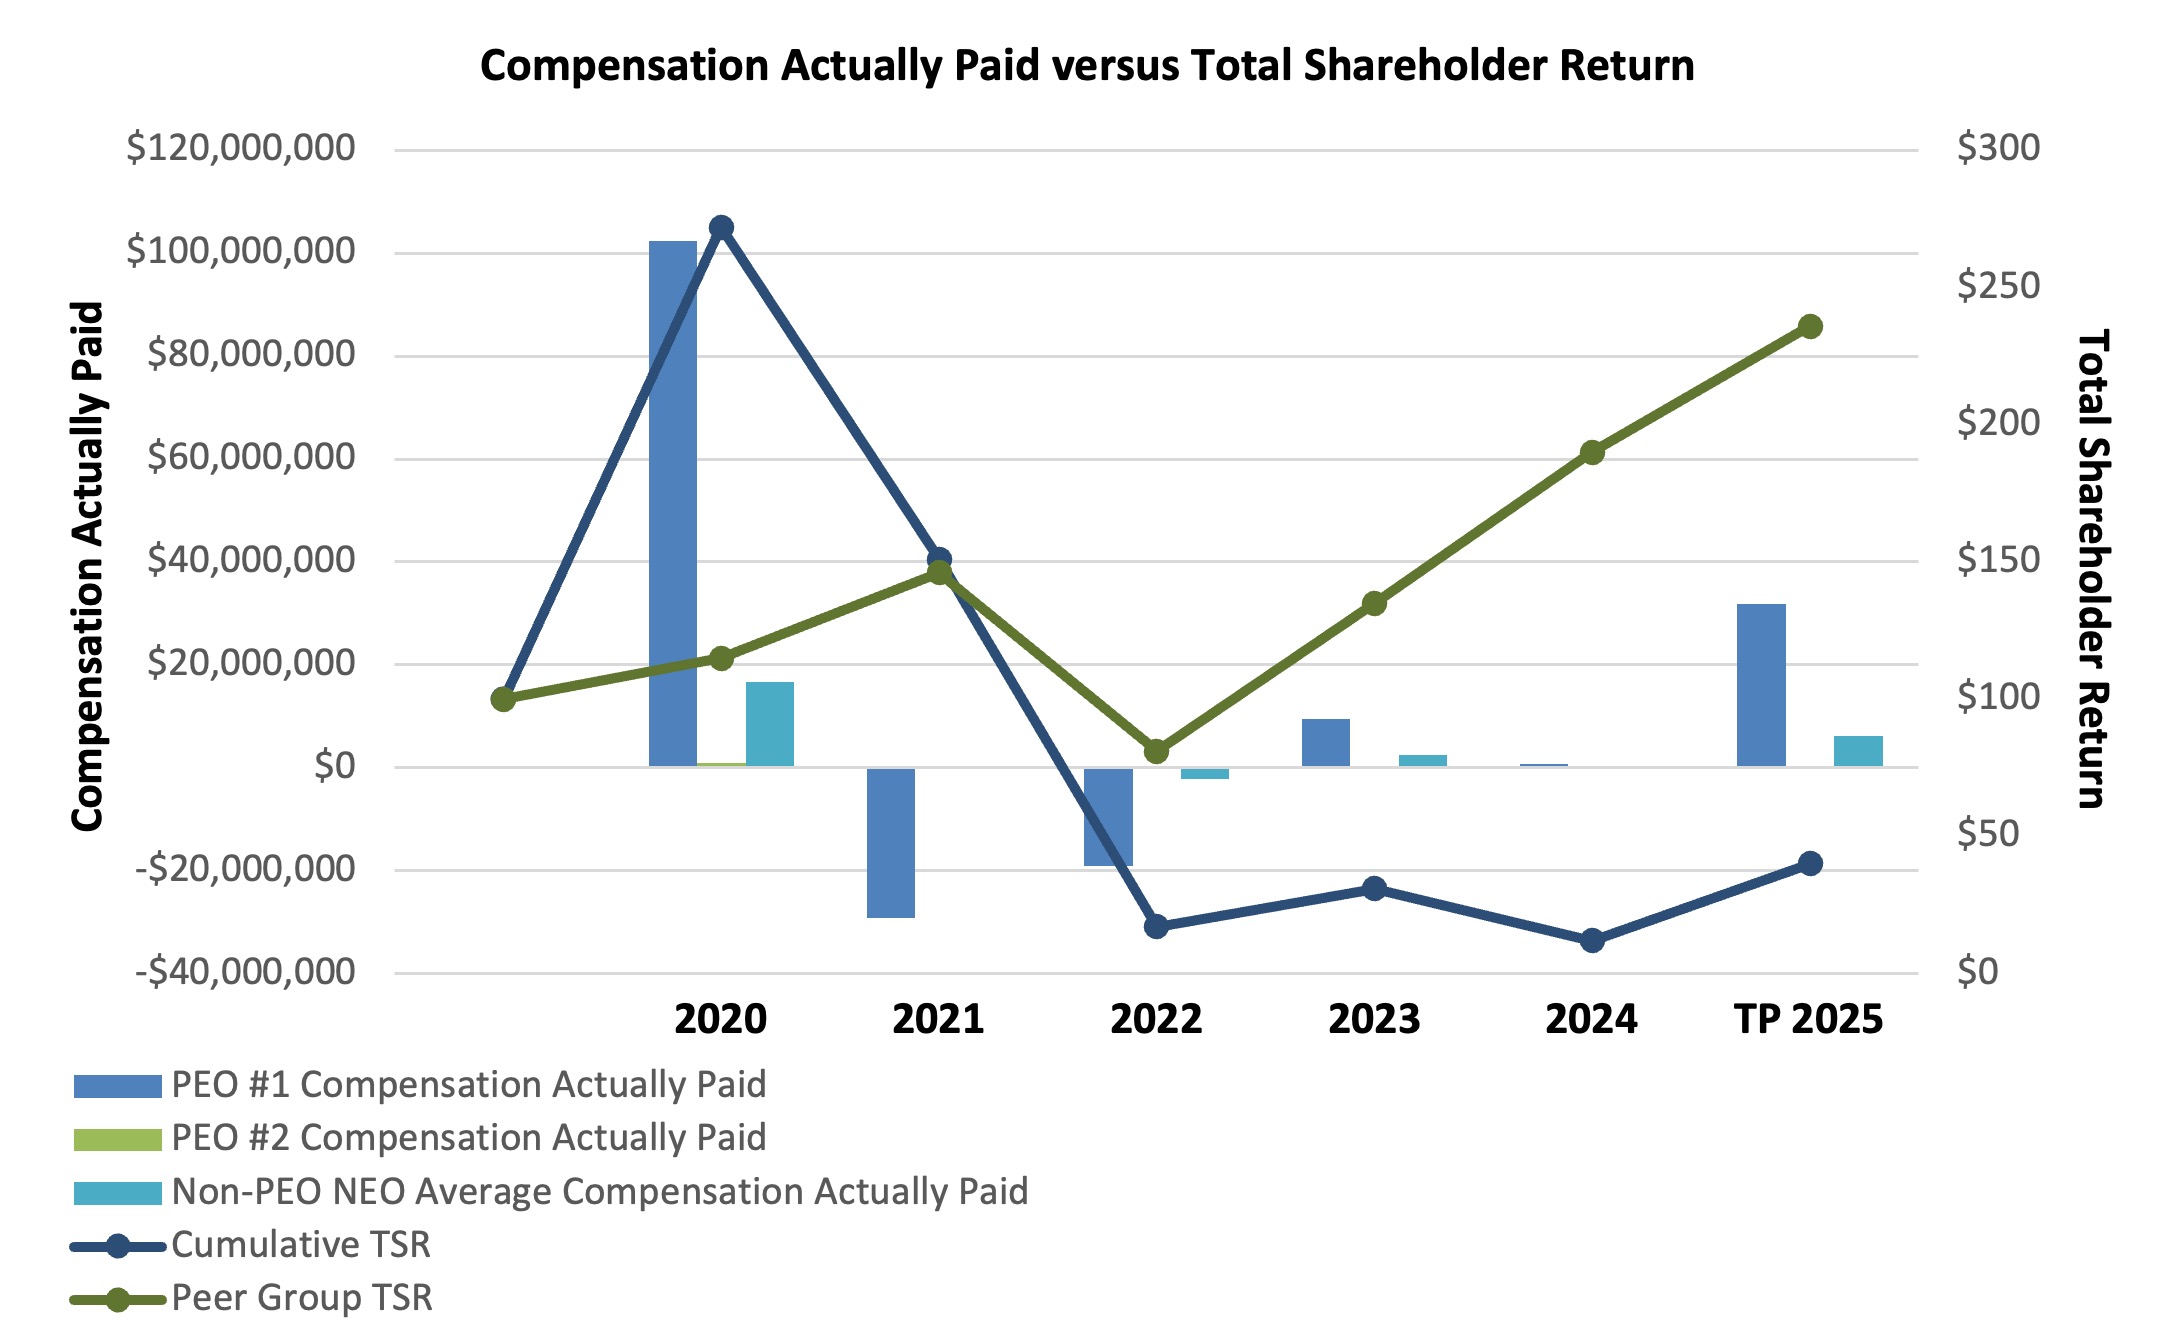
| Compensation Actually Paid vs. Total Shareholder Return |
|
|
|
|
|
|
|
|
|
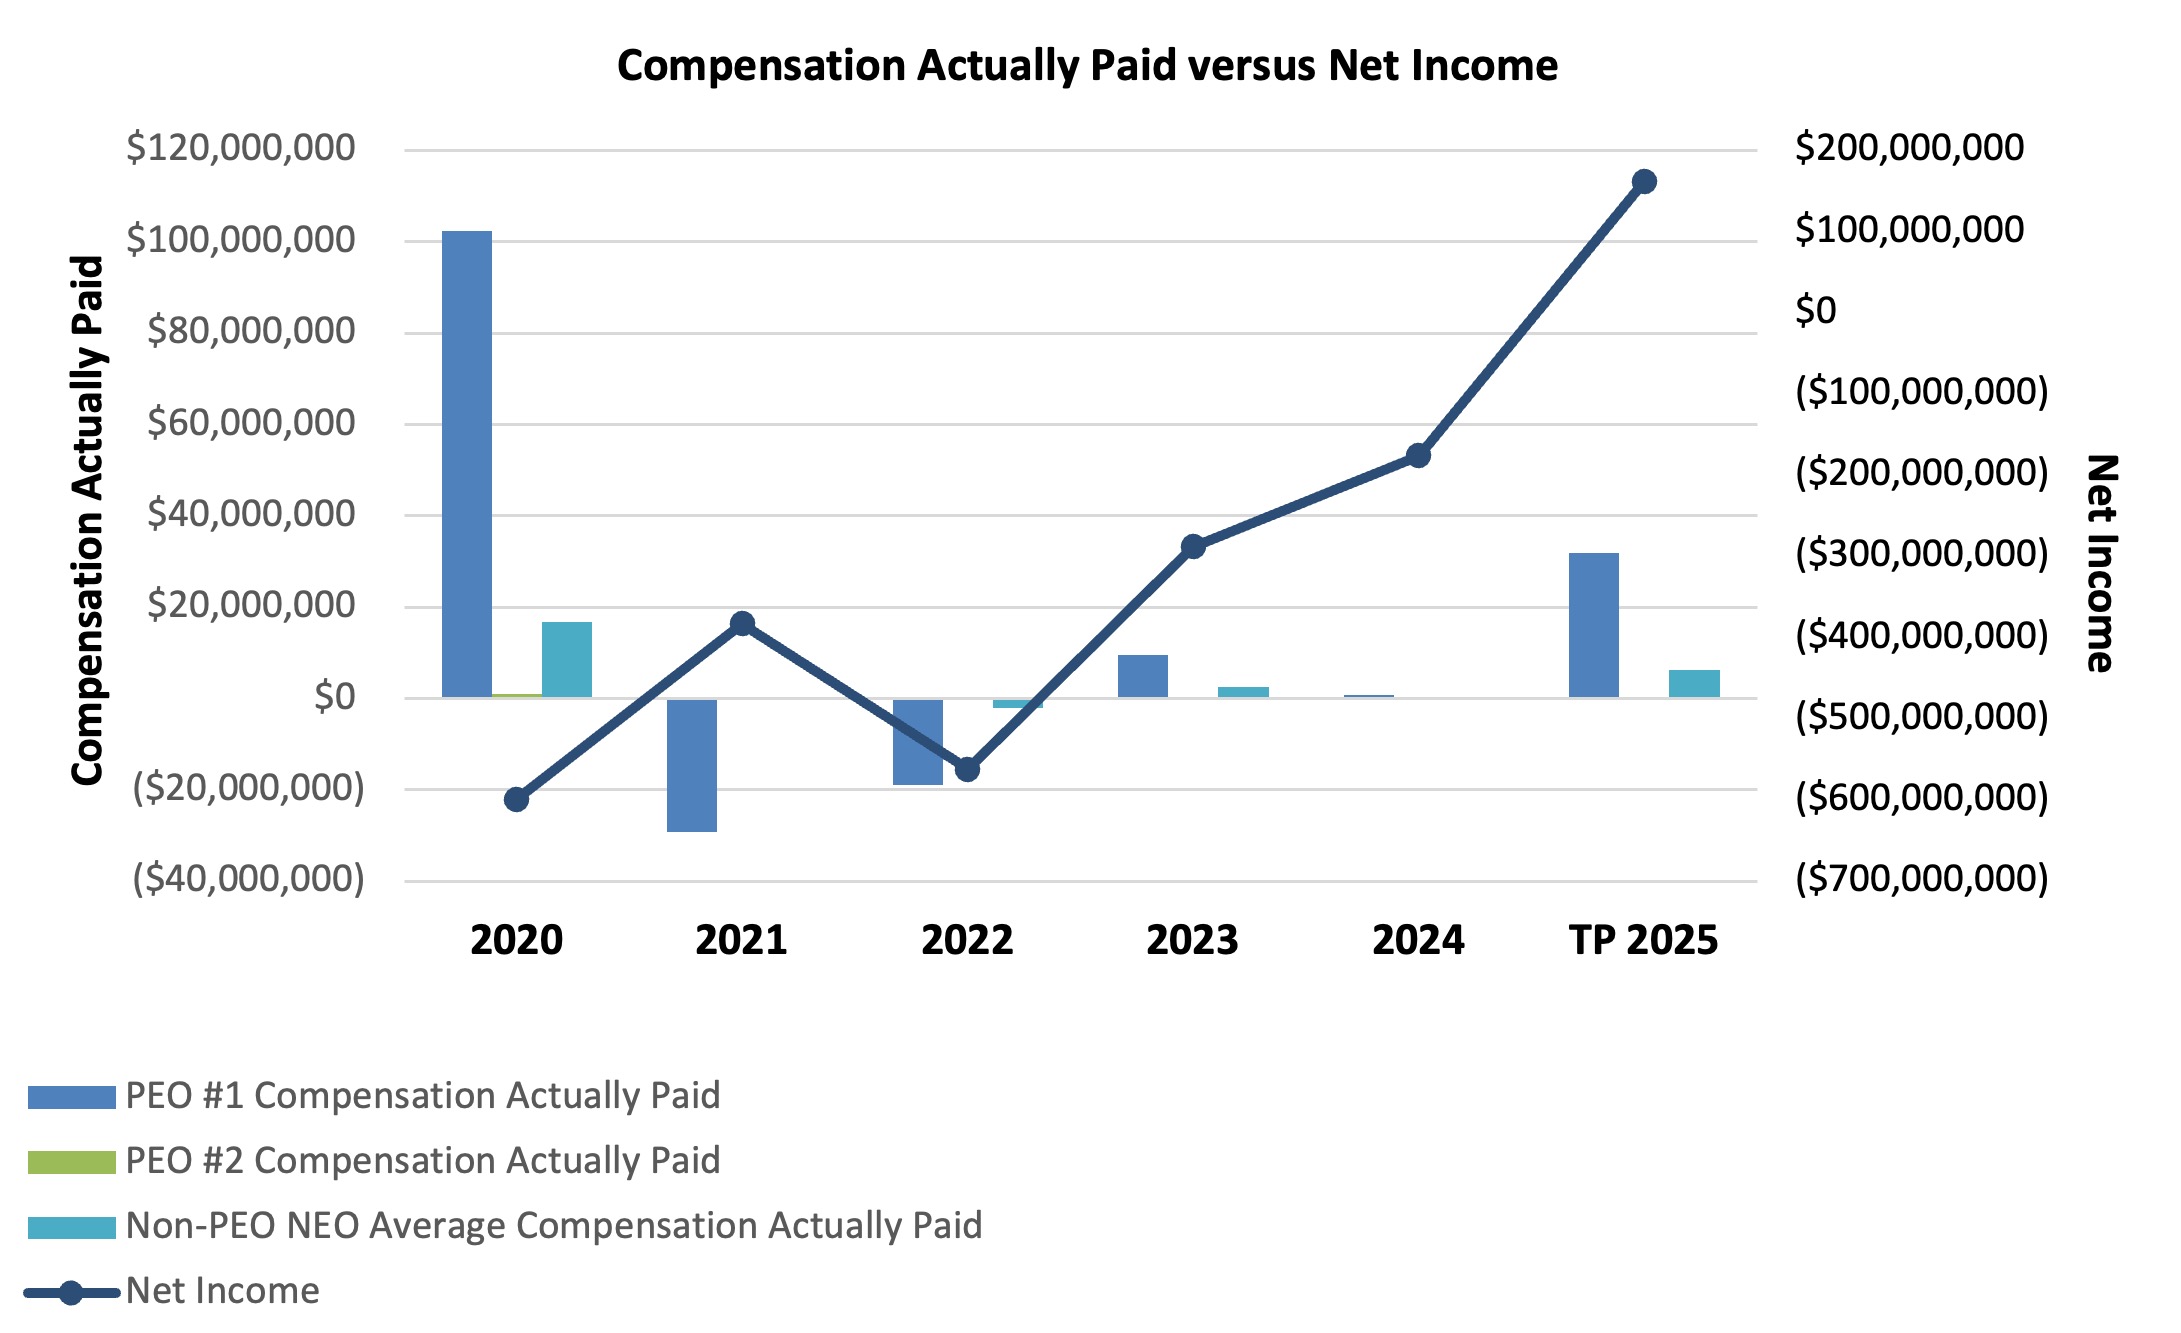
| Compensation Actually Paid vs. Net Income |
|
|
|
|
|
|
|
|
|
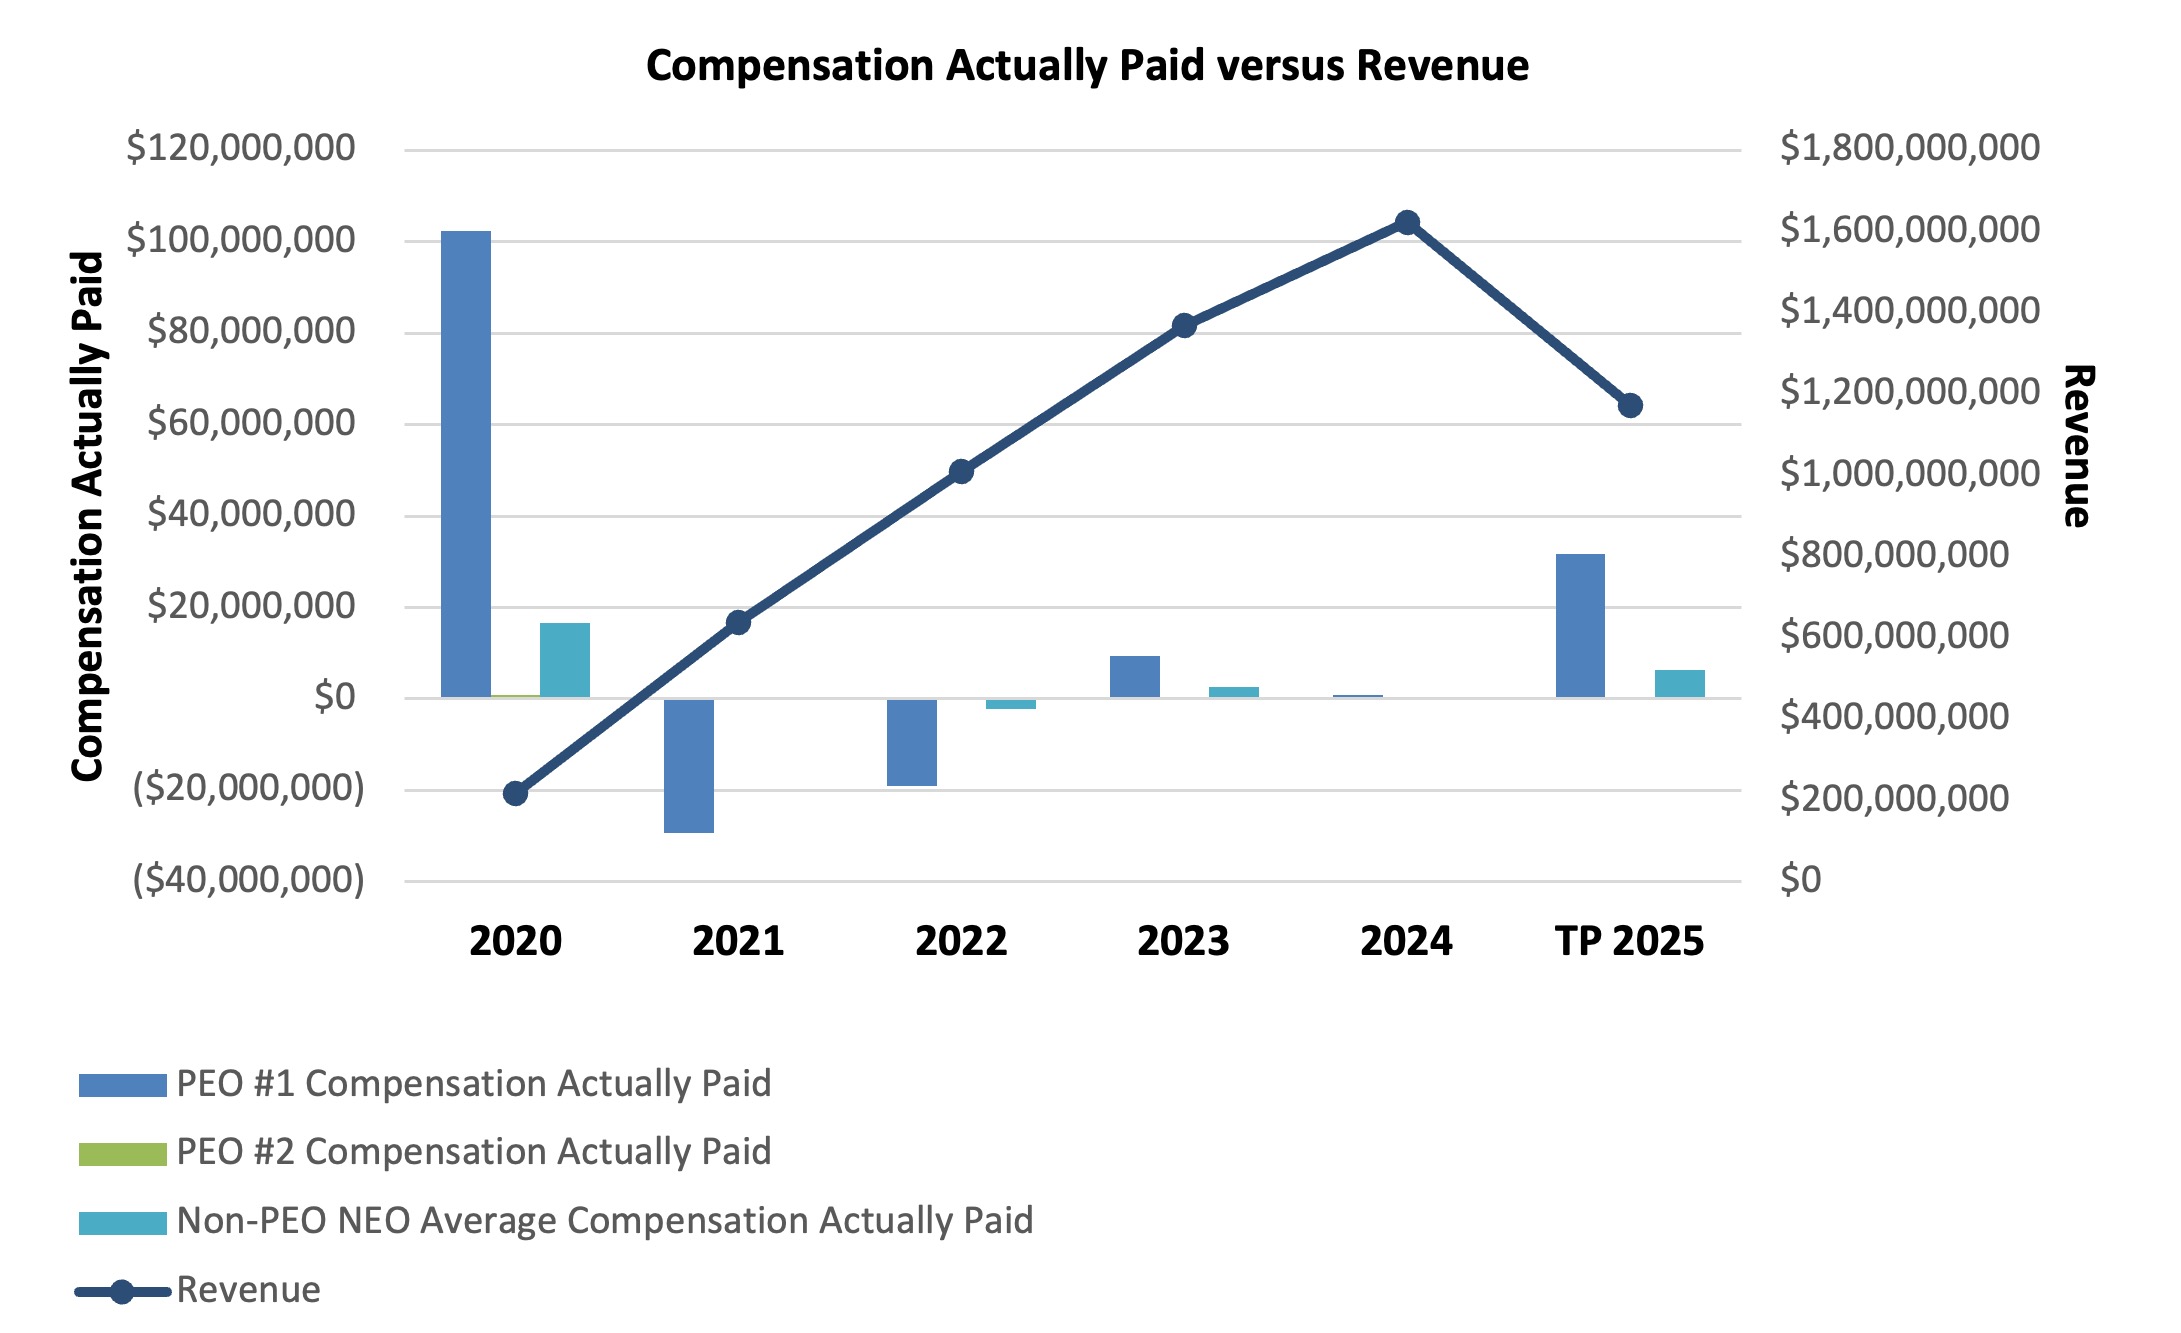
| Compensation Actually Paid vs. Company Selected Measure |
|
|
|
|
|
|
|
|
|
| Total Shareholder Return Vs Peer Group |
|
|
|
|
|
|
|
|
|
| Tabular List, Table |
|
|
|
•Revenue; •Adjusted EBITDA; and •Subscribers.
|
|
|
|
|
|
| Total Shareholder Return Amount |
|
40
|
|
|
12
|
31
|
17
|
151
|
272
|
| Peer Group Total Shareholder Return Amount |
|
236
|
|
|
190
|
135
|
81
|
146
|
115
|
| Net Income (Loss), Including Portion Attributable to Noncontrolling Interest |
|
$ 161,596,000
|
|
|
$ (176,091,000)
|
$ (287,917,000)
|
$ (561,919,000)
|
$ (382,963,000)
|
$ (599,392,000)
|
| Company Selected Measure Amount |
|
1,173,449,000
|
|
|
1,622,796,000
|
1,368,225,000
|
1,008,696,000
|
638,370,000
|
217,746,000
|
| PEO Name |
John Textor
|
David Gandler
|
David Gandler
|
|
David Gandler
|
David Gandler
|
David Gandler
|
David Gandler
|
|
| Additional 402(v) Disclosure |
|
|
|
For the relevant fiscal year or the 2025 Transition Period, as applicable, represents the cumulative TSR (the “Peer Group TSR”) of the S&P Media and Entertainment Index (the “Peer Group”) for the period commencing on October 8, 2020, the date on which our common shares commenced trading on the New York Stock Exchange, through December 31 of the applicable year (or September 27 for the 2025 Transition Period), and that all dividends, if any, were reinvested. For additional details regarding our most important financial performance measures, please see the sections titled “Pay for Performance,” “Performance Bonuses” and “Long-Term Equity Incentives” in our compensation discussion and analysis elsewhere in this Proxy Statement.
|
|
|
|
|
|
| Measure:: 1 |
|
|
|
|
|
|
|
|
|
| Pay vs Performance Disclosure |
|
|
|
|
|
|
|
|
|
| Name |
|
|
|
Revenue
|
|
|
|
|
|
| Measure:: 2 |
|
|
|
|
|
|
|
|
|
| Pay vs Performance Disclosure |
|
|
|
|
|
|
|
|
|
| Name |
|
|
|
Adjusted EBITDA
|
|
|
|
|
|
| Measure:: 3 |
|
|
|
|
|
|
|
|
|
| Pay vs Performance Disclosure |
|
|
|
|
|
|
|
|
|
| Name |
|
|
|
Subscribers
|
|
|
|
|
|
| David Gandler [Member] |
|
|
|
|
|
|
|
|
|
| Pay vs Performance Disclosure |
|
|
|
|
|
|
|
|
|
| PEO Total Compensation Amount |
|
$ 10,886,885
|
|
|
$ 8,018,778
|
$ 5,163,538
|
$ 8,382,861
|
$ 6,484,064
|
$ 21,694,522
|
| PEO Actually Paid Compensation Amount |
|
31,514,945
|
|
|
776,203
|
9,485,093
|
(19,012,038)
|
(29,263,387)
|
102,300,236
|
| John Textor [Member] |
|
|
|
|
|
|
|
|
|
| Pay vs Performance Disclosure |
|
|
|
|
|
|
|
|
|
| PEO Total Compensation Amount |
|
|
|
|
|
|
|
|
949,986
|
| PEO Actually Paid Compensation Amount |
|
|
|
|
|
|
|
|
949,986
|
| PEO |
|
|
|
|
|
|
|
|
|
| Pay vs Performance Disclosure |
|
|
|
|
|
|
|
|
|
| Adjustment to Compensation, Amount |
|
20,628,060
|
|
|
(7,242,575)
|
4,321,555
|
(27,394,899)
|
(35,747,181)
|
|
| PEO | Aggregate Grant Date Fair Value of Equity Award Amounts Reported in Summary Compensation Table |
|
|
|
|
|
|
|
|
|
| Pay vs Performance Disclosure |
|
|
|
|
|
|
|
|
|
| Adjustment to Compensation, Amount |
|
(7,901,641)
|
|
|
(4,213,381)
|
(3,459,074)
|
(7,255,640)
|
(5,432,006)
|
|
| PEO | Year-end Fair Value of Equity Awards Granted in Covered Year that are Outstanding and Unvested |
|
|
|
|
|
|
|
|
|
| Pay vs Performance Disclosure |
|
|
|
|
|
|
|
|
|
| Adjustment to Compensation, Amount |
|
14,569,733
|
|
|
2,930,177
|
6,692,957
|
159,004
|
7,255,640
|
|
| PEO | Year-over-Year Change in Fair Value of Equity Awards Granted in Prior Years That are Outstanding and Unvested |
|
|
|
|
|
|
|
|
|
| Pay vs Performance Disclosure |
|
|
|
|
|
|
|
|
|
| Adjustment to Compensation, Amount |
|
13,290,599
|
|
|
(6,161,145)
|
212,309
|
(15,911,093)
|
(32,402,476)
|
|
| PEO | Vesting Date Fair Value of Equity Awards Granted and Vested in Covered Year |
|
|
|
|
|
|
|
|
|
| Pay vs Performance Disclosure |
|
|
|
|
|
|
|
|
|
| Adjustment to Compensation, Amount |
|
0
|
|
|
857,939
|
0
|
0
|
0
|
|
| PEO | Change in Fair Value as of Vesting Date of Prior Year Equity Awards Vested in Covered Year |
|
|
|
|
|
|
|
|
|
| Pay vs Performance Disclosure |
|
|
|
|
|
|
|
|
|
| Adjustment to Compensation, Amount |
|
669,369
|
|
|
(656,165)
|
875,363
|
(4,387,170)
|
(5,168,339)
|
|
| PEO | Prior Year End Fair Value of Equity Awards Granted in Any Prior Year that Fail to Meet Applicable Vesting Conditions During Covered Year |
|
|
|
|
|
|
|
|
|
| Pay vs Performance Disclosure |
|
|
|
|
|
|
|
|
|
| Adjustment to Compensation, Amount |
|
0
|
|
|
0
|
0
|
0
|
0
|
|
| PEO | Dividends or Other Earnings Paid on Equity Awards not Otherwise Reflected in Total Compensation for Covered Year |
|
|
|
|
|
|
|
|
|
| Pay vs Performance Disclosure |
|
|
|
|
|
|
|
|
|
| Adjustment to Compensation, Amount |
|
0
|
|
|
0
|
0
|
0
|
0
|
|
| PEO | David Gandler [Member] |
|
|
|
|
|
|
|
|
|
| Pay vs Performance Disclosure |
|
|
|
|
|
|
|
|
|
| Adjustment to Compensation, Amount |
|
|
|
|
|
|
|
|
80,605,713
|
| PEO | David Gandler [Member] | Aggregate Grant Date Fair Value of Equity Award Amounts Reported in Summary Compensation Table |
|
|
|
|
|
|
|
|
|
| Pay vs Performance Disclosure |
|
|
|
|
|
|
|
|
|
| Adjustment to Compensation, Amount |
|
|
|
|
|
|
|
|
(20,937,563)
|
| PEO | David Gandler [Member] | Year-end Fair Value of Equity Awards Granted in Covered Year that are Outstanding and Unvested |
|
|
|
|
|
|
|
|
|
| Pay vs Performance Disclosure |
|
|
|
|
|
|
|
|
|
| Adjustment to Compensation, Amount |
|
|
|
|
|
|
|
|
85,959,630
|
| PEO | David Gandler [Member] | Year-over-Year Change in Fair Value of Equity Awards Granted in Prior Years That are Outstanding and Unvested |
|
|
|
|
|
|
|
|
|
| Pay vs Performance Disclosure |
|
|
|
|
|
|
|
|
|
| Adjustment to Compensation, Amount |
|
|
|
|
|
|
|
|
5,719,127
|
| PEO | David Gandler [Member] | Vesting Date Fair Value of Equity Awards Granted and Vested in Covered Year |
|
|
|
|
|
|
|
|
|
| Pay vs Performance Disclosure |
|
|
|
|
|
|
|
|
|
| Adjustment to Compensation, Amount |
|
|
|
|
|
|
|
|
8,866,650
|
| PEO | David Gandler [Member] | Change in Fair Value as of Vesting Date of Prior Year Equity Awards Vested in Covered Year |
|
|
|
|
|
|
|
|
|
| Pay vs Performance Disclosure |
|
|
|
|
|
|
|
|
|
| Adjustment to Compensation, Amount |
|
|
|
|
|
|
|
|
997,869
|
| PEO | David Gandler [Member] | Prior Year End Fair Value of Equity Awards Granted in Any Prior Year that Fail to Meet Applicable Vesting Conditions During Covered Year |
|
|
|
|
|
|
|
|
|
| Pay vs Performance Disclosure |
|
|
|
|
|
|
|
|
|
| Adjustment to Compensation, Amount |
|
|
|
|
|
|
|
|
0
|
| PEO | David Gandler [Member] | Dividends or Other Earnings Paid on Equity Awards not Otherwise Reflected in Total Compensation for Covered Year |
|
|
|
|
|
|
|
|
|
| Pay vs Performance Disclosure |
|
|
|
|
|
|
|
|
|
| Adjustment to Compensation, Amount |
|
|
|
|
|
|
|
|
0
|
| PEO | John Textor [Member] |
|
|
|
|
|
|
|
|
|
| Pay vs Performance Disclosure |
|
|
|
|
|
|
|
|
|
| Adjustment to Compensation, Amount |
|
|
|
|
|
|
|
|
0
|
| PEO | John Textor [Member] | Aggregate Grant Date Fair Value of Equity Award Amounts Reported in Summary Compensation Table |
|
|
|
|
|
|
|
|
|
| Pay vs Performance Disclosure |
|
|
|
|
|
|
|
|
|
| Adjustment to Compensation, Amount |
|
|
|
|
|
|
|
|
0
|
| PEO | John Textor [Member] | Year-end Fair Value of Equity Awards Granted in Covered Year that are Outstanding and Unvested |
|
|
|
|
|
|
|
|
|
| Pay vs Performance Disclosure |
|
|
|
|
|
|
|
|
|
| Adjustment to Compensation, Amount |
|
|
|
|
|
|
|
|
0
|
| PEO | John Textor [Member] | Year-over-Year Change in Fair Value of Equity Awards Granted in Prior Years That are Outstanding and Unvested |
|
|
|
|
|
|
|
|
|
| Pay vs Performance Disclosure |
|
|
|
|
|
|
|
|
|
| Adjustment to Compensation, Amount |
|
|
|
|
|
|
|
|
0
|
| PEO | John Textor [Member] | Vesting Date Fair Value of Equity Awards Granted and Vested in Covered Year |
|
|
|
|
|
|
|
|
|
| Pay vs Performance Disclosure |
|
|
|
|
|
|
|
|
|
| Adjustment to Compensation, Amount |
|
|
|
|
|
|
|
|
0
|
| PEO | John Textor [Member] | Change in Fair Value as of Vesting Date of Prior Year Equity Awards Vested in Covered Year |
|
|
|
|
|
|
|
|
|
| Pay vs Performance Disclosure |
|
|
|
|
|
|
|
|
|
| Adjustment to Compensation, Amount |
|
|
|
|
|
|
|
|
0
|
| PEO | John Textor [Member] | Prior Year End Fair Value of Equity Awards Granted in Any Prior Year that Fail to Meet Applicable Vesting Conditions During Covered Year |
|
|
|
|
|
|
|
|
|
| Pay vs Performance Disclosure |
|
|
|
|
|
|
|
|
|
| Adjustment to Compensation, Amount |
|
|
|
|
|
|
|
|
0
|
| PEO | John Textor [Member] | Dividends or Other Earnings Paid on Equity Awards not Otherwise Reflected in Total Compensation for Covered Year |
|
|
|
|
|
|
|
|
|
| Pay vs Performance Disclosure |
|
|
|
|
|
|
|
|
|
| Adjustment to Compensation, Amount |
|
|
|
|
|
|
|
|
0
|
| Non-PEO NEO |
|
|
|
|
|
|
|
|
|
| Pay vs Performance Disclosure |
|
|
|
|
|
|
|
|
|
| Adjustment to Compensation, Amount |
|
4,560,005
|
|
|
(1,737,560)
|
906,409
|
(3,021,803)
|
(21,028,093)
|
9,499,063
|
| Non-PEO NEO | Aggregate Grant Date Fair Value of Equity Award Amounts Reported in Summary Compensation Table |
|
|
|
|
|
|
|
|
|
| Pay vs Performance Disclosure |
|
|
|
|
|
|
|
|
|
| Adjustment to Compensation, Amount |
|
(793,691)
|
|
|
(672,597)
|
(1,072,583)
|
(471,640)
|
(20,891,705)
|
(6,903,041)
|
| Non-PEO NEO | Year-end Fair Value of Equity Awards Granted in Covered Year that are Outstanding and Unvested |
|
|
|
|
|
|
|
|
|
| Pay vs Performance Disclosure |
|
|
|
|
|
|
|
|
|
| Adjustment to Compensation, Amount |
|
2,169,518
|
|
|
543,762
|
1,065,625
|
165,109
|
1,906,972
|
5,223,616
|
| Non-PEO NEO | Year-over-Year Change in Fair Value of Equity Awards Granted in Prior Years That are Outstanding and Unvested |
|
|
|
|
|
|
|
|
|
| Pay vs Performance Disclosure |
|
|
|
|
|
|
|
|
|
| Adjustment to Compensation, Amount |
|
3,184,178
|
|
|
(1,403,047)
|
765,017
|
(1,636,967)
|
(1,804,638)
|
465,567
|
| Non-PEO NEO | Vesting Date Fair Value of Equity Awards Granted and Vested in Covered Year |
|
|
|
|
|
|
|
|
|
| Pay vs Performance Disclosure |
|
|
|
|
|
|
|
|
|
| Adjustment to Compensation, Amount |
|
0
|
|
|
0
|
0
|
0
|
0
|
10,636,742
|
| Non-PEO NEO | Change in Fair Value as of Vesting Date of Prior Year Equity Awards Vested in Covered Year |
|
|
|
|
|
|
|
|
|
| Pay vs Performance Disclosure |
|
|
|
|
|
|
|
|
|
| Adjustment to Compensation, Amount |
|
0
|
|
|
(205,679)
|
148,350
|
(914,821)
|
(238,722)
|
76,179
|
| Non-PEO NEO | Prior Year End Fair Value of Equity Awards Granted in Any Prior Year that Fail to Meet Applicable Vesting Conditions During Covered Year |
|
|
|
|
|
|
|
|
|
| Pay vs Performance Disclosure |
|
|
|
|
|
|
|
|
|
| Adjustment to Compensation, Amount |
|
0
|
|
|
0
|
0
|
(611,214)
|
0
|
0
|
| Non-PEO NEO | Dividends or Other Earnings Paid on Equity Awards not Otherwise Reflected in Total Compensation for Covered Year |
|
|
|
|
|
|
|
|
|
| Pay vs Performance Disclosure |
|
|
|
|
|
|
|
|
|
| Adjustment to Compensation, Amount |
|
$ 0
|
|
|
$ 0
|
$ 0
|
$ 447,730
|
$ 0
|
$ 0
|