Shareholder Report |
6 Months Ended | |||||||||||||||||||||||
|---|---|---|---|---|---|---|---|---|---|---|---|---|---|---|---|---|---|---|---|---|---|---|---|---|
|
Mar. 31, 2026
USD ($)
Holdings
| ||||||||||||||||||||||||
| Shareholder Report [Line Items] | ||||||||||||||||||||||||
| Document Type | N-CSRS | |||||||||||||||||||||||
| Amendment Flag | false | |||||||||||||||||||||||
| Registrant Name | Tidal Trust I | |||||||||||||||||||||||
| Entity Central Index Key | 0001742912 | |||||||||||||||||||||||
| Entity Investment Company Type | N-1A | |||||||||||||||||||||||
| Document Period End Date | Mar. 31, 2026 | |||||||||||||||||||||||
| Shareholder Report Annual or Semi-Annual | semi-annual shareholder report | |||||||||||||||||||||||
| American Customer Satisfaction ETF | ||||||||||||||||||||||||
| Shareholder Report [Line Items] | ||||||||||||||||||||||||
| Fund Name | American Customer Satisfaction ETF | |||||||||||||||||||||||
| Class Name | American Customer Satisfaction ETF | |||||||||||||||||||||||
| Trading Symbol | ACSI | |||||||||||||||||||||||
| Security Exchange Name | CboeBZX | |||||||||||||||||||||||
| Annual or Semi-Annual Statement [Text Block] | This contains important information about the American Customer Satisfaction ETF (the "Fund") for the period October 1, 2025 to March 31, 2026. | |||||||||||||||||||||||
| Shareholder Report Annual or Semi-Annual | semi-annual shareholder report | |||||||||||||||||||||||
| Additional Information [Text Block] | You can find additional information about the Fund at www.acsietf.com/. You can also request this information by contacting us at (800) 617-0004 or by writing the Fund at American Customer Satisfaction ETF, c/o U.S. Bank Global Fund Services, P.O. Box 701, Milwaukee, Wisconsin 53201-0701. | |||||||||||||||||||||||
| Additional Information Phone Number | (800) 617-0004 | |||||||||||||||||||||||
| Additional Information Website | www.acsietf.com | |||||||||||||||||||||||
| Expenses [Text Block] | What were the Fund costs for the past six months? (based on a hypothetical $10,000 investment)
|
|||||||||||||||||||||||
| Expenses Paid, Amount | $ 32 | |||||||||||||||||||||||
| Expense Ratio, Percent | 0.65% | [1] | ||||||||||||||||||||||
| Net Assets | $ 100,084,000 | |||||||||||||||||||||||
| Holdings Count | Holdings | 34 | |||||||||||||||||||||||
| Advisory Fees Paid, Amount | $ 334,196 | |||||||||||||||||||||||
| Investment Company, Portfolio Turnover | 30.00% | |||||||||||||||||||||||
| Additional Fund Statistics [Text Block] | Key Fund Statistics (as of March 31, 2026)
|
|||||||||||||||||||||||
| Holdings [Text Block] | Sector Breakdown - Investments (% of total net assets) ![]() 
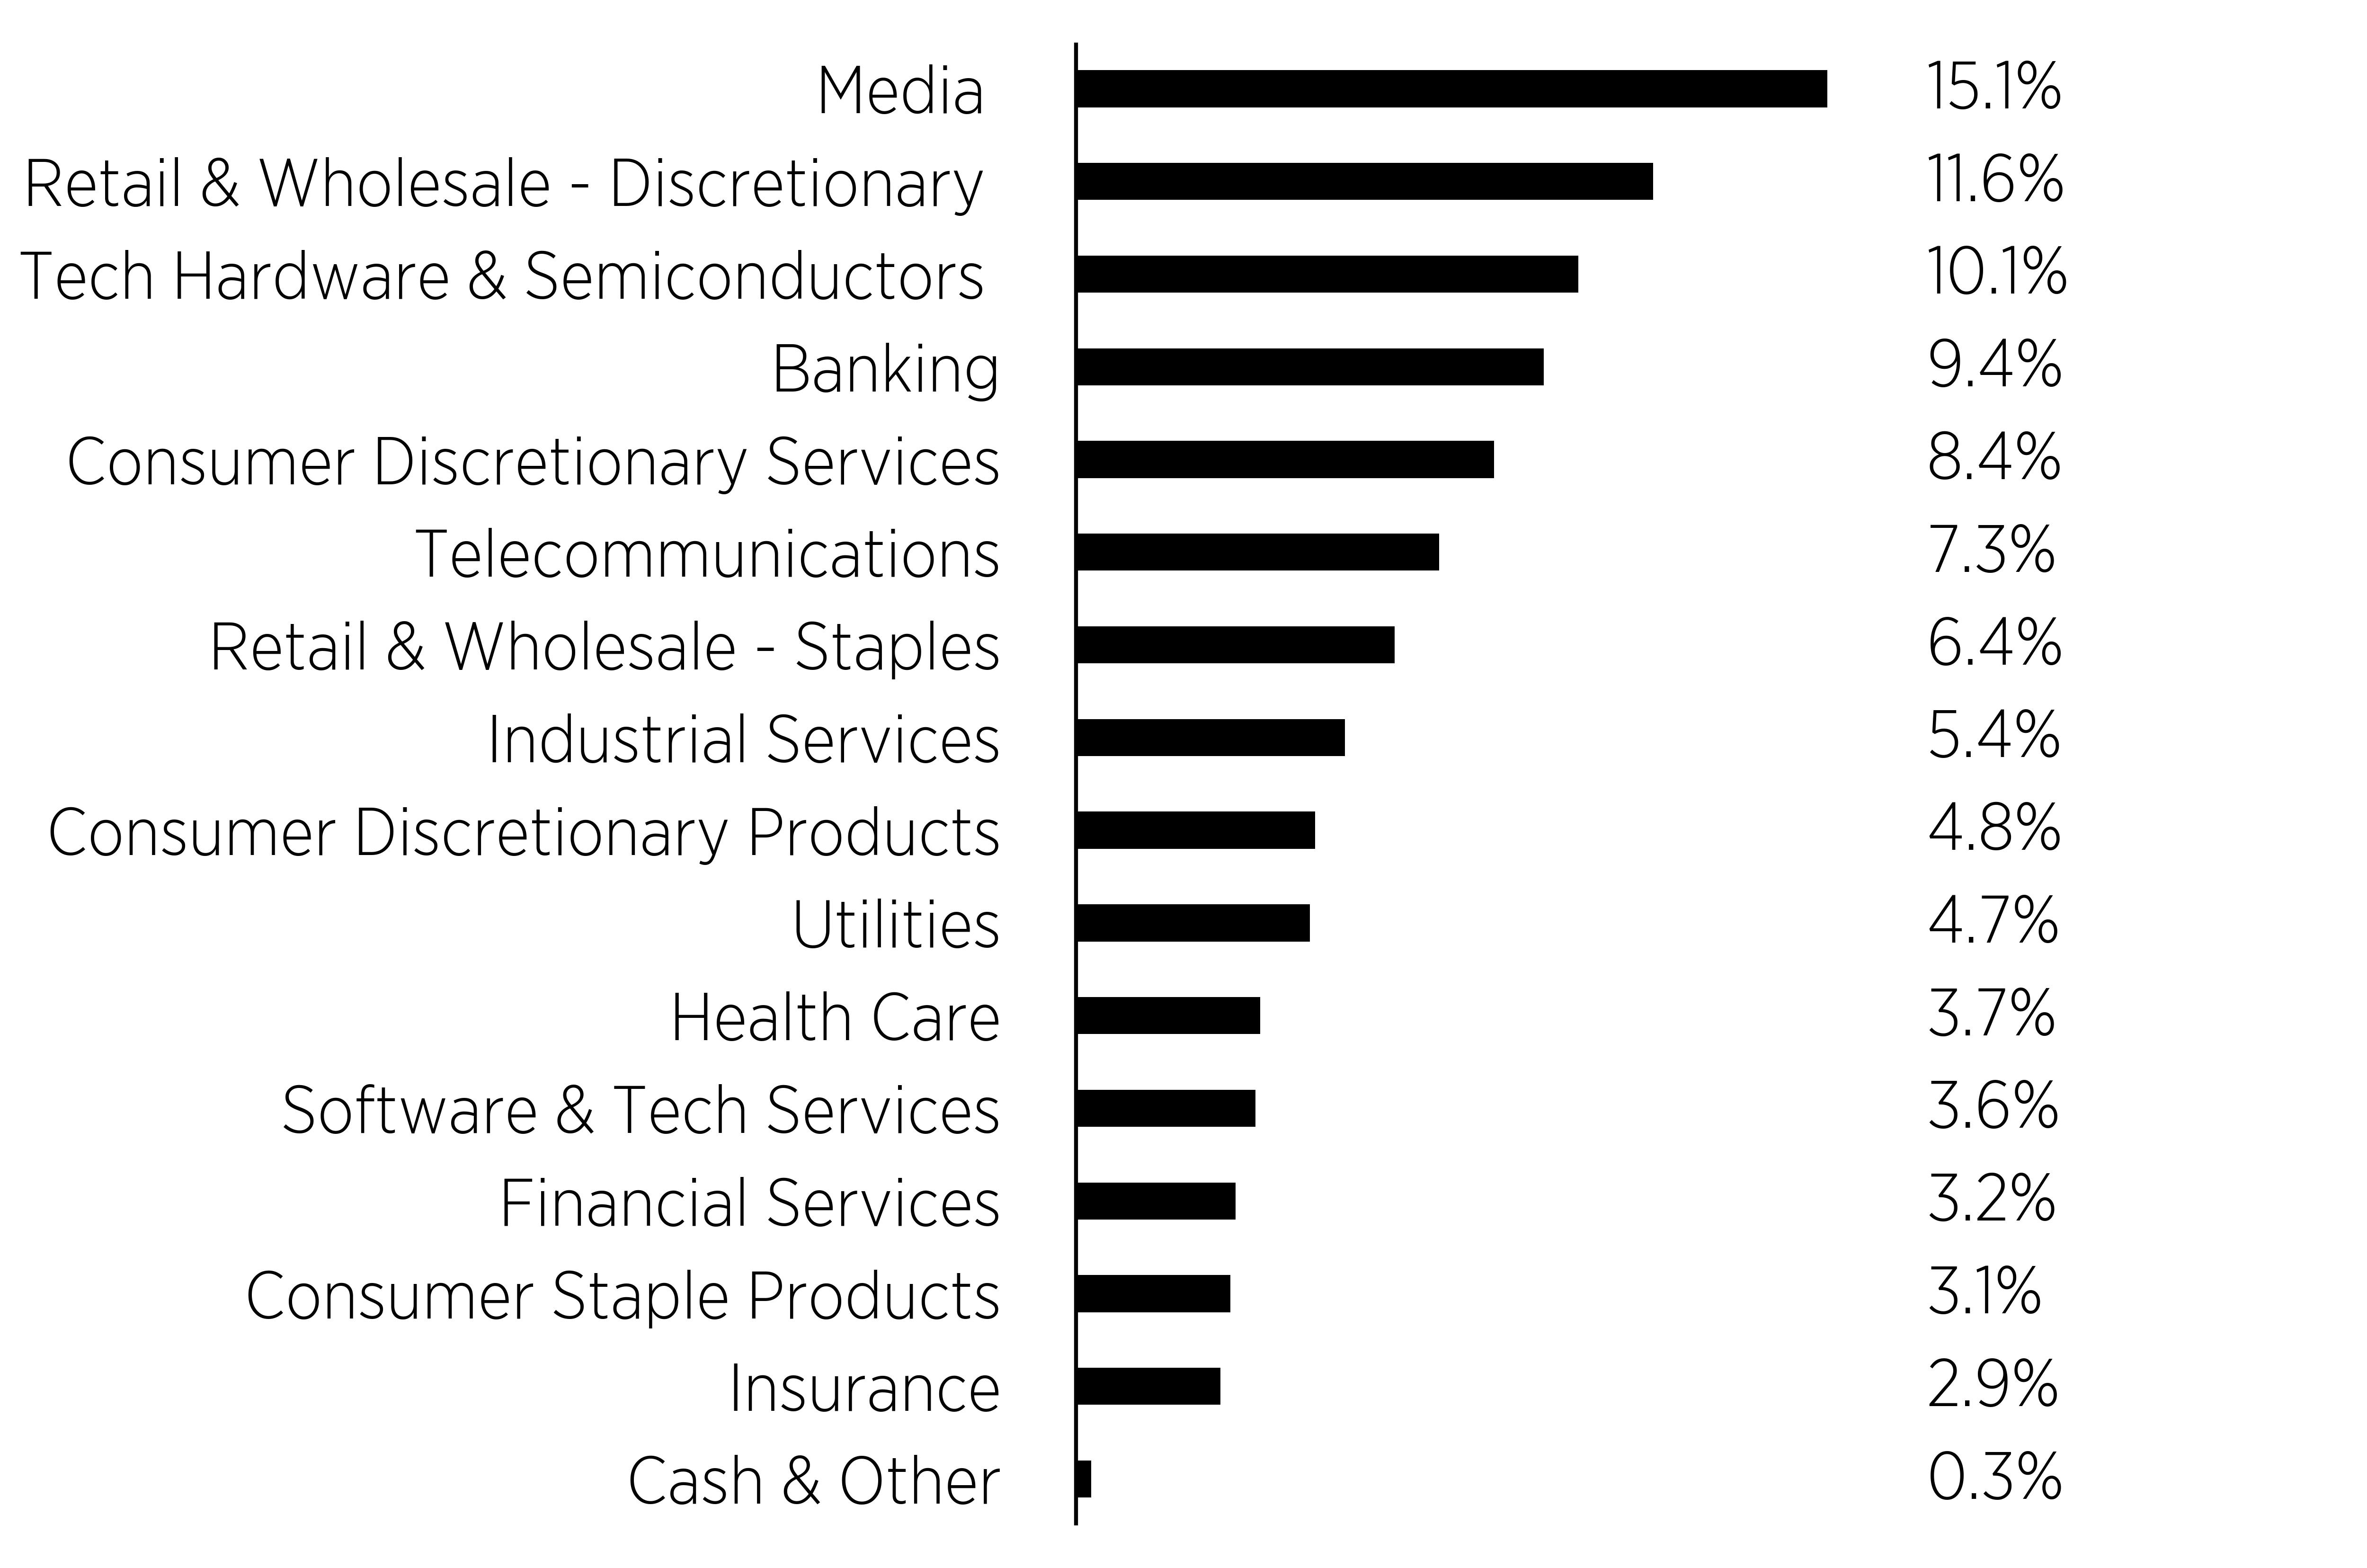
Percentages are based on total net assets. Cash & Other represents cash, short-term investments and other assets in excess of liabilities. |
|||||||||||||||||||||||
| Largest Holdings [Text Block] | What did the Fund invest in? (as of March 31, 2026)
|
|||||||||||||||||||||||
| ||||||||||||||||||||||||