Exhibit 96.1
SEC Technical Report Summary
Sinda Project, Guanajuato, Mexico
Effective Date: November 24, 2025
Report Date: January 19, 2026
Report Prepared for
Sinda, LTD
Antiguo Camino a Don Diego S/N Fraccionamiento Mi Bendición,
Interior 6 San Miguel Allende, Guanajuato 37898 Mexico
Report Prepared by
SRK Consulting (U.S.), Inc.
999 Seventeenth Street, Suite 400
Denver, CO 80202
SRK Project Number: USPR002400
|
SRK Consulting (U.S.), Inc.
SEC Technical Report Summary – Sinda Project
|
Page ii
|
Table of Contents
|
1
|
Executive Summary
|
13
|
||
|
1.1
|
Property Description (Including Mineral Rights) and Ownership
|
13
|
||
|
1.2
|
Geology and Mineralization
|
13
|
||
|
1.3
|
Status of Exploration, Development, and Operations
|
13
|
||
|
1.4
|
Mineral Resources
|
14
|
||
|
1.5
|
Mineral Reserve Estimate
|
16
|
||
|
1.6
|
Mining Methods
|
16
|
||
|
1.7
|
Recovery Methods
|
16
|
||
|
1.8
|
Project Infrastructure
|
16
|
||
|
1.9
|
Environmental Studies and Permitting
|
17
|
||
|
1.10
|
Capital and Operating Costs
|
17
|
||
|
1.11
|
Economic Analysis
|
17
|
||
|
1.12
|
Conclusions and Recommendations
|
17
|
||
|
2
|
Introduction
|
19
|
||
|
2.1
|
Registrant for Whom the Technical Report Summary was Prepared
|
19
|
||
|
2.2
|
Terms of Reference and Purpose of the Report
|
19
|
||
|
|
2.2.1
|
Purpose of Report
|
19
|
|
|
2.3
|
Sources of Information
|
19
|
||
|
2.4
|
Details of Inspection
|
20
|
||
|
2.5
|
Report Version Update
|
20
|
||
|
3
|
Property Description
|
21
|
||
|
3.1
|
Property Location
|
21
|
||
|
3.2
|
Property Area
|
21
|
||
|
3.3
|
Mineral Title, Claim, Mineral Right, Lease, or Option Disclosure
|
22
|
||
|
|
3.3.1
|
Mineral Claims
|
22
|
|
|
|
3.3.2
|
Legal Surveys
|
24
|
|
|
|
3.3.3
|
Requirements to Maintain the Claims in Good Standing
|
24
|
|
|
|
3.3.4
|
Titles and Obligations/Agreements
|
24
|
|
|
3.4
|
Royalties or Other Encumbrances
|
25
|
||
|
|
3.4.1
|
Environmental Liabilities
|
26
|
|
|
|
3.4.2
|
Permits and Licenses
|
26
|
|
|
|
3.4.3
|
Other Significant Factors and Risks
|
26
|
|
|
4
|
Accessibility, Climate, Local Resources, Infrastructure, and Physiography
|
27
|
||
|
4.1
|
Topography, Elevation, and Vegetation
|
27
|
||
|
|
4.1.1
|
Vegetation
|
27
|
|
|
SRK Consulting (U.S.), Inc.
SEC Technical Report Summary – Sinda Project
|
Page iii
|
|
4.2
|
Means of Access
|
27
|
||
|
4.3
|
Climate and Length of Operating Season
|
27
|
||
|
4.4
|
Infrastructure Availability and Sources
|
28
|
||
|
|
4.4.1
|
Water
|
28
|
|
|
|
4.4.2
|
Electricity
|
28
|
|
|
|
4.4.3
|
Personnel and Supplies
|
28
|
|
|
5
|
History
|
29
|
||
|
5.1
|
Previous Operations
|
29
|
||
|
5.2
|
Exploration and Development of Previous Owners or Operators
|
29
|
||
|
|
5.2.1
|
Historic Mineral Resource and Reserve Estimates
|
29
|
|
|
6
|
Geological Setting, Mineralization, and Deposit
|
31
|
||
|
6.1
|
Regional, Local, and Property Geology
|
31
|
||
|
|
6.1.1
|
Regional Geology
|
31
|
|
|
|
6.1.2
|
Local Geology
|
33
|
|
|
6.2
|
Property Geology
|
33
|
||
|
6.3
|
Mineral Deposit
|
36
|
||
|
|
6.3.1
|
Mineralization Style
|
36
|
|
|
6.4
|
Stratigraphic Column and Local Geology Cross-Section
|
37
|
||
|
7
|
Exploration
|
41
|
||
|
7.1
|
Exploration Work (Other Than Drilling)
|
41
|
||
|
|
7.1.1
|
Procedures and Parameters Relating to the Surveys and Investigations
|
41
|
|
|
|
7.1.2
|
Sampling Methods and Sample Quality
|
41
|
|
|
|
7.1.3
|
Information About the Area Covered
|
41
|
|
|
|
7.1.4
|
Significant Results and Interpretation
|
41
|
|
|
7.2
|
Exploration Drilling
|
42
|
||
|
|
7.2.1
|
Drilling Type and Extent
|
46
|
|
|
|
7.2.2
|
Collar Location Survey
|
47
|
|
|
|
7.2.3
|
Topographic Survey
|
47
|
|
|
|
7.2.4
|
Downhole Survey
|
48
|
|
|
|
7.2.5
|
Core Sampling
|
48
|
|
|
|
7.2.6
|
Drilling, Sampling, or Recovery Factors
|
52
|
|
|
|
7.2.7
|
Drilling Results and Interpretation
|
52
|
|
|
7.3
|
Exploration Potential
|
53
|
||
|
7.4
|
Hydrogeology
|
55
|
||
|
7.5
|
Geotechnical Data, Testing and Analysis
|
56
|
||
|
8
|
Sample Preparation, Analysis, and Security
|
58
|
||
|
8.1
|
Sample Preparation Methods and Quality Control Measures
|
58
|
||
|
SRK Consulting (U.S.), Inc.
SEC Technical Report Summary – Sinda Project
|
Page iv
|
|
8.2
|
Laboratories
|
59
|
||
|
8.3
|
Analytical Procedures
|
60
|
||
|
|
8.3.1
|
Gold Fire Assay (Au-AA23)
|
60
|
|
|
|
8.3.2
|
Multi-Element Four Acid Digestion with ICP-MS Finish (ME-ICP61)
|
60
|
|
|
|
8.3.3
|
Fire Assay with Gravimetric Finish (ME-GRA21)
|
61
|
|
|
|
8.3.4
|
Multi-Element Four Acid Digestion with ICP-AES (ME-OG62)
|
61
|
|
|
|
8.3.5
|
Precious Metals in Concentrate (Ag-CON01 and Au-CON01)
|
62
|
|
|
8.4
|
Quality Control Procedures/Quality Assurance
|
62
|
||
|
|
8.4.1
|
Standards
|
63
|
|
| |
8.4.2
|
Blanks
|
77
|
|
| |
8.4.3
|
Duplicates
|
84
|
|
|
|
8.4.4
|
Wedge Drilling
|
89
|
|
|
|
8.4.5
|
External Check Assays
|
93
|
|
|
|
8.4.6
|
Re-Analysis Program
|
94
|
|
|
|
8.4.7
|
Actions
|
103
|
|
|
|
8.4.8
|
Sample Security
|
104
|
|
|
|
8.4.9
|
International Organization for Standardization 9000 Certification
|
104
|
|
|
8.5
|
Opinion on Adequacy
|
104
|
||
|
9
|
Data Verification
|
105
|
||
|
9.1
|
Data Verification Procedures
|
105
|
||
|
|
9.1.1
|
Site Verification
|
105
|
|
|
|
9.1.2
|
Discussions on Geological Attributes
|
105
|
|
|
|
9.1.3
|
Examination of Drill Holes
|
105
|
|
|
|
9.1.4
|
Sampling Techniques and Data Collection
|
106
|
|
|
|
9.1.5
|
Database Verification
|
106
|
|
|
9.1.6
|
Verifications of Analytical Quality Control Data
|
107
|
||
|
9.2
|
Limitations
|
108
|
||
|
9.3
|
Opinion on Data Adequacy
|
108
|
||
|
10
|
Mineral Processing and Metallurgical Testing
|
109
|
||
|
10.1
|
Testing and Procedures
|
109
|
||
|
|
10.1.1
|
Test Composites and Head Analyses
|
109
|
|
|
|
10.1.2
|
Mineralogy
|
110
|
|
|
|
10.1.3
|
Comminution
|
112
|
|
|
10.2
|
Sample Representativeness
|
112
|
||
|
10.3
|
Laboratories
|
113
|
||
|
10.4
|
Relevant Results
|
113
|
||
|
|
10.4.1
|
Flotation: Master Composite
|
113
|
|
|
SRK Consulting (U.S.), Inc.
SEC Technical Report Summary – Sinda Project
|
Page v
|
|
|
10.4.2
|
Flotation: Variability Composites
|
119
|
|
|
|
10.4.3
|
Concentrate Quality
|
121
|
|
|
|
10.4.4
|
Cyanidation Test Work
|
121
|
|
|
|
10.4.5
|
Process Alternative Comparison
|
123
|
|
|
10.5
|
Adequacy of Mineral Processing and Metallurgical Testing
|
123
|
||
|
11
|
Mineral Resource Estimation
|
124
|
||
|
11.1
|
Key Assumptions, Parameters, and Methods Used
|
124
|
||
|
|
11.1.1
|
Drill Hole Database
|
124
|
|
|
|
11.1.2
|
Geologic Model
|
125
|
|
|
11.2
|
Assay Capping and Compositing
|
136
|
||
|
|
11.2.1
|
Compositing
|
136
|
|
|
|
11.2.2
|
Outlier Capping
|
141
|
|
|
11.3
|
Exploratory Data Analysis
|
145
|
||
|
11.4
|
Bulk Density
|
153
|
||
|
11.5
|
Variogram Analysis and Modeling
|
154
|
||
|
11.6
|
Block Model
|
154
|
||
|
11.7
|
Mineral Resources Estimates
|
161
|
||
|
|
11.7.1
|
Estimation Parameters
|
161
|
|
|
|
11.7.2
|
Post-Estimation Scripting
|
163
|
|
|
|
11.7.3
|
Estimation Summary
|
163
|
|
|
11.8
|
Resource Classification and Criteria
|
163
|
||
|
11.9
|
Mineral Resource Statement
|
168
|
||
|
11.10
|
Reasonable Prospects for Economic Extraction (RPEE)
|
169
|
||
|
|
11.10.1
|
Cut-off Grade Estimates
|
169
|
|
|
11.11
|
Mineral Resource Sensitivity
|
170
|
||
|
11.12
|
Comparison with Previous Estimate
|
175
|
||
|
11.13
|
Exploration Potential
|
175
|
||
|
11.14
|
Uncertainty
|
175
|
||
|
12
|
Mineral Reserve Estimates
|
177
|
||
|
13
|
Mining Methods
|
178
|
||
|
14
|
Processing and Recovery Methods
|
179
|
||
|
15
|
Infrastructure
|
180
|
||
|
16
|
Market Studies
|
181
|
||
|
17
|
Environmental Studies, Permitting, and Plans, Negotiations, or Agreements with Local Individuals or Groups
|
182
|
||
|
17.1
|
Existing Permits and Authorizations
|
182
|
||
|
17.2
|
Land Status
|
184
|
||
|
SRK Consulting (U.S.), Inc.
SEC Technical Report Summary – Sinda Project
|
Page vi
|
|
17.3
|
Environmental Regulatory Framework
|
184
|
||
|
|
17.3.1
|
General Environmental Laws and Regulations
|
184
|
|
|
|
17.3.2
|
Mexico Mining Law and Mining Reform
|
185
|
|
|
|
17.3.3
|
Expropriations
|
189
|
|
|
17.4
|
Environmental Study Results
|
190
|
||
|
17.5
|
Environmental Issues
|
190
|
||
|
17.6
|
Social and Community
|
190
|
||
|
18
|
Capital and Operating Costs
|
192
|
||
|
19
|
Economic Analysis
|
193
|
||
|
20
|
Adjacent Properties
|
194
|
||
|
21
|
Other Relevant Data and Information
|
195
|
||
|
22
|
Interpretation and Conclusions
|
196
|
||
|
22.1
|
Exploration
|
196
|
||
|
22.2
|
Mineral Resource Estimate
|
197
|
||
|
22.3
|
Metallurgy and Processing
|
197
|
||
|
23
|
Recommendations
|
199
|
||
|
23.1
|
Recommended Work Programs
|
199
|
||
|
23.2
|
Exploration and Geology
|
199
|
||
|
23.3
|
Mineral Processing and Metallurgical Testing
|
200
|
||
|
23.4
|
Geotechnical
|
200
|
||
|
23.5
|
Environmental Studies and Permitting
|
201
|
||
|
23.6
|
Hydrogeology
|
201
|
||
|
24
|
References
|
203
|
||
|
25
|
Reliance on Information Provided by the Registrant
|
204
|
||
List of Tables
|
Table 1‑1: Sinda Underground (U/G) Mineral Resource Estimate at 150 g/t AgEq Cut-off Grade as of November 24, 2025 – SRK Consulting (U.S.), Inc.
|
16
|
|
Table 2‑1: Site Visit Participants
|
20
|
|
Table 3‑1: Exploration Concession Summary
|
22
|
|
Table 5‑1: Sinda Underground (U/G) Mineral Resource Estimate at 200 g/t AgEq Cut-off Grade as of June 24, 2021 – SRK Consulting (U.S.), Inc.
|
29
|
|
Table 5‑2: Sinda Underground (U/G) Mineral Resource Estimate at 200 g/t AgEq Cut-off Grade as of February 16, 2023 – SRK Consulting (U.S.), Inc.
|
30
|
|
Table 7‑1: Summary of Drill Holes by Campaign Year and Core Diameter Drilled
|
46
|
|
Table 7‑2: Summary of Raw Assay Intervals for Significant Intercepts at Sinda
|
53
|
|
SRK Consulting (U.S.), Inc.
SEC Technical Report Summary – Sinda Project
|
Page vii
|
|
Table 7‑3: Examples of Significant Raw Assay Intervals within Exploration Target Areas
|
55
|
|
Table 8‑1: Au-AA23 Method Detection Limits
|
60
|
|
Table 8‑2: ME-ICP61 Method Detection Limits
|
61
|
|
Table 8‑3: ME-GRA21 Method Detection Limits
|
61
|
|
Table 8‑4: ME-OG62 Method Detection Limits
|
62
|
|
Table 8‑5: Ag-CON01 and Au-CON01 Method Detection Limits
|
62
|
|
Table 8‑6: Summary of QA/QC Standards
|
63
|
|
Table 8‑7: Summary of QA/QC Blank Samples
|
77
|
|
Table 8‑8: Summary of QA/QC Duplicate Samples
|
84
|
|
Table 8‑9: Summary of Duplicate Results, >10 ppm Ag
|
84
|
|
Table 8‑10: Summary of Duplicate Results, >0.1 ppm Au
|
84
|
|
Table 8‑11: Summary of QA/QC Standards for Re-Analysis Samples
|
94
|
|
Table 8‑12: Summary of QA/QC Blank Samples for Re-Analysis Samples
|
95
|
|
Table 10‑1: Head Assays and Master Composite (MC) Recipe
|
109
|
|
Table 10‑2: Detailed Head Analyses for Master Composite and Variability Composites
|
110
|
|
Table 10‑3: Silver Deportment Study (all values are %)
|
111
|
|
Table 10‑4: Gold Deportment Study
|
111
|
|
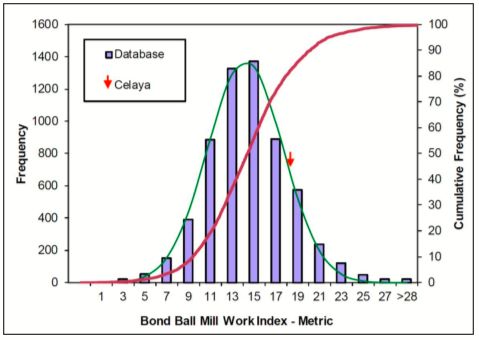
Table 10‑5: Summary of Bond Ball Mill Work Index Determination on the Master Composite
|
112
|
|
Table 10‑6: Grind Size vs. Rougher Flotation Recovery: Master Composite
|
113
|
|
Table 10‑7: Rougher Flotation Reagent Evaluation on Master Composite (Grind: P80 75 µm)
|
114
|
|
Table 10‑8: Rougher + Cleaner-1 Flotation With and Without Rougher Concentrate Regrind: Master Composite
|
116
|
|
Table 10‑9: Summary of Duplicate Rougher + Regrind + Three-Stage Cleaner Flotation Tests: Master Composite
|
118
|
|
Table 10‑10: Summary of Variability Composite Rougher + Cleaner Flotation Tests
|
120
|
|
Table 10‑11: Detailed Analyses on Cleaner-3 Flotation Concentrates
|
121
|
|
Table 10‑12: Cyanidation Results on Master Composite Feed
|
122
|
|
Table 10‑13: Cyanidation Results on Master Composite Concentrate
|
122
|
|
Table 10‑14: Process Option Recovery Evaluation
|
123
|
|
Table 11‑1: Summary of Sinda Wireframes in Caracol Area
|
127
|
|
Table 11‑2: Summary of Sinda Wireframes in Caracol and Agaves
|
128
|
|
Table 11‑3: Summary of Unsampled Drill Holes Crossing Sinda Wireframes
|
135
|
|
Table 11‑4: Summary of Drill Hole Composite Lengths, Inside Wireframes
|
136
|
|
Table 11‑5: Example of Statistical Capping Analysis for Ag (g/t), Dolores/Santiago
|
142
|
|
Table 11‑6: Example of Statistical Capping Analysis for Au (g/t), Dolores/Santiago
|
142
|
|
Table 11‑7: Applied Sample Capping Levels
|
145
|
|
Table 11‑8: Summary of Uncapped and Capped Samples, Within Domains and All Data
|
145
|
|
Table 11‑9: Descriptive Univariate Statistics for Ag (g/t) in Capped Composited Data in Caracol
|
146
|
|
SRK Consulting (U.S.), Inc.
SEC Technical Report Summary – Sinda Project
|
Page viii
|
|
Table 11‑10: Descriptive Univariate Statistics for Au (g/t) in Capped Composited Data in Caracol
|
147
|
|
Table 11‑11: Descriptive Univariate Statistics for Ag (g/t) in Capped Composited Data in Adriana and Agaves Domains
|
148
|
|
Table 11‑12: Descriptive Univariate Statistics for Au (g/t) in Capped Composited Data in Adriana and Agaves Domain
|
149
|
|
Table 11‑13: Summary Descriptive Univariate Statistics for Sampled Data Outside of Current Estimation Domains
|
153
|
|
Table 11‑14: Block Model Specific Gravity Statistics
|
154
|
|
Table 11‑15: Summary Block Model Parameters – Caracol
|
155
|
|
Table 11‑16: Summary Block Model Parameters – Agaves
|
155
|
|
Table 11‑17: Volume Comparisons Between Wireframes and Block Models – Caracol
|
159
|
|
Table 11‑18: Volume Comparisons Between Wireframes and Block Models – Agaves
|
160
|
|
Table 11‑19: Estimation Parameters for Sinda Mineral Resources
|
162
|
|
Table 11‑20: Classification Summary by Domain
|
164
|
|
Table 11‑21: Sinda Underground (U/G) Mineral Resource Estimate at 150 g/t AgEq Cut-off Grade as of November 24, 2025 – SRK Consulting (U.S.), Inc.
|
168
|
|
Table 11‑22: Grade Tonnage Table of Indicated Material – Dolores
|
170
|
|
Table 11‑23: Grade Tonnage Table of Inferred Material – Dolores / Santiago
|
171
|
|
Table 11‑24: Grade Tonnage Table of Inferred Material – Lara
|
171
|
|
Table 11‑25: Grade Tonnage Table of Inferred Material – Morita / Adriana
|
171
|
|
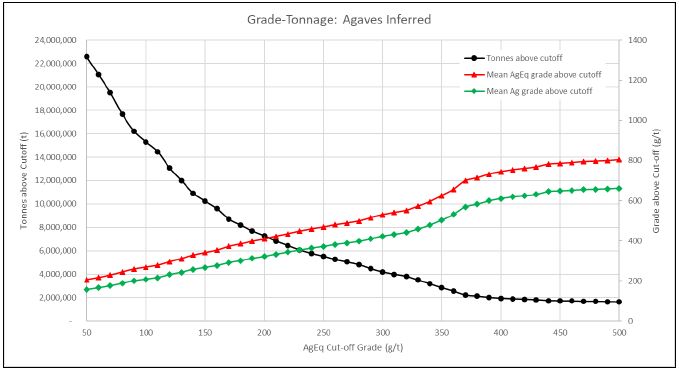
Table 11‑26: Grade Tonnage Table of Inferred Material – Agaves
|
172
|
|
Table 17‑1: Mineral Concessions Summary
|
184
|
|
Table 23‑1: Summary of Costs for Recommended Work
|
202
|
|
Table 25‑1: Reliance on Information Provided by the Registrant
|
204
|
List of Figures
|
Figure 3‑1: Location Map with Proximity to Major Silver Districts
|
21
|
|
Figure 3‑2: Land Tenure Map
|
23
|
|
Figure 4‑1: Weather by Month for Celaya, Guanajuato, Mexico
|
28
|
|
Figure 6‑1: Regional Geology Map
|
32
|
|
Figure 6‑2: Local Geology Map
|
34
|
|
Figure 6‑3: Sinda Vein Examples
|
35
|
|
Figure 6‑4: Generalized Geologic Map
|
38
|
|
Figure 6‑5: Local Geological Cross-Section at Caracol, Looking Northwest
|
39
|
|
Figure 6‑6: Stratigraphic Column
|
40
|
|
Figure 7‑1: Location Map of Drill Hole Collars
|
43
|
|
Figure 7‑2: Example Cross-Section (A-A') of Drill Holes
|
44
|
|
Figure 7‑3: Example Cross-Section (B-B') of Drill Holes
|
45
|
|
SRK Consulting (U.S.), Inc.
SEC Technical Report Summary – Sinda Project
|
Page ix
|
|
Figure 7‑4: Core Drilling Platform Example
|
47
|
|
Figure 7‑5: Drill Core Sampling
|
50
|
|
Figure 7‑6: Drill Core Storage
|
51
|
|
Figure 8‑1: Sample Preparation Flowsheet
|
59
|
|
Figure 8‑2: A1 Standard Results
|
64
|
|
Figure 8‑3: A2 Standard Results
|
65
|
|
Figure 8‑4: A3 Standard Results
|
66
|
|
Figure 8‑5: AA Standard Results
|
67
|
|
Figure 8‑6: AA2 Standard Results
|
68
|
|
Figure 8‑7: AB1 Standard Results
|
69
|
|
Figure 8‑8: AB2 Standard Results
|
70
|
|
Figure 8‑9: AB3 Standard Results
|
71
|
|
Figure 8‑10: AB4 Standard Results
|
72
|
|
Figure 8‑11: AM Standard Results
|
73
|
|
Figure 8‑12: AM2 Standard Results
|
74
|
|
Figure 8‑13: AM3 Standard Results
|
75
|
|
Figure 8‑14: AM4 Standard Results
|
76
|
|
Figure 8‑15: C1 Fine Blank Results
|
78
|
|
Figure 8‑16: C2 Fine Blank Results
|
79
|
|
Figure 8‑17: C3 Coarse Blank Results
|
80
|
|
Figure 8‑18: C4 Coarse Blank Results
|
81
|
|
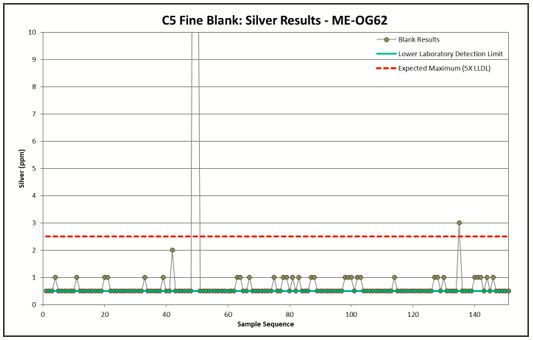
Figure 8‑19: C5 Fine Blank Results
|
82
|
|
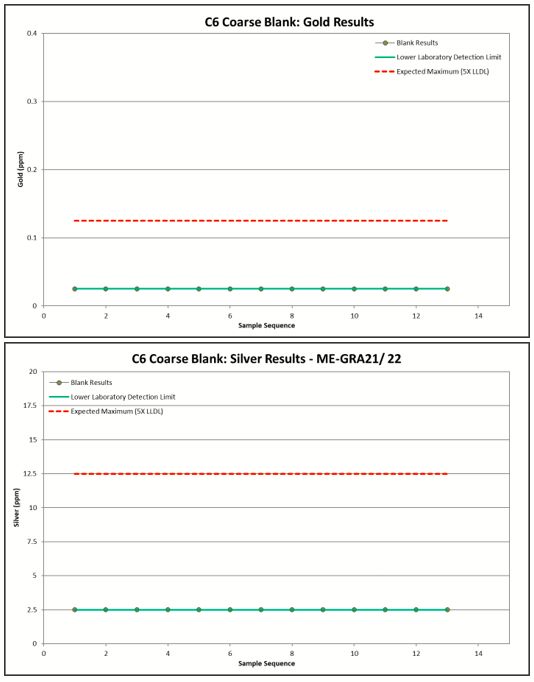
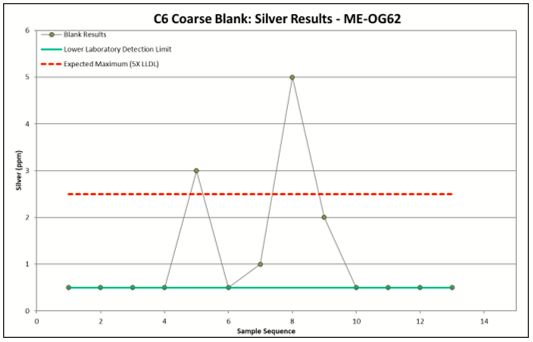
Figure 8‑20: C6 Coarse Blank Results
|
83
|
|
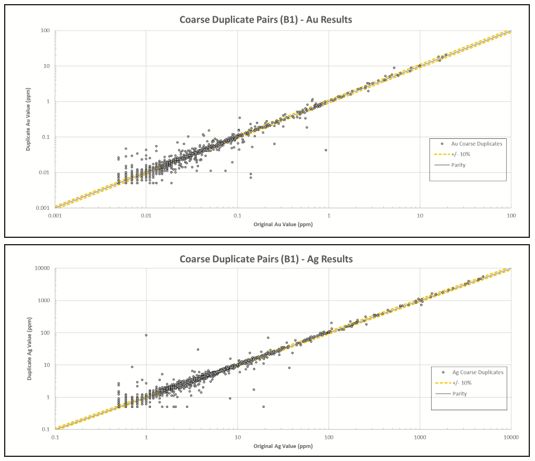
Figure 8‑21: Summary of Coarse Duplicate (B1) Results
|
86
|
|
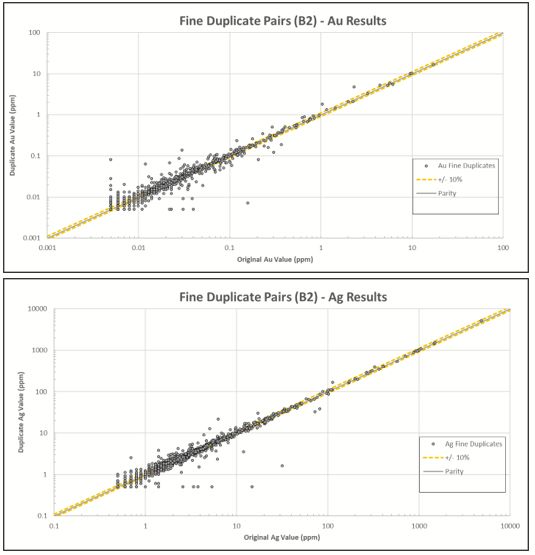
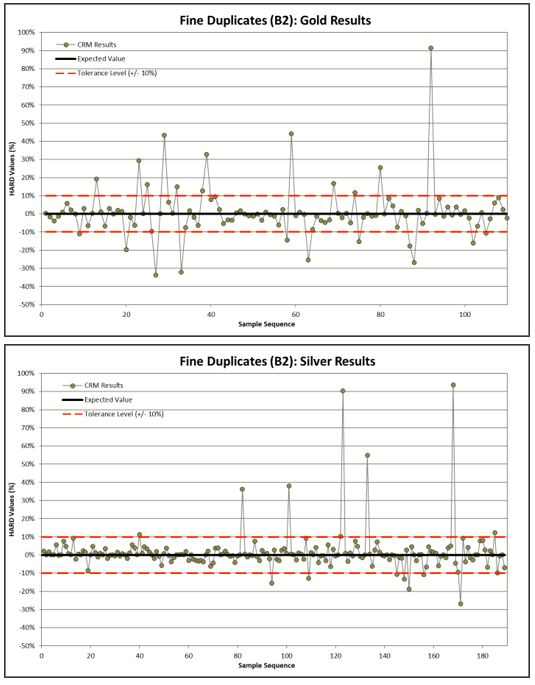
Figure 8‑22: Summary of Fine Duplicate (B2) Results
|
87
|
|
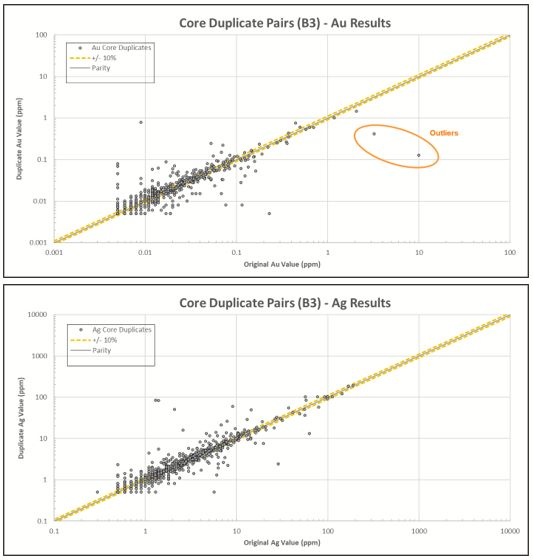
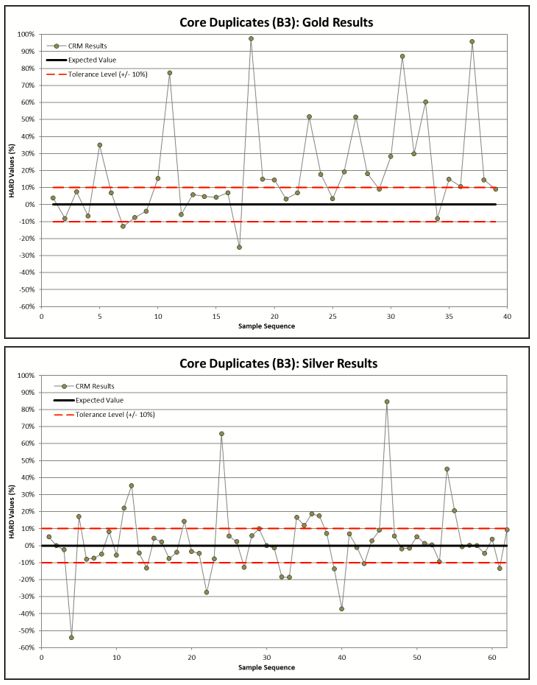
Figure 8‑23: Summary of Quarter Core Duplicate (B3) Results
|
88
|
|
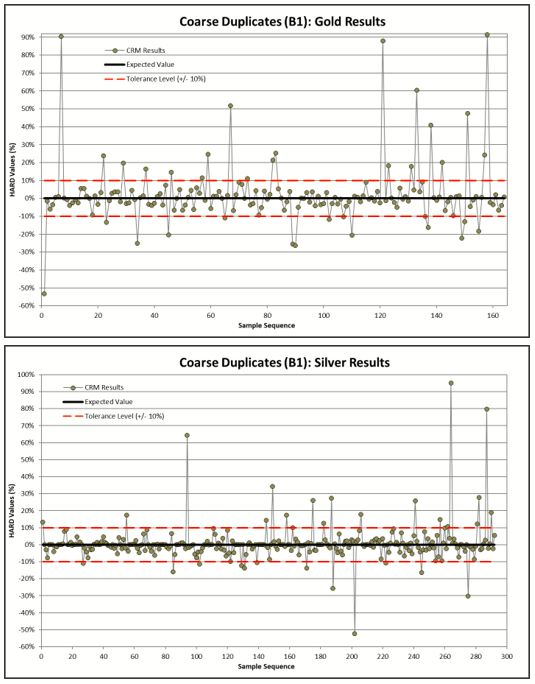
Figure 8‑24: HARD Values for Coarse Duplicate (B1) Results
|
90
|
|
Figure 8‑25: HARD Values for Fine Duplicate (B2) Results
|
91
|
|
Figure 8‑26: HARD Values for Quarter Core Duplicate (B3) Results
|
92
|
|
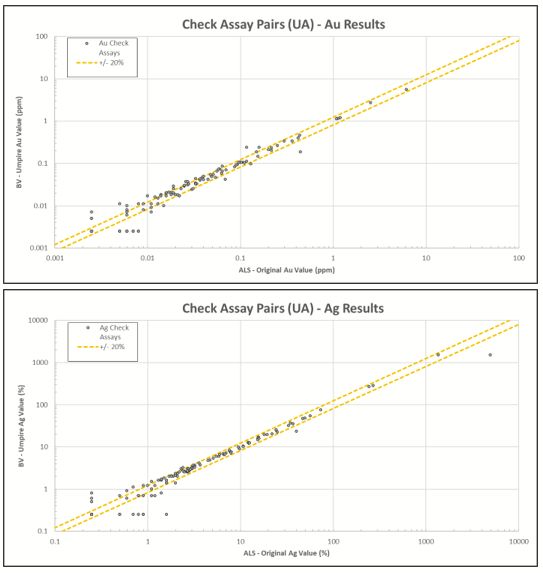
Figure 8‑27: Summary of Check Assay (UA) Results
|
93
|
|
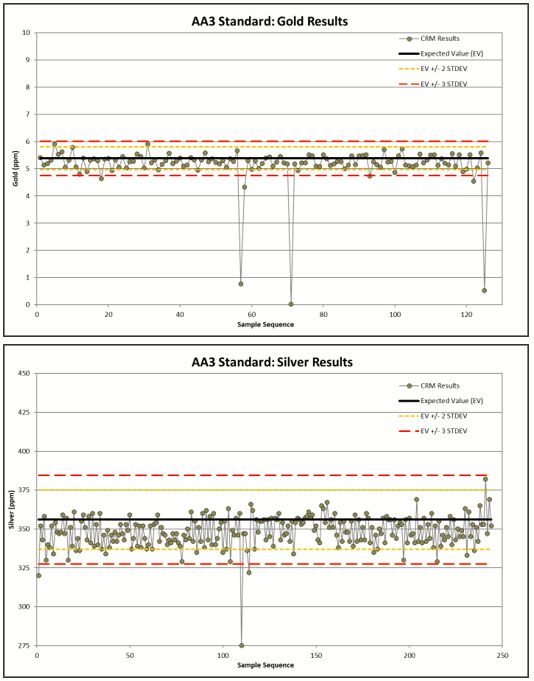
Figure 8‑28: AA3 Standard Results – Re-Analysis Samples
|
96
|
|
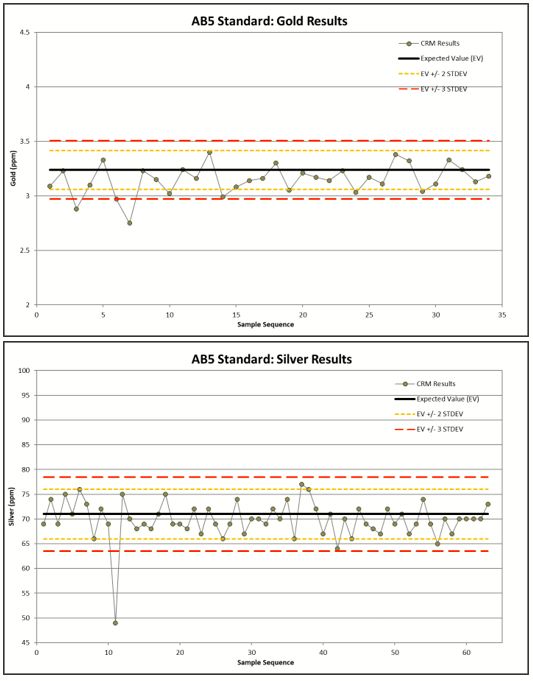
Figure 8‑29: AB5 Standard Results – Re-Analysis Samples
|
97
|
|
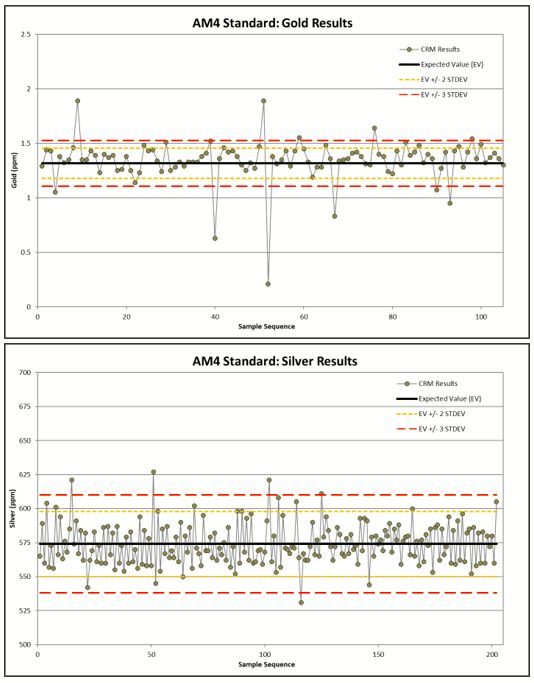
Figure 8‑30: AM4 Standard Results – Re-Analysis Samples
|
98
|
|
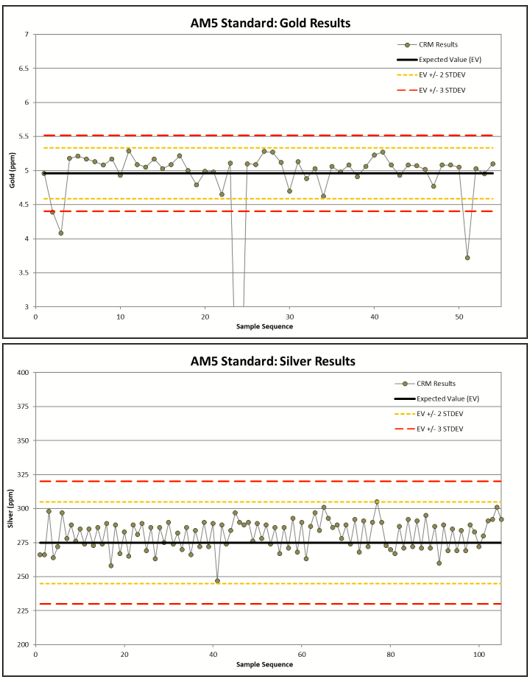
Figure 8‑31: AM5 Standard Results – Re-Analysis Samples
|
99
|
|
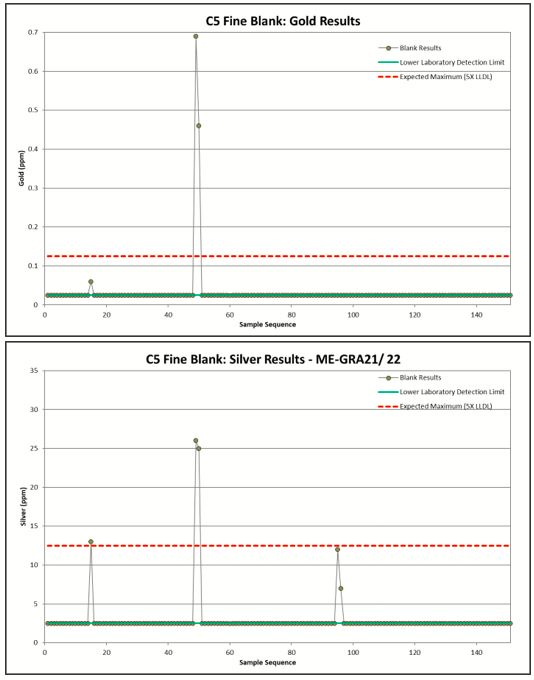
Figure 8‑32: C5 Fine Blank Results by ME-GRA21/ 22 – Re-Analysis Samples
|
100
|
|
Figure 8‑33: C6 Coarse Blank Results by ME-GRA21/ 22 – Re-Analysis Samples
|
101
|
|
Figure 8‑34: C5 Fine Blank Results by ME-OG62 – Re-Analysis Samples
|
102
|
|
SRK Consulting (U.S.), Inc.
SEC Technical Report Summary – Sinda Project
|
Page x
|
|
Figure 8‑35: C6 Coarse Blank Results by ME-OG62 – Re-Analysis Samples
|
103
|
|
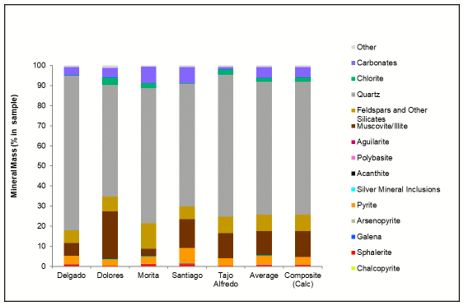
Figure 10‑1: Modal Mineralogy of Five Veins and Master Composite
|
111
|
|
Figure 10‑2: Hardness Frequency Profile for the Master Composite
|
112
|
|
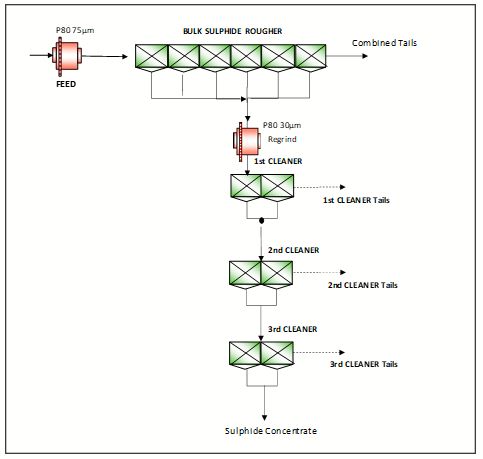
Figure 10‑3: Flotation Test Program Flowsheet
|
119
|
|
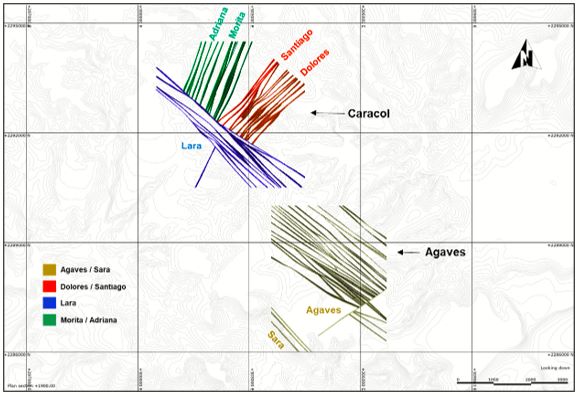
Figure 11‑1: Plan View of Sinda Geological Model Domains
|
129
|
|
Figure 11‑2: Plan View of Sinda Geological Model Domains – Caracol
|
130
|
|
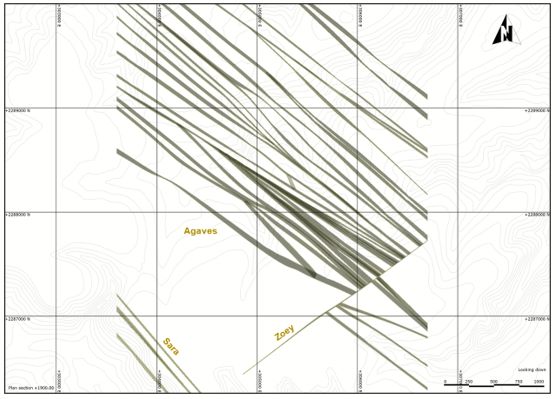
Figure 11‑3: Plan View of Sinda Geological Model Domains – Agaves
|
131
|
|
Figure 11‑4: Cross-Section of Caracol Geological Domains, Looking Northeast
|
132
|
|
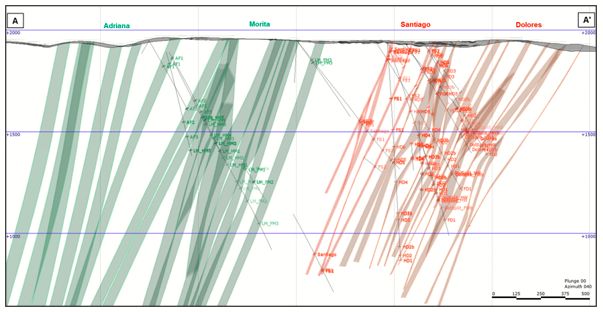
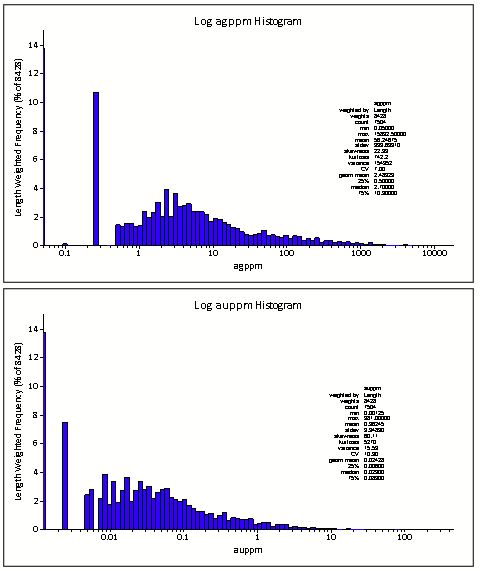
Figure 11‑5: Histogram Plots of Ag and Au, Raw Sampled Data
|
137
|
|
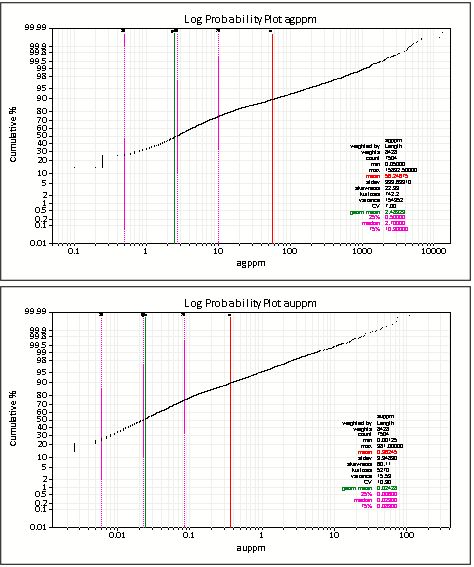
Figure 11‑6: Cumulative Probability Plots of Ag and Au, Raw Sampled Data
|
138
|
|
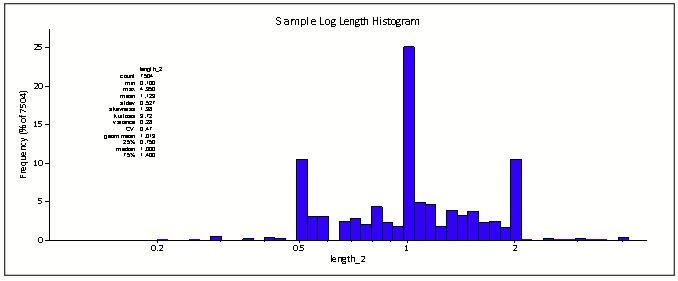
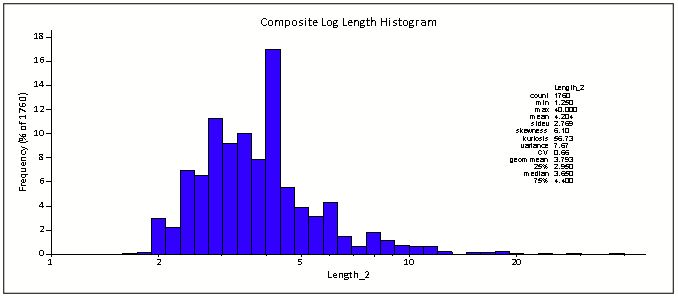
Figure 11‑7: Histogram Plot of Drill Hole Sample Length, Un-composited, All Data
|
139
|
|
Figure 11‑8: Histogram Plot of Length After Vein Width Compositing, Inside Wireframes and All Data
|
140
|
|
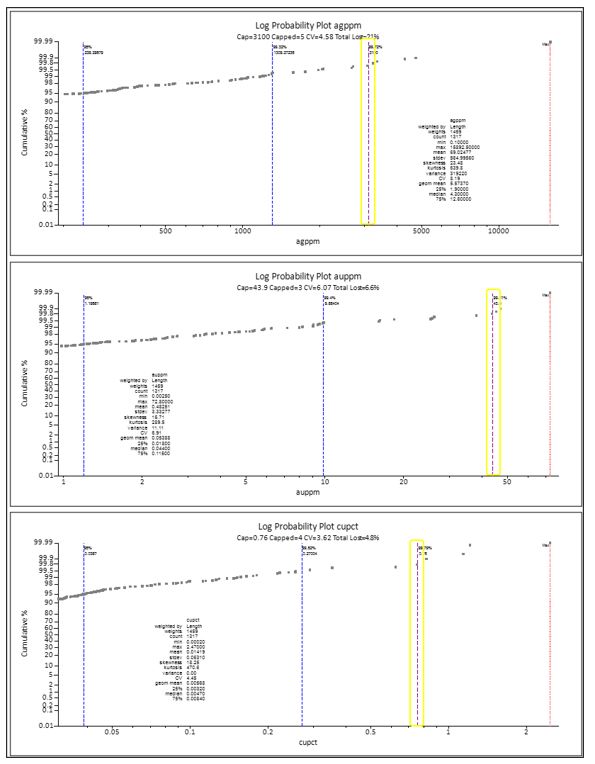
Figure 11‑9: Log Probability Plot Capping Analysis for Ag, Au, and Cu in Dolores/Santiago
|
143
|
|
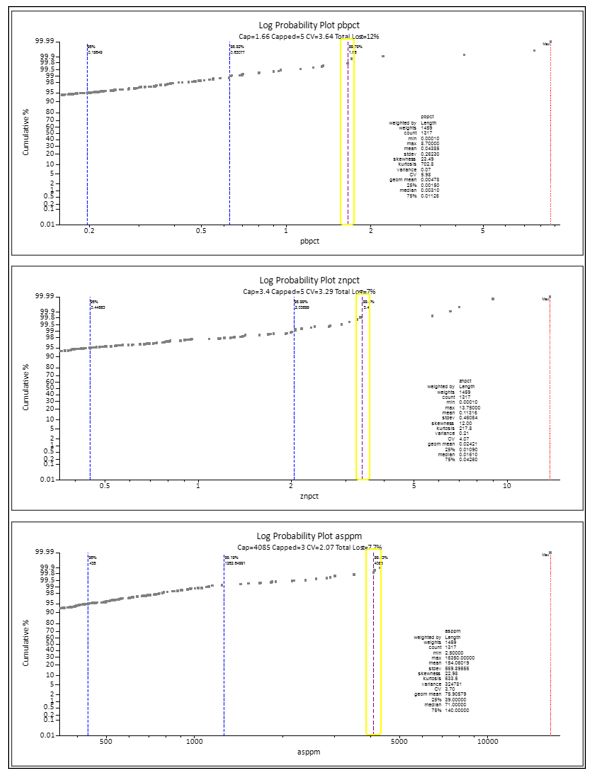
Figure 11‑10: Log Probability Plot Capping Analysis for Pb, Zn, and As in Dolores/Santiago
|
144
|
|
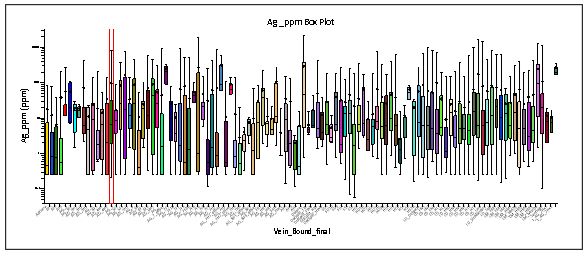
Figure 11‑11: Box and Whisker Plots for Ag by Domain
|
150
|
|
Figure 11‑12: Box and Whisker Plots for Au by Domain
|
151
|
|
Figure 11‑13: Grouped Histogram of Ag and Au by Domain
|
152
|
|
Figure 11‑14: Plan Map of Block Model Boundaries - Caracol
|
156
|
|
Figure 11‑15: Plan Map of Block Model Boundaries - Agaves
|
157
|
|
Figure 11‑16: Plan View of Classification Distance Buffers to Composites – Caracol
|
165
|
|
Figure 11‑17: Long Section View, Looking N, of Classified Block Ag Grades – Dolores
|
166
|
|
Figure 11‑18: Long Section View, Looking N, of Classified Block Ag Grades – Morita
|
167
|
|
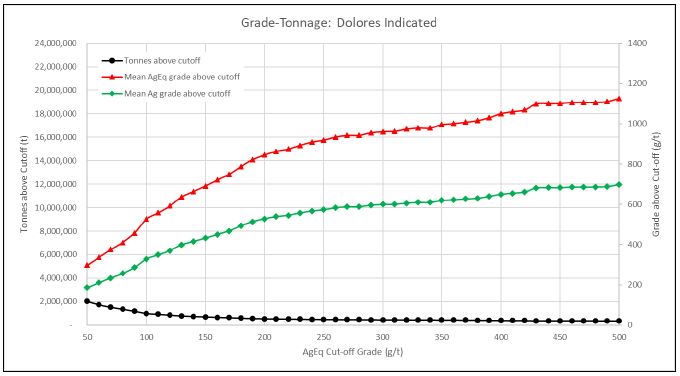
Figure 11‑19: Grade Tonnage Chart of Indicated Material – Dolores
|
172
|
|
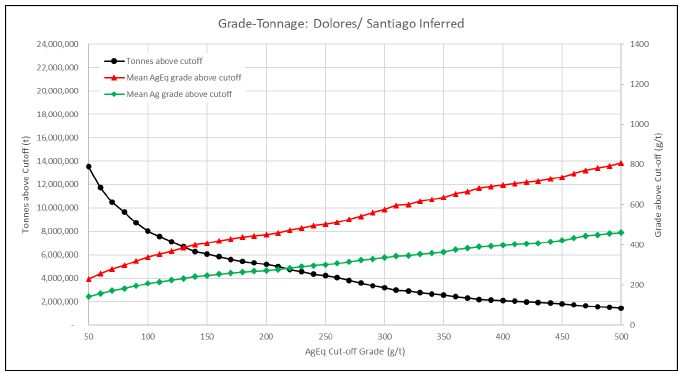
Figure 11‑20: Grade Tonnage Chart of Inferred Material – Dolores / Santiago
|
173
|
|
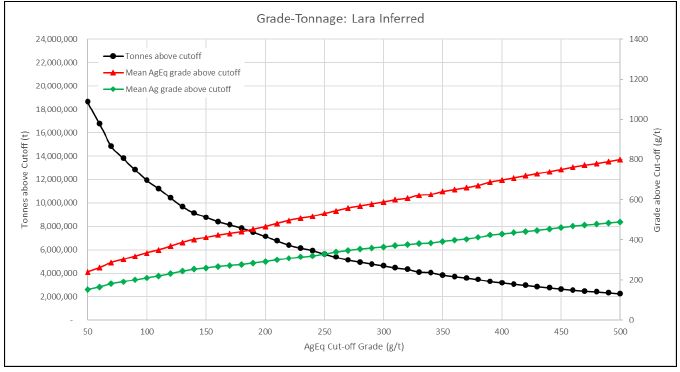
Figure 11‑21: Grade Tonnage Chart of Inferred Material – Lara
|
173
|
|
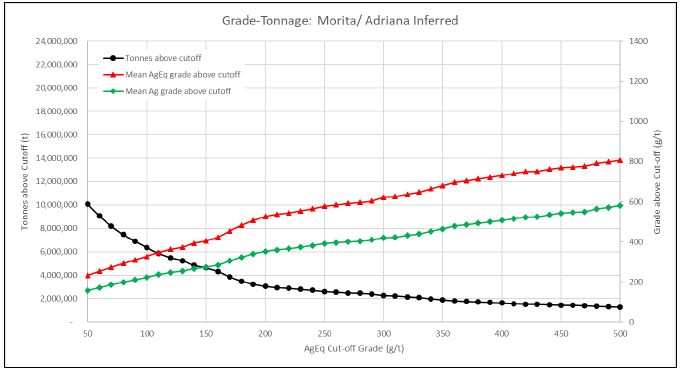
Figure 11‑22: Grade Tonnage Chart of Inferred Material – Morita / Adriana
|
174
|
|
Figure 11‑23: Grade Tonnage Chart of Inferred Material – Agaves
|
174
|
|
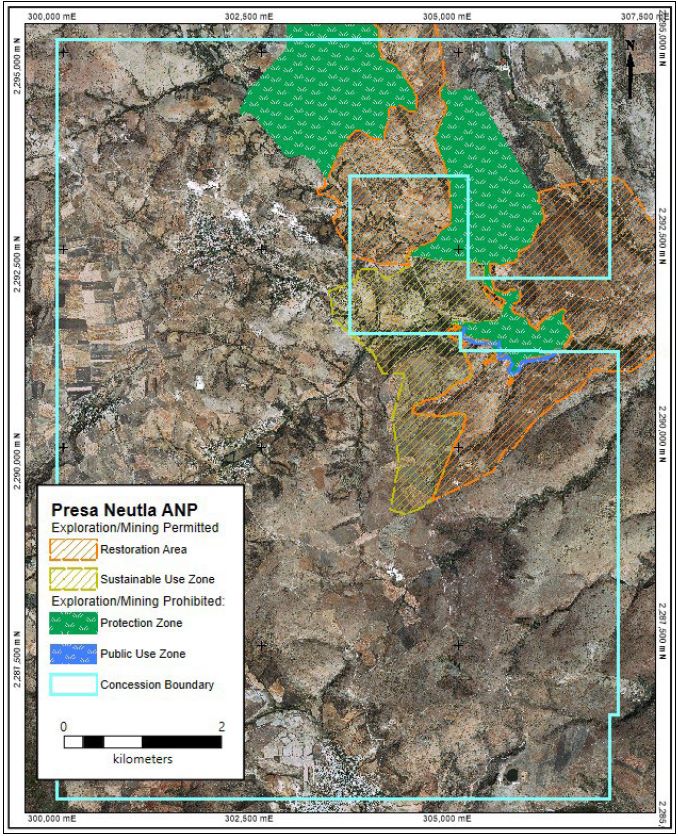
Figure 17‑1: Presa Neutla ANP Map
|
183
|
|
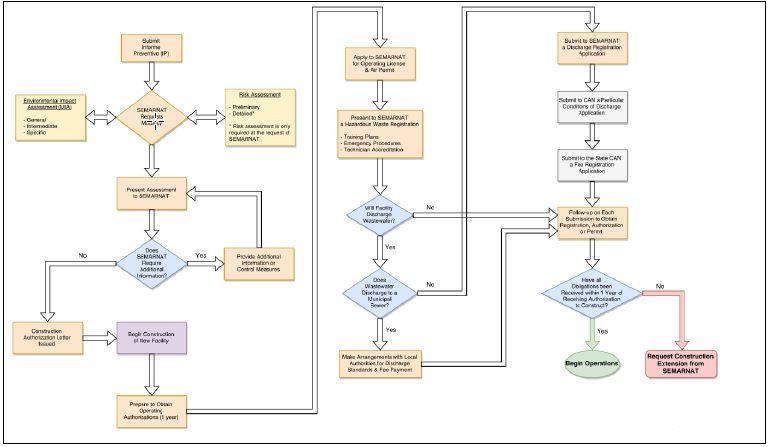
Figure 17‑2: General SEMARNAT Construction and Startup Authorization Process
|
186
|
|
SRK Consulting (U.S.), Inc.
SEC Technical Report Summary – Sinda Project
|
Page xi
|
List of Abbreviations
|
Abbreviation
|
Unit or Term
|
|
AA
|
atomic absorption
|
|
ANFO
|
ammonium nitrate fuel oil
|
|
Ag
|
silver
|
|
Au
|
gold
|
|
°C
|
degrees Centigrade
|
|
CoG
|
cut-off grade
|
|
cm
|
centimeter
|
|
cm3
|
cubic centimeter
|
|
°
|
degree (degrees)
|
|
dia.
|
diameter
|
|
g
|
gram
|
|
gpm
|
gallons per minute
|
|
g/t
|
grams per tonne
|
|
ha
|
hectares
|
|
HDPE
|
High Density Polyethylene
|
|
ICP
|
induced couple plasma
|
|
IFC
|
International Finance Corporation
|
|
kg
|
kilograms
|
|
km
|
kilometer
|
|
km2
|
square kilometer
|
|
kt
|
thousand tonnes
|
|
kV
|
kilovolt
|
|
kW
|
kilowatt
|
|
kWh/t
|
kilowatt-hour per metric tonne
|
|
LHD
|
Load-Haul-Dump
|
|
LoM
|
Life-of-Mine
|
|
m
|
meter
|
|
m2
|
square meter
|
|
m3
|
cubic meter
|
|
m3/s
|
cubic meters per second
|
|
m3/y
|
cubic meters per year
|
|
masl
|
meters above sea level
|
|
mm
|
millimeter
|
|
mm2
|
square millimeter
|
|
mm3
|
cubic millimeter
|
|
mm/y
|
millimeters per year
|
|
MME
|
Mine & Mill Engineering
|
|
Mm3
|
million cubic meters
|
|
Moz
|
million troy ounces
|
|
Mt
|
million tonnes
|
|
MW
|
million watts
|
|
m.y.
|
million years
|
|
NGO
|
non-governmental organization
|
|
NI 43-101
|
Canadian National Instrument 43-101
|
|
OSC
|
Ontario Securities Commission
|
|
oz
|
troy ounce
|
|
%
|
percent
|
|
PLC
|
Programmable Logic Controller
|
|
PLS
|
Pregnant Leach Solution
|
|
PMF
|
probable maximum flood
|
|
ppb
|
parts per billion
|
|
ppm
|
parts per million
|
|
QA/QC
|
Quality Assurance/Quality Control
|
|
RC
|
rotary circulation drilling
|
|
SRK Consulting (U.S.), Inc.
SEC Technical Report Summary – Sinda Project
|
Page xii
|
|
Abbreviation
|
Unit or Term
|
|
RoM
|
Run-of-Mine
|
|
RQD
|
Rock Quality Designation
|
|
SG
|
specific gravity
|
|
t
|
tonne (metric ton) (2,204.6 pounds)
|
|
t/h
|
tonnes per hour
|
|
t/d
|
tonnes per day
|
|
t/y
|
tonnes per year
|
|
TSF
|
tailings storage facility
|
|
µm
|
micron or microns
|
|
V
|
volts
|
|
W
|
watt
|
|
y
|
year
|
|
/y
|
per year
|
|
SRK Consulting (U.S.), Inc.
SEC Technical Report Summary – Sinda Project
|
Page 13
|
| 1 |
Executive Summary
|
This report was prepared as a Technical Report Summary (TRS) in accordance with the U.S. Securities and Exchange Commission (SEC) S-K regulations (Title 17, Part 229, Items 601 and 1300 until 1305)
for Sinda, LTD. (Sinda or the Company) by SRK Consulting (U.S.), Inc. (SRK) on the Sinda Project (the project) located in Guanajuato, Mexico.
| 1.1 |
Property Description (Including Mineral Rights) and Ownership
|
The Project is in central Mexico, 38 kilometers (km) north of the town of Celaya (population of approximately 310,000) and 15 km west of Comonfort, in the southeast quadrant of Guanajuato State.
The Sinda Project is approximately 290 km northwest of Mexico City and 45 km southeast of the Guanajuato Mining District. The Project is 100 percent (%) controlled by Sinda and is contained within 6,232 hectares (ha) of exploration concessions.
| 1.2 |
Geology and Mineralization
|
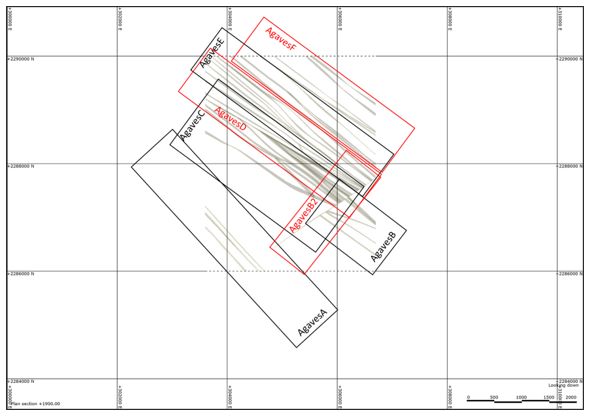
The Sinda deposits are comprised of multiple low-sulfidation epithermal vein systems with high-grade silver (Ag) and gold (Au) mineralization, along with accessory copper (Cu), lead (Pb) and zinc
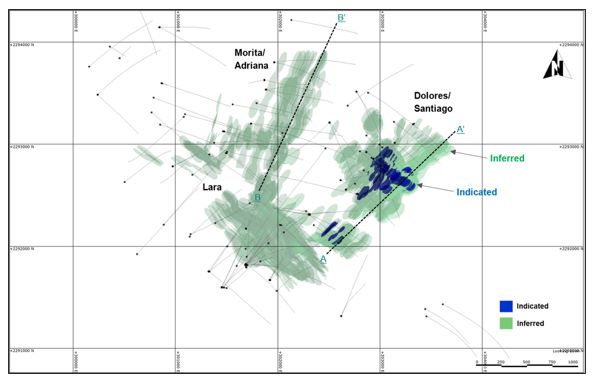
(Zn). Sinda estimates the combined strike lengths of vein systems within the exploration trends exceeds 110 km at the Sinda Project. Six vein systems are evaluated in the Mineral Resource estimate (MRE): Dolores, Morita, Santiago, Lara, Adriana and
Agaves. The northern area of the Sinda Project hosting Dolores, Morita, Santiago, Lara and Adriana veins is also referred to collectively as the Caracol target area. The Agaves vein system is located approximately 4 km southeast of Caracol.
SRK has incorporated Sinda-provided geologic interpretations from the Company’s internal experts. Sinda is considered to be an extension of the Guanajuato Trend, which hosts Ag-rich, polymetallic
mines exploiting epithermal veins. Understanding of this type of deposit style is well advanced with many technical and academic publications detailing alteration, litho-geochemical controls, spatial mineral associations, and genesis (e.g.,
Buchanan, 1981).
The deposit morphology shows a strong regional structural control to mineralization with three primary orientations: northeast-southwest, north-south, and northwest-southeast. Overall,
mineralization observed within the primary exploration trends is reported to be similar, as the vein systems formed contemporaneously by analogous geological processes. Noteworthy post-mineralization structural dismemberment is reported to offset
certain vein system segments, particularly in the Agaves area.
The current geological understanding is considered sufficient for conceptual exploration targeting, geological modeling, and resource estimation of the Sinda deposits.
| 1.3 |
Status of Exploration, Development, and Operations
|
Since late 2016, Sinda has explored the Project, targeting high-grade silver and gold mineralization hosted in the epithermal veins. At the time of reporting, additional drilling was started
outside of the Resource area, which has not been reviewed. This Technical Report is focused on a MRE for only the Dolores, Morita, Santiago, Lara, Adriana and Agaves vein systems at Sinda.
|
SRK Consulting (U.S.), Inc.
SEC Technical Report Summary – Sinda Project
|
Page 14
|
In 2015, Golden Minerals Company (Golden) completed five drill holes totaling 2,679 meters (m) at Sinda (Golden, 2018). Golden signed an earn‐in agreement with a subsidiary of Minera Adularia
International Ltd. (Minera Adularia Exploración) in 2016. The Sinda Project is currently 100% owned and controlled by Minera Adularia, an affiliate of Sinda, LTD.
Since drilling commenced, a total of 232,522 m from 221 drill holes were completed at Sinda as of the January 11, 2023, database cut-off date. No further data was available for the current MRE.
Within the Resource area at Sinda, a subset of 178 sampled drill holes defined the estimation domains with a total of 7,399.1 m of assayed intercepts crossing the modeled vein wireframes. In total, 1,760 individual vein width composites define 112
vein wireframes in the Resource area. Outside of the Sinda Resource area, 39 drill holes explored additional potential vein systems that do not define any current estimation domains. No previous artisanal metal mining operations, nor additional
historical drilling campaigns are known to have occurred at Sinda.
SRK independently reviewed the core sampling, cutting, logging, sample preparation, security, and laboratory analytical procedures followed at Sinda during the July 2021 site visit. The exploration
and sampling protocols practiced by Sinda are consistent with or exceed generally accepted industry practice and are deemed adequate for the project stage. In the opinion of the SRK Qualified Person (QP) for Mineral Resources, the Sinda drilling
data are sufficiently accurate and reliable to inform the MRE of the Project.
For future targeting of Sinda exploration areas, SRK tabulated quantities of conceptual Exploration Targets, exclusive of Mineral Resources, using reasonable techniques for estimating speculative
tonnages and grades. Globally, the conceptual Exploration Targets range from about 32 to 37 million tonnes (Mt) at grades ranging from 400 to 440 grams per tonne (g/t) silver equivalent (AgEq). For these high-level estimates, the AgEq calculations
assumed a silver price of US$32.00/ounce (oz) and a gold price of US$2,750/oz, independent of potentially variable metallurgical recovery by metal, as recovery is assumed to be relatively equal for AgEq purposes. These potential quantity and grade
ranges are conceptual in nature and insufficient exploration has been conducted to define this material as a Mineral Resource. It is uncertain whether further exploration will result in these Exploration Target estimates being delineated as Mineral
Resources or converted to Mineral Reserves in the future. In SRK’s opinion, the areas encompassing this conceptual material tabulation should be considered as potential for further exploration and a focus of future evaluation work programs.
In addition to the Caracol and Agaves vein systems, exploration prospecting on the Sinda concessions has revealed other potential vein targets. Sinda is continuing to follow-up on local and
regional exploration potential. Further drilling has the potential to develop additional Mineral Resources and increase confidence within existing Mineral Resources. Moreover, additional step-out and regional exploration drilling at Sinda has the
potential to discover economic mineralization in areas where no modern exploration has occurred in a prospective area.
| 1.4 |
Mineral Resources
|
The Mineral Resource presented herein represents an evaluation of six vein systems at the Sinda Project: Dolores, Morita, Santiago, Lara, Adriana and Agaves. The resource estimation methodology
conducted by SRK involved the following procedures:
| • |
Database review
|
| • |
Data conditioning (capping and compositing) for statistical analysis
|
| • |
Block modeling and grade interpolation
|
| • |
Resource classification and validation
|
|
SRK Consulting (U.S.), Inc.
SEC Technical Report Summary – Sinda Project
|
Page 15
|
| • |
Assessment of “reasonable prospects for economic extraction” (RPEE) and application of appropriate reporting cut-off grade (CoG)
|
| • |
Preparation of the Mineral Resource statement
|
SRK has defined the Mineral Resource based on a CoG of 150 g/t AgEq derived from assumed economics for underground mining potential. The effective date of the Mineral Resource
(November 24, 2025) reflects the recent update to AgEq calculation formulas in the current block model. The underlying block grade estimates are unchanged from the Mineral Resource Estimate
reported previously for internal use by Sinda with an effective date of February 16, 2023. The estimation was constrained within discrete vein domains interpreted by Sinda based on geology and grade. Sinda targeted 2 m minimum thickness during vein
wireframe construction which considers likely mining dilution.
Mineral Resources are not Mineral Reserves and do not have demonstrated economic viability. There is no certainty that all or any part of the Mineral Resources will be converted into Mineral
Reserves in the future. The Mineral Resource estimate may be materially affected by changes to the geological, geotechnical, and geometallurgical models, infill drilling to convert material to higher classification, drilling to test for extensions
to known Mineral Resources, collection of additional bulk density data, significant changes to commodity prices, and by environmental permitting, legal, title, taxation, socio-political, marketing, or other relevant issues.
The Sinda Project Mineral Resource statement is presented in Table 1‑1.
|
SRK Consulting (U.S.), Inc.
SEC Technical Report Summary – Sinda Project
|
Page 16
|
Table 1‑1: Sinda Underground (U/G) Mineral Resource Estimate at 150 g/t AgEq Cut-off Grade as of November 24, 2025 – SRK Consulting (U.S.), Inc.
|
Classification
|
Vein
|
Tonnage
('000 t)
|
Ag
Grade
(g/t)
|
Au
Grade
(g/t)
|
AgEq
Grade
(g/t)
|
Contained
Metal Ag
(000 oz)
|
Contained
Metal Au
(000 oz)
|
Contained
Metal
AgEq
(000
oz)
|
|||||||||
|
Indicated
|
Dolores
|
711
|
432
|
3.02
|
692
|
9,870
|
69
|
15,797
|
|||||||||
|
Total Indicated
|
711
|
432
|
3.02
|
692
|
9,870
|
69
|
15,797
|
||||||||||
|
Inferred
|
Adriana
|
129
|
147
|
0.19
|
163
|
609
|
0.8
|
676
|
|||||||||
|
Agaves
|
10,250
|
267
|
0.86
|
341
|
87,966
|
283
|
112,320
|
||||||||||
|
Dolores
|
5,326
|
214
|
1.90
|
377
|
36,610
|
325
|
64,540
|
||||||||||
|
Lara
|
8,799
|
260
|
1.77
|
412
|
73,557
|
500
|
116,549
|
||||||||||
|
Morita
|
4,503
|
277
|
1.58
|
413
|
40,064
|
229
|
59,745
|
||||||||||
|
Santiago
|
737
|
490
|
1.84
|
648
|
11,601
|
44
|
15,351
|
||||||||||
|
Total Inferred
|
29,615
|
263
|
1.45
|
388
|
250,407
|
1,382
|
369,180
|
Source: SRK, 2025
Notes:
| • |
Mineral Resources are not Mineral Reserves and do not have demonstrated economic viability. There is no certainty that all or any part of the mineral resources will be converted into mineral reserves in the future. There has been
insufficient exploration to define the Indicated and Inferred Resources tabulated above as Measured Mineral Resource. The Mineral Resource estimate may be materially affected by changes to the geological, geotechnical, and geometallurgical
models, infill drilling to convert material to higher classification, drilling to test for extensions to known Mineral Resources, collection of additional bulk density data, significant changes to commodity prices, and by environmental
permitting, legal, title, taxation, socio-political, marketing, or other relevant issues.
|
| • |
The definitions for Mineral Resources in S-K 1300 were followed for the classification of Mineral Resources, which are consistent with the classification scheme under the CRIRSCO standards.
|
| • |
Mineral Resources with reasonable prospects for economic extraction stated as contained within estimation domains above a 150 g/t AgEq cut-off.
|
| • |
Cut-off grade calculations considered a silver price of US$32.00/oz and gold price of US$2750.00/oz, variable metallurgical recoveries based on available data (Ag at 94% from an overall average of testwork to-date), mining cost of
US$75.00/t, process and tailings cost of US$20.00/t, G&A costs of US$10.00/t, treatment, refining, freight and marketing costs of US$2.00/oz, and Ag payability of 97.5%.
|
| • |
AgEq calculations assumed silver price of US$32.00/oz and gold price of US$2750.00/oz., independent of potentially variable metallurgical recovery by metal, as recovery is assumed to be equal for both Ag and Au for purposes of AgEq.
Calculated AgEq = ((Ag grade * 32.00 ÷ 31.10348) + (Au grade * 2750.00 ÷ 31.10348)) ÷ (32.00 ÷ 31.10348).
|
| • |
All quantities are rounded to the appropriate number of significant figures; consequently, sums may not add up due to rounding.
|
| 1.5 |
Mineral Reserve Estimate
|
No Mineral Reserves have been established for this project given the current level of exploration and study.
| 1.6 |
Mining Methods
|
As no Mineral Reserves have been established for this project given the current level of exploration and study, there is no detailed analysis of mining methodology contemplated. The definition of
reasonable potential for economic extraction currently considers a selective cut and fill underground mining method with generalized parameters.
| 1.7 |
Recovery Methods
|
No Mineral Reserves have been established for this project given the current level of exploration and study. As such, no detailed studies have been conducted relevant to processing or recovery
methods.
| 1.8 |
Project Infrastructure
|
This work has not been conducted due to the current project stage and is not required for this report.
|
SRK Consulting (U.S.), Inc.
SEC Technical Report Summary – Sinda Project
|
Page 17
|
| 1.9 |
Environmental Studies and Permitting
|
Sinda is conducting mineral exploration under a valid Preventive Report (IP) submitted to SEMARNAT (Secretaria de Medio Ambiente y Recursos Naturales) in 2024, with drill platforms permitted for
identified vein systems and new targets. Exploration in the Presa Neutla Protected Natural Area is authorized separately. A new Environmental Impact Statement was submitted in June 2025, with authorization expected in Q1 2026.
Current mineral concessions cover 6,232 ha in Guanajuato under five lots, with a mix of private and ejido-controlled land. The regulatory framework includes the General Law of Ecological
Equilibrium and the Protection of the Environment, with SEMARNAT overseeing environmental permitting. Recent mining law reforms (May 2023) require new concessions to be granted via public bidding along with environmental, social, and labor
authorizations. Concession holders must negotiate land access, conduct impact studies, and fulfill new water use and waste management regulations.
Environmental studies found area rocks have medium to low permeability, restricting aquifer zones to fractures. Water infrastructure in the project area includes wells and pits. Groundwater
availability for new concessions is limited, indicated by a significant deficit in the Valle de Celaya aquifer. Water quality sampling showed iron and arsenic levels often exceed official limits.
Sinda operates in Comonfort and Juventino Rosas, directly present in nine communities and serving 8,000 to 10,000 residents. Programs support local productive capacities and education. According to
National Institute of Indigenous Peoples, there are no Indigenous communities in the area of influence. The socio-territorial assessment identifies risks related to community perceptions, water access, agrarian dynamics, and external actors; no
active social conflicts are documented. Sinda maintains permanent engagement through community centers, a social management plan, and alignment with international standards.
| 1.10 |
Capital and Operating Costs
|
No Initial Assessment has been conducted for the project at this stage.
| 1.11 |
Economic Analysis
|
No Initial Assessment has been conducted for the project at this stage.
| 1.12 |
Conclusions and Recommendations
|
Sinda represents an early-stage exploration project hosting multiple silver-gold epithermal vein occurrences. The modeled veins are open along strike and along dip and at depth in certain areas.
Further drilling and additional sampling of completed drill holes has the potential to develop additional Mineral Resources and increase confidence in existing Mineral Resources. Additional step-out and regional exploration drilling at Sinda has
the potential to discover economic mineralization in areas where no modern exploration has occurred in a prospective area.
|
SRK Consulting (U.S.), Inc.
SEC Technical Report Summary – Sinda Project
|
Page 18
|
In the opinion of SRK, the results of the exploration work completed on the Sinda Project to date are of substantial technical merit to recommend additional exploration expenditures. The next
exploration campaign should include a combination of in-fill drilling to improve known mineralization continuity, improve geological understanding, and collect structural geology data, and wider-spaced drilling to test the strike length extents of
the most prospective vein systems. Additionally, Sinda should continue assaying unsampled core in areas where drill holes are projected through interpreted mineralized wireframes, as these intervals are currently assigned half detection limit
values in the estimation.
A Mineral Resource has been delineated at Sinda and has been classified consistent with international reporting standards such as those defined by Committee for Mineral Reserves International
Reporting Standards (CRIRSCO). At present, the predominantly Inferred classification reflects relative uncertainties with the current project data based on spacing of drilling and sampling thus far. SRK is of the opinion that significant
opportunities exist to both expand the current resource and enhance confidence through additional drilling and sampling at Sinda.
In Section 23, SRK has provided recommendations for future work programs across a multi-disciplinary scope, including exploration, geology, mineral processing, metallurgical testing, geotechnical,
mining, environmental, and permitting. The total costs for the recommended work program to advance the project and progress toward an Initial Assessment (IA) report are estimated at approximately US$198 million.
|
SRK Consulting (U.S.), Inc.
SEC Technical Report Summary – Sinda Project
|
Page 19
|
| 2 |
Introduction
|
This report was prepared as a TRS for Sinda, LTD (Sinda or the Company) by SRK Consulting (U.S.), Inc. (SRK or the Consultants) on the Sinda Project (Sinda or the Project). Previously, the Project
was referred to as Celaya.
| 2.1 |
Registrant for Whom the Technical Report Summary was Prepared
|
This TRS was prepared for Sinda by SRK in accordance with the SEC S-K regulations (Title 17, Part 229, Items 601 and 1300 through 1305).
| 2.2 |
Terms of Reference and Purpose of the Report
|
The quality of information, conclusions, and estimates contained herein are consistent with the level of effort involved in SRK’s services, based on i) information available at the time of
preparation, and ii) the assumptions, conditions, and qualifications set forth in this report. This report is intended for use by Sinda subject to the terms and conditions of its contract with SRK and relevant securities legislation. The contract
permits Sinda to file this report as a TRS with United States securities regulatory authorities pursuant to the SEC S-K regulations, more specifically Title 17, Subpart 229.600, item 601(b)(96) - Technical Report Summary and Title 17, Subpart
229.1300 - Disclosure by Registrants Engaged in Mining Operations. Except for the purposes legislated under local securities law, any other uses of this report by any third party are at that party’s sole risk. The responsibility for this disclosure
remains with Sinda.
The effective date of this report is November 24, 2025.
The TRS is preliminary in nature, in that it includes Inferred mineral resources that are considered too speculative geologically to have the economic considerations applied to them that would
enable them to be categorized as mineral reserves, and there is no certainty that the TRS will be realized. Mineral resources that are not mineral reserves do not have demonstrated economic viability.
| 2.2.1 |
Purpose of Report
|
The purpose of this TRS on the Sinda Project is to provide an updated technical report addressing advances made on the property with respect to updated pricing and related reporting criteria.
The intent of this technical report is to provide the reader with a comprehensive review of the historical and current exploration activities conducted at the Sinda Project and an independent
assessment of the contained mineral resources for the project as of the effective date of this report. The technical work described herein, and the technical report itself are prepared using industry-accepted practices, standards, and definitions
within the Committee for Mineral Reserves International Reporting Standards (CRIRSCO) guidelines.
| 2.3 |
Sources of Information
|
This report is based in part on internal Company technical reports, previous studies, maps, published government reports, internal letters and memoranda, and public information. The sources of
information include historical data and reports compiled by previous consultants and researchers of the project and supplied by Sinda as cited throughout this report and listed in the References section (Section 24).
|
SRK Consulting (U.S.), Inc.
SEC Technical Report Summary – Sinda Project
|
Page 20
|
The Consultant’s opinion contained herein is based on information provided to the Consultants by Sinda or their designees throughout the course of the investigations. SRK has relied on Sinda
internal experts for details on regional geology and geological interpretations.
SRK has not performed an independent verification of land title and tenure information as summarized in Section 3 of this report, which was verified separately by Sinda legal counsel. SRK did not
verify the legality of any underlying agreement(s) that may exist concerning the permits or other agreement(s) between Sinda and third parties. As such, SRK expresses no opinion as to the ownership status of the Project.
The report has been prepared using the documents noted in the References section (Section 24). The Consultants used their experience to determine if the information from previous reports was
suitable for inclusion in this technical report and adjusted information that required amending. This report includes technical information that required subsequent calculations to derive subtotals, totals, and weighted averages. Such calculations
inherently involve a degree of rounding and consequently introduce a margin of error. Where these occur, the Consultants do not consider them to be material.
| 2.4 |
Details of Inspection
|
SRK visited the Project site from July 26 to July 28, 2021. No material changes have occurred to the Project since the previous personal inspection. The field visit allowed independent observation
of the property, geology, sampling procedures, infrastructure, and geomechanical aspects of the Project (Table 2‑1). Additionally, the QP site visits fulfilled typical requirements for disclosure and the required level of validation outlined by
international guidelines.
Table 2‑1: Site Visit Participants
|
Company
|
Expertise
|
Date(s) of Visit
|
Details of Inspection
|
||||
|
SRK
|
Geology
|
July 26-28, 2021
|
Overview audit
|
| 2.5 |
Report Version Update
|
The user of this document should ensure that this is the most recent TRS for the property. Any previous report is no longer valid if a new TRS has been issued.
|
SRK Consulting (U.S.), Inc.
SEC Technical Report Summary – Sinda Project
|
Page 21
|
| 3 |
Property Description
|
| 3.1 |
Property Location
|
The Project is located in central Mexico, 38 km north of the town of Celaya (population of approximately 310,000) and 15 km west of Comonfort, in the southeast quadrant of Guanajuato state. The
Sinda Project is approximately 290 km northwest of Mexico City and 45 km southeast of the Guanajuato Mining District (Figure 3‑1). The Universal Transverse Mercator (UTM) coordinates for the center of the Project are East 303,000 longitude and
North 2,290,000 latitude with a variable elevation between 1,850 and 2,050 m above sea level (masl).
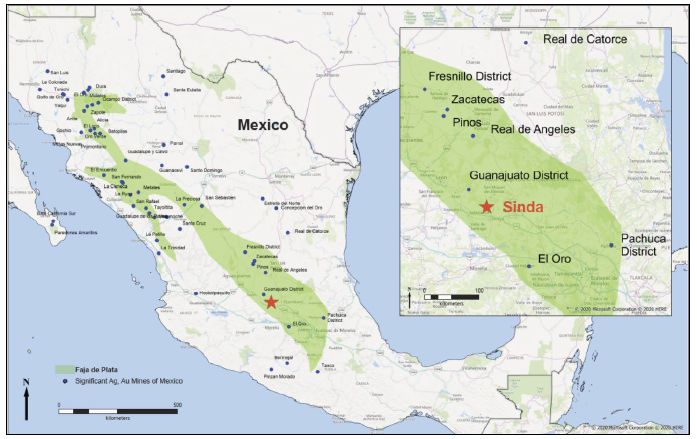
Source: SRK, 2025
Notes: Significant Mexican silver-gold mines noted by blue dots
Figure 3‑1: Location Map with Proximity to Major Silver Districts
| 3.2 |
Property Area
|
The Project area is centrally located in Mexico and crossed by major national highways and railways. Both the Pacific Ocean and Gulf of Mexico can be accessed equally, as well as major metropolitan
areas, such as Monterrey, Mexico City, and Guadalajara. The accessibility of the region has led to growth in industrial manufacturing, especially the automotive sector, as an important economic segment.
|
SRK Consulting (U.S.), Inc.
SEC Technical Report Summary – Sinda Project
|
Page 22
|
| 3.3 |
Mineral Title, Claim, Mineral Right, Lease, or Option Disclosure
|
| 3.3.1 |
Mineral Claims
|
The Project is 100% controlled by Sinda and is contained within 6,232 ha of exploration concessions, summarized in Table 3‑1. A plan map of the Sinda Project boundary and concessions by type is
provided as Figure 3‑2.
Table 3‑1: Exploration Concession Summary
|
No.
|
Lot
|
Holder
|
Surface
(ha)
|
Title
|
Type of
Concession
|
Term
|
Location
|
||||||||
|
1
|
Celaya-01
|
Minera Adularia
Exploración, S. de
R.L. de C.V. (MAE)
|
5,566.74
|
232724
|
Mining
|
October 14,
2058
|
Santa Cruz de
Juventino Rosas,
Guanajuato
|
||||||||
|
2
|
Santiago de
Compostela
|
Minera Adularia
Exploración, S. de
R.L. de C.V. (MAE)
|
198
|
219174
|
Mining
|
February 13,
2053
|
Santa Cruz de
Juventino Rosas,
Guanajuato
|
||||||||
|
3
|
Ampliación
Santiago de
Compostela
|
Minera Adularia
Exploración, S. de
R.L. de C.V. (MAE)
|
41.9925
|
214657
|
Mining
|
October 25,
2051
|
Santa Cruz de
Juventino Rosas,
Guanajuato
|
||||||||
|
4
|
El Milagro
|
Bernabé Silva
Sánchez (50%),
Agustín Mesita
(50%)
|
400
|
239753
|
Mining
|
January 27,
2053
|
Comonfort,
Guanajuato
|
||||||||
|
5
|
La Paloma
|
Minera Adularia
Exploración, S. de
R.L. de C.V. (MAE)
|
24.9228
|
219235
|
Mining
|
February 19,
2053
|
Comonfort,
Guanajuato
|
Source: SRK, 2025
|
SRK Consulting (U.S.), Inc.
SEC Technical Report Summary – Sinda Project
|
Page 23
|
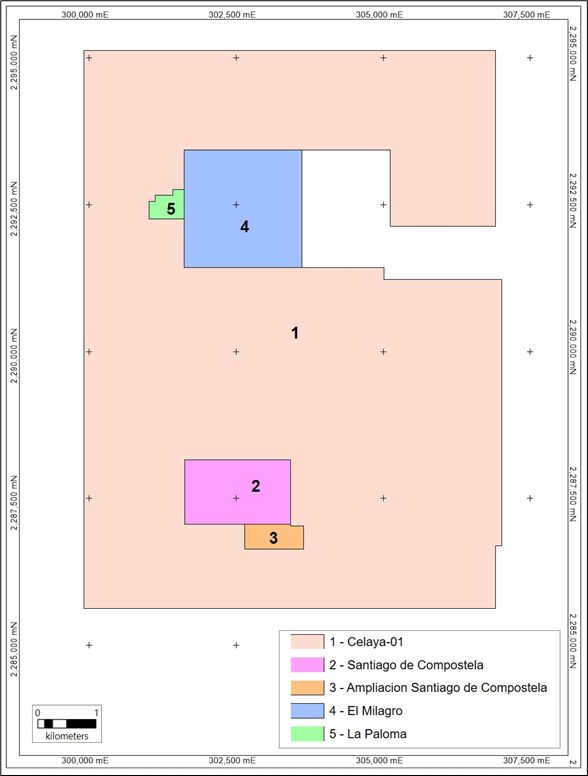
Source: SRK, 2025
Figure 3‑2: Land Tenure Map
|
SRK Consulting (U.S.), Inc.
SEC Technical Report Summary – Sinda Project
|
Page 24
|
| 3.3.2 |
Legal Surveys
|
The legal firm VHG Servicios Legales, S.C. (VHG), Mexico City, Mexico, was retained by Sinda to perform a due diligence (DD) focused on determining the current legal status, ownership, and validity
of five mining concessions forming the Sinda Project. The legal title opinion was reported by VHG on August 13, 2021.
SRK has not performed an independent verification of land title and tenure information and expresses no opinion as to the ownership status of the Project.
| 3.3.3 |
Requirements to Maintain the Claims in Good Standing
|
The VHG title opinion report noted the following:
| • |
As Pursuant to that set forth in the Mining Law, holders of mining concessions are obliged to perform mining works in their concessions, taking into consideration for said purposes the minimum investment amounts provided for in the
Regulations to the Mining Law.
|
| • |
Concessionaires that hold concessions covering a surface of more than 1,000 ha, also have the obligation to file before the DGM annual assessment works reports, during the month of May; concessionaires that hold less than 1,000 ha do not
have this obligation. It is important to mention that the concessionaire must confirm if he has another mining concession, to know if he should or not comply with this obligation.
|
| • |
Notwithstanding the foregoing, it is of utmost importance to consider that the DGM may at any time verify the mining works within the lots; which would include the information contained in the reports submitted to such authority; should
such be the case, also attend the inspection visit that must be carried out by the DGM.
|
| • |
As part of the obligations derived from titles of mining concessions, concessionaires have the obligation to file after the sixth year of the term of the concession: (i) production reports on mineral obtained from the concessions; and
(ii) technical reports on works carried out (stating that) the company is current in the compliance in this obligation; this last obligation must be fulfilled only once after the sixth year of the term of the concession.
|
| 3.3.4 |
Titles and Obligations/Agreements
|
The VHG title opinion report noted the following:
| • |
As concerns the type of concessions and the life of said concessions, it is important to notice that, on April 28, 2005, the Mexican Mining Law was amended and one of the most important purposes of said amendment was to change the legal
regime applicable to the mining concessions, from two kinds of concessions formerly recognized (exploration and exploitation) to only one kind of mining concession, with a term of 50 years counted from the date on which the respective title
is recorded in the RPM, in such a manner that, effectively as of January 1, 2006, the mining concessionaires are formally allowed to perform exploration and exploitation works as well as beneficiation of minerals, since the date on which
the mining concession title is issued.
|
| • |
Should there be any mining duties incorrectly or not paid, the DGM would have the obligation to provide to the concessionaire with an official communication granting the latter a 60-day term from the date on which the respective official
communication is received, to either provide DGM with sufficient evidence that the respective payment was timely and correctly made or to cure said deficiency by means of paying the outstanding mining duties plus the corresponding
surcharges and provide the DGM with copies of said payments. In the worst-case scenario, assuming the aforesaid official communication is issued, and the concessionaire does not properly answer during the abovementioned term of 60 days, DGM
would initiate the procedure to cancel the respective concession for that reason.
|
|
SRK Consulting (U.S.), Inc.
SEC Technical Report Summary – Sinda Project
|
Page 25
|
In conclusion, VHG stated: “subject to any possible liability or contingency not shown in the public records of the RPM and of the DGM, we are of the opinion that, as of the date hereof [August 13,
2021], the mining concessions covering the “CELAYA PROJECT” are valid, in full force and effect". Note, that the Sinda Project was previously referred to as the Celaya Project.
In December 2025, Sinda provided SRK with updated information regarding surface-access agreements, contractual arrangements, and royalty obligations associated with the concessions comprising the
Sinda Project. The opinion confirms the current legal status, ownership, and validity of the mining concessions comprising the Sinda Project. According to DBR’s review, all concessions are valid, fully registered in the Public Registry of Mining,
and in compliance with applicable legal obligations:
| • |
All five concessions are valid and in full force, with expiration dates ranging from 2051 to 2058, and each eligible for a 25-year extension under the Mining Law.
|
| • |
No liens, encumbrances, or recorded legal claims affect the concessions.
|
| • |
Sinda appears in the Public Registry of Mining as the lawful holder, and all filings and mandatory obligations are up to date, including minimum work investments and annual assessment reports.
|
| • |
A portion of two concessions presents an overlap with the Presa Neutla State Natural Protected Area (ANP). This overlap does not affect the validity of the concessions. The Company is evaluating the administrative subdivision of these
polygons to isolate the overlapping areas, ensuring that any future regulatory considerations apply solely to those portions and not to the remainder of the concession package.
|
| • |
No risks were identified regarding title termination, cancellation, or limitation of rights under the current legal framework.
|
| 3.4 |
Royalties or Other Encumbrances
|
DBR Abogados reported no liens, encumbrances, or judicial or administrative proceedings in the Public Registry of Mining affecting the validity, continuity, or enforceability of the concessions.
According to the updated legal title opinion prepared by DBR Abogados, S.C. (Mexico City), the Project has one royalty agreement currently in force.
The Ejido Delgado, owner of the mining concession El Milagro, granted Sinda the right to conduct exploration activities under an agreement that establishes a Net Smelter Return (NSR) royalty of
1.5% on payable metals derived from future production specifically from this concession.
This royalty becomes effective only upon commencement of commercial production, and therefore no royalty payments are currently due, as the Project remains in the exploration stage.
Sinda also maintains valid surface-access agreements with several ejidos and private landowners that control areas required for exploration, including Delgado de Abajo, Delgado de Arriba, Palmillas
de San Juan, and Rincón de Centeno. These agreements provide access for drilling, temporary works, underground decline, and improvements to existing roads. Discussions for additional access agreements with nearby communities continue as part of the
ongoing exploration program.
|
SRK Consulting (U.S.), Inc.
SEC Technical Report Summary – Sinda Project
|
Page 26
|
| 3.4.1 |
Environmental Liabilities
|
No current environmental liabilities are known to exist for the Project.
| 3.4.2 |
Permits and Licenses
|
A discussion of existing permits and authorizations and the environmental regulatory framework are included in Section 17.
| 3.4.3 |
Other Significant Factors and Risks
|
No other significant factors or risks are known that affect access, title or right or ability to perform the exploration work recommended on the property.
|
SRK Consulting (U.S.), Inc.
SEC Technical Report Summary – Sinda Project
|
Page 27
|
| 4 |
Accessibility, Climate, Local Resources, Infrastructure, and Physiography
|
| 4.1 |
Topography, Elevation, and Vegetation
|
The Sinda site has an elevation varying between 1,850 and 2,050 masl. The physiography of the Project is characterized as gently undulating terrain. Low sloping rocky hills are transected by
relatively flat broad valleys that are utilized for farming activities.
| 4.1.1 |
Vegetation
|
Vegetation consists mainly of cacti, dispersed trees, such as mesquite, and desert grasses among planted fields and pastures. Guanajuato is a fertile agricultural state, and small local farms
produce corn, onions, agave, and other vegetable crops for local distribution. Additionally, goats, cattle and poultry are raised locally.
| 4.2 |
Means of Access
|
Access to and from the Project is relatively simple and approachable from several alternate routes. From the city of Celaya, the Sinda site has vehicle access via Mexico 51 multi-lane highway to
the north toward Comonfort (24 km). From Comonfort, a paved road (Carr. Comonfort) is followed west for approximately 16 km to reach the community of Delgado de Arriba and the Project. The driving time from the city of Celaya to the Sinda Project
is approximately one hour.
Accessibility within the Sinda site is sufficient, and an extensive network of graded dirt and gravel roads provide four-wheeled drive vehicle access to most areas of the Project.
| 4.3 |
Climate and Length of Operating Season
|
Field operations occur throughout the year and there is no seasonal limitation on operations. Climatic conditions do not adversely impact exploration activities. The average annual temperature is
18.5°C. Winter lows rarely reach less than 10°C with only occasional frosts. Local climate data by month for Celaya, Guanajuato, Mexico are provided in Figure 4‑1.
Most of the annual rainfall occurs in the summer, between June and September, when the average monthly rainfall is 130 millimeters (mm). Average monthly rainfall from October to May is 20 mm. Due
to the semi-arid climate, drainages at the Project are ephemeral and rarely contain water in the dry season or between significant summer rain events.
|
SRK Consulting (U.S.), Inc.
SEC Technical Report Summary – Sinda Project
|
Page 28
|
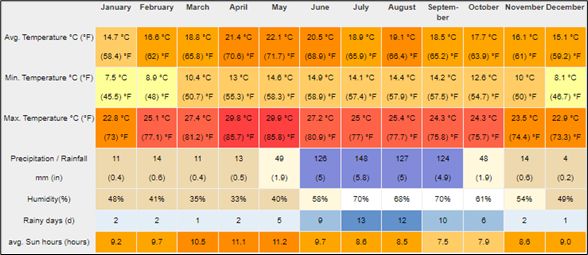
Source: https://en.climate-data.org/north-america/mexico/guanajuato/celaya-764314/
Figure 4‑1: Weather by Month for Celaya, Guanajuato, Mexico
| 4.4 |
Infrastructure Availability and Sources
|
| 4.4.1 |
Water
|
Water for the project is currently sourced from local community groundwater wells. Supply is adequate for potable and non-potable uses that support the current exploration stage activities.
| 4.4.2 |
Electricity
|
The Mexican governmental utility, Federal Electricity Commission (CFE – Comisión Federal de Electricidad), supplies almost all of the country’s power. The Sinda Project has reliable power from the
national grid. Power is supplied to the site by a local utility transmission line.
| 4.4.3 |
Personnel and Supplies
|
Local skilled labor is available in the region and mining forms a significant portion of the regional economy. Most of the current Sinda technician labor force are from the local Delgado de Arriba
community near the Project. Professional teams, consisting of geologists and engineers, are sourced in-country and travel to site on rotations. Professionals on rotation reside in local company housing in nearby San Miguel de Allende during
overlapping, rotating work schedules (i.e., 20 days on/10 days off).
|
SRK Consulting (U.S.), Inc.
SEC Technical Report Summary – Sinda Project
|
Page 29
|
| 5 |
History
|
| 5.1 |
Previous Operations
|
In 2015, Golden Minerals Company (Golden) completed five drill holes totaling 2,679 m at Sinda (Golden, 2018). A subsidiary of Golden (Minera Cordilleras) signed an earn‐in agreement with a
subsidiary of Minera Adularia International Ltd. (Minera Adularia Exploración) in 2016. The Project is currently 100% controlled by Sinda.
| 5.2 |
Exploration and Development of Previous Owners or Operators
|
Limited exploration programs and no development work were conducted by historical metal mine operators, prior to the Company’s ownership. No previous artisanal metal mining operations are known to
have occurred at Sinda. Small-volume, near-surface kaolin clay pits are scattered throughout the Project boundaries and are not considered material, as production was limited in depth and did not impact the precious and base metal mineralization,
which is the focus of this Technical Report.
| 5.2.1 |
Historic Mineral Resource and Reserve Estimates
|
No historical resource estimates are known to exist for the Project, prior to Sinda’s ownership.
This section includes a brief discussion of historical resource estimates prepared for internal use by Sinda, using the original terminology and format of previous technical report disclosure. The
current SRK QP and Sinda are not treating the historical estimate as current Mineral Resources or Mineral Reserves. A Qualified Person has not done sufficient work to classify the historical estimate as current Mineral Resource or Mineral Reserves.
The historical estimates (Table 5‑1 and Table 5‑2) are summarized herein to provide a relative comparison to the current MRE discussed in this report.
Table 5‑1: Sinda Underground (U/G) Mineral Resource Estimate at 200 g/t AgEq Cut-off Grade as of June 24, 2021 – SRK Consulting (U.S.), Inc.
|
Vein
|
Classification
|
Tonnage
(000’s t)
|
Ag
Grade
(g/t)
|
Au
Grade
(g/t)
|
AgEq
Grade
(g/t)
|
Contained
Metal Ag
(000’s oz)
|
Contained
Metal Au
(000’s oz)
|
Contained
Metal AgEq
(000’s oz)
|
|||||||||
|
Dolores
|
Indicated
|
378
|
719
|
5.47
|
1,175
|
8,752
|
66
|
14,294
|
|||||||||
|
Total
|
Indicated
|
378
|
719
|
5.47
|
1,175
|
8,752
|
66
|
14,294
|
|||||||||
|
Agaves
|
Inferred
|
3,085
|
495
|
1.92
|
655
|
49,081
|
191
|
64,984
|
|||||||||
|
Dolores
|
4,216
|
265
|
2.39
|
464
|
35,929
|
324
|
62,910
|
||||||||||
|
Lara
|
3,237
|
413
|
3.27
|
685
|
42,929
|
340
|
71,300
|
||||||||||
|
Morita
|
2,276
|
342
|
2.27
|
531
|
25,052
|
166
|
38,887
|
||||||||||
|
Santiago
|
551
|
488
|
1.85
|
642
|
8,642
|
33
|
11,370
|
||||||||||
|
Total
|
Inferred
|
13,365
|
376
|
2.45
|
581
|
161,633
|
1,054
|
249,451
|
Source: SRK, 2021
Notes:
| • |
Mineral Resources are not Mineral Reserves and do not have demonstrated economic viability. There is no certainty that all or any part of the mineral resources will be converted into mineral reserves in the future. There has been
insufficient exploration to define the Indicated and Inferred Resources tabulated above as Measured Mineral Resource. The Mineral Resource estimate may be materially affected by changes to the geological, geotechnical, and geometallurgical
models, infill drilling to convert material to higher classification, drilling to test for extensions to known Mineral Resources, collection of additional bulk density data, significant changes to commodity prices, and by environmental
permitting, legal, title, taxation, socio-political, marketing, or other relevant issues.
|
| • |
The Mineral Resources in this estimate were calculated using the Canadian Institute of Mining, Metallurgy and Petroleum (CIM), CIM Standards on Mineral Resources and Reserves, Definitions and Guidelines (CIM, 2014) prepared by the CIM
Standing Committee on Reserve Definitions and adopted by CIM Council.
|
| • |
Mineral Resources with reasonable prospects for eventual economic extraction stated as contained within estimation domains above 200 g/t AgEq cut-off.
|
|
SRK Consulting (U.S.), Inc.
SEC Technical Report Summary – Sinda Project
|
Page 30
|
| • |
AgEq calculations assumed silver price of US$18.00/oz and gold price of US$1500.00/oz., independent of potentially variable metallurgical recovery by metal, as recovery is assumed to be equal for both Ag and Au for purposes of AgEq.
|
| • |
All quantities are rounded to the appropriate number of significant figures; consequently, sums may not add up due to rounding.
|
Table 5‑2: Sinda Underground (U/G) Mineral Resource Estimate at 200 g/t AgEq Cut-off Grade as of February 16, 2023 – SRK Consulting (U.S.), Inc.
|
Classification
|
Vein
|
Tonnage
(000’s t)
|
Ag
Grade
(g/t)
|
Au
Grade
(g/t)
|
AgEq
Grade
(g/t)
|
Contained
Metal Ag
(000’s oz)
|
Contained
Metal Au
(000’s oz)
|
Contained
Metal AgEq
(000’s oz)
|
|||||||||
|
Indicated
|
Dolores
|
543
|
532
|
3.72
|
842
|
9,283
|
65
|
14,694
|
|||||||||
|
Total Indicated
|
543
|
532
|
3.72
|
842
|
9,283
|
65
|
14,694
|
||||||||||
|
Inferred
|
Adriana
|
--
|
--
|
--
|
--
|
--
|
--
|
--
|
|||||||||
|
Agaves
|
7,230
|
323
|
1.02
|
408
|
75,164
|
237
|
94,887
|
||||||||||
|
Dolores
|
4,457
|
235
|
2.12
|
411
|
33,674
|
303
|
58,942
|
||||||||||
|
Lara
|
7,102
|
293
|
2.04
|
463
|
66,950
|
465
|
105,722
|
||||||||||
|
Morita
|
3,036
|
353
|
2.04
|
523
|
34,479
|
199
|
51,049
|
||||||||||
|
Santiago
|
687
|
514
|
1.96
|
677
|
11,349
|
43
|
14,948
|
||||||||||
|
Total Inferred
|
22,511
|
306
|
1.72
|
450
|
221,617
|
1,247
|
325,549
|
Source: SRK, 2023
Notes:
| • |
Mineral Resources are not Mineral Reserves and do not have demonstrated economic viability. There is no certainty that all or any part of the mineral resources will be converted into mineral reserves in the future. There has been
insufficient exploration to define the Indicated and Inferred Resources tabulated above as Measured Mineral Resource. The Mineral Resource estimate may be materially affected by changes to the geological, geotechnical, and geometallurgical
models, infill drilling to convert material to higher classification, drilling to test for extensions to known Mineral Resources, collection of additional bulk density data, significant changes to commodity prices, and by environmental
permitting, legal, title, taxation, socio-political, marketing, or other relevant issues.
|
| • |
The Mineral Resources in this estimate were prepared in accordance with the Canadian Institute of Mining, Metallurgy and Petroleum (CIM) Standards on Mineral Resources and Reserves, Definitions and Guidelines (CIM, 2014) prepared by the
CIM Standing Committee on Reserve Definitions and adopted by CIM Council.
|
| • |
Mineral Resources with reasonable prospects for eventual economic extraction stated as contained within estimation domains above 200 g/t AgEq cut-off.
|
| • |
AgEq calculations assumed silver price of US$18.00/oz. and gold price of US$1500.00/oz., independent of potentially variable metallurgical recovery by metal, as recovery is assumed to be equal for both Ag and Au for purposes of AgEq.
Calculated AgEq = ((Ag grade * 18 ÷ 31.10348) + (Au grade * 1500 ÷ 31.10348)) ÷ (18 ÷ 31.10348).
|
| • |
All quantities are rounded to the appropriate number of significant figures; consequently, sums may not add up due to rounding.
|
Both of the historical estimates were reported following Canadian National Instrument 43-101 disclosure guidelines. The technical reports were only for internal use and not disclosed publicly, as
the Company was private and not subject to any disclosure responsibility within a particular jurisdiction.
The June 2021 historical estimate (Table 5‑1) was supported by a total of 152,642 m from
148 drillholes. The February 2023 historical estimate (Table 5‑2) was supported by a total of
232,522 m from 221 drillholes, an increase of approximately 80,000 m of drilling. The current Mineral Resource Estimate (effective November 24, 2025) discussed in this TRS uses the same drilling
data and block grade estimates as the February 2023 historical estimate but reflects the recent update to the AgEq calculation formulas. Since the previous 2021 estimate, total contained AgEq ounces have increased 11% for Indicated and 48% for
Inferred, based on the drilling additions and updates to the cut-off grade assumptions.
|
SRK Consulting (U.S.), Inc.
SEC Technical Report Summary – Sinda Project
|
Page 31
|
| 6 |
Geological Setting, Mineralization, and Deposit
|
| 6.1 |
Regional, Local, and Property Geology
|
| 6.1.1 |
Regional Geology
|
The Sinda Project lies within and near the boundary of the Mesa Central physiographic province where it joins the easterly-trending Trans-Mexican Volcanic Belt, about 250 km northwest of Mexico
City. The Mesa Central province is an elevated plateau of Cenozoic volcanic and volcaniclastic rock (66 mega annum [Ma] to present) located in central Mexico. It is bounded to the north and east by the Sierra Madre Oriental, to the west by the
Sierra Madre Occidental, and to the south by the Trans-Mexican Volcanic Belt.
Rocks within the Mesa Central province consist of a Paleocene to Pliocene sequence of dacite-rhyolite, andesite, and basalt flows and tuffaceous units, with related intrusive bodies and
intercalated local basin fill deposits of coarse sandstones and conglomerates. This Cenozoic volcanic-sedimentary sequence unconformably overlies an allochthonous package of deformed and weakly metamorphosed Late Jurassic through Cretaceous marine
mafic volcanic and turbidite sediments.
The Sinda Project is 45 km southeast of the Guanajuato Mining District. As the vein orientations, mineralogy and host rocks are similar in the two districts, many geologists have concluded that the
Sinda veins are very likely southeast continuations along strike of the Guanajuato veins. Figure 6‑1 shows the regional geological setting of Sinda.
The Guanajuato district is situated within the Sierra de Santa Rosa, a northwest-trending (N45°W) anticlinal structure approximately 100 km long and 20 km wide. This mining district, a globally
significant epithermal camp, is estimated to have produced over one billion ounces Ag and five million ounces (Moz) Au from three north-west trending vein systems. The Sierra, Veta Madre, and La Luz precious metal veins at Guanajuato were dated at
27.4 Ma (Gross, 1975). The deposit is interpreted by Sinda to have a similar age of mineralization as Guanajuato.
|
SRK Consulting (U.S.), Inc.
SEC Technical Report Summary – Sinda Project
|
Page 32
|
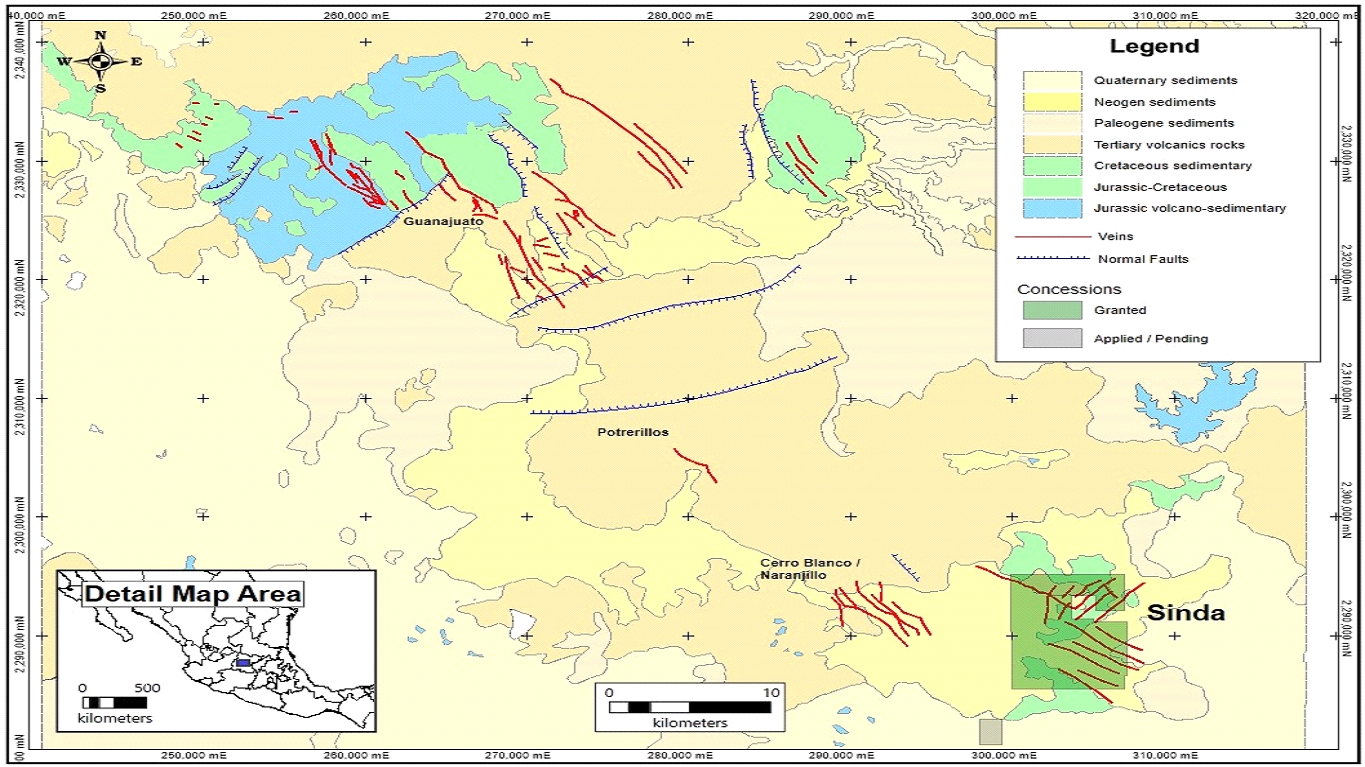
Source: SRK, 2025
|
SRK Consulting (U.S.), Inc.
SEC Technical Report Summary – Sinda Project
|
Page 33
|
The Sinda Project is underlain by weakly to intensely folded and faulted Jurassic-Cretaceous marine sediments and interbedded subaqueous mafic lava flows (252 Ma to 66 Ma) of the Esperanza
Formation. These same host rocks represent approximately two-thirds of precious metal production within the nearby Guanajuato district.
The basal sequence is cut by a variety of intrusive dikes and sills, ranging in composition from lesser monzonitic to a significant dioritic component. A rhyolitic dome is evident in the
southern portion of the Sinda area. The more felsic monzonite intrusions are believed to be Tertiary in age and related to the dome. While the more mafic and somewhat metamorphosed diorite intrusions are believed to be Jurassic-Cretaceous
in age, like the underlying metasediments and volcanic rocks. Figure 6‑2 shows the local geological setting of Sinda.
The mineralization at Sinda is hosted in classically zoned, low-sulfidation epithermal veining hosted within the Jurassic Cretaceous metasediments and volcanic rocks. The Sinda veins have
poor surface exposure with most veins visible only as short (<10 m long) outcrops of narrow veinlets (<10 cm wide) that rarely reach 0.5 m thick.
The veins on surface (1900 to 1960 masl) present consistently as grey chalcedony, often crudely banded with coarse crystalline calcite, and often display quartz pseudomorphs after calcite.
Iron oxides are absent to rare on outcrops and assay values are not typically remarkable. However, in the interval between the elevations of 1,550 to about 1,200 masl, the vein mineralogy changes to gangue minerals of chalcedony, minor
adularia, calcite and amethystine quartz, fluorite, and locally (especially in deeper holes) arsenopyrite and marcasite. Minerals of economic significance are acanthite/argentite, aguilarite, proustite, polybasite and gold, with minor
galena, sphalerite, chalcopyrite, and native silver. Veins show well-developed banded “ginguru” textures in the high-grade drill core intervals.
Figure 6‑3 shows examples of veins at Sinda.
|
SRK Consulting (U.S.), Inc.
SEC Technical Report Summary – Sinda Project
|
Page 34
|
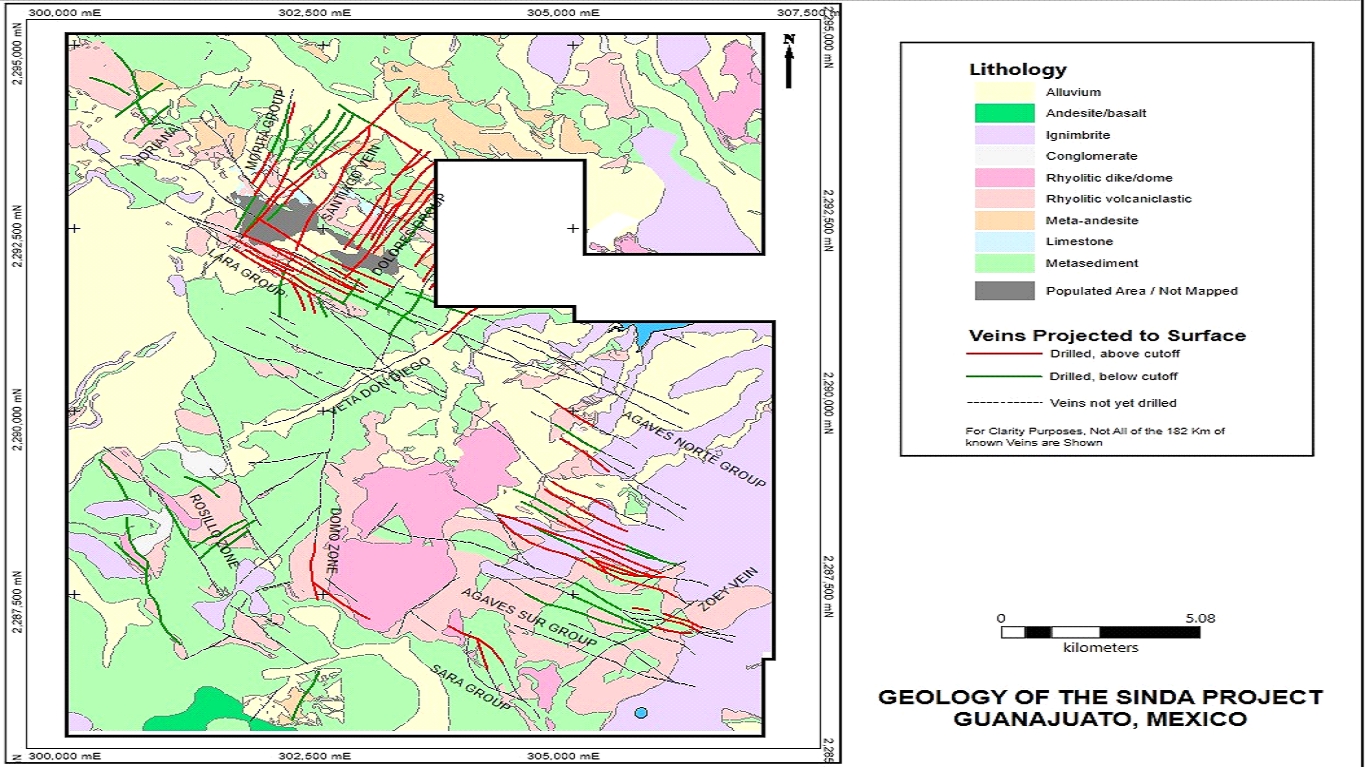
Source: SRK, 2025
|
SRK Consulting (U.S.), Inc.
SEC Technical Report Summary – Sinda Project
|
Page 35
|
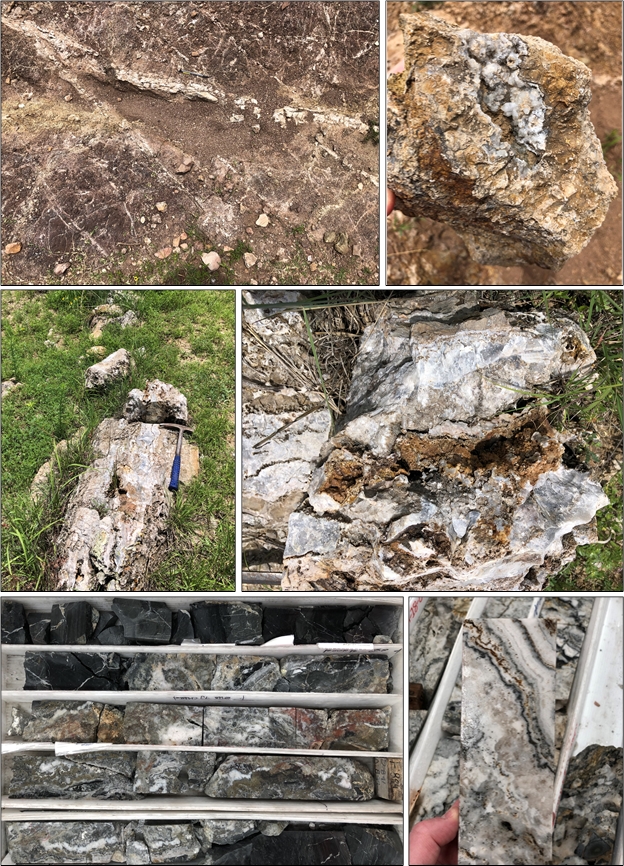
Source: SRK, 2025
Notes: Upper four photographs are examples of surface outcrop exposure in Caracol, lower left: CEMO-19-003 drill core in Morita vein at ~895 m, lower right: CECA-18-001 drill core in
Dolores vein at ~600 m (see Table 7-2 for assay ranges).
|
SRK Consulting (U.S.), Inc.
SEC Technical Report Summary – Sinda Project
|
Page 36
|
The Sinda deposits are comprised of multiple low-sulfidation epithermal vein systems with high-grade Ag and Au mineralization, along with accessory Cu, Pb, and
Zn. The Company considers Sinda to be an extension of the Guanajuato Trend, which hosts many Ag-rich, polymetallic mines exploiting epithermal veins. Understanding of this deposit type is well advanced with many technical and academic
publications detailing alteration, litho-geochemical controls, spatial mineral associations, and genesis (e.g., Buchanan, 1981).
Epithermal gold-silver deposits form in the uppermost parts of the crust, at less than about 1,500 m below the water table and contain gold and/or silver minerals in structurally controlled
veins and breccias and disseminated in larger host rock volumes. These deposits are distributed throughout the world, most commonly along convergent plate margins. Known epithermal gold-silver deposits range in size from tens of thousands
to greater than 100 Mt of ore. Gold contents range from anomalous (0.1 g/t Au) to high grade (approximately 49 g/t Au at Hishikari, Japan). Silver contents of less than 1 g/t Ag to several thousand parts per million (ppm) are common.
Epithermal deposits are mined primarily for their gold and/or silver contents, although copper, lead, zinc, and/or mercury are important by-products in some deposits.
Epithermal deposits are broadly divided into three subtypes with type examples and typical mineral assemblages, as follows:
|
•
|
Low-sulfidation: adularia-sericite; Comstock, Creede, Midas, McLaughlin, USA; Sado, Hishikari, Japan; mineral assemblage: quartz ± calcite ± adularia ± illite (near-neutral pH)
|
|
•
|
Intermediate-sulfidation: adularia-sericite; Fresnillo, Zacatecas, Guanajuato, Pachuca, Mexico; Waihi, New Zealand; mineral assemblage: quartz ± calcite ± adularia ± illite (near-neutral pH)
|
|
•
|
High-sulfidation: acid-sulfate; Paradise Peak, Summitville, USA; Mulatos, Mexico; El Indio, Chile; mineral assemblage: quartz + alunite ± pyrophyllite ± dickite ± kaolinite (acidic pH)
|
Epithermal gold-silver deposits comprise vein, disseminated, and breccia deposits most hosted in broadly contemporaneous volcanic and volcanoclastic rocks. These deposits form at shallow
depths (<1,500 m) and at temperatures less than 300°C.
Epithermal gold-silver deposits form in a wide range of tectonic environments. They are most common in subaerial volcanic arcs at convergent plate margins in continental and oceanic
settings. The deposits form primarily from subaerial hydrothermal systems driven by magmatic heat and, less commonly, by deeply circulating groundwater rising along basin-bounding faults. Deposits range from Archean to Quaternary in age,
although because of their formation at shallow depths and their poor preservation potential, most known deposits are Cenozoic.
A strong vertical zoning, common to many epithermal districts, is well-displayed at Sinda with the most consistently mineralized interval, the Favorable Interval (Buchanan, 1981), topping
out about at 450 m below the current surface and extending down, dip for 250 to 450 m. Above this Favorable Interval, the veins are thinner, silica is present mostly as chalcedony, calcite is more abundant than chalcedony, and well
mineralized vein intercepts are exceptionally rare. At depth within the Favorable Interval, not all vein intercepts are above a reasonable CoG with only approximately half of the veins encountered assaying above 200 g/t AgEq over a minimum
2 m true thickness.
|
SRK Consulting (U.S.), Inc.
SEC Technical Report Summary – Sinda Project
|
Page 37
|
The Late Jurassic-Cretaceous Esperanza Formation sediments comprise a thick package of shales, phyllites, conglomerates and minor limestone sequences, interbedded with contemporaneous
andesite flows and tuff/pyroclastic interbeds. These beds are commonly folded, often intensely, and the foliation in the sediments is often cut by high angle faults parallel to bedding planes. Many of these faults are believed to be related
to Laramide thrusting events (Ruvalcaba-Ruiz and Thompson, 1988). After deposition, a long period of subaerial erosion occurred making a marked unconformity.
Above this irregular erosional surface, in the early to mid-Oligocene, rhyolitic ashflow tuff sheets spread out from numerous subaerial volcanic centers, covering the Jurassic-Cretaceous
meta-sediments and volcanic rocks. The felsic intrusive and volcanic event occurred during a period when a tensional stress field replaced the earlier compressive stress (thrusting) regime. This environment resulted in numerous
northwest-trending normal faults that crosscut all older rock units. Additionally, the faulting also cut the earliest basal Oligocene ashflow tuff units immediately lying atop the older, now-eroded sediments and volcanics. The structures
that formed during this Early to Mid-Oligocene tensional/eruptive event host the Sinda mineralization.
Felsic eruptions continued to lay out additional rhyolitic ash flow sheets, effectively masking all underlying structures and older rock units with a
relatively thin cover (20 to 100 m) of post-mineral ignimbrite. This post-mineral ignimbrite was partially eroded, exposing the faulted metasediments/volcanics below. However, the ignimbrite masks about 25% of the land position at higher
elevations in the eastern and south-eastern portions of the Project area. Drill results indicate the veins continue below the post-mineral cover. Figure 6‑4 through Figure 6‑6 show a generalized
geologic map, local geologic cross-section, and stratigraphic column for the Sinda deposit, respectively.
|
SRK Consulting (U.S.), Inc.
SEC Technical Report Summary – Sinda Project
|
Page 38
|
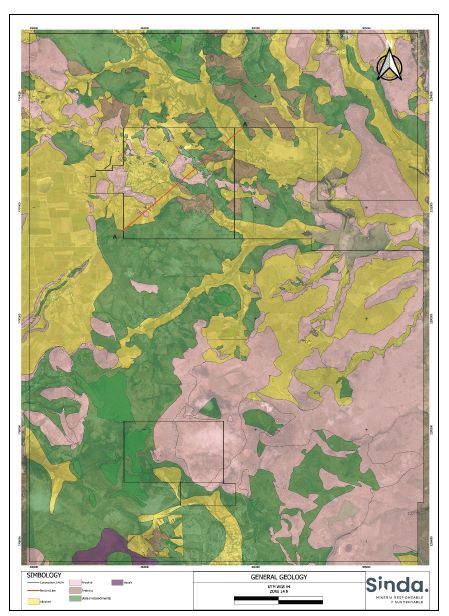
Source: SRK, 2025
Notes: A to A’ cross-section location is depicted in red.
|
SRK Consulting (U.S.), Inc.
SEC Technical Report Summary – Sinda Project
|
Page 39
|
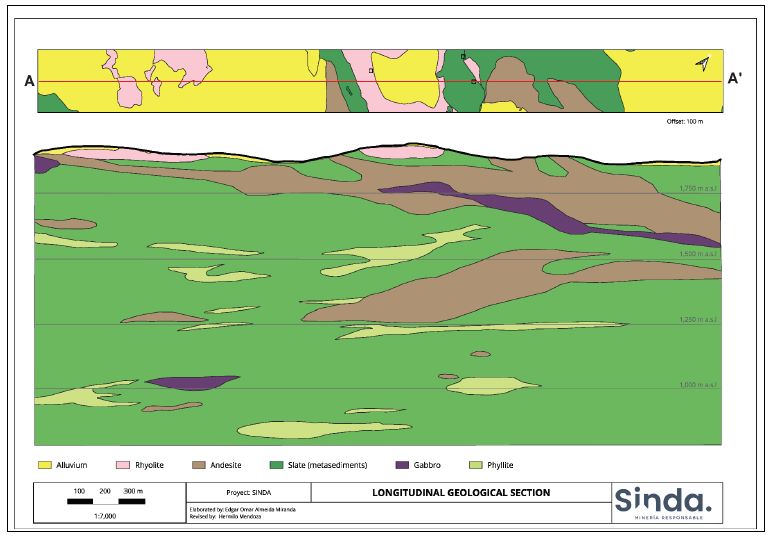 Source: SRK, 2025
Figure 6‑5: Local Geological Cross-Section at Caracol, Looking Northwest
|
SRK Consulting (U.S.), Inc.
SEC Technical Report Summary – Sinda Project
|
Page 40
|
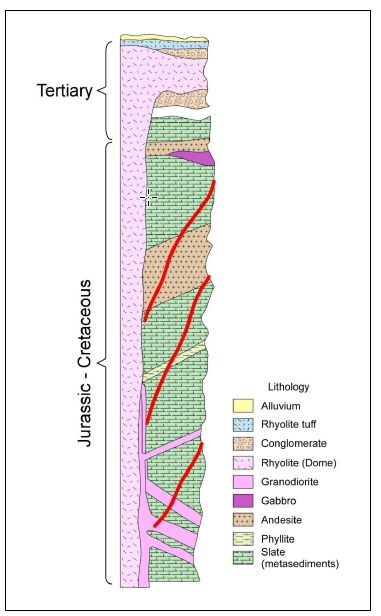
Source: SRK, 2025
Notes: The red lines represent silver vein mineralization at Sinda.
|
SRK Consulting (U.S.), Inc.
SEC Technical Report Summary – Sinda Project
|
Page 41
|
The primary method of exploration at Sinda has been drilling. Historic exploration by Golden Minerals (Golden) commenced in 2012 with large-scale regional mapping and culminated in
the drilling of five diamond drill holes. Beginning in 2016, Sinda initiated prospecting efforts to recognize and assess potential mineral resources in the Project area.
Previous exploration drilling by Golden demonstrated that anomalous mineralization was present at depth, even though surface sample assays were known to be typically barren. Due to the very
large number of veins, and a large total strike length, the Company became interested in testing the Sinda district. Exploration commenced in earnest in 2016 with surface mapping of the entire concession.
On surface, outcrops of the Sinda veins are ubiquitously barren to low grade. Out of over 900 surface samples obtained during early exploration, only five grab samples reported values >1
g/t Au and two samples assayed >100 g/t Ag. The remaining surface samples of veins reported assay results below laboratory detection limits for Au and Ag. Due to the paucity of outcrops and low geochemical trace element results, it was
not deemed prudent to use trenching and/or geophysics to help outline target zones. Thus, exploration progressed immediately to a drilling program.
Target selection followed up on areas prospective for mineralization that were identified from geological mapping and observations at surface. Surface samples were obtained as grab samples
from prospective vein outcrops. Since surface exposure of mineralized veins is limited, veins have been mainly identified through drilling blind targets at depth. In certain cases, clay alteration related to mineralization and associated
with historic kaolin production follow trends that are useful for vein targeting at depth.
Mapping and rock chip sampling began at a scale of 1:10,000. However, it was soon evident that insufficient detail was being
recorded and thus the program was revised to mapping at a scale of 1:2,500. Once the mapping had been completed and rock chip sample assay results reported, the data were digitized, and the Company outlined drill targets.
Veins that carry potentially mineable mineralization at depth are wider and often reach “bonanza” grades over shorter intervals. In the Favorable Interval at Sinda, silica, mostly as
micro-crystalline quartz, becomes more dominant than calcite, precious metal grades are elevated, and base metals are minor (usually < 1% Pb+Zn total). Base metals content increases with depth in the veins below the Favorable Interval,
often without the strong silver and gold values occurring above the base metal horizon.
|
SRK Consulting (U.S.), Inc.
SEC Technical Report Summary – Sinda Project
|
Page 42
|
Within the Favorable Interval (1,550 to 1,200 masl), the average vein true thickness varies from 2 to 6 m and ranges from discrete veins of 0.5 m or less, up to wider zones comprised of
multiple discrete veins as wide as 7.5 m. The overall average true thickness of veins with potentially economic grades is approximately 2.5 m.
An important aspect of all Sinda veins drilled to date is that for each vein that can be mapped on surface, numerous additional, subparallel veins are encountered during drilling that do
not crop out. These "blind" veins are not visible on the surface. Overall averages of the drill results show about four blind veins for each mapped vein, which equates to potentially five individual structures per vein noted in surface
mapping. Drilling data indicate approximately half of these blind veins are mineralized above potential mining CoGs at a minimum of 2 m true thickness.
To date, Sinda geologists have recognized 135 individual veins that can be identified either by mapping or are blind veins encountered in drilling. The total number of kilometers of veins
identified to date are estimated at 182 km, but currently only 38% (69 km) of that total strike length has been drill-tested. The Company considers the potential total strike length of identified veins at Sinda
will likely exceed 200 km, as the project progresses.
In 2015, Golden Minerals completed five diamond drill holes totaling 2,679 m at Sinda (Golden, 2018). Four of the initial drill holes were too short to encounter the Favorable Interval and
thus had no intersections that were above CoG. The fifth drill hole was deeper and at 700 m depth downhole encountered a vein grading 403 g/t AgEq over a true thickness of 2 m.
Three concessions and the exploration and exploitation rights on the El Milagro concession were acquired from Golden in 2016 and transferred to Sinda in 2018. All subsequent Project
drilling campaigns have been completed by the Company, including activities on the La Paloma concession acquired in 2020. The fourth Sinda drill hole completed in 2017 intersected positive
results. Drill hole CE-17-004 intersected 2.42 m true thickness of 405 g/t AgEq and a deeper blind vein of 2.49 m at 305 g/t AgEq. These intersections were followed-up by CE-17-005, which intersected 3.94 m true thickness of 1,435 g/t AgEq.
The initial drill testing helped define the top and bottom of the Favorable Interval at Sinda, and subsequent drill holes had a high rate of successful vein intersections. Subsequently, the Company increased the number of drill rigs to test
as many of the veins as possible and is continuing to drill across the Project.
Since drilling commenced in 2015, a total of 232,522 m in 221 drill holes were completed at Sinda as of the January 11, 2023, database cut-off date. No
drilling has occurred within the Sinda Resource area since the most recent database update. Within the Resource area at Sinda, a subset of 178 sampled drill holes defined the estimation domains with a total of 7,399.1 m of intercepts
crossing the modeled vein wireframes. In total, 1,760 individual vein width composites define 112 vein wireframes in the Resource area. Outside of the Sinda Resource area, 39 drill holes explored additional potential vein systems that do
not define any current estimation domains. No previous artisanal metal mining operations, nor additional historical drilling campaigns are known to have occurred at Sinda.
A location map of Sinda drill hole collars is provided in Figure 7‑1. Representative drill hole cross-sections through the Caracol area and Agaves are provided as Figure 7‑2 and Figure 7‑3,
respectively.
|
SRK Consulting (U.S.), Inc.
SEC Technical Report Summary – Sinda Project
|
Page 43
|
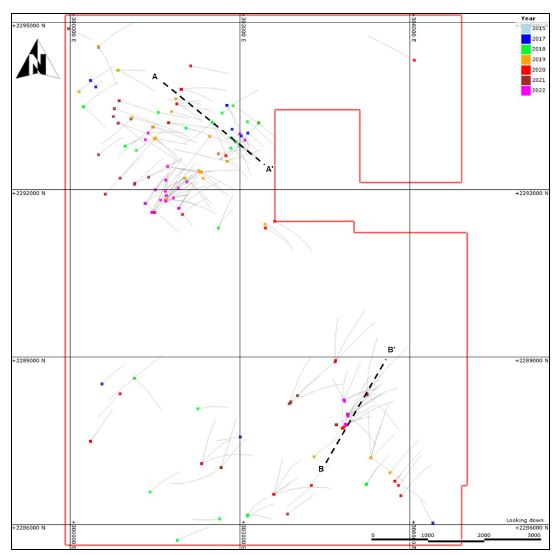
Source: SRK, 2025
|
SRK Consulting (U.S.), Inc.
SEC Technical Report Summary – Sinda Project
|
Page 44
|
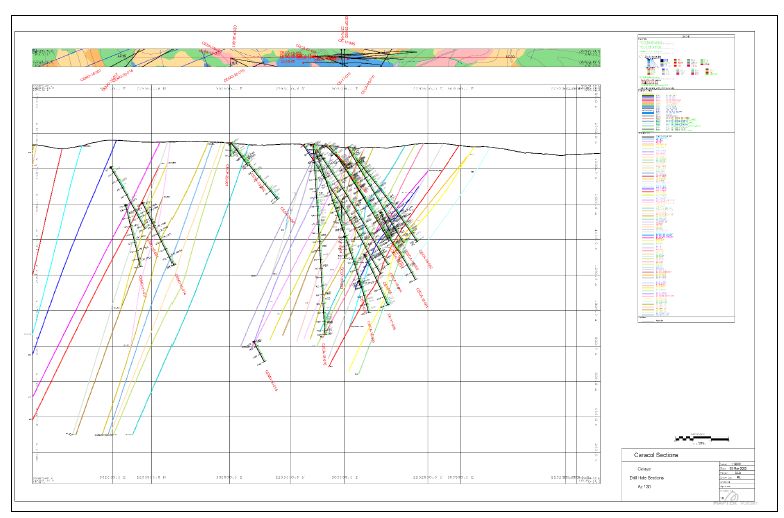
Source: SRK, 2025
|
SRK Consulting (U.S.), Inc.
SEC Technical Report Summary – Sinda Project
|
Page 45
|
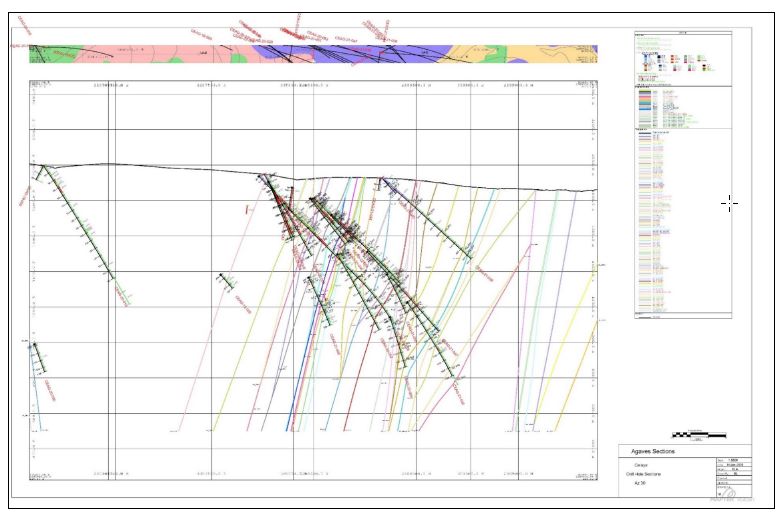
Source: SRK, 2025
|
SRK Consulting (U.S.), Inc.
SEC Technical Report Summary – Sinda Project
|
Page 46
|
Since 2016, all drilling at Sinda has been performed by external contractors with diamond core rigs under the direction of local staff. Drill holes are typically collared with PQ-diameter
core (85 mm) and advanced to less than 300 m prior to setting temporary casing. PQ core length averages approximately 172 m across all drill holes and equates to 16.3% of all drilling meters. The majority of the drill holes are completed
with HQ-diameter core (63.5 mm) and, if required, reduced to NQ size (47.6 mm) to complete deeper holes. As a proportion of all drilling meters, respectively, HQ core accounts for 74.7% and NQ core comprises approximately 9.0%. Table 7‑1
presents the Sinda drill holes by campaign year and core diameter drilled.
|
Year
|
Completed Drill Holes
|
PQ Meters
|
HQ Meters
|
NQ Meters
|
Total Drilled (m)
|
|
2015
|
5
|
-
|
2,678.55
|
-
|
2,678.55
|
|
2017
|
14
|
758.25
|
10,712.90
|
619.00
|
12,090.15
|
|
2018
|
44
|
6,014.20
|
34,102.05
|
1,269.30
|
41,385.55
|
|
2019
|
39
|
5,975.25
|
32,617.65
|
3,485.25
|
42,078.15
|
|
2020
|
43
|
8,319.65
|
38,377.05
|
4,392.25
|
51,088.95
|
|
2021
|
41
|
9,705.05
|
29,602.40
|
9,388.20
|
48,695.65
|
|
2022
|
38
|
7,203.10
|
25,558.75
|
1,743.20
|
34,505.05
|
|
Total
|
221
|
37,975.50
|
173,649.35
|
20,897.20
|
Source: SRK, 2025
Notes: Tabulation includes only drill holes completed by the data cut-off date of January 11, 2023.
Several in-country drilling contractors have been utilized over the course of the project, including BD Drilling, Intercore, Eco Drilling (formerly Moles), and Major Drilling. All
contractors have had local operations and support services located in Mexico during the Sinda campaigns. Track mounted drilling rigs are used, and a typical rig model is CSD1800X from Coretech Drilling Equipment Company, Ltd, although
tooling has varied by contractor and availability.
Level drilling platforms were installed by heavy equipment, where necessary, with the appropriate disturbed dimensions for the drilling and accessory
equipment. Sufficient space is provided for temporary mud/cuttings tanks, and all drilling fluids are contained for offsite disposal. To conserve water and reduce volume of cuttings for disposal, two AMC solids removal units (SRUs) have
been active in recent drilling campaigns. Figure 7‑4 depicts an example of a core drilling platform at Sinda.
Generally, multiple drill holes are completed from each drilling platform at different azimuths and dips. Overall, the drill holes have inclinations ranging between 40° to 85° and averaging 51.9°. Azimuths are variable across the Project with drill holes ranging between 0° to 72° in a general north-northeast direction (approximately 53% of the total), 77°
to 160° in an east-southeast direction (38%), and lesser drill holes in a west-northwest orientation of 215° to 333° (10%), depending on the vein system targeted.
|
SRK Consulting (U.S.), Inc.
SEC Technical Report Summary – Sinda Project
|
Page 47
|
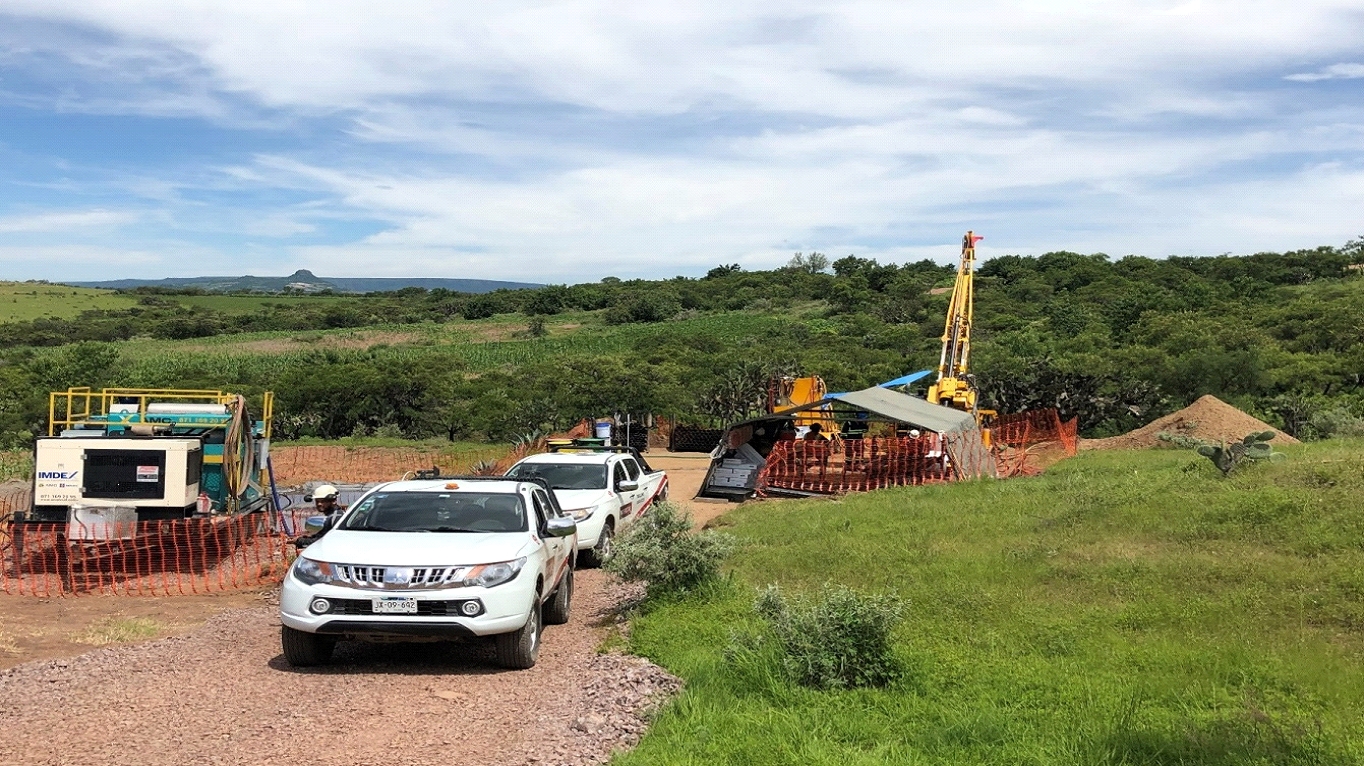
Source: SRK, 2025
Coordinates were recorded in Universal Transverse Mercator (UTM) coordinate system, World Geodetic System 1984 (WGS-84) datum, Zone 14. Collar locations were surveyed using differential GPS
equipment by local professional surveyors. At each platform, Sinda geologists confirmed the planned collar locations with handheld global positioning system (GPS) units and checked drill hole orientations prior to drilling.
Currently, collar surveying occurs in batches several times per year. For eleven recently completed drill holes in the current Resource area, no survey measurements were available at the
database cut-off date. The collar coordinates for these drill holes were assigned from the detailed topographic surface or from previously surveyed holes on the same drilling platform, as many were twin drill holes. The lack of final survey
for these limited drill holes is not considered material.
Drill Hole collar locations are marked routinely at the surface with PVC pipe oriented to drilling dip in a cement monument that is labeled with the drill hole name. During the July 2021
SRK QP site visit, multiple historical drill hole markers were observed that were appropriately located according to field maps.
To ensure the availability of detailed Project topography information, a satellite survey of 100 km2 was
produced by Photosat in January 2021. A 1 m stereo satellite survey and 50 cm precision orthophoto were produced from 50 cm pixel resolution WorldView-3 stereo satellite photos. The satellite photos were acquired on December 31, 2020. The 1
m satellite survey and 50 cm precision orthophoto were produced using PhotoSat's proprietary Geophysical Satellite Processing system. The stereo satellite survey project was referenced to 23 survey points provided by Sinda.
|
SRK Consulting (U.S.), Inc.
SEC Technical Report Summary – Sinda Project
|
Page 48
|
Sinda completed downhole trajectory deviation surveys for each drill hole. During drilling, single-shot measurements are recorded every 50 m with a REFLEX EZ-TRAC tool. A multi-shot survey
is conducted downhole for comparison upon completion of drilling. The drillers record survey measurements on individual cards after each 50 m survey, which are collected and stored by the site geologists. Magnetic readings and survey
information are uploaded and stored in the Sinda database.
In late 2020, Sinda began testing IMDEX HUB for online collection and approval of downhole survey data directly from the drillers. This process is planned to replace the current paper trail
and will allow direct import of survey data to the GeoSpark database.
According to the survey data provided, SRK confirmed that measurements were obtained on regular intervals, at least every 50 m downhole. All drill holes in the database have recorded
downhole survey information.
Drill core runs were removed from the core tube by the drill crew and placed in plastic corrugated core boxes that hold approximately
3 m. The core boxes were labeled by the drill crew with hole ID and box number. Drill hole depths for each box are measured and labeled later by geologists in the core warehouse. Wooden core blocks are marked by the drill crew with the run
length and depth and inserted into the core boxes at the end of each drill interval. Drill core was transported from the rigs by the drill crew via pickup truck to the core logging facility at the end of each
shift.
Sinda geologists cleaned and logged the drill core samples prior to sampling. Drill core was photographed wet with signage depicting drill hole and from/to
depth as a record of condition prior to sample collection. The photographs are reviewed by geologists for clarity and image files are re-named by drill hole ID and box number prior to uploading to the Sinda server. Geologists check the
drill run blocks and mark every downhole meter on the core with indelible markers. Based on geological criteria, sample cutting marks and orientation lines (perpendicular to veins) were made along the length of the core samples by site
geologists. The sample intervals were marked on the inside of each core box. Core samples were selected using as fundamental criteria that the samples were minimum 0.5 m to maximum 2.0 m in length. The sample intervals are measured to the
hundredths and typically rounded to 0.05 m intervals considering the geology and mineralized intervals observed during logging. If encountered, sampling does not cross over changes in drill core diameter.
Prior to about August 2019, selective sampling of vein mineralized intervals was practiced. Currently, sampling is conducted continuously downhole. The sampling intervals chosen allow
identification of mineralized vein areas, as well as determining the presence of geochemical anomalies and verifying the degree of dilution into the vein footwall and hanging wall. Generally, core recovery was considered good with no
significant core losses observed. The average recovery is 92% from geotechnical data collected.
|
SRK Consulting (U.S.), Inc.
SEC Technical Report Summary – Sinda Project
|
Page 49
|
Core sampling was completed by sawing the drill holes in half with 14-inch MK Electric diamond blade core saws (model #160634-14 MK-5005S) along the cut line marked by the site geologists.
The other half was returned to the core box for permanent storage onsite. Four saws were active at the core warehouse during the SRK site visit. Each unit is labeled and used only for certain Project areas to prevent potential
cross-contamination, as well as flushed with water between sample cuts. All cuttings from core sampling are contained in sumps for offsite disposal. In intervals with intensely fractured rock, the splitting procedure involves dividing the
core sample to obtain a representative fraction for assay and leaving the remainder in the core box. After cutting, each box is covered with its matching lid and delivered to the core sampling crews. The core cutting area is monitored and
recorded by closed-circuit security cameras that are viewable online by senior Sinda staff.
Experienced sampling technicians follow detailed written Sinda sampling protocols, are monitored by onsite geologists, and checked for accurate sampling. Additionally, the entire core
sampling area is monitored and recorded by a closed-circuit security camera system. Drill core is placed in an unused clean plastic sample bag labeled with the sample number and sealed using industrial zip
ties. Triplicate sample tag booklets are used to record the sample intervals. Individual tags are placed in the core box at the sample interval and in the sample bag for assay. The drill hole number, length, and sample number are recorded
in a paper sampling register that is entered into the Sinda database. After sampling, core boxes were photographed a second time to show the split core and sample tags/numbers. Photographs of the general core sampling procedures are shown
in Figure 7‑5.
Multiple individual sample bags are placed in a labeled polyethylene bag for delivery to the preparation laboratory. Pallets of samples are covered with tarps and stored by individual drill
hole until laboratory pickup is scheduled. The lab is dispatched for sample pickup approximately every ten days, or when the maximum sample shipping allotment is prepared (approximately 650 sample bags). Records of sample preparation,
analysis requested, quality assurance and quality control (QA/QC) sample insertion and sample shipment are maintained on paper logs.
|
SRK Consulting (U.S.), Inc.
SEC Technical Report Summary – Sinda Project
|
Page 50
|
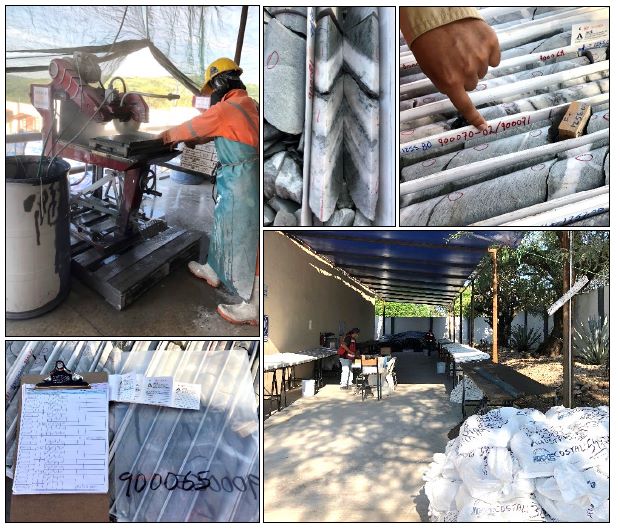
Source: SRK, 2025
Notes: Clockwise from upper left: Core sawing, split core interval, sample markings on core box, core sampling area with bags for laboratory dispatch, and sample register/tags.
All split core is stored on metal racks in secured covered areas with controlled access, as depicted in Figure 7‑6. Approximately 105 km of split core is
stored in the main Sinda “bodega” where sampling and logging is conducted. Sinda built a new offsite secured core storage facility in Comonfort, northeast of the Project. The facility has a capacity for over
500 km of core and was completed in 2022. All core boxes have been relocated to the Comonfort warehouse.
|
SRK Consulting (U.S.), Inc.
SEC Technical Report Summary – Sinda Project
|
Page 51
|
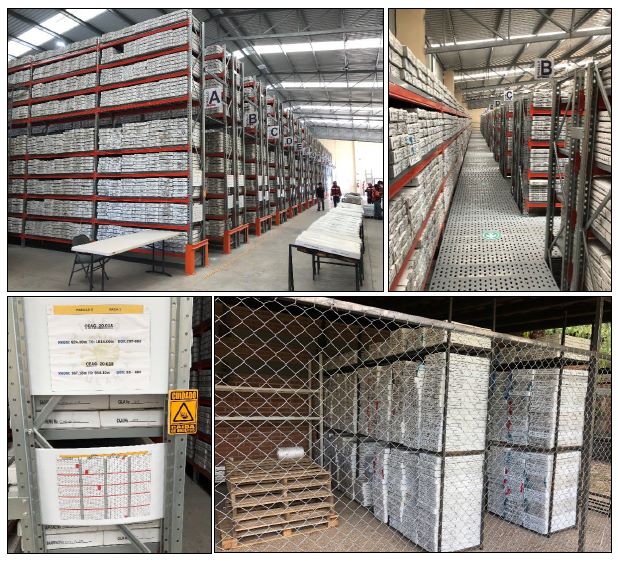
Source: SRK, 2025
Notes: Clockwise from upper left: Main core storage warehouse, mezzanine level of core storage, secure storage of vein intervals at Sinda office (from 2021 prior to relocation to
Comonfort), and storage rack labeling system.
Prior to sampling, Sinda geologists log whole drill core and record observations onto large-format paper logging forms that record 20 m of core per page.
Detailed core logging included descriptions of lithology, alteration, mineralization, and structure. Graphical logs are hand-drawn and colored for each drill hole. Each evening, the paper logs are coded by the individual geologists into a
relational database constructed by GeoSpark Consulting. A short trial of ten drill holes were logged directly into the database, but paper logs were preferred for allowing another QA/QC check on the data during the separate manual entry.
Logging follows written protocols, including common naming, abbreviation, and coloring conventions. The geological standards are well developed, and virtual copies are easily accessible
from a QR code posted in the drill logging area. Polished billets of typical lithologies are labeled and displayed for comparison to core during logging to ensure consistency of interpretations.
|
SRK Consulting (U.S.), Inc.
SEC Technical Report Summary – Sinda Project
|
Page 52
|
Geotechnical logging is conducted to record RMR (Rock Mass Rating) geomechanical index of Bieniawski (1989) and the Q index of Barton, et al (1974). The geotechnical parameters logged are
the following: recovery, RQD (Rock Quality Data), spacing between structures, condition of structures, and number of structural sets. These data are maintained in a separate database from the geological characterization.
The geologists provide weekly logging updates to the database manager. Presently, no backlog of drill core is maintained, and logging has kept pace with drilling rates. With rotating
schedules, the geologists cross-over for ten days each month and are careful to transfer and coordinate information between shifts, so that no data losses occur. In the San Miguel de Allende office, binders of information are kept by drill
hole that catalog all original paper data, including logging sheets, sample sheets, and survey information. These primary data are backed up as digital scans and duplicated as entries into the final Sinda database.
Drilling in vein-hosted deposits is complicated by the angle of drill holes interception. Where possible, Sinda targeted veins at a low angle for drill hole interceptions that approached
perpendicular to the veins. In many cases, the length of sample intersections (apparent width) was greater than the true thickness measured perpendicular to the modeled vein wireframes. Apparent width variation from the measured downhole
length was considered during geological modeling. No other drilling, sampling, or recovery factors were identified that could materially affect the accuracy and reliability of the results.
Predominantly, the design of the drilling grid was prepared as a function of the attitude of the mineralized structures. Most of the drill holes were angled from vertical to intercept the
vein system at close to perpendicular. Drill hole spacing is approximately 100 m, or less, in the well-informed areas (e.g., Dolores main vein) and extends over 300 m in other Project areas, depending on the targeted structures.
A summary of significant drilling intercepts is provided in Table 7‑2, which represents the top ten composites used in the resource estimate ranked on capped AgEq values. The length of
sample intersections (apparent width) is greater than the true thickness measured perpendicular to the modeled vein wireframes. On average, the measured true vein width of these significant intercepts is about 24% less than the apparent
width of the downhole sample intervals.
All summary intervals are reported as raw uncapped assay values and composited proportionally to the length of the individual samples, which included allowance for lower grade dilution
zones, if encountered. This matches the modeling methodology, which emulates mineable widths targeting a minimum of approximately 2 m true thickness. Many of the internal intervals within these high-grade intercepts will be capped as
outliers prior to compositing and estimation. The intercept values have been rounded to reflect the relative accuracy of a single assay interval.
|
SRK Consulting (U.S.), Inc.
SEC Technical Report Summary – Sinda Project
|
Page 53
|
|
Area
|
Hole ID
|
From
|
To
|
Ag (g/t)
|
Au
(g/t) |
AgEq (g/t)
|
Apparent
Width (m) |
True
Width (m) |
||
|
Dolores
|
CECA-18-001
|
597.25
|
602.0
|
6,188
|
26.9
|
8,500
|
4.75
|
4.53
|
||
|
including
|
597.25
|
598.75
|
15,893
|
72.8
|
22,149
|
1.50
|
||||
|
Lara
|
CETA-22-040
|
836.4
|
846.6
|
2,810
|
9.0
|
3,580
|
10.20
|
4.45
|
||
|
including
|
841.15
|
845.5
|
6,127
|
20.1
|
7,855
|
4.35
|
||||
|
Lara
|
CETA-20-015
|
673.15
|
676.6
|
1,518
|
5.7
|
2,008
|
3.45
|
2.35
|
||
|
Agaves
|
CEAG-19-012
|
1086.3
|
1091.15
|
1,931
|
0.9
|
2,010
|
4.85
|
3.64
|
||
|
including
|
1089.35
|
1091.15
|
4,340
|
1.1
|
4,432
|
1.80
|
||||
|
Lara
|
CETA-22-033
|
860.65
|
864.85
|
1,059
|
9.1
|
1,837
|
4.20
|
2.65
|
||
|
including
|
861.6
|
862.6
|
3,110
|
31.3
|
5,800
|
1.00
|
||||
|
Lara
|
CETA-18-003
|
931.5
|
934.8
|
635
|
12.2
|
1,684
|
3.30
|
2.48
|
||
|
including
|
932.0
|
934.1
|
901
|
16.6
|
2,328
|
2.10
|
||||
|
Dolores
|
CECA-18-011
|
383.7
|
386.8
|
1,013
|
10.7
|
1,932
|
3.10
|
2.64
|
||
|
including
|
383.7
|
384.4
|
4,300
|
45.3
|
8,193
|
0.70
|
||||
|
Morita
|
CEMO-19-003
|
893.55
|
897.1
|
1,980
|
6.6
|
2,548
|
3.55
|
2.92
|
||
|
including
|
893.55
|
894.6
|
4,640
|
16.6
|
6,067
|
1.05
|
||||
|
Santiago
|
CE-17-009
|
594.55
|
599.35
|
1,142
|
4.9
|
1,565
|
4.80
|
3.72
|
||
|
Dolores
|
CESA-18-001
|
777.1
|
781.2
|
647
|
9.3
|
1,444
|
4.10
|
3.78
|
||
|
including
|
778.1
|
779.5
|
1,783
|
26.0
|
4,017
|
1.40
|
Source: SRK, 2025
During the July 2021 QP site visit, SRK reviewed the core sampling, cutting, and logging procedures followed by Sinda in practice. The protocols observed are consistent with or exceed
generally accepted industry practice; and, therefore, are adequate for an exploration project at this stage. In the opinion of the SRK QP for Mineral Resources, the drilling data are sufficiently accurate and reliable to inform geology
models and Mineral Resource estimates for the Sinda Project.
A significant number of modeled veins are crossed by unsampled drill core. The total length of the unsampled drill hole intervals crossing wireframes represents approximately 13.9% of all
vein intervals. The assumption made in these cases is that these intervals were considered unmineralized by the geologist doing the initial logging and sampling; however, as the vein wireframes were constructed and interpreted later on
unsampled intervals are periodically crossed by the interpreted veins. These vein wireframes are then comprised of a combination of both sampled and mineralized intervals and unsampled and presumed to be unmineralized intervals. It should
be noted that a number of wireframes are comprised of both unsampled/unmineralized and sampled/mineralized intervals. The majority of the unsampled intervals are found in higher levels of the system where, in agreement with the deposit
model, veins are quite narrow and not expected to be well-mineralized. Often the higher-level expressions of veins, which are above CoG and wider at depth, may only be faults, or centimeter-scale veinlets with subtle geochemical anomalies.
SRK recommends that Sinda continue to log and sample those drilling intersections which are inferred to be continuations of the modeled structures, but which are currently unsampled for assay. The estimation methodology for treatment of
unsampled intervals in vein wireframes is discussed further in Section 11.
Sinda represents an early-stage exploration project hosting multiple silver-gold epithermal vein occurrences. The modeled veins are open along strike and along dip and at depth in certain
areas. Additionally, exploration drilling has intersected significant results along vein trends at greater drill spacing distances (e.g., more than 250 m) from neighboring samples. These zones of the block model outside of the drill hole
distance buffers used for the current classification definition are considered Exploration Targets that are separate from the classified Mineral Resources disclosed in the report. Currently, estimation results in these areas are considered
too speculative to meet the industry-accepted classification definitions due to risks related to lack of data support and unknown mineralization continuity within these sparsely drilled areas of the modeled Sinda veins.
|
SRK Consulting (U.S.), Inc.
SEC Technical Report Summary – Sinda Project
|
Page 54
|
For future targeting of Sinda exploration areas, SRK tabulated quantities of conceptual Exploration Targets, exclusive of Mineral Resources, using reasonable
techniques for estimating speculative tonnages and grades. Tabulation of this material is only provided for future exploration planning and Sinda internal studies and may change significantly, if/when further exploration is conducted. The
block model estimates informing these quantity and grade ranges are derived from less restrictive search neighborhoods within modeled vein domains, as described in Section 11.6.
CRIRSCO defines Exploration Targets as “a statement or estimate of the exploration potential of a mineral deposit in a defined geological setting where the statement or estimate, quoted as
a range of tonnes and a range of grade or quality, relates to mineralization for which there has been insufficient exploration to estimate Mineral Resources.” The potential quantity and grade ranges noted below are conceptual in nature and
insufficient exploration has been conducted to define this material as a Mineral Resource. It is uncertain if further exploration will result in these Exploration Target estimates being delineated as Mineral Resources or converted to
Mineral Reserves in the future. SRK cautions that estimates of Exploration Targets are not a CRIRSCO defined classification category, are not Mineral Resources, and are too speculative to fulfill the definition of Mineral Resources.
For this exploration potential study, ranges are defined as between elevated CoGs of 175 g/t and
200 g/t AgEq, but outside of the defined Mineral Resources. To date, the Adriana vein system has indicated relatively low-grade material which is below the defined CoGs and therefore is not counted in the Exploration Target quantities. The following tabulations are rounded to reflect the relative risk and low confidence of the approximations based on current drill hole spacing and geological understanding of these areas outside of classified Mineral Resources. For the current known vein systems, the approximate average tonnes, and grades of conceptual Exploration Target material range by area as follows:
200 g/t AgEq, but outside of the defined Mineral Resources. To date, the Adriana vein system has indicated relatively low-grade material which is below the defined CoGs and therefore is not counted in the Exploration Target quantities. The following tabulations are rounded to reflect the relative risk and low confidence of the approximations based on current drill hole spacing and geological understanding of these areas outside of classified Mineral Resources. For the current known vein systems, the approximate average tonnes, and grades of conceptual Exploration Target material range by area as follows:
|
•
|
|
•
|
Dolores – 6,300 to 7,000 kt, containing average grades ranging from 180 to 190 g/t Ag, 1.7 to 1.8 g/t Au, and 320 to 340 g/t AgEq
|
|
•
|
Lara – 3,000 to 3,600 kt, containing average grades ranging from 200 to 220 g/t Ag, 1.2 to 1.3 g/t Au, and 310 to 330 g/t AgEq
|
|
•
|
Morita – 4,600 to 5,200 kt, containing average grades ranging from 270 to 290 g/t Ag, 1.7 to 1.9 g/t Au, and 420 to 450 g/t AgEq
|
|
•
|
Santiago – 1,100 to 1,300 kt, containing average grades ranging from 440 to 470 g/t Ag, 1.8 to 2.0 g/t Au, and 590 to 640 g/t AgEq
|
Globally, the conceptual Exploration Targets range from about 32 to 37 Mt at grades ranging from 400 to 440 g/t AgEq. In SRK’s opinion, the areas encompassing this conceptual material
tabulation should be considered as potential for further exploration and a focus of future evaluation work programs with the aim of potentially upgrading a portion of the inventory into Mineral Resources. SRK recommends additional drilling
and sampling to determine grade variability and better define the Sinda vein domain interpretations in these Exploration Target areas as the project progresses. Table 7‑3 provides examples of significant raw assay intervals within
Exploration Target areas. These drill holes are outside of the current classified Mineral Resource and represent follow-up targets.
|
SRK Consulting (U.S.), Inc.
SEC Technical Report Summary – Sinda Project
|
Page 55
|
|
Area
|
Hole ID
|
From
|
To
|
Ag (g/t)
|
Au
(g/t)
|
AgEq
(g/t)
|
Apparent
Width (m)
|
||
|
Agaves
|
CEAG-19-007
|
934.4
|
937.1
|
425
|
1.3
|
534
|
2.7
|
||
|
Agaves
|
CEAG-19-008
|
927.95
|
930.35
|
1,278
|
0.3
|
1,305
|
2.4
|
||
|
Agaves
|
CEAG-19-009
|
949.35
|
953.65
|
814
|
1.0
|
869
|
4.3
|
||
|
Agaves
|
CEAG-19-010
|
985.1
|
987.15
|
472
|
1.1
|
563
|
2.0
|
||
|
Agaves
|
CEAG-21-042
|
1151.8
|
1153.8
|
355
|
0.4
|
392
|
2.0
|
||
|
Dolores
|
CECA-18-009
|
1013.8
|
1017.05
|
198
|
0.6
|
248
|
3.3
|
||
|
Dolores
|
CECA-18-015
|
842.15
|
844.15
|
127
|
6.8
|
711
|
2.0
|
||
|
Adriana
|
CENW-21-003
|
1051.9
|
1054.2
|
149
|
1.6
|
288
|
2.3
|
||
|
Lara
|
CETA-18-006
|
857.95
|
860.45
|
200
|
0.5
|
246
|
2.5
|
||
|
Lara
|
CETA-19-011
|
622.55
|
625.5
|
173
|
1.1
|
271
|
3.0
|
Source: SRK, 2025
In addition to the Caracol and Agaves vein systems, exploration prospecting on the Sinda concessions has revealed other potential vein targets. Sinda is continuing to follow-up on local and
regional exploration potential. Further drilling has the potential to develop additional Mineral Resources and increase confidence in existing Mineral Resources. Moreover, additional step-out and regional exploration drilling at Sinda has
the potential to discover economic mineralization in areas where no modern exploration has occurred in a prospective area.
Sinda is located in the Mesa Centro geomorphological unit that corresponds to extensive plains interrupted by mountain chains. The mine property is situated in
the northern interfluves in Celaya Valley, close to the Presa de Neutla reservoir, on a small mountain chain in the northern part of Valle de Celaya Aquifer (INEGI, 1998). Fractured volcanic rocks of basaltic and rhyolitic composition
constitute the bedrock. It presents considerable thicknesses and marked patterns of fracturing that generate heterogeneous and isotropic hydraulic properties that determine the occurrence and distribution of groundwater (Rubio, 2021).
The mean annual precipitation (MAP) in Celaya Valley is estimated in 739 millimeters per year (mm/y) and the evapotranspiration in 630 mm/y (Romero, 2017). A kriging interpolation of MAP in
the valley shows values around 600 mm/y in the Sinda mine area (Rubio, 2021). The precipitation occurs in two seasons: from June to September, the most intense, and from November to February.
Considering the topographical gradients and the surface drainages in the area, most of the precipitation would be lost as evapotranspiration or runoff. Recharge for irrigation is also
present in this area. However, a proper recharge estimate in the Project area has not been completed yet.
Preliminary analysis suggests a groundwater level around 1,680 m masl and flowing from the northeast to the southwest, following the general topographic gradient (Romero, 2017). However,
most of the measured water levels are not located in bedrock, and there are no clear values of groundwater levels in the mine area.
|
SRK Consulting (U.S.), Inc.
SEC Technical Report Summary – Sinda Project
|
Page 56
|
Boreholes from the exploration drilling campaign did not report groundwater occurrence. Only a borehole drilled at the southeast corner of the mining property found artesian conditions.
However, no further details are available.
The planned underground mine is expected to reach well below the estimated saturated level. The lack of hydraulic tests in the Project area makes it difficult to estimate the hydraulic
transmissivity and groundwater storage coefficients, which are required for groundwater flow estimates. However, preliminary estimates of the potential groundwater inflow could reach 2,000 to 4,000 gallons per minute (gpm) during the life
of mine. This estimate did not consider any inrush flow from structures and is considered a very preliminary approach.
The Neutla reservoir is located 2,700 m to the east of the planned mine. Currently, it is unclear if some fault or fracture zones could connect the future underground developments and the
surface water body. Therefore, the risk of potential high groundwater inflow from the reservoir and creeks cannot be dismissed.
SRK recommends that the following hydrogeologic data collection and studies be completed:
|
•
|
Water occurrence survey in the current and future mine areas.
|
|
•
|
Water levels in boreholes and springs (if any).
|
|
•
|
Hydrogeological analysis of the structures and fractures zones and the potential connection with surface water bodies.
|
|
•
|
Hydraulic tests (Packer tests, slug test) in selected boreholes from the previous campaign and future infilling or geotechnical drillings.
|
|
•
|
Installation of piezometers in bedrock units in the mine area.
|
|
•
|
Water quality survey for surface water and groundwater in the mine area.
|
|
•
|
Build a preliminary hydrogeological conceptual model for a better estimate of the dewatering requirements.
|
Geotechnical core logging data was available for 135 drill holes around the Caracol area of the Project (approximately 138,150 m of core), with the holes being drilled and logged between
2016 and 2022. SRK evaluated the provided data to review the parameters collected and method of data collection and conducted a quality assurance/quality control (QA/QC) check. Generally, the geotechnical data sets are considered to have
low reliability and additional work is recommended.
The initial geotechnical data suggests that some areas of the proposed mine may be conducive to an open-stope mining method. To be able to assess mining methods and to advance the Project
into the next level of study, SRK recommends that a geotechnical drill hole program be undertaken.
An adequate geotechnical drilling program may require additional drilling footage beyond the recommended in-fill drilling program, as some drilling will need to be from surface. SRK
recommends that the following geotechnical data be collected:
|
•
|
Oriented data collection, including utilization of orientation tooling and downhole televiewer.
|
|
•
|
Detailed geotechnical core logging data.
|
|
•
|
Geomechanical testing, including, but not limited to, rock strength testing (e.g., unconfined compressive strength, triaxial compressive strength, and Brazilian tensile strength).
|
|
SRK Consulting (U.S.), Inc.
SEC Technical Report Summary – Sinda Project
|
Page 57
|
|
•
|
Point load testing.
|
|
•
|
Explore trade-offs of different stope sizing and different mining methods for Sinda. Utilizing larger openings and/or different mining methods could have a positive impact on productivities and
costs.
|
|
SRK Consulting (U.S.), Inc.
SEC Technical Report Summary – Sinda Project
|
Page 58
|
Mechanical preparation of the samples is a critical activity given the importance of sample homogenization and representativity in high-grade epithermal precious metal veins. The purpose of
preparation is to produce a homogeneous sub-sample that is representative of the sampled drill core interval. A flow-chart of the Sinda sample preparation is provided as Figure 8‑1.
Upon receipt, samples are organized by the laboratory with respect to the sample dispatch sheet, entered in the laboratory information management system (LIMS), and labeled with a barcoded
sample identification tag. Then, samples go through the ALS standard preparation procedure. If the samples are excessively wet, they may require time in ambient drying ovens at the laboratory. Samples are weighed and ground to 70% passing
less than 2 mm and finally pulverized to an 85% less than 75 microns fraction. Samples are divided evenly with a riffle splitter and placed in a paper pulp envelope. A reject sample is extracted from the grinding stage and stored in the
original plastic sample bag on pallets at the laboratory warehouse to later be taken back to the Project site for storage. The pulp envelopes obtained from the pulverizing stage are boxed by drillhole and shipped to ALS in Vancouver, Canada
for chemical analysis.
|
SRK Consulting (U.S.), Inc.
SEC Technical Report Summary – Sinda Project
|
Page 59
|
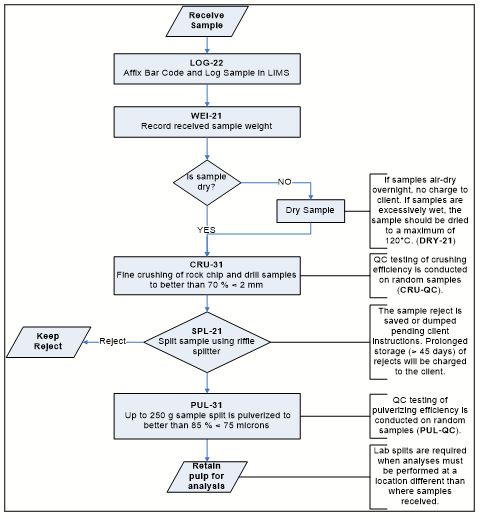
Source: SRK, 2025
All analytical samples for drill core and surface grab samples were prepared consistently and analyzed with the same assay procedures. Most Sinda samples were prepared at ALS Global (ALS)
preparation laboratory in Zacatecas, Mexico and analyzed chemically at ALS assay laboratory in Vancouver, Canada. The ALS facilities are ISO 9001:2015 certified and ISO/IEC 17025:2017 accredited methods in North America.
|
SRK Consulting (U.S.), Inc.
SEC Technical Report Summary – Sinda Project
|
Page 60
|
Samples were sent to Bureau Veritas (BV) for assay in two separate phases, the first time in early 2020 to late 2020 due to temporary closure of ALS facilities, and the second time in late
2021 to late 2022. These samples were prepared in the Durango, Mexico preparation facility, and were analyzed in both Hermosillo, Mexico (fire assays) and Vancouver, Canada (multielement assays). Additionally, certain check assay samples
have been sent to BV for third-party analytical control of the main ALS laboratory results. The BV laboratory has ISO/IEC 17025:2017 accreditation.
ALS and BV laboratories are third-party, commercial geochemical laboratories that operate independently of Sinda.
All samples were assayed at the certified,
third-party laboratories discussed above. The type of analysis performed on the samples considered the elements being detected and the detection limits and over-limits of each method for the elements of economic interest (Ag and Au) and
those for determination of geochemical characteristics (e.g., Cu, Pb, Zn, As, etc.). The type of analyses performed on the samples depended on targeted data requirements and not all sample batches had the full analytical suite completed.
The main ALS laboratory method codes described below correspond to the majority of completed assay analyses and are substantially similar to limited analyses completed at the BV laboratories.
A prepared sample (30 g) is fused with a mixture of lead oxide, sodium carbonate, borax, silica, and other reagents as required, inquarted with 6 mg of gold-free silver and then cupelled to
yield a precious metal bead. Then, the bead is digested in 0.5 mL dilute nitric acid in the microwave oven, 0.5 mL concentrated hydrochloric acid is then added, and the bead is further digested in the microwave at a lower power setting. The
digested solution is cooled, diluted to a total volume of 4 mL with de-mineralized water, and analyzed by atomic absorption (AA) spectroscopy against matrix-matched standards. The detection limits of this test are provided in Table 8‑1.
|
Element
|
Symbol
|
Units
|
Lower Limit
|
Upper Limit
|
|
Gold
|
Au
|
ppm
|
0.005
|
10
|
Source: SRK, 2025
Initial sample decomposition with a hydrofluoric, nitric, perchloric acid digestion and HCl leach. The sample digest is analyzed by ICP-AES for all elements except mercury. Due to the high
temperature (185°C) of the four-acid digestion, significant amounts of mercury can be lost by evaporation. Use of the lower temperature aqua regia digestion (115°C) prevents this evaporation allowing for more accurate results.
A prepared sample (0.25 g) is digested with perchloric, nitric, hydrofluoric, and hydrochloric acids. The residue is topped up with dilute hydrochloric acid and the resulting solution is
analyzed by inductively coupled plasma-atomic emission spectrometry. Results are corrected for spectral inter-element interferences. The detection limits of this test are provided in Table 8‑2.
|
SRK Consulting (U.S.), Inc.
SEC Technical Report Summary – Sinda Project
|
Page 61
|
|
Element
|
Symbol
|
Units
|
Lower Limit
|
Upper Limit
|
|||
|
Silver
|
Ag
|
ppm
|
0.5
|
100
|
|||
|
Aluminum
|
Al
|
%
|
0.01
|
50
|
|||
|
Arsenic
|
As
|
ppm
|
5
|
10,000
|
|||
|
Barium
|
Ba
|
ppm
|
10
|
10,000
|
|||
|
Beryllium
|
Be
|
ppm
|
0.5
|
1,000
|
|||
|
Bismuth
|
Bi
|
ppm
|
2
|
10,000
|
|||
|
Calcium
|
Ca
|
%
|
0.01
|
50
|
|||
|
Cadmium
|
Cd
|
ppm
|
0.5
|
500
|
|||
|
Cobalt
|
Co
|
ppm
|
1
|
10,000
|
|||
|
Chromium
|
Cr
|
ppm
|
1
|
10,000
|
|||
|
Copper
|
Cu
|
ppm
|
1
|
10,000
|
|||
|
Iron
|
Fe
|
%
|
0.01
|
50
|
|||
|
Gallium
|
Ga
|
ppm
|
10
|
10,000
|
|||
|
Potassium
|
K
|
%
|
0.01
|
10
|
|||
|
Lanthanum
|
La
|
ppm
|
10
|
10,000
|
|||
|
Magnesium
|
Mg
|
%
|
0.01
|
50
|
|||
|
Manganese
|
Mn
|
ppm
|
5
|
100,000
|
|||
|
Molybdenum
|
Mo
|
ppm
|
1
|
10,000
|
|||
|
Sodium
|
Na
|
%
|
0.01
|
10
|
|||
|
Nickel
|
Ni
|
ppm
|
1
|
10,000
|
|||
|
Phosphorus
|
P
|
ppm
|
10
|
10,000
|
|||
|
Lead
|
Pb
|
ppm
|
2
|
10,000
|
|||
|
Sulphur
|
S
|
%
|
0.01
|
10
|
|||
|
Antimony
|
Sb
|
ppm
|
5
|
10,000
|
|||
|
Scandium
|
Sc
|
ppm
|
1
|
10,000
|
|||
|
Strontium
|
Sr
|
ppm
|
1
|
10,000
|
|||
|
Thorium
|
Th
|
ppm
|
20
|
10,000
|
|||
|
Titanium
|
Ti
|
%
|
0.01
|
10
|
|||
|
Thallium
|
Tl
|
ppm
|
10
|
10,000
|
|||
|
Uranium
|
U
|
ppm
|
10
|
10,000
|
|||
|
Vanadium
|
V
|
ppm
|
1
|
10,000
|
|||
|
Tungsten
|
W
|
ppm
|
10
|
10,000
|
|||
|
Zinc
|
Zn
|
ppm
|
2
|
10,000
|
Source: SRK, 2025
A prepared sample (30 g) is fused with a mixture of lead oxide, sodium carbonate, borax, silica, and other reagents to produce a lead button. The lead button containing the precious metals
is cupelled to remove the lead. The remaining gold and silver beads are parted in dilute nitric acid, annealed, and weighed as gold. Silver, if requested, is then determined by the difference in weights. The
detection limits of this test are provided in Table 8‑3.
|
Element
|
Symbol
|
Units
|
Lower Limit
|
Upper Limit
|
|
Gold
|
Au
|
ppm
|
0.05
|
1,000
|
|
Silver
|
Ag
|
ppm
|
5
|
10,000
|
Source: SRK, 2025
A prepared sample is digested with nitric, perchloric, hydrofluoric, and hydrochloric acids, and then evaporated to incipient dryness. Hydrochloric acid and de-ionized water are added for
further digestion, and the sample is heated for an additional allotted time. The sample is cooled to room temperature and transferred to a volumetric flask (100 mL). The resulting solution is diluted to volume with de-ionized water,
homogenized and the solution is analyzed by inductively coupled plasma - atomic emission spectroscopy or by AA spectrometry. Results are corrected for spectral interelement interferences. The detection limits of this test are provided in
Table 8‑4.
|
SRK Consulting (U.S.), Inc.
SEC Technical Report Summary – Sinda Project
|
Page 62
|
|
Element
|
Symbol
|
Units
|
Lower Limit
|
Upper Limit
|
|
Silver
|
Ag
|
ppm
|
1
|
1,500
|
|
Arsenic
|
As
|
%
|
0.001
|
30
|
|
Copper
|
Cu
|
%
|
0.001
|
50
|
|
Lead
|
Pb
|
%
|
0.001
|
20
|
|
Zinc
|
Zn
|
%
|
0.001
|
30
|
Source: SRK, 2025
A prepared sample, typically 7.29 g or 14.58 g (1/4 or 1/2 assay ton), is fused with a mixture of lead oxide, sodium carbonate, borax, silica, and other reagents (the exact flux composition
is dependent on the nature of the sample) to produce a lead button. The lead button containing the precious metals is cupelled, yielding a precious metal bead.
If gold and silver are requested, the precious metal bead is weighed, parted with nitric acid, annealed, and weighed as gold. The nitric acid parting solution is run for lead, bismuth,
platinum, and palladium (impurities). The gold bead is digested with aqua regia and analyzed by AAS for silver (impurity). The impurity corrections are made for the element of interest.
This method was used for very high-grade overlimit testing of one sample (597.25 to 598.75 m downhole) in drill hole CECA-18-001. The detection limits of this test are provided in
Table 8‑5.
|
Element
|
Symbol
|
Units
|
Lower Limit
|
Upper Limit
|
|||
|
Silver
|
Ag
|
ppm
|
0.7
|
995,000
|
|||
|
Gold
|
Au
|
ppm
|
0.07
|
999,985
|
Source: SRK, 2025
Drill hole sampling was conducted by Sinda and followed industry accepted methods for QA/QC including the reported use of standards, blanks, and duplicate
samples. For the purposes of this study, SRK reviewed the obtained QA/QC data to ensure the quality of information was acceptable for Mineral Resource estimation.
The QA/QC program for the chemical analysis of Project samples is reported by Sinda to be comprised of the following types of control samples:
|
•
|
Certified Reference Material (CRM) standards
|
|
•
|
Blank Samples
|
|
•
|
Duplicate Samples
|
|
•
|
External Check Assays
|
|
SRK Consulting (U.S.), Inc.
SEC Technical Report Summary – Sinda Project
|
Page 63
|
Sinda provided QA/QC data to SRK in an Excel spreadsheet (GeoSpark Export CRMs and Blanks 28marzo2023.xlsx). These data had a cut-off date of January 11, 2023. Additionally, Sinda provided
matching QA/QC data pairs from the database for duplicates and external check samples (Duplicates March 2023.xlsx).
Sinda recorded and charted performance of commercially available Ag and Au reference standards in the GeoSpark database and accessory Excel spreadsheets. CRMs are sourced from OREAS, and
the original identification is removed from the packets (typically containing 60 or 100 grams) to provide a blind sample to the laboratory. An internal color system is used to indicate which standard packets equate to the named CRMs. The
individual packets are pre-measured, sealed, and are stored in a locked storage cabinet prior to insertion into the sample stream. A total of 4,159 standards were provided and represent an insertion rate of
4.9% for all samples (n=85,589). When comparing against all samples, the total number of CRMs meet the industry-standard threshold of 5% of control samples compared to assay samples. Table 8‑6 summarizes the CRMs used for Sinda QA/QC.
Sinda considered CRM results greater than three standard deviations from the published CRM expected value to represent a QA/QC failure and samples with failed
QA/QC are re-analyzed. Minimal QA/QC failures were observed with less than a 3.5% failure rate for individual standards with a statistically significant number of results. Due to early stage of the program, the results are not statistically
significant for two of the thirteen CRMs used (i.e., CDN-ME-1204 BAJO and OREAS 607) due to the limited size of the sampling program (i.e., less than 30 control analyses) for specific CRMs with insufficient detail. The OREAS 611 standard
with high-grade gold reported 27 results at 10.0 g/t Au. These results were removed from the QA/QC analysis as they are related to over-limit assays not being conducted, as a result of insufficient CRM material remaining. SRK did not detect
any material systematic bias in the Sinda-provided standard data.
|
Sinda ID
|
CRM Name
|
Number
of Samples |
Expected
Value (ppm) |
Number
of Failures |
Failure
Rate (%) |
|||||
|
Au
|
Ag
|
Au
|
Ag
|
Au
|
Ag
|
|||||
|
A1
|
CDN-ME-1101 BAJO
|
123
|
0.564
|
68.2
|
0
|
0
|
0
|
0
|
||
|
A2
|
CDN-ME-1604 ALTO
|
65
|
2.510
|
299
|
0
|
0
|
0
|
0
|
||
|
A3
|
CDN-ME-1204 BAJO
|
20
|
0.975
|
58.0
|
1
|
0
|
5.0
|
0
|
||
|
AA
|
OREAS 605 ALTO
|
270
|
1.670
|
965
|
3
|
4
|
1.1
|
1.5
|
||
|
AA2
|
OREAS 605B
|
696
|
1.720
|
1015
|
21
|
6
|
3.0
|
0.9
|
||
|
AB1
|
OREAS 601
|
57
|
0.780
|
49.2
|
0
|
0
|
0
|
0
|
||
|
AB2
|
OREAS 601b
|
595
|
0.775
|
50.1
|
3
|
0
|
0.5
|
0.0
|
||
|
AB3
|
OREAS 607
|
14
|
0.690
|
5.88
|
4
|
1
|
28.6
|
7.1
|
||
|
AB4
|
OREAS 611
|
548
|
15.70
|
80.0
|
7
|
19
|
1.3
|
3.5
|
||
|
AM
|
CDN-ME-1308 MEDIO
|
46
|
1.400
|
45.7
|
0
|
0
|
0
|
0
|
||
|
AM2
|
OREAS 602 MEDIO
|
320
|
1.950
|
115
|
1
|
1
|
0.3
|
0.3
|
||
|
AM3
|
OREAS 604b
|
1,006
|
1.690
|
507
|
16
|
4
|
1.6
|
0.4
|
||
|
AM4
|
CDN-ME-2001
|
372
|
1.317
|
574
|
10
|
14
|
2.7
|
3.8
|
||
Source: SRK, 2025
|
SRK Consulting (U.S.), Inc.
SEC Technical Report Summary – Sinda Project
|
Page 64
|
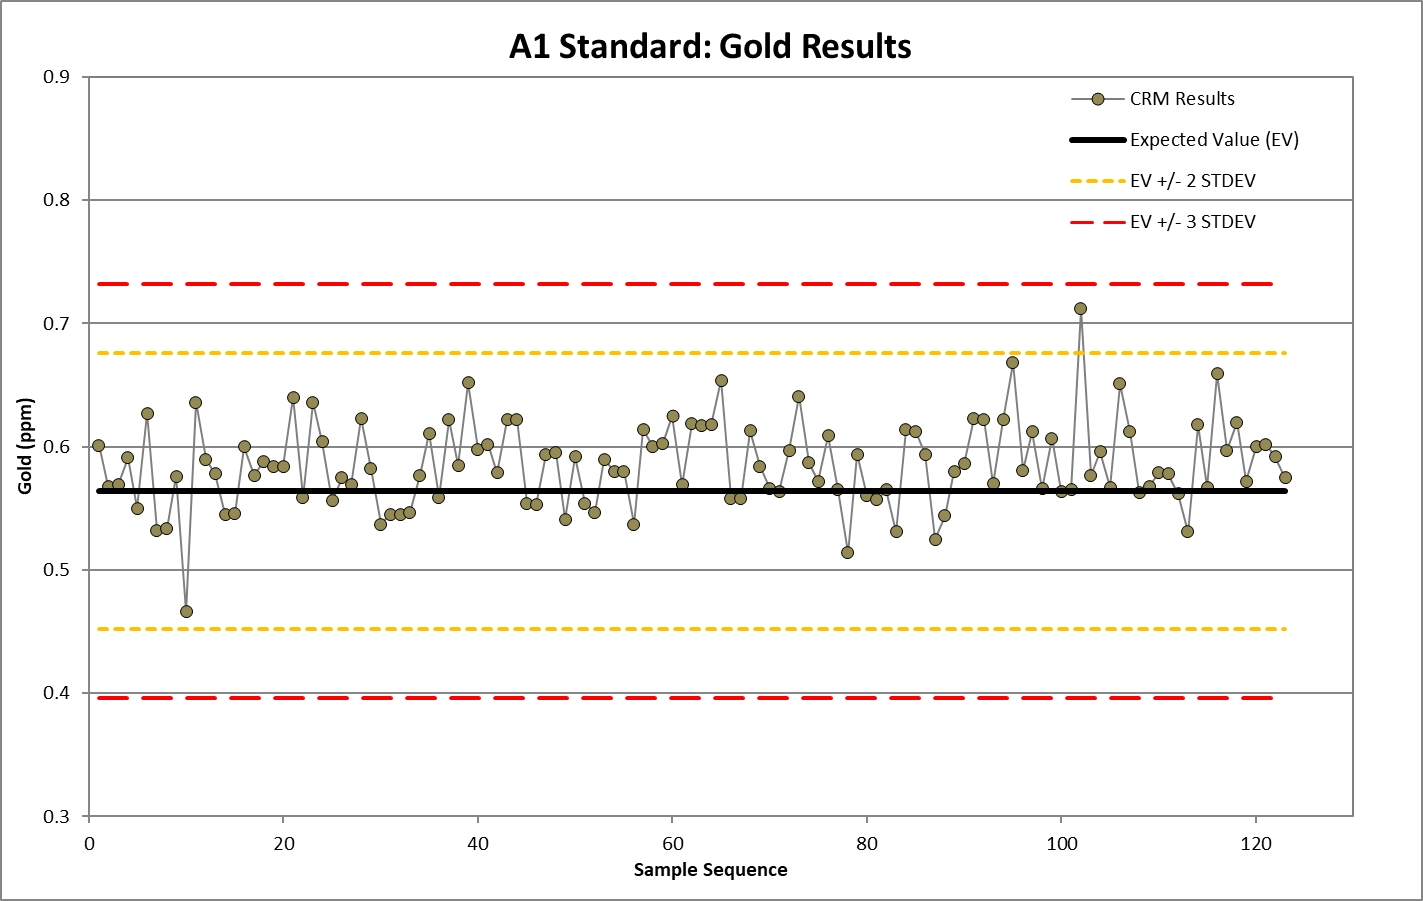
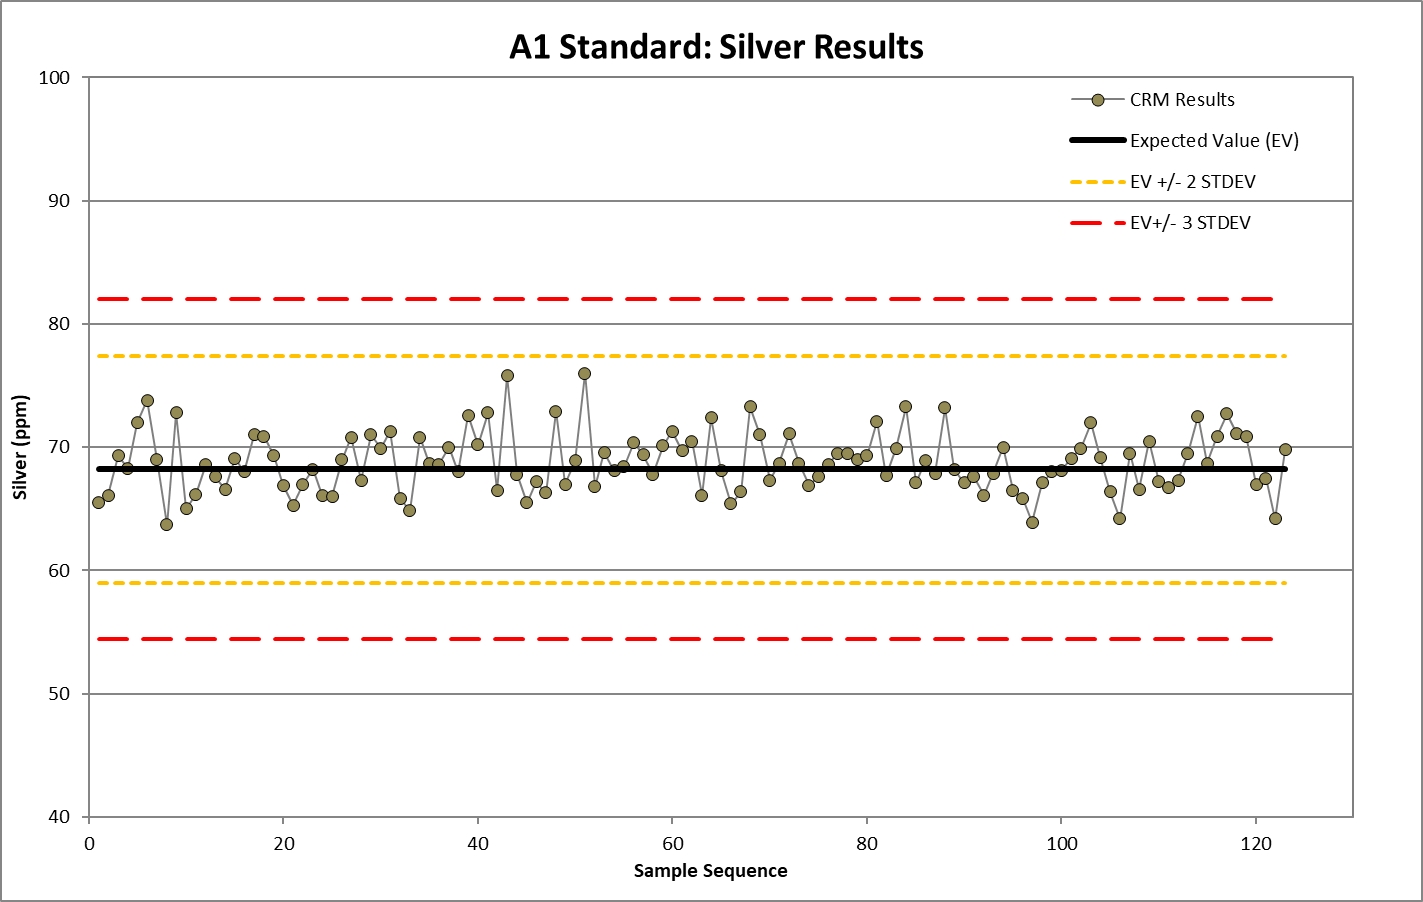
Source: SRK, 2025
|
SRK Consulting (U.S.), Inc.
SEC Technical Report Summary – Sinda Project
|
Page 65
|

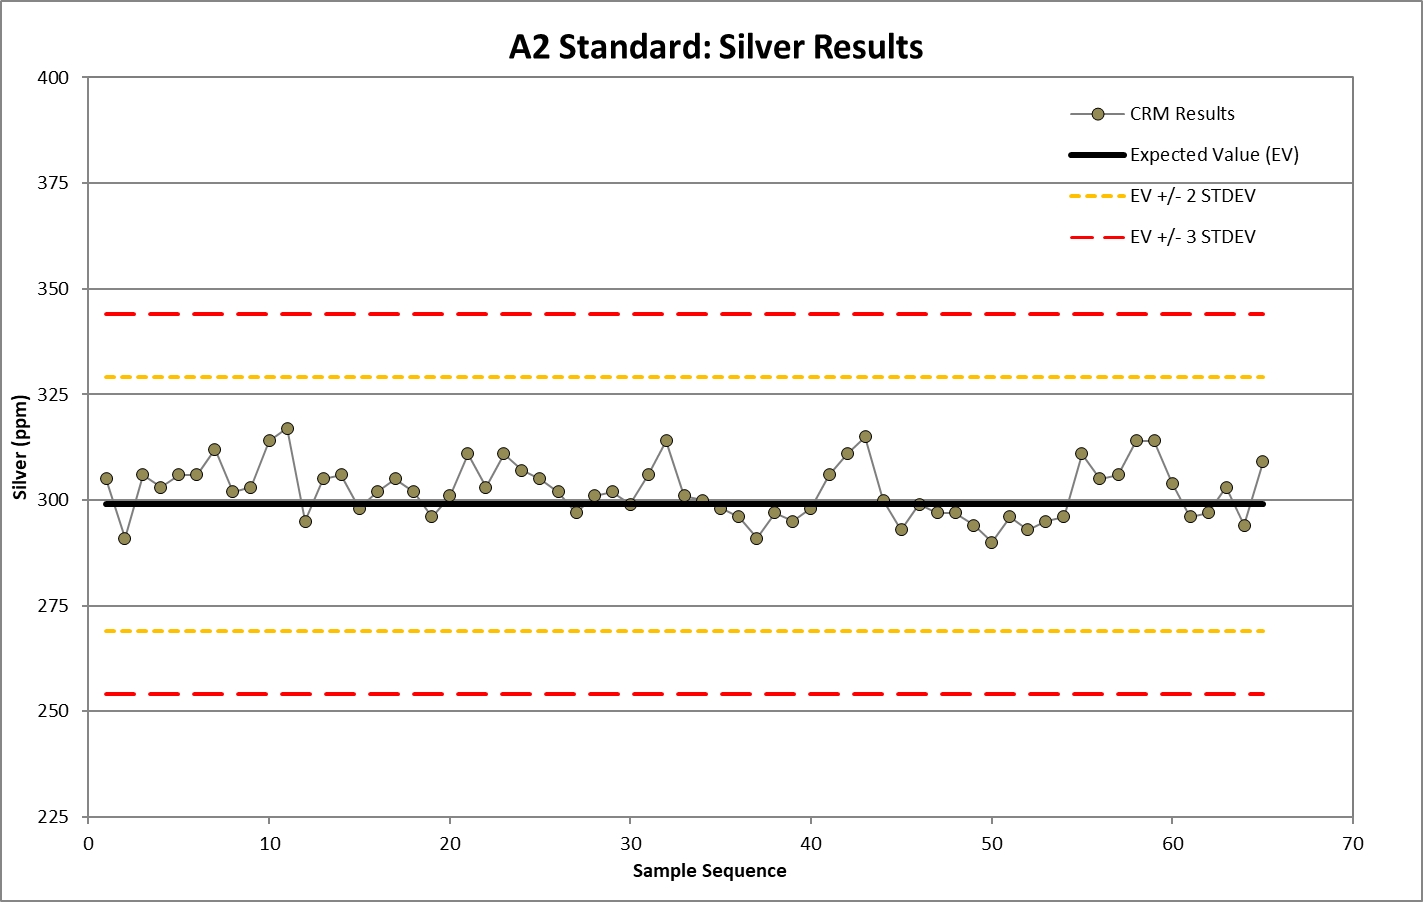
Source: SRK, 2025
|
SRK Consulting (U.S.), Inc.
SEC Technical Report Summary – Sinda Project
|
Page 66
|
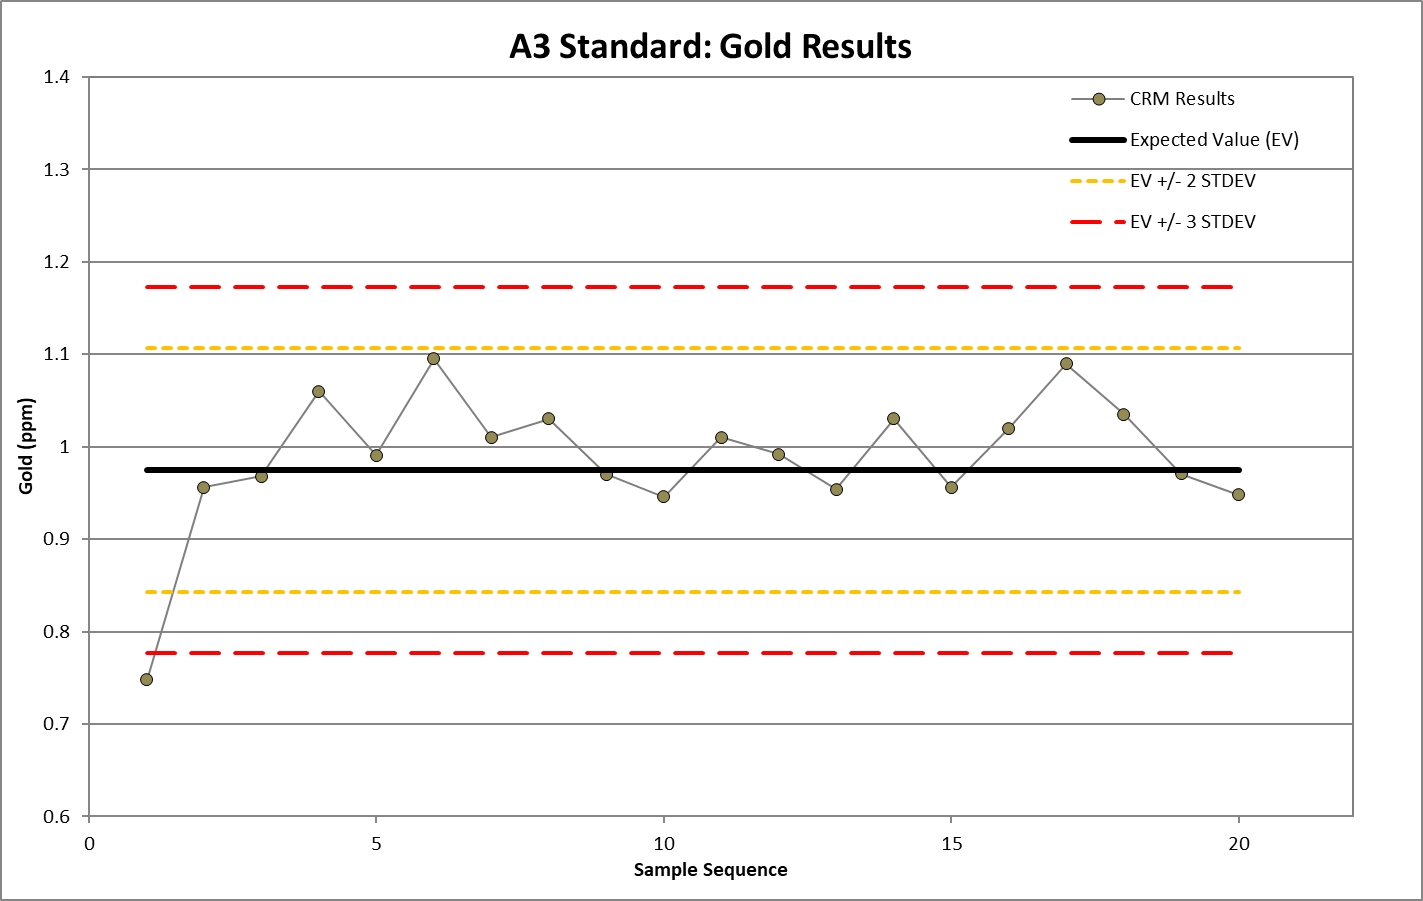
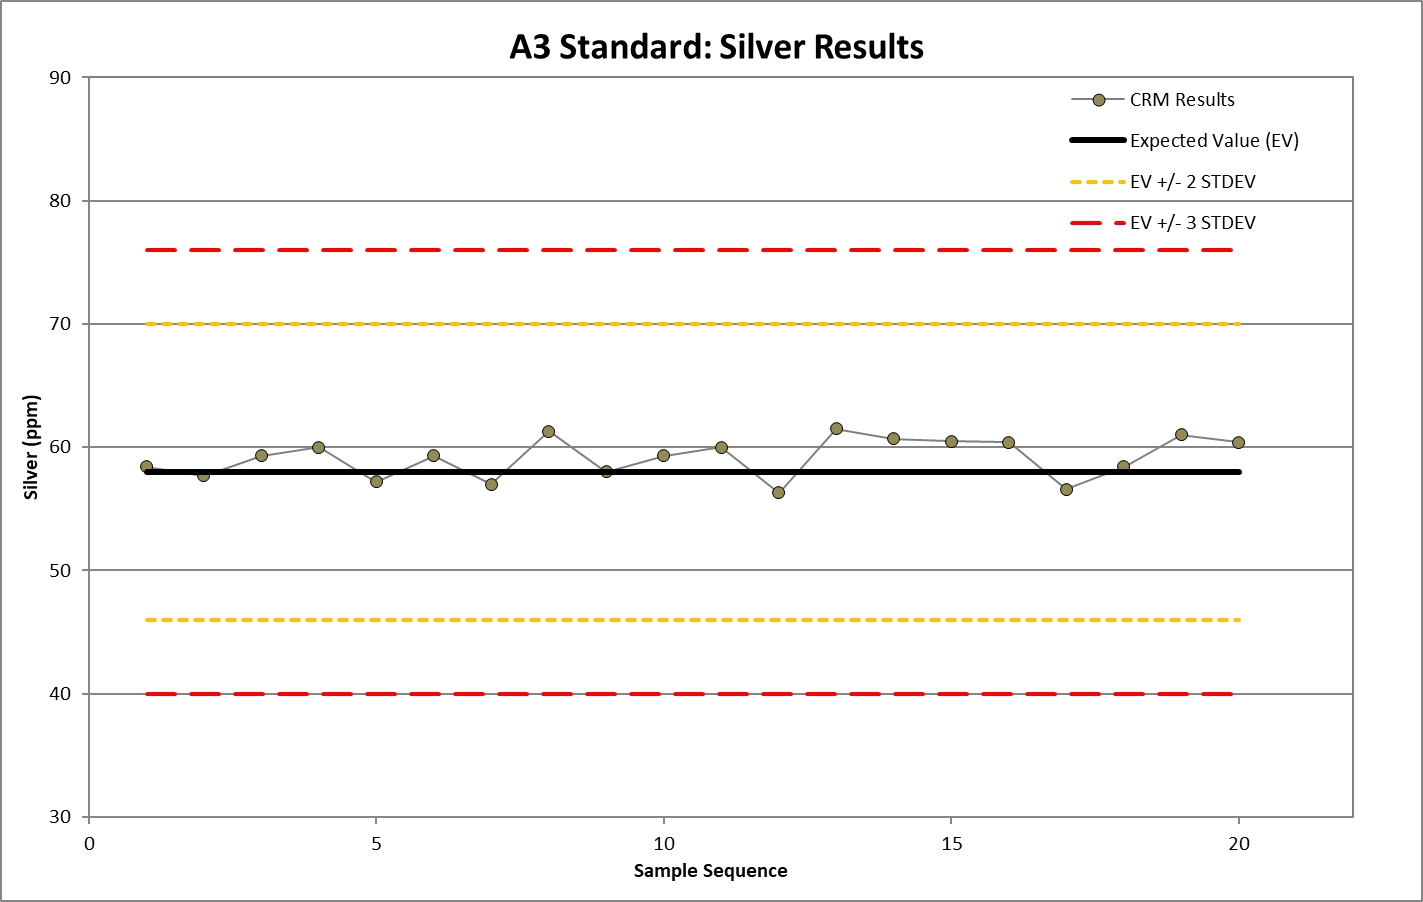
Source: SRK, 2025
|
SRK Consulting (U.S.), Inc.
SEC Technical Report Summary – Sinda Project
|
Page 67
|
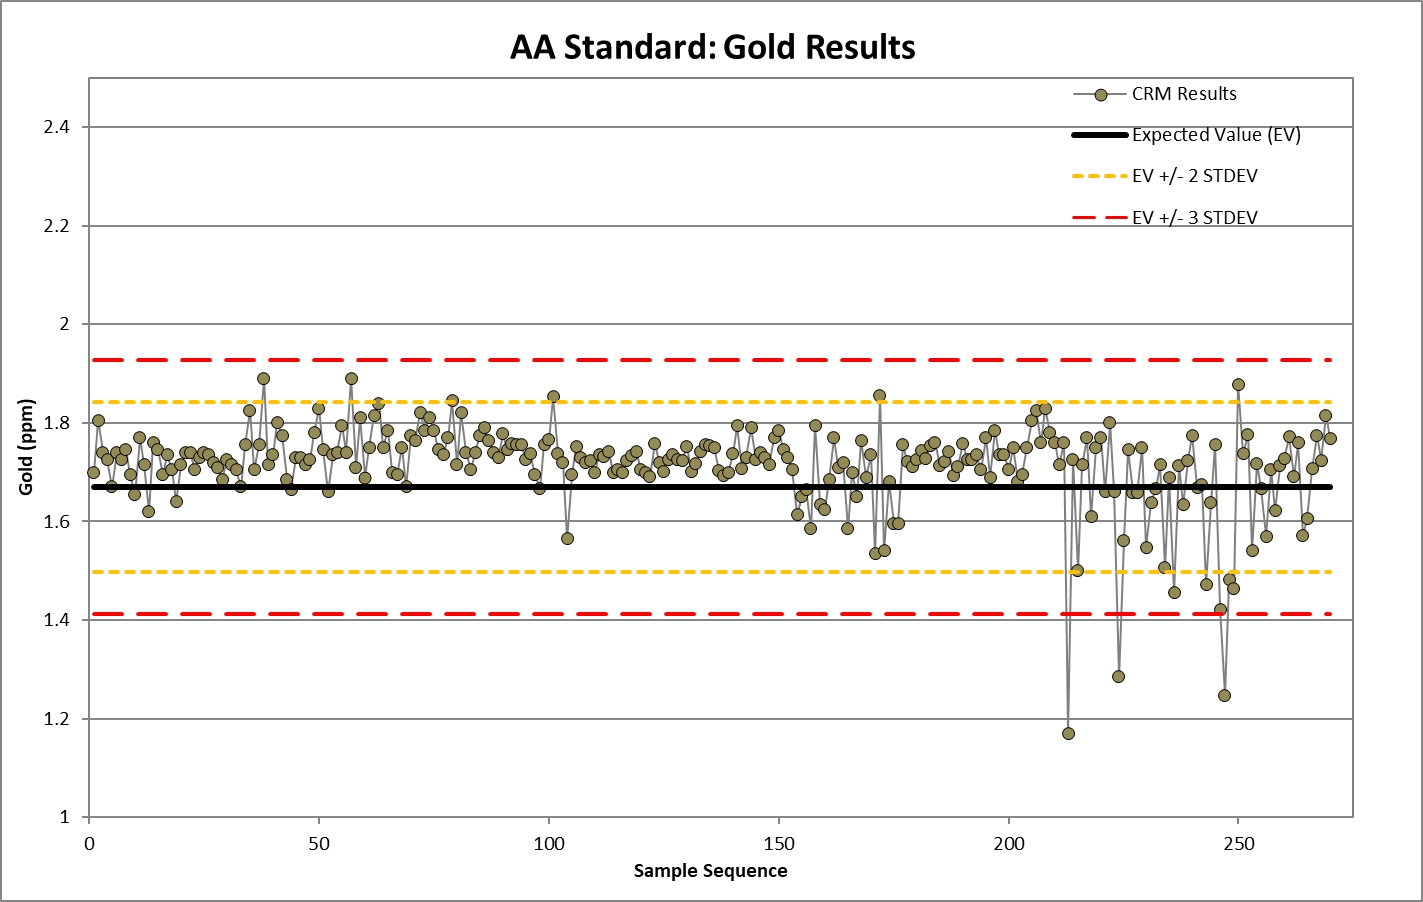
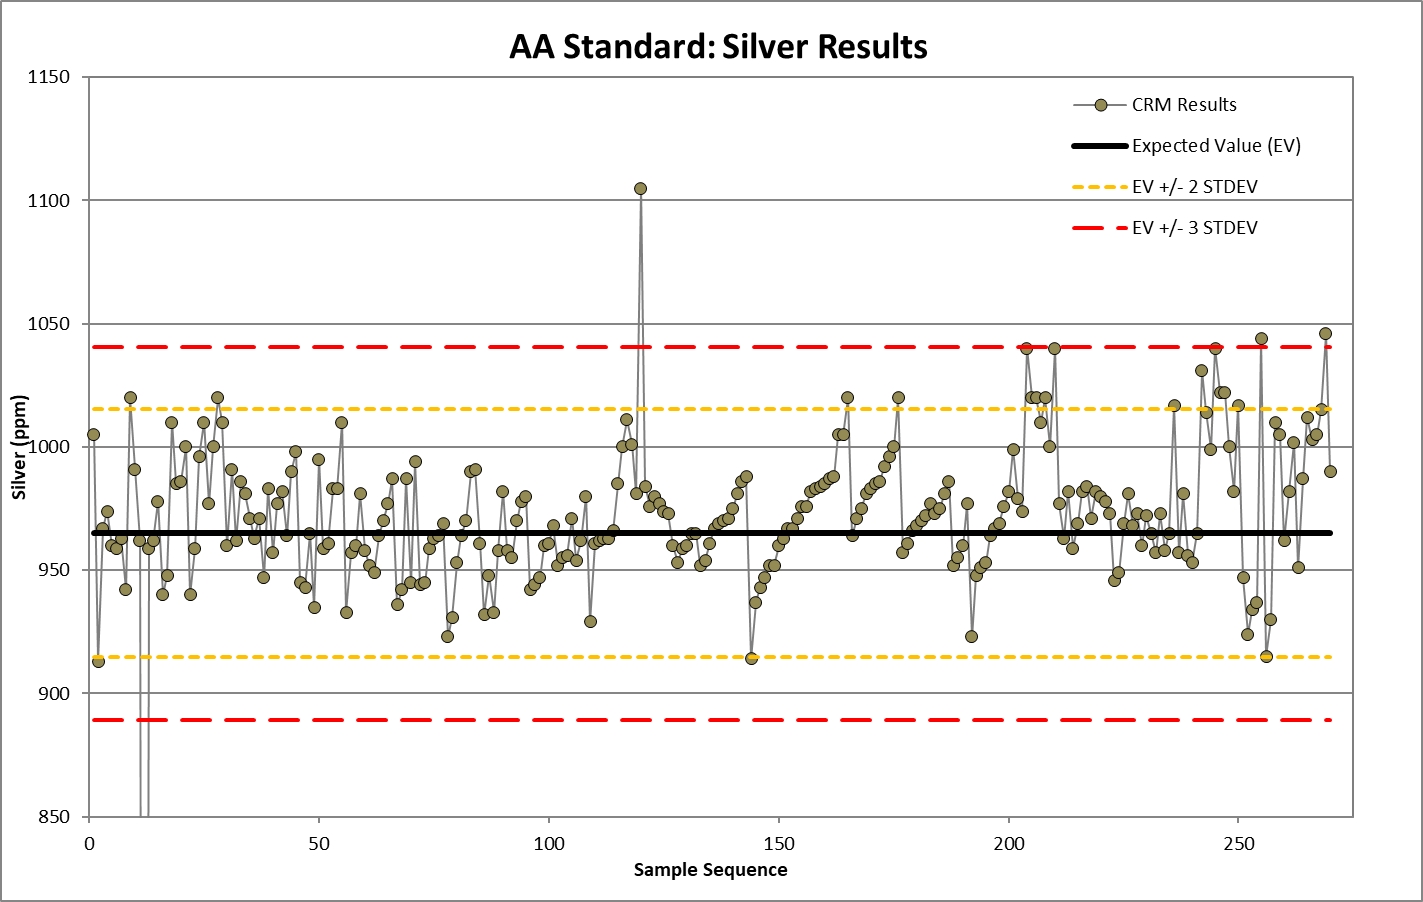
Source: SRK, 2025
|
SRK Consulting (U.S.), Inc.
SEC Technical Report Summary – Sinda Project
|
Page 68
|
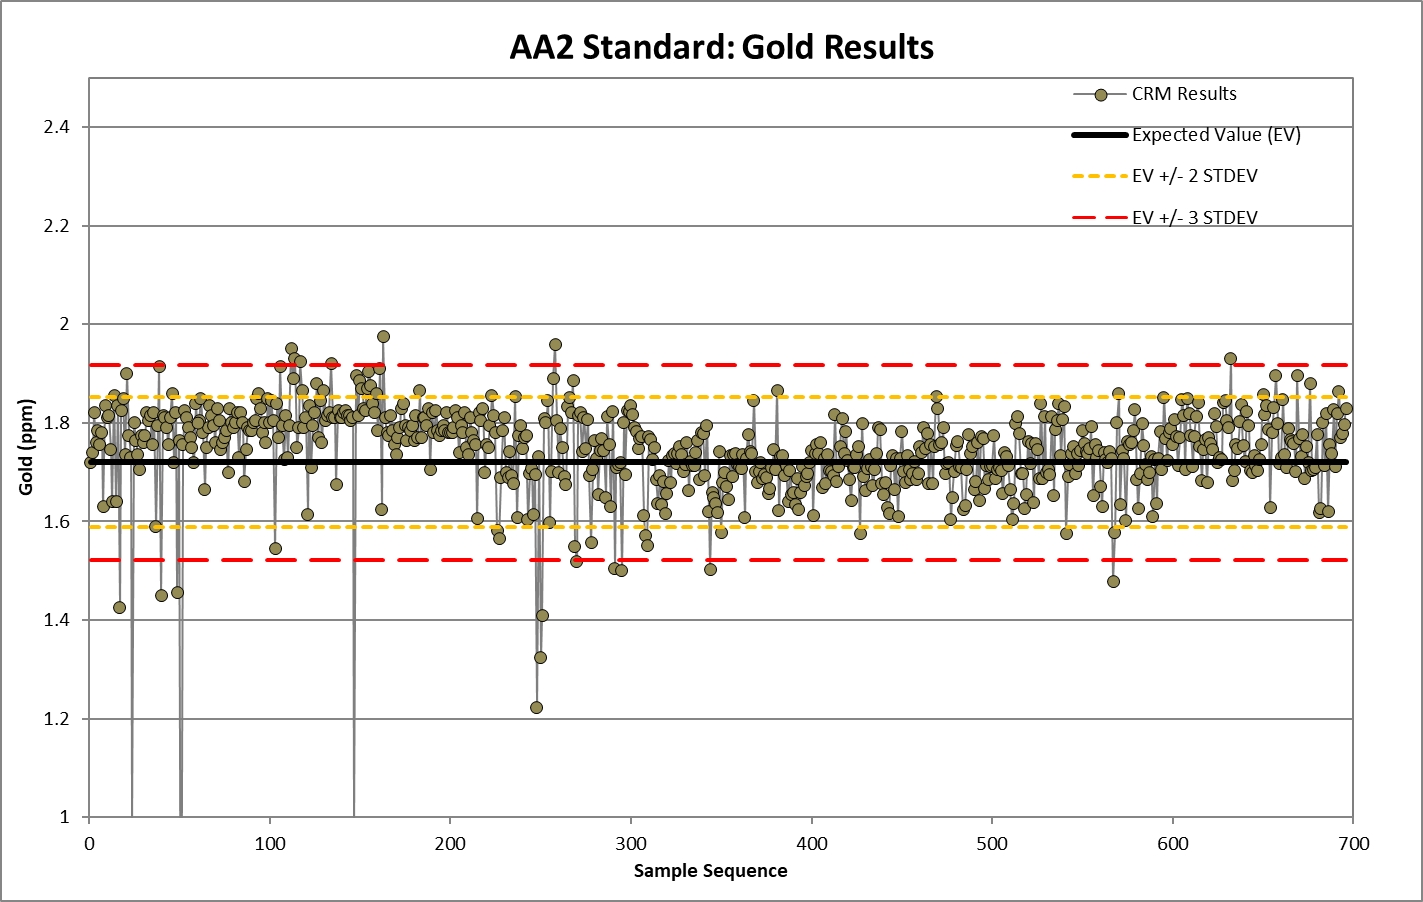
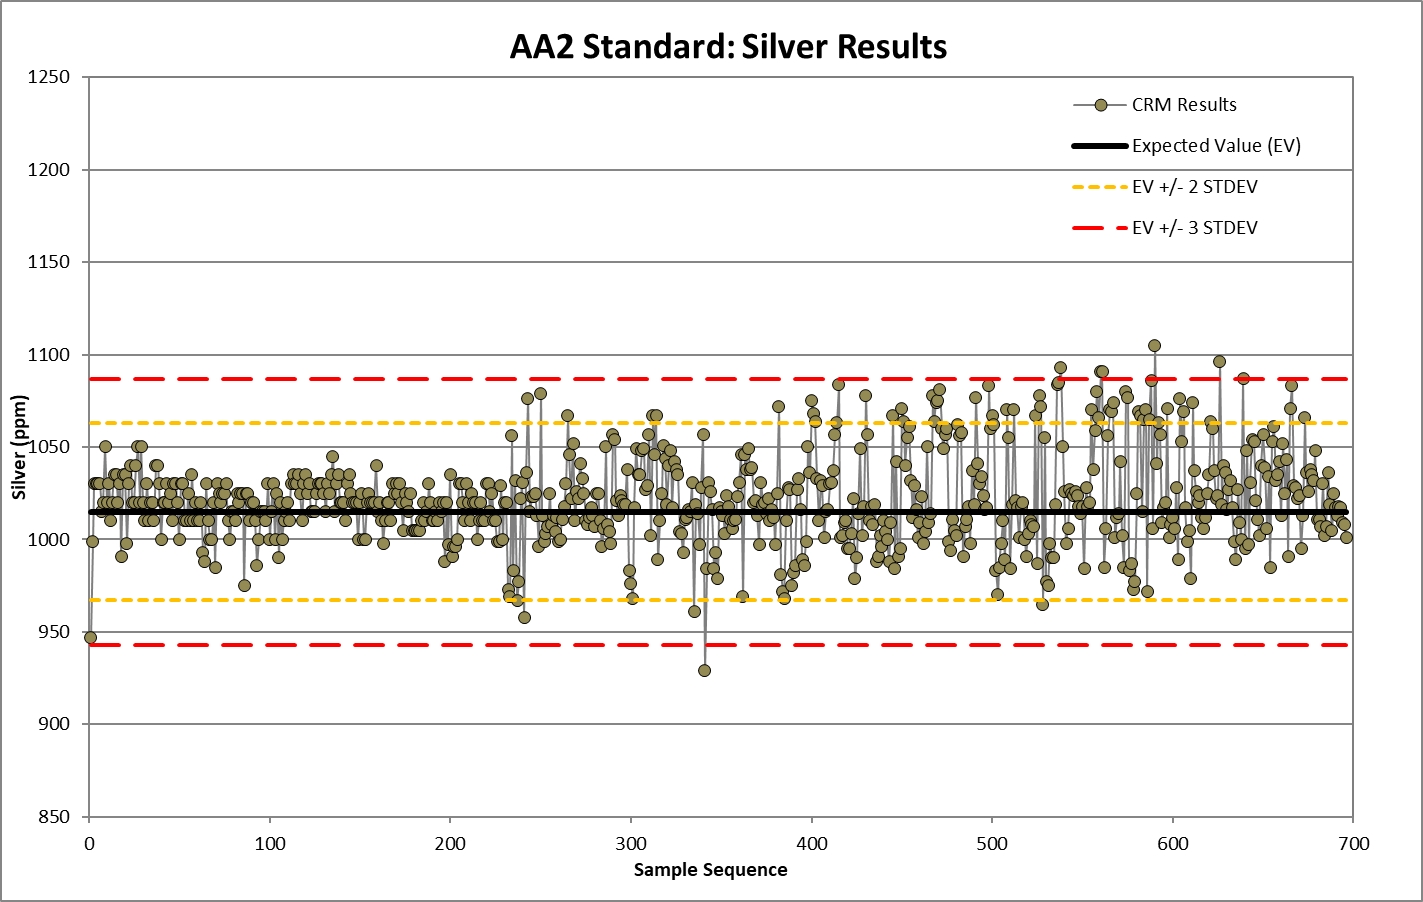
Source: SRK, 2025
|
SRK Consulting (U.S.), Inc.
SEC Technical Report Summary – Sinda Project
|
Page 69
|
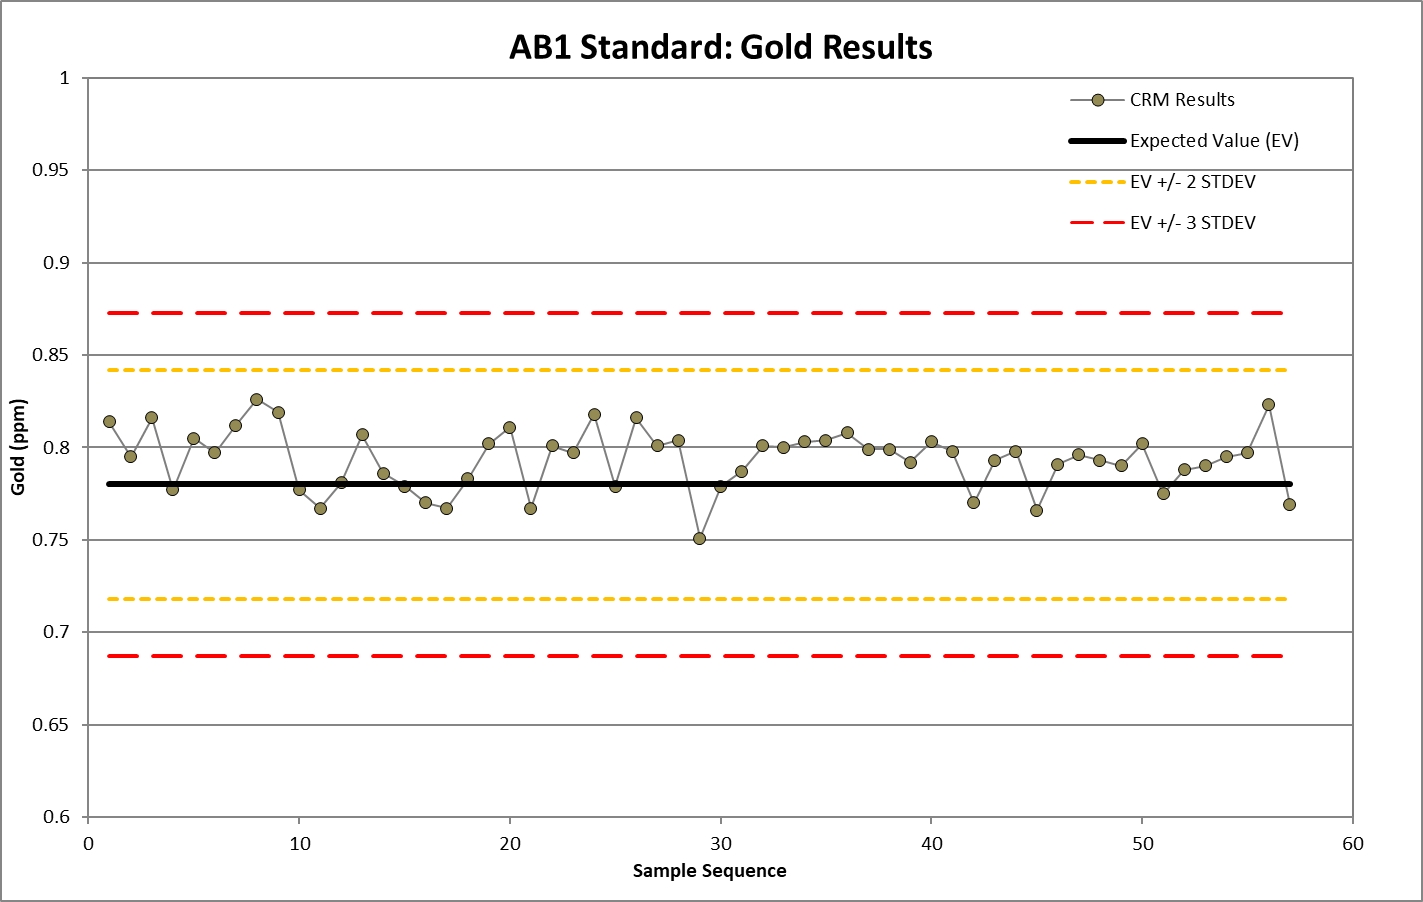
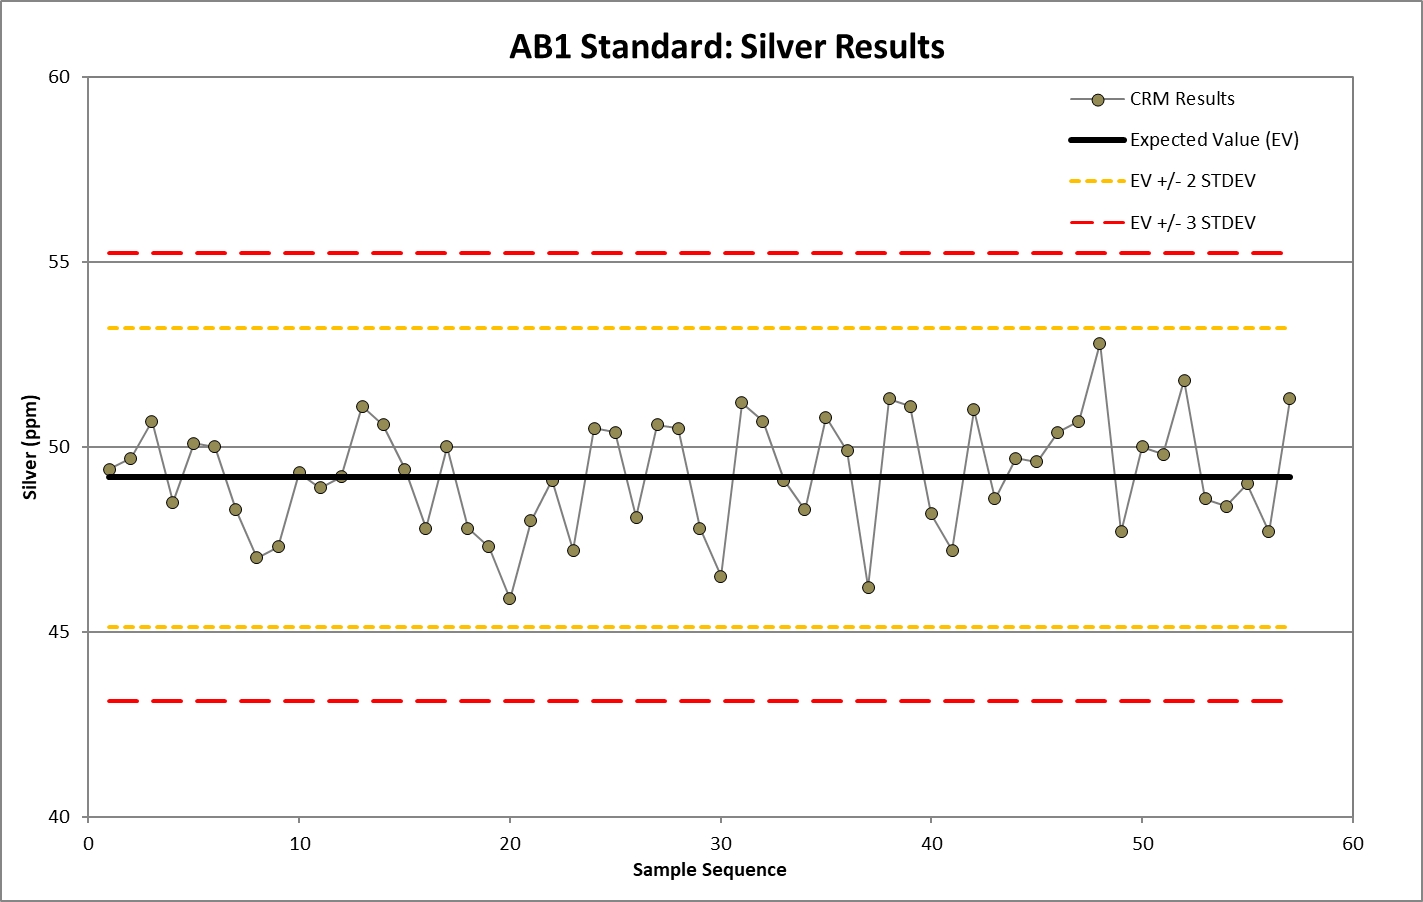
Source: SRK, 2025
|
SRK Consulting (U.S.), Inc.
SEC Technical Report Summary – Sinda Project
|
Page 70
|
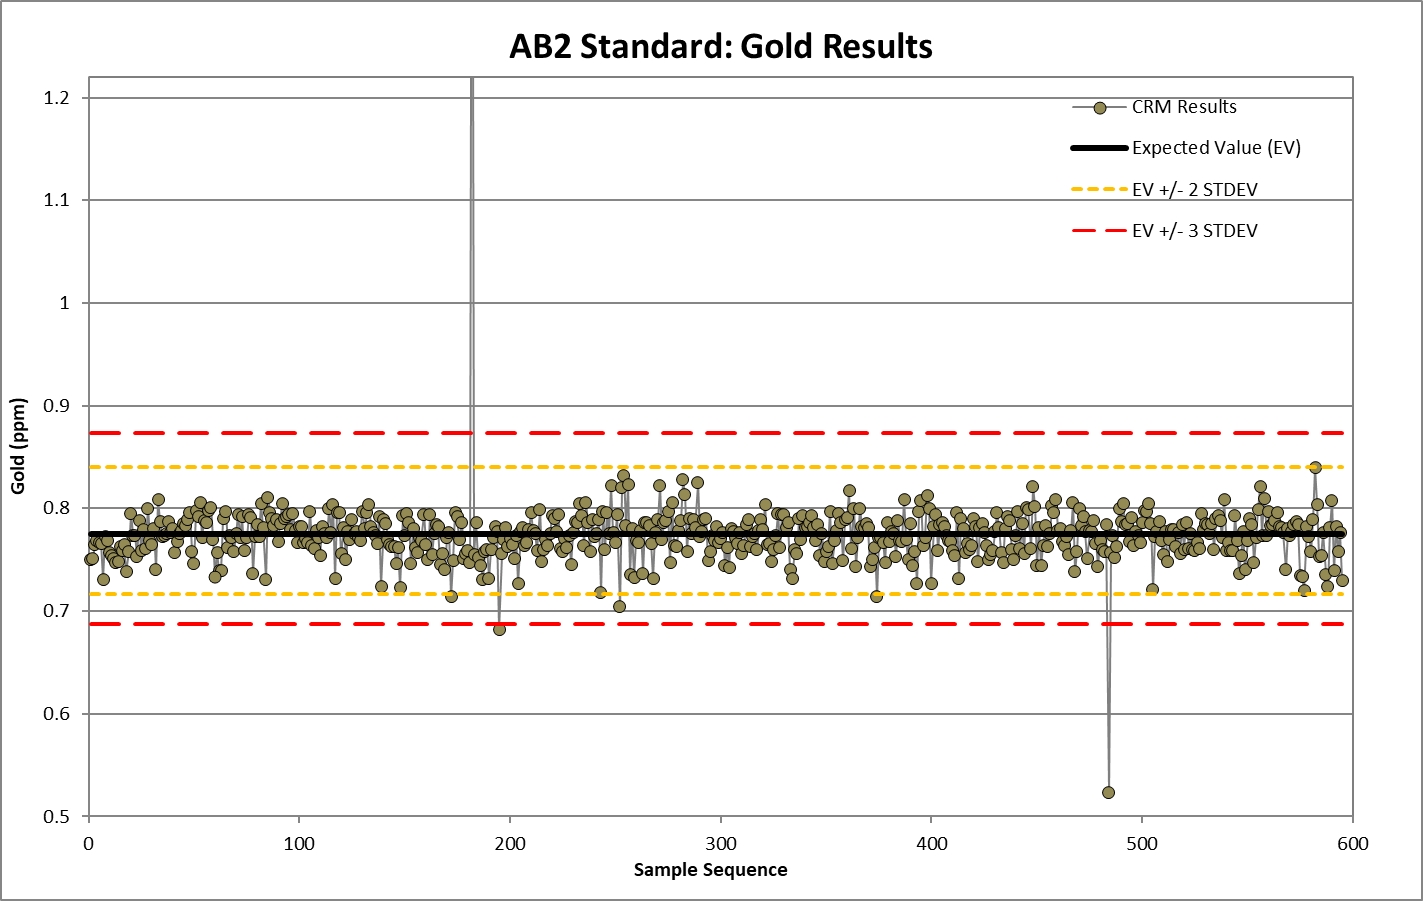
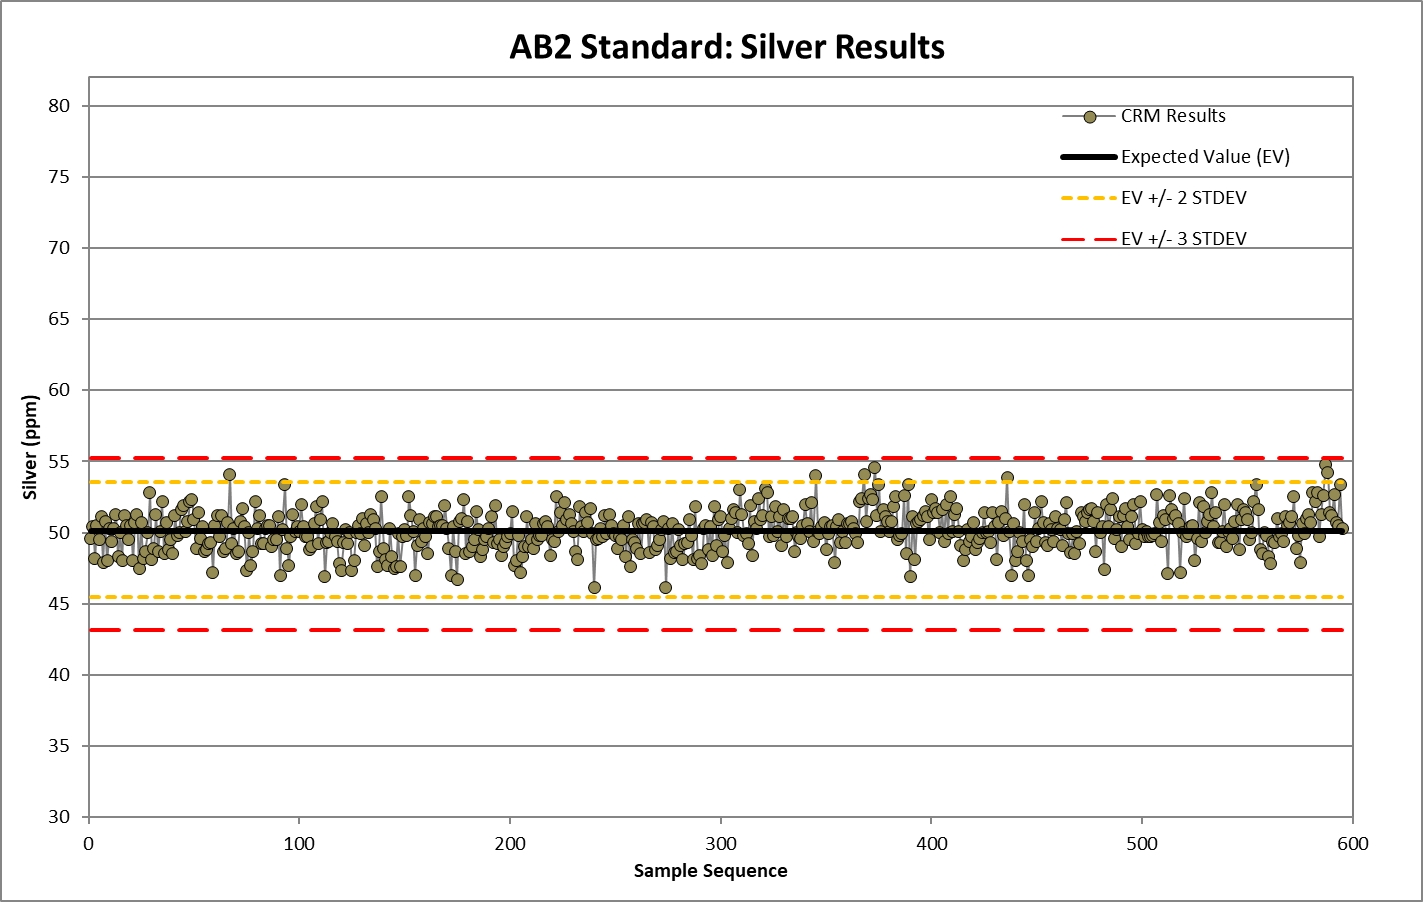
Source: SRK, 2025
|
SRK Consulting (U.S.), Inc.
SEC Technical Report Summary – Sinda Project
|
Page 71
|
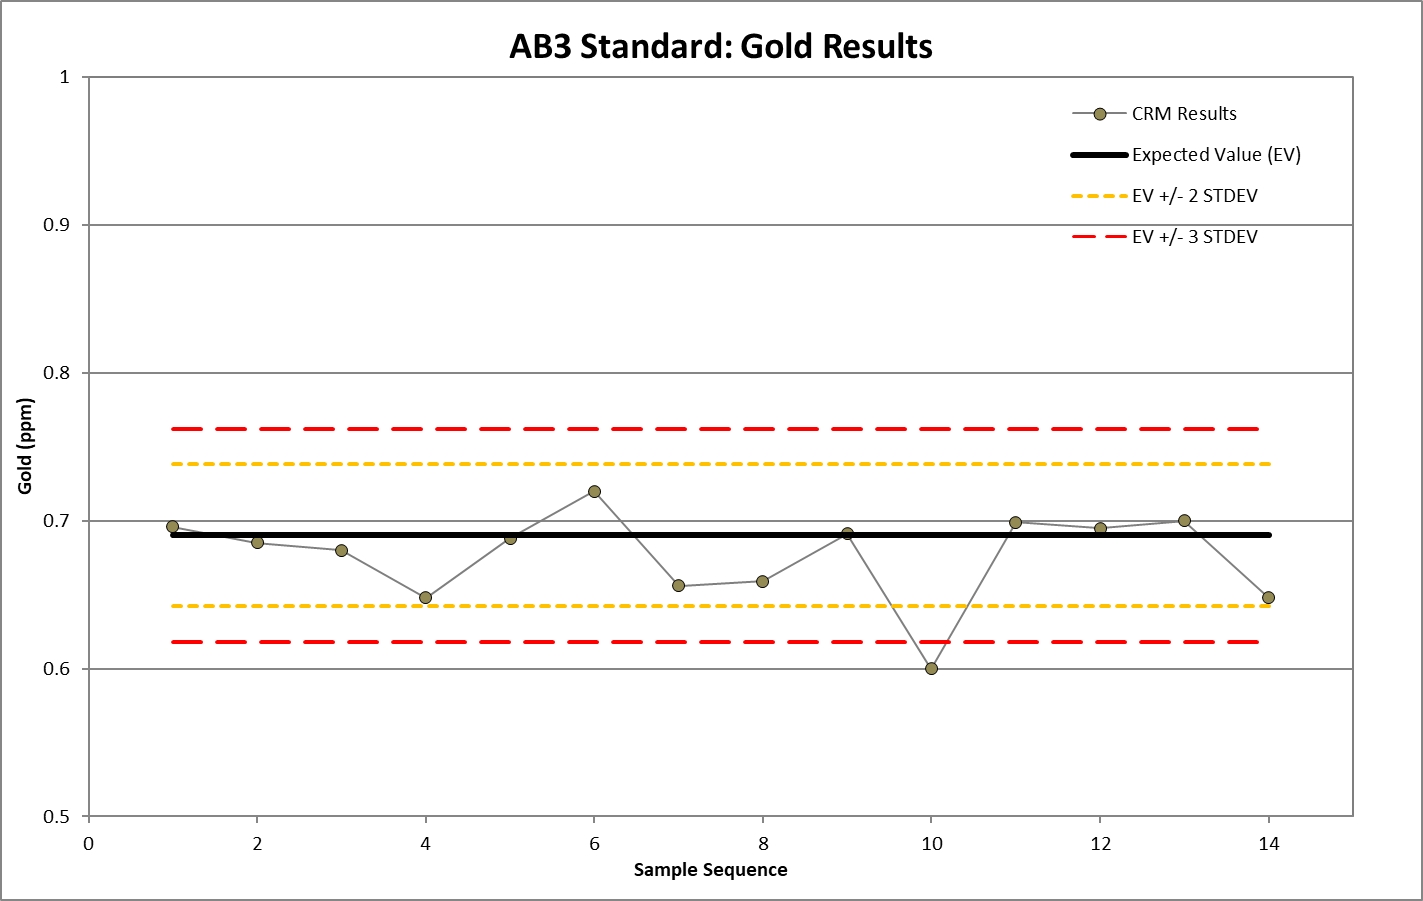
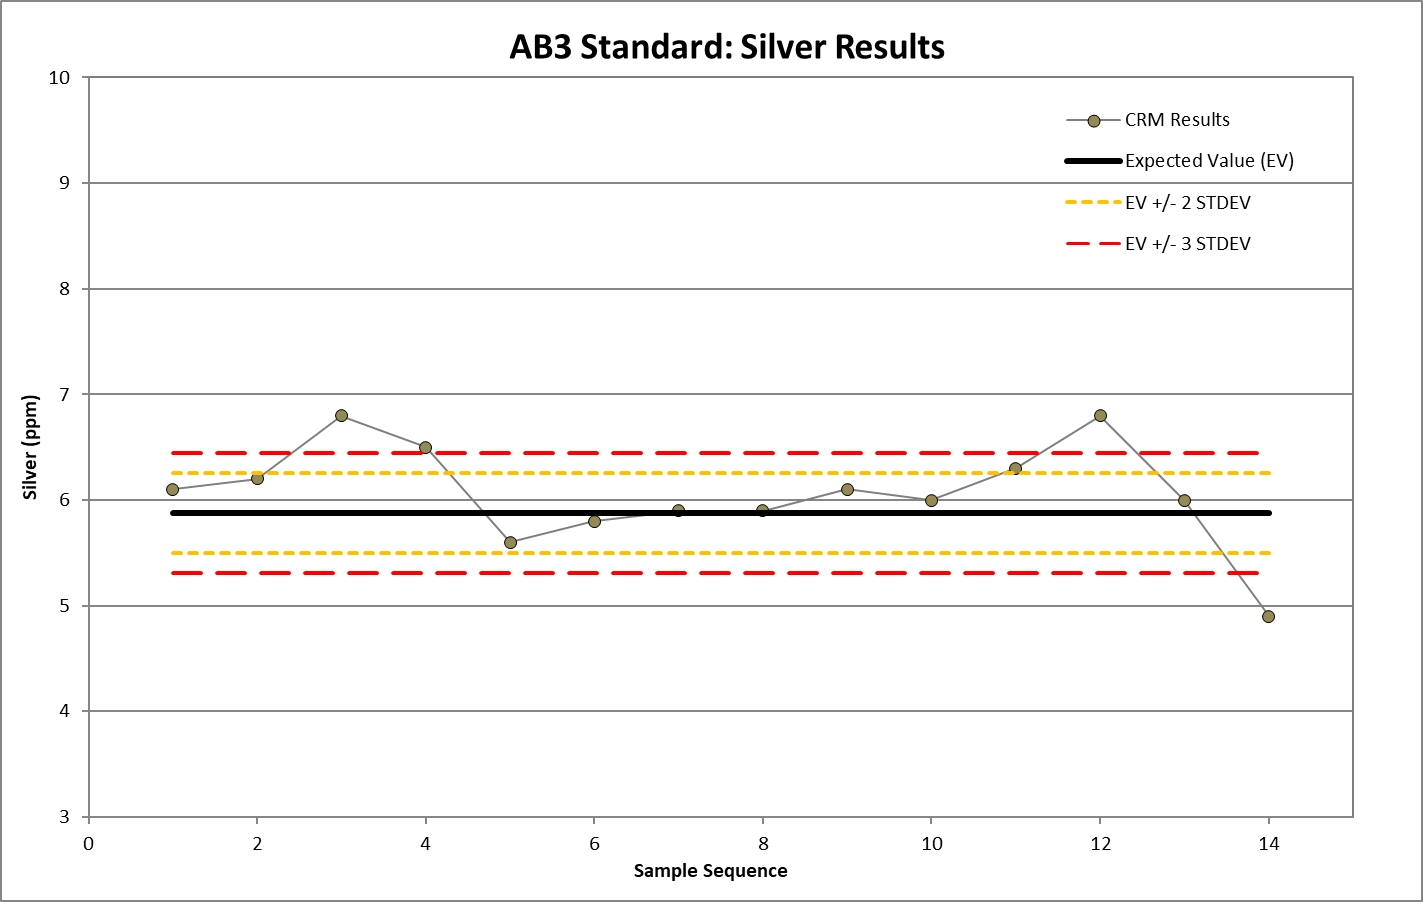
Source: SRK, 2025
|
SRK Consulting (U.S.), Inc.
SEC Technical Report Summary – Sinda Project
|
Page 72
|
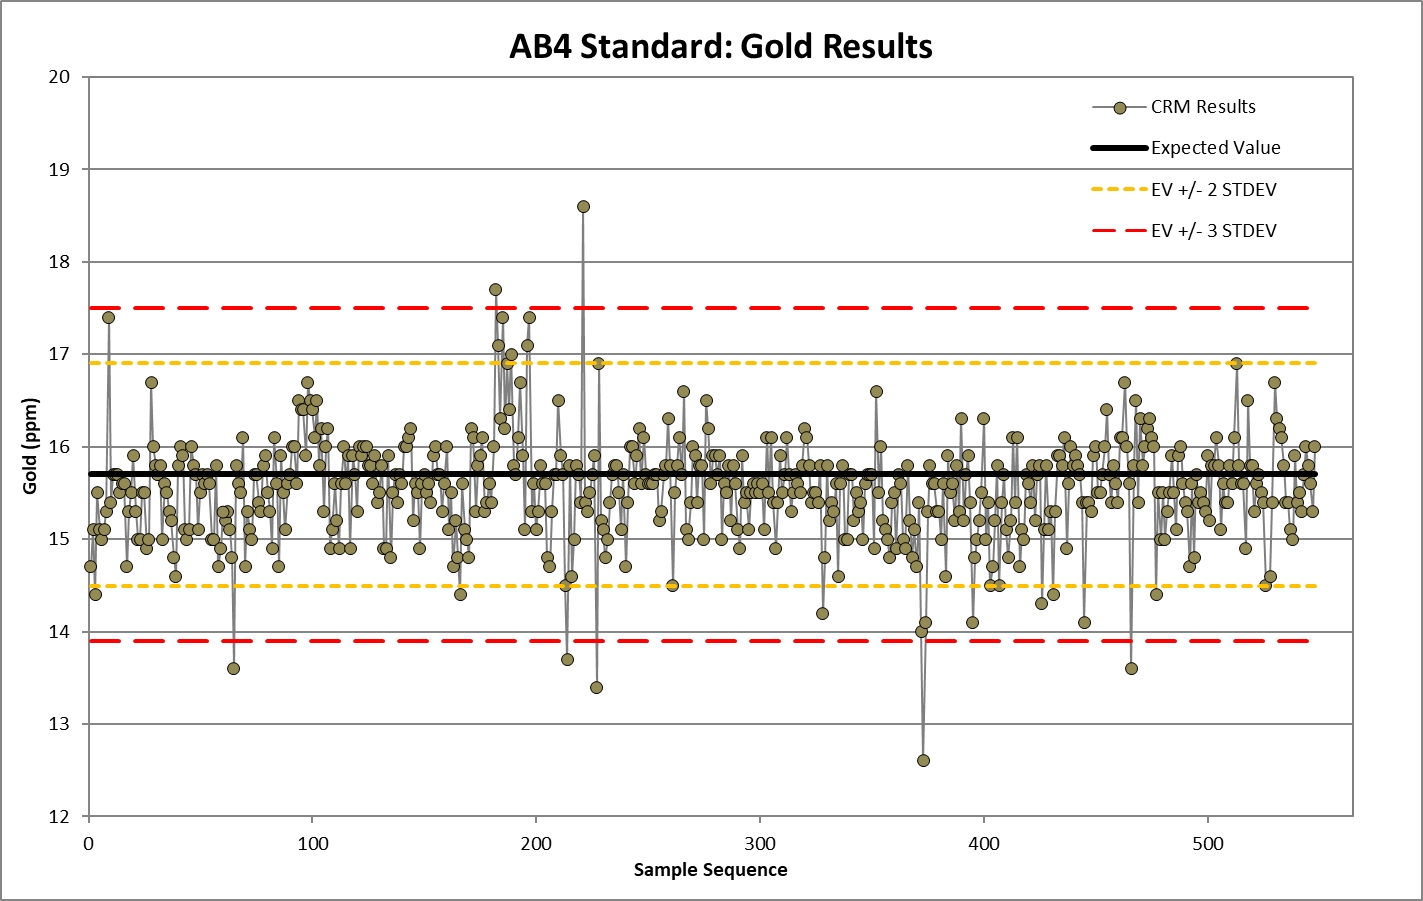
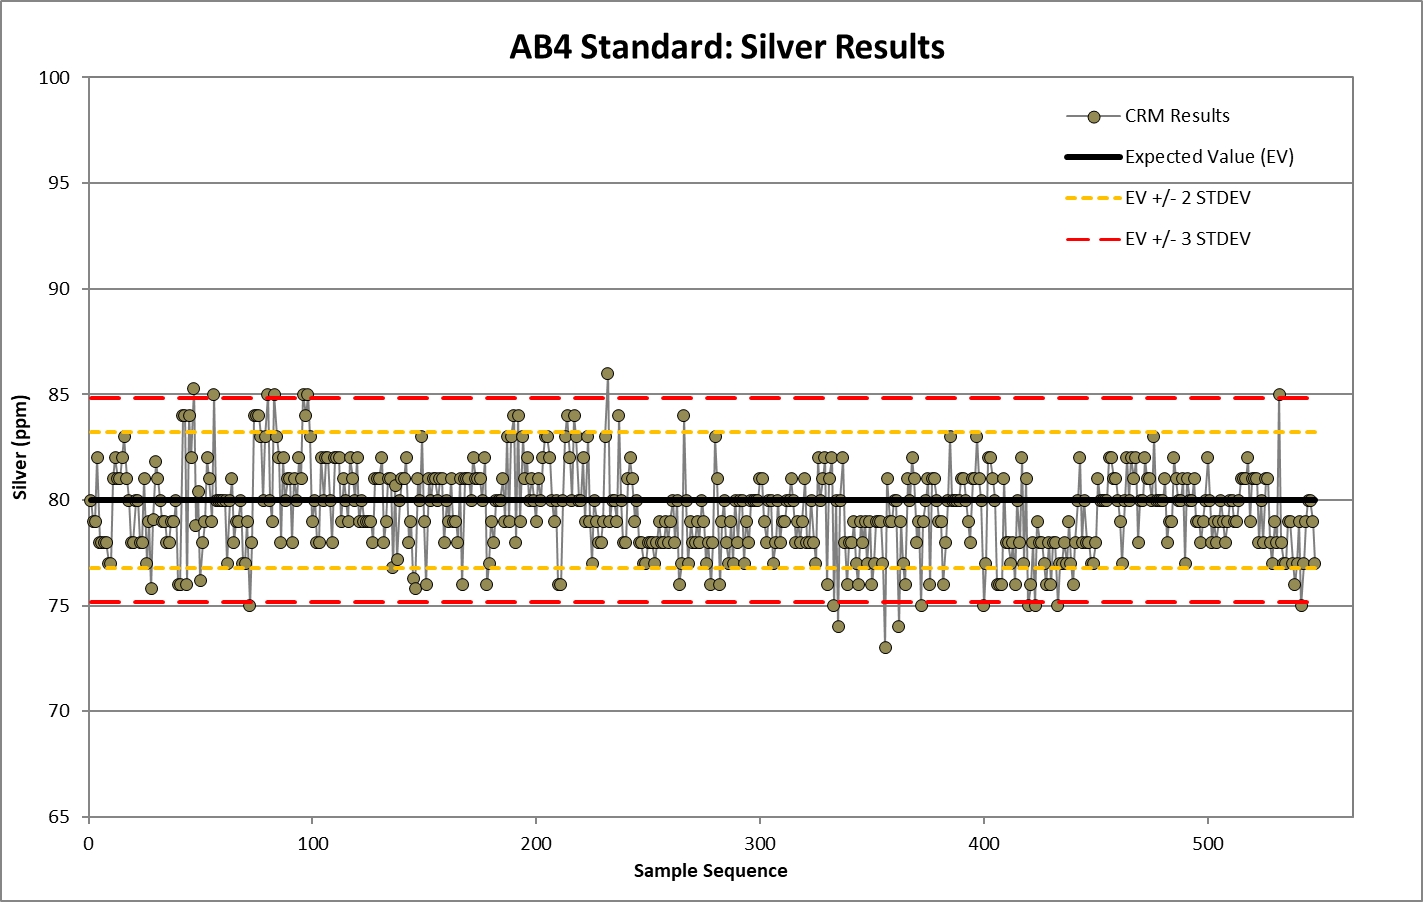
Source: SRK, 2025
|
SRK Consulting (U.S.), Inc.
SEC Technical Report Summary – Sinda Project
|
Page 73
|
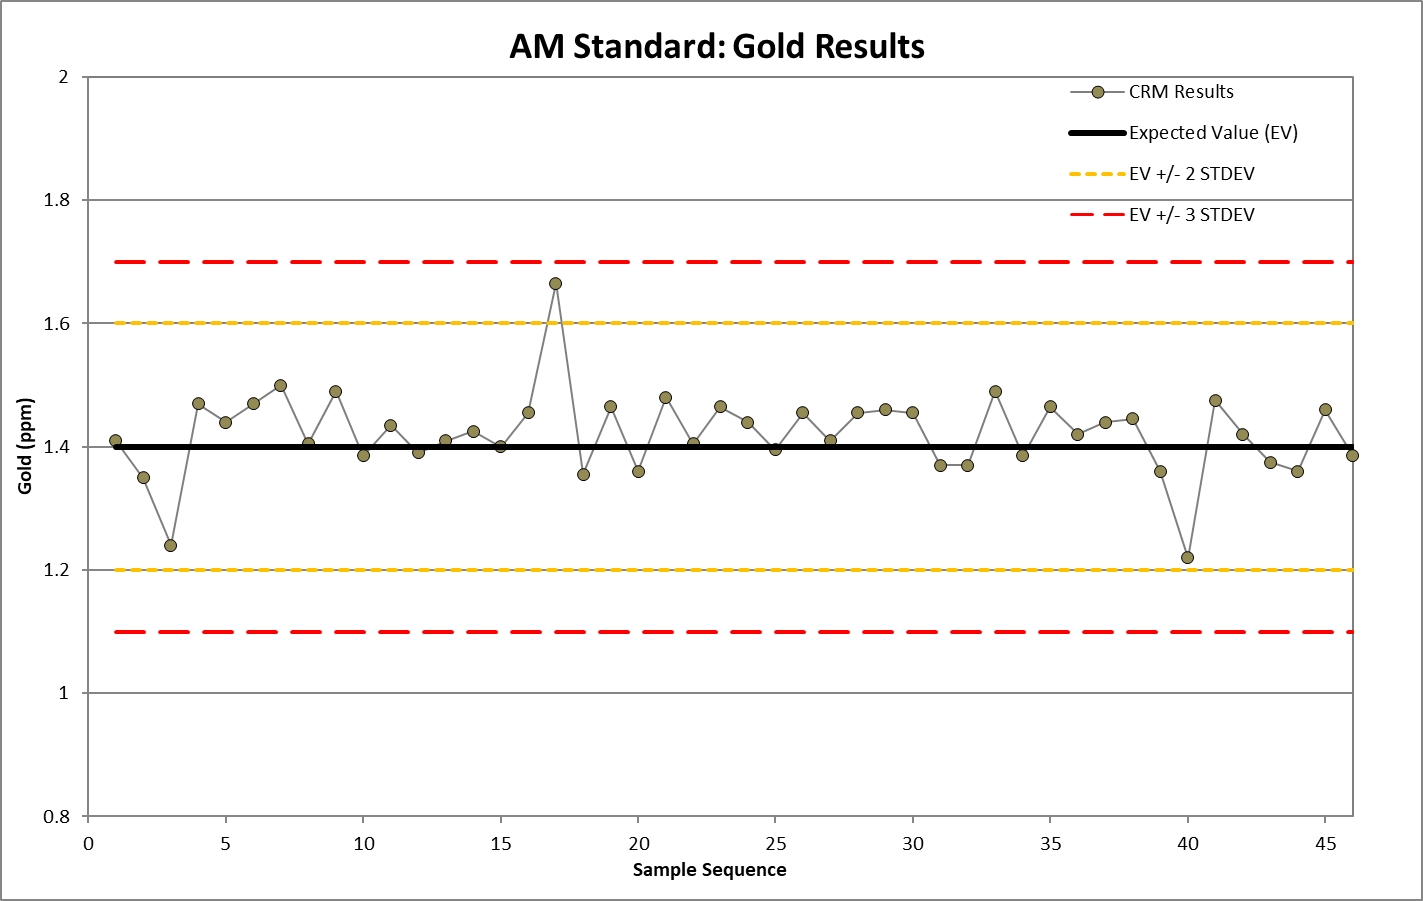
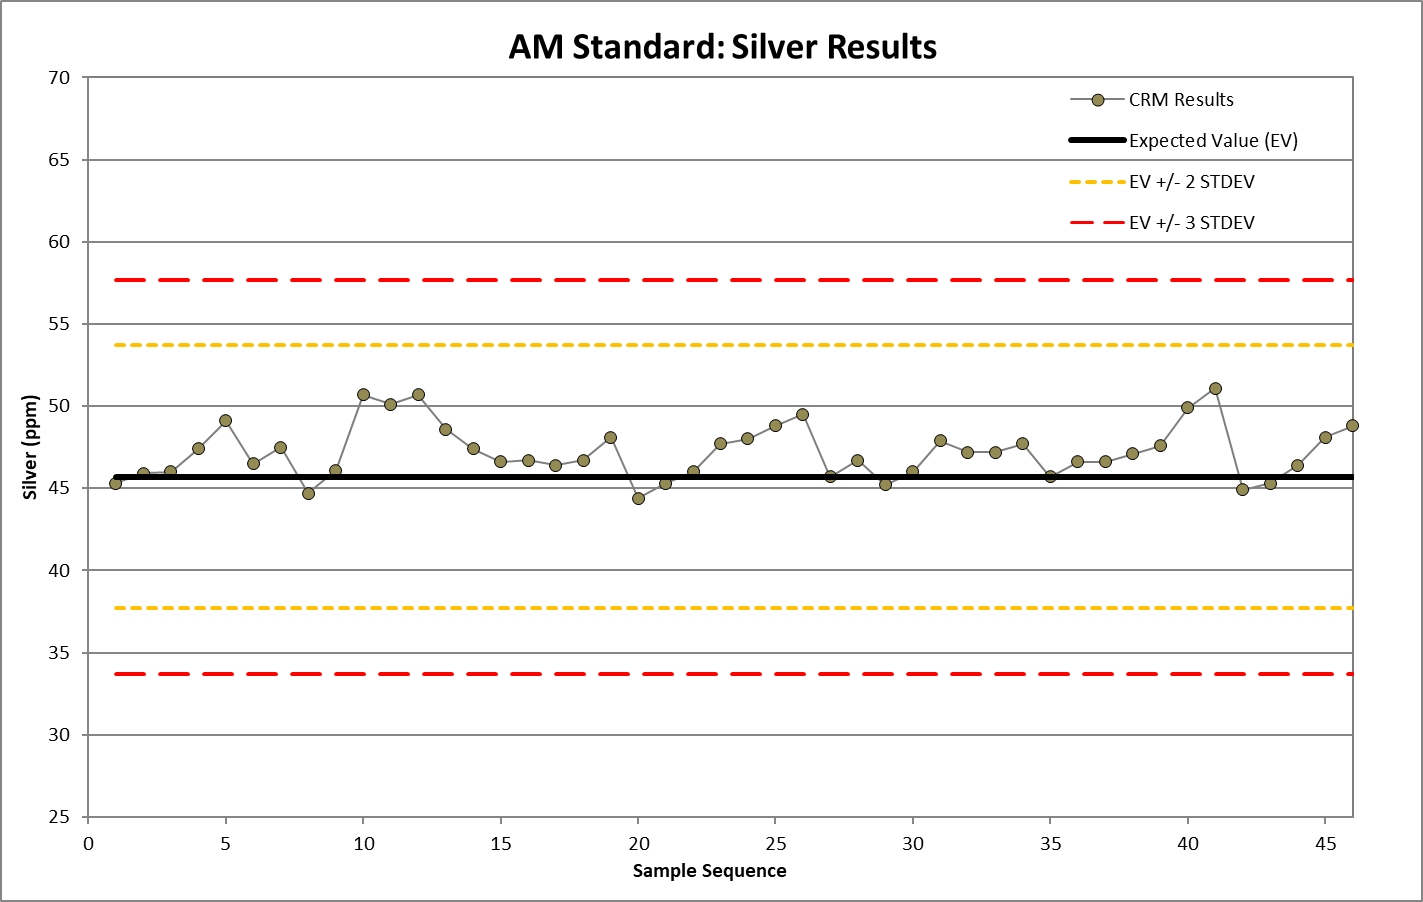
Source: SRK, 2025
|
SRK Consulting (U.S.), Inc.
SEC Technical Report Summary – Sinda Project
|
Page 74
|
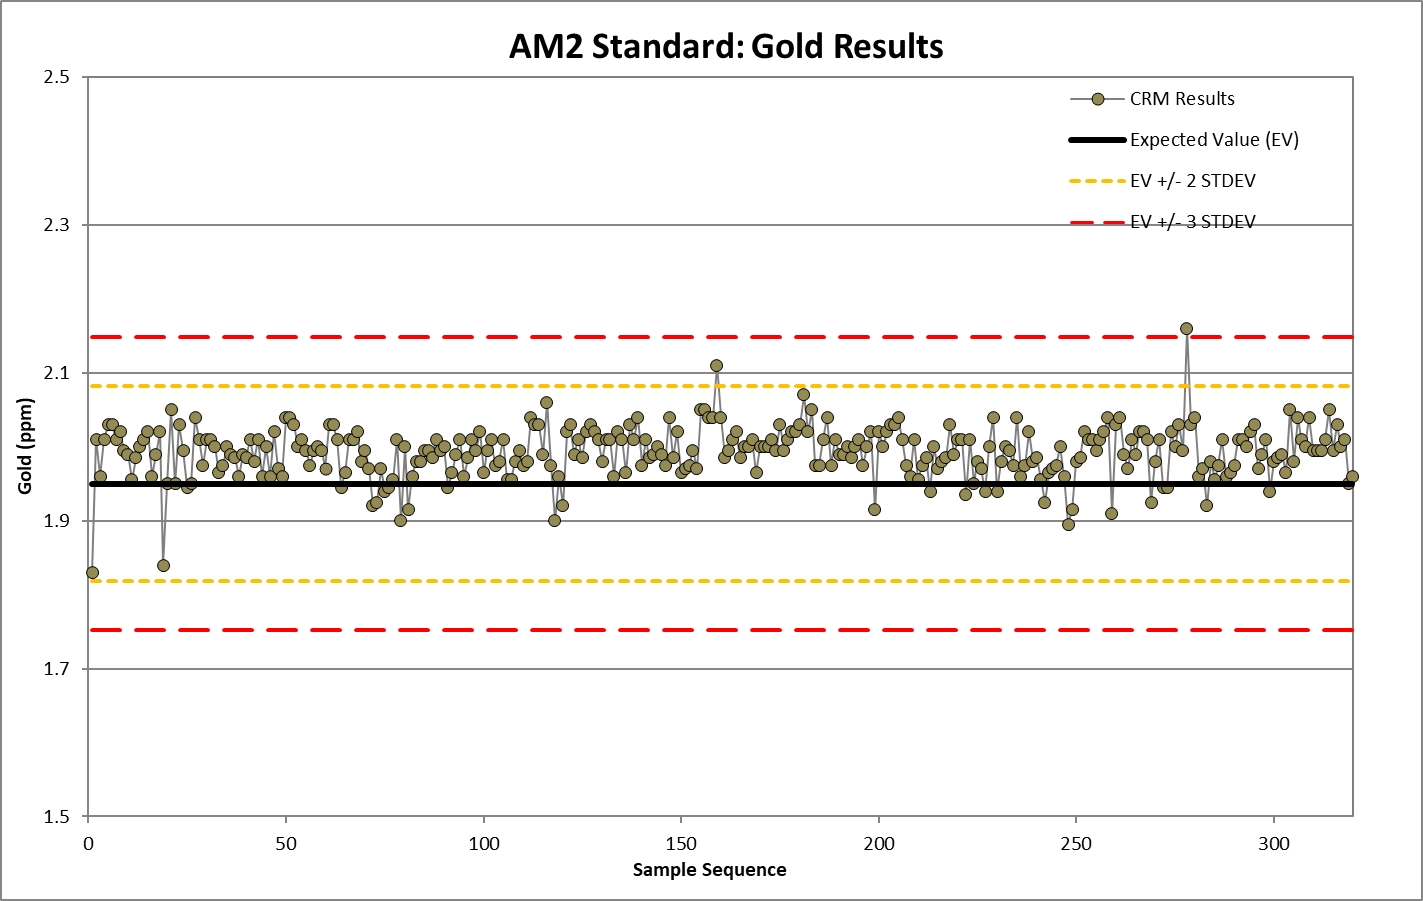
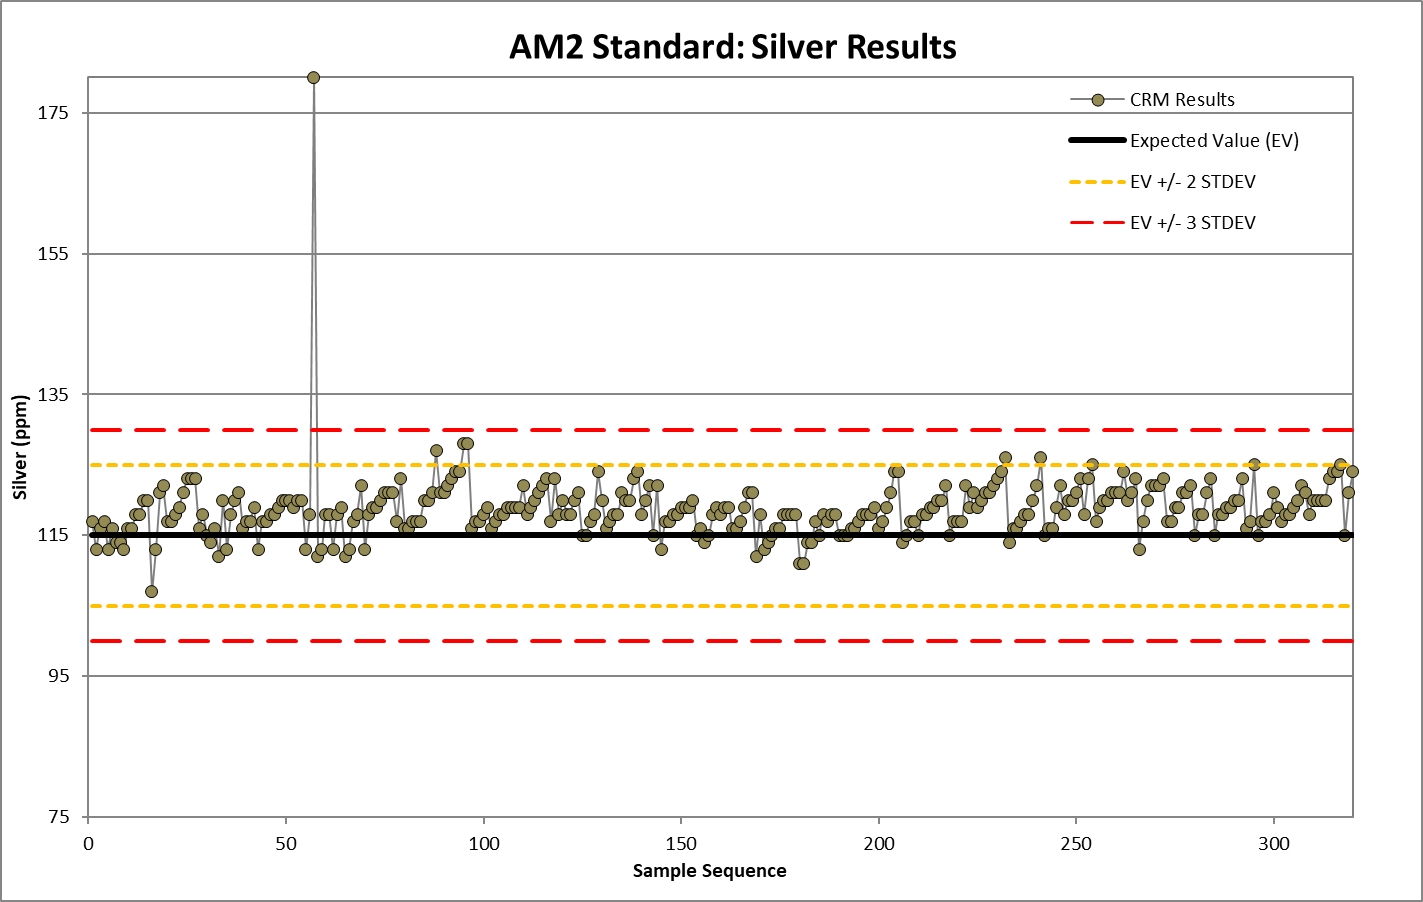
Source: SRK, 2025
|
SRK Consulting (U.S.), Inc.
SEC Technical Report Summary – Sinda Project
|
Page 75
|
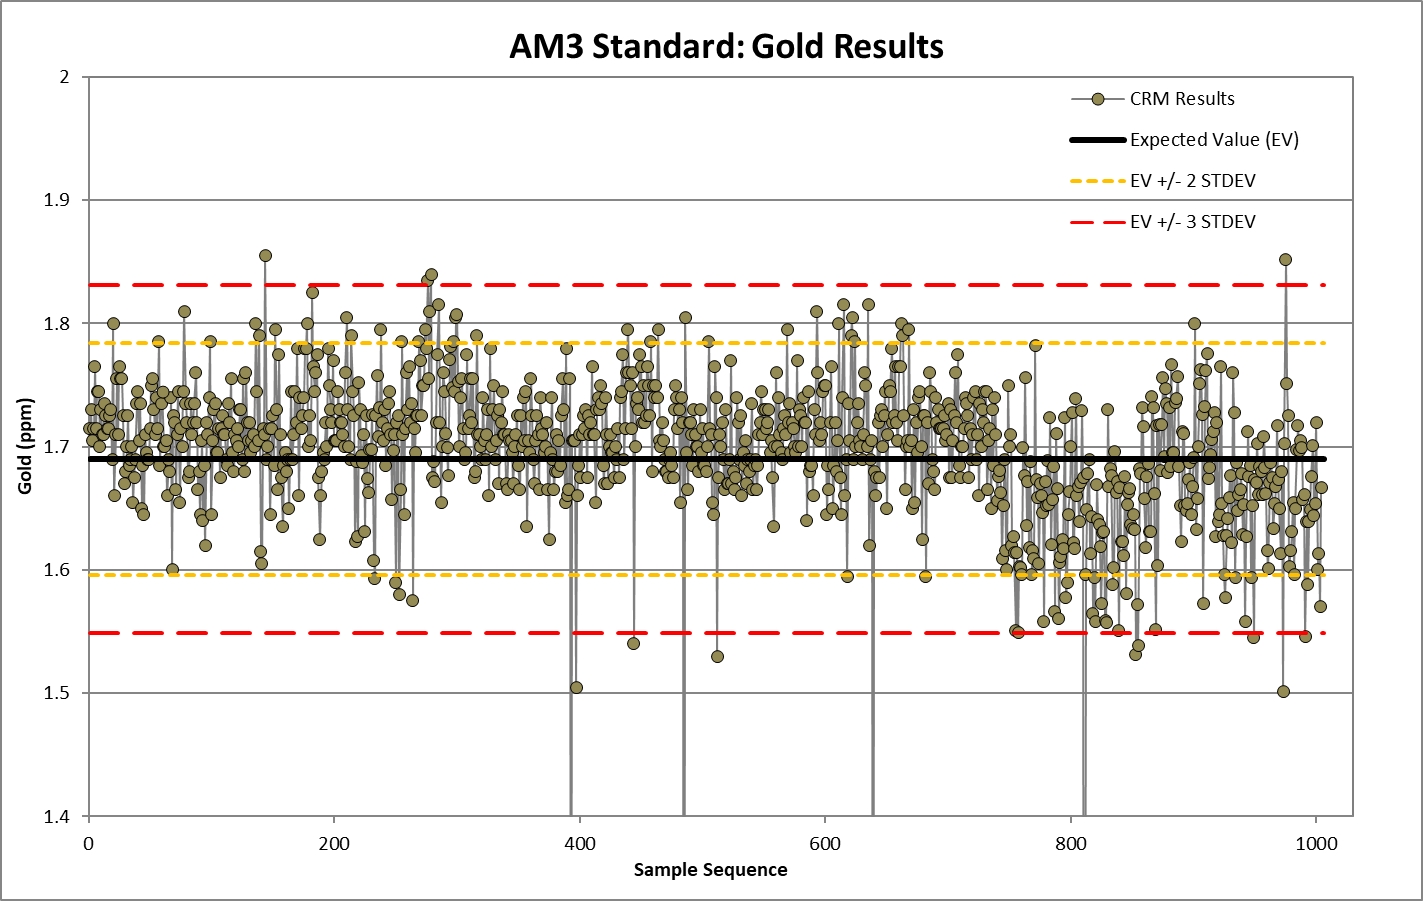
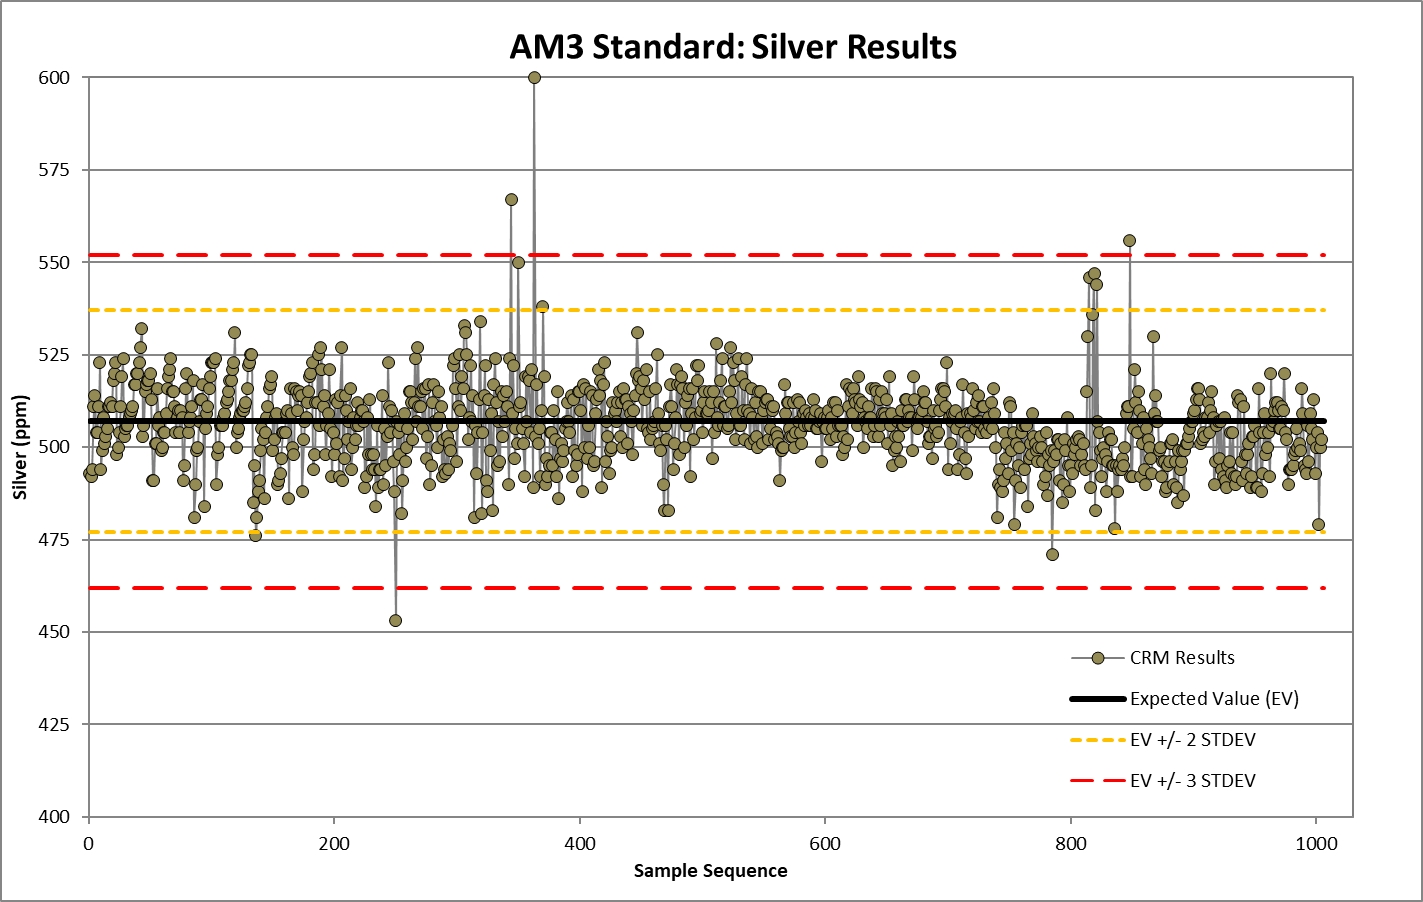
Source: SRK, 2025
|
SRK Consulting (U.S.), Inc.
SEC Technical Report Summary – Sinda Project
|
Page 76
|
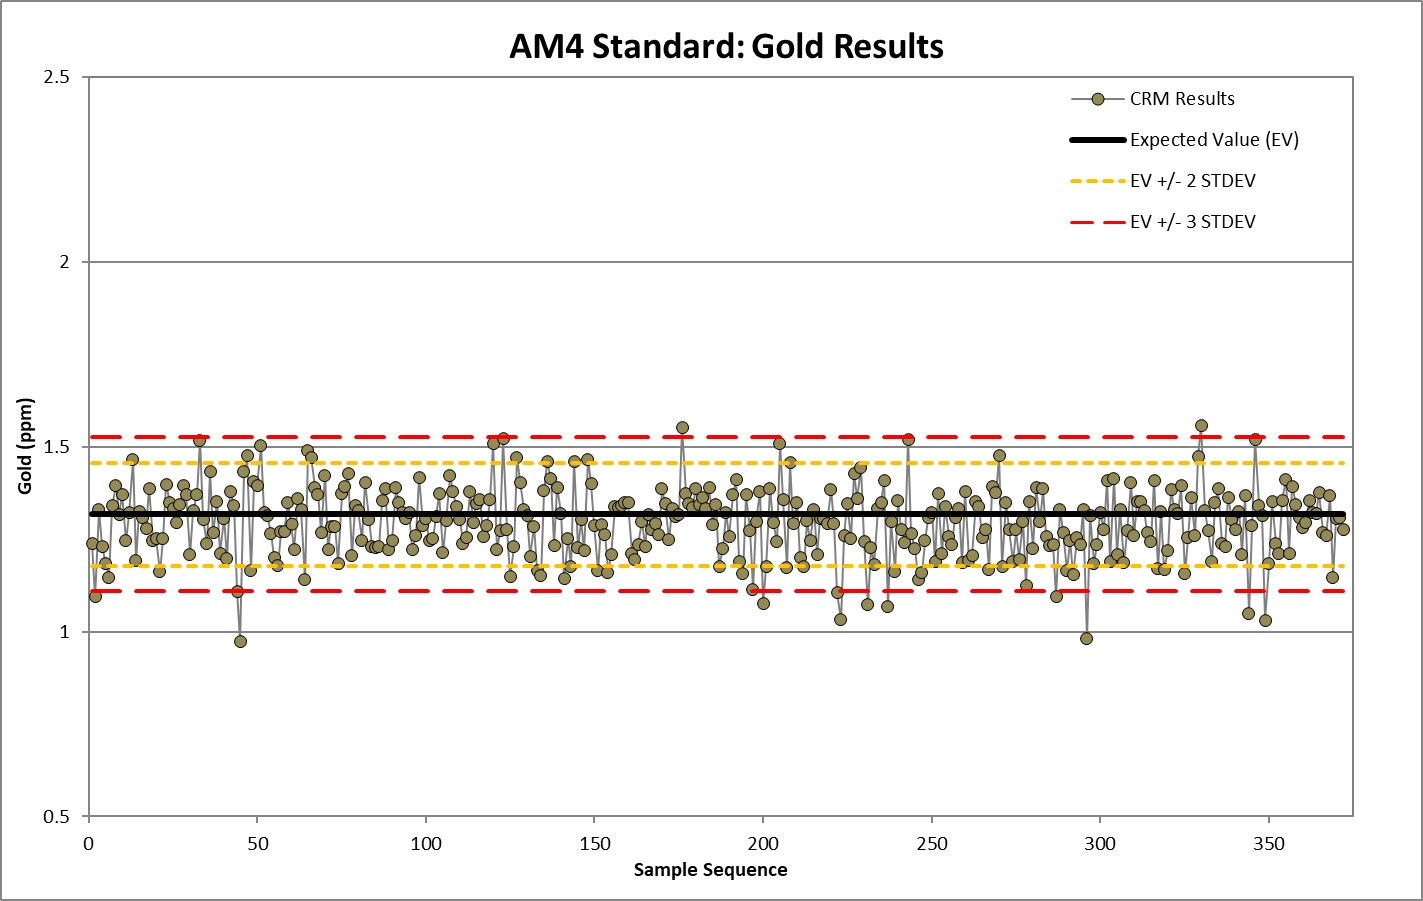
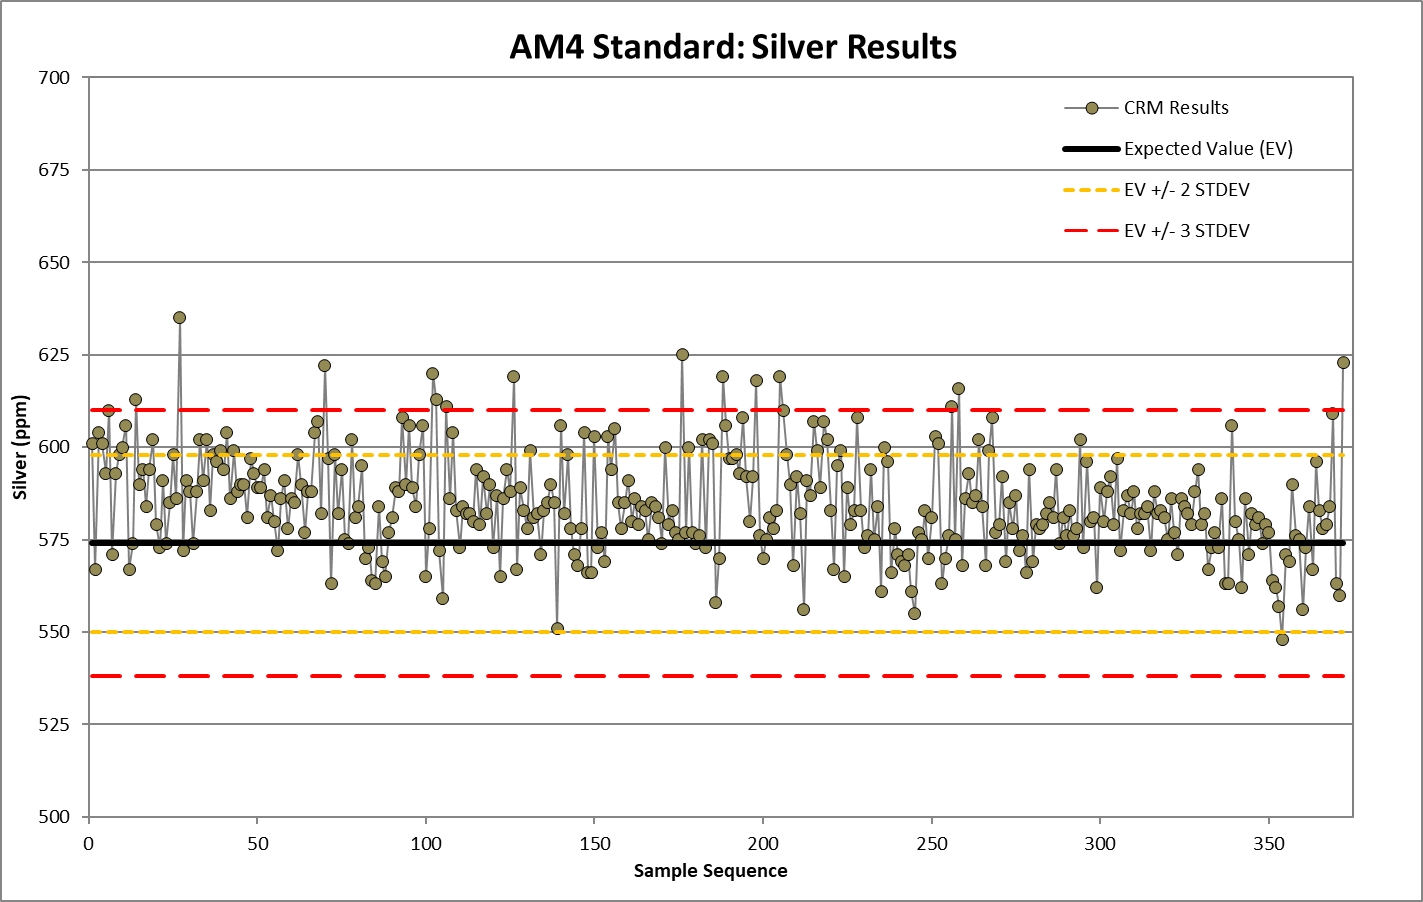
Source: SRK, 2025
For both Ag and Au, Sinda is utilizing a variety of standards with certified grades in the appropriate range for Sinda mineralization (Table 8‑6). SRK recommends that Sinda investigate a
higher-grade Ag CRM source for sample intervals that are visually estimated to exceed well above 1,000 ppm Ag, as the OREAS 605 ALTO and OREAS605B standards have expected values of 965 ppm Ag and 1,015 ppm Ag, respectively.
|
SRK Consulting (U.S.), Inc.
SEC Technical Report Summary – Sinda Project
|
Page 77
|
Although Ag and Au are the primary economic elements of interest, Cu, Pb, Zn, S, and As values are assayed and estimated for both exploration guidance and
metallurgical purposes. Reference standard values were available for these elements, but Sinda does not routinely track QA/QC protocols for all base metals unless needed to determine issues with the primary precious metals. SRK considers
this practice acceptable, but it should be amended if possible future areas of the Project begin encountering potentially economic base metal grades.
Sinda provided data for 4,318 blank samples as summarized in Table 8‑7. The overall blank insertion frequency was 5.0%, which meets the rate for generally
accepted industry standards. Both fine pulps and coarse matrix blanks were utilized, which is appropriate for the Sinda mineralization and tests different aspects of the laboratory sampling progression. Blank material is processed for Sinda
by Bureau Veritas from barren post-mineral ignimbrite sourced locally. The laboratory runs a five-laboratory round robin testing each time new blank material is batched to ensure no elevated metal values are encountered.
Internally, Sinda considered blank results greater than three standard deviations from the expected value to represent a QA/QC failure. This threshold is more conservative than the typical
confidence limit of five times the lower laboratory detection limit (LLDL) for assessing blank results. Regardless, minimal QA/QC failures were observed with less than a 1% overall failure rate of blanks observed during the SRK review.
Figure 8‑15 through Figure 8‑20 show the detailed results of the blank samples over time.
|
Sinda ID
|
Blank Type
|
Number of
Samples |
5X LLDL
(ppm) |
Failure
Rate (%) |
Failure
Rate (%) |
|||||
|
Au
|
Ag
|
Au
|
Ag
|
Au
|
Ag
|
|||||
|
C1
|
Fine Blank, silica
|
139
|
0.025
|
2.5
|
2
|
2
|
1.4
|
1.4
|
||
|
C2
|
Fine Blank, ignimbrite
|
286
|
0.025
|
2.5
|
2
|
4
|
0.7
|
1.4
|
||
|
C3
|
Coarse Blank, ingnimbrite
|
696
|
0.025
|
2.5
|
10
|
7
|
1.4
|
1.0
|
||
|
C4
|
Coarse Blank, ActLabs
|
569
|
0.025
|
2.5
|
2
|
1
|
0.4
|
0.2
|
||
|
C5
|
Fine Blank, ActLabs
|
1,074
|
0.025
|
2.5
|
2
|
3
|
0.2
|
0.3
|
||
|
C6
|
Coarse Blank, Bureau Veritas
|
1,554
|
0.025
|
2.5
|
11
|
11
|
0.7
|
0.7
|
||
Source: SRK, 2025
|
SRK Consulting (U.S.), Inc.
SEC Technical Report Summary – Sinda Project
|
Page 78
|
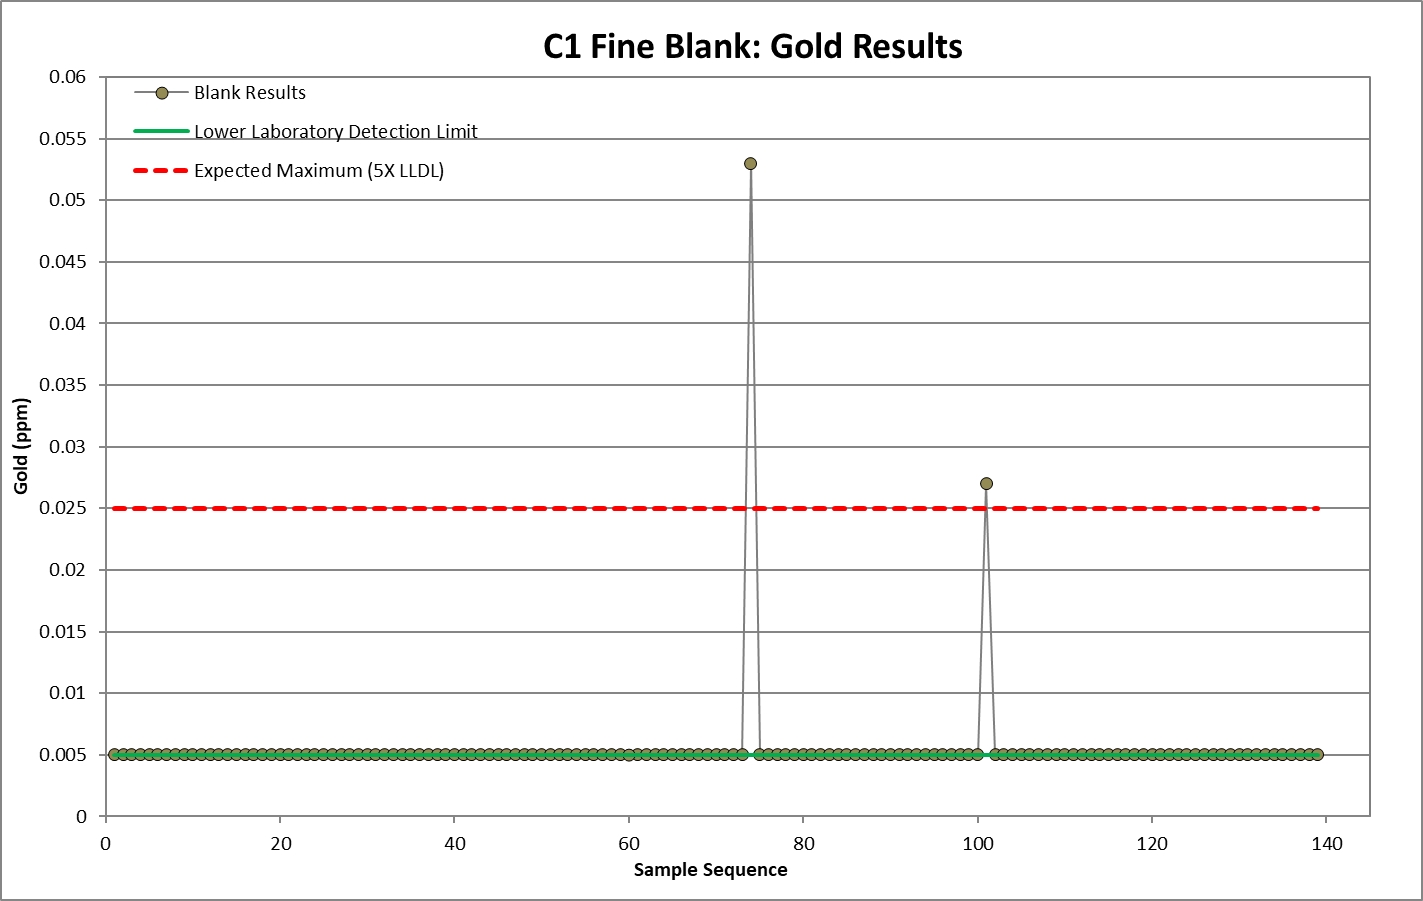
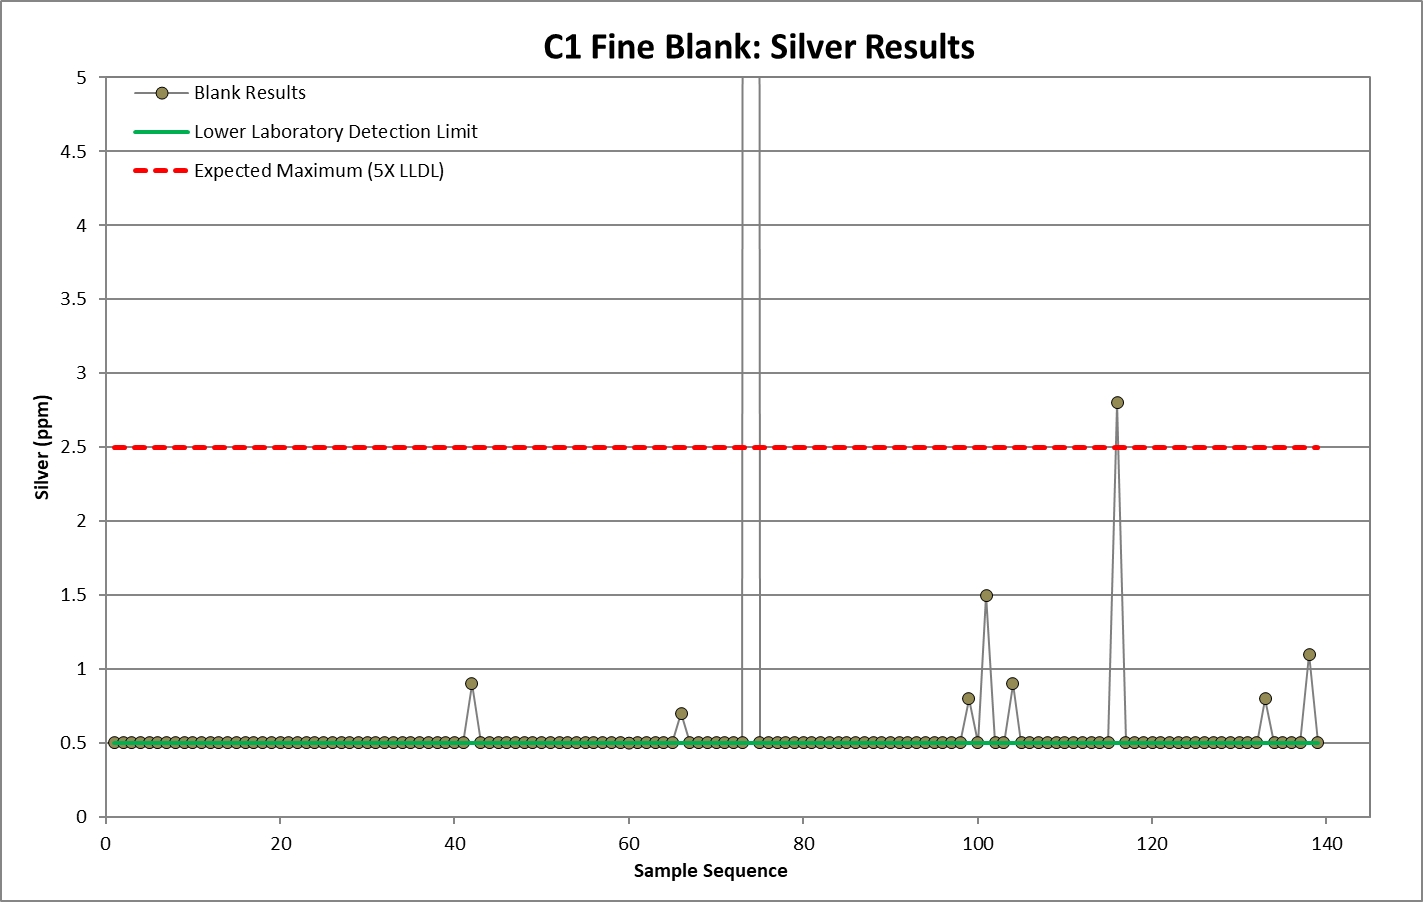
Source: SRK, 2025
|
SRK Consulting (U.S.), Inc.
SEC Technical Report Summary – Sinda Project
|
Page 79
|
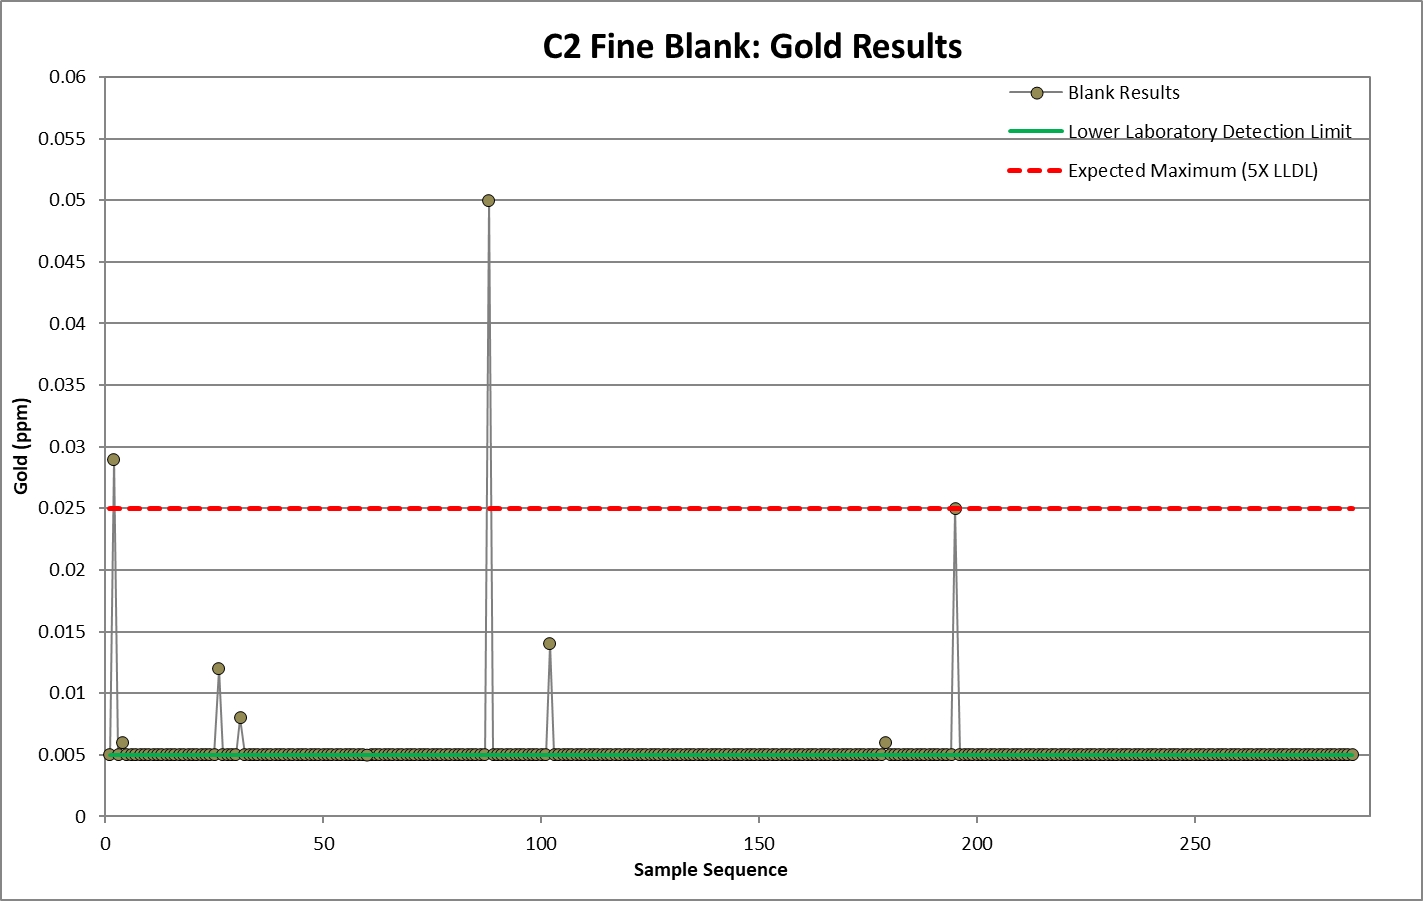
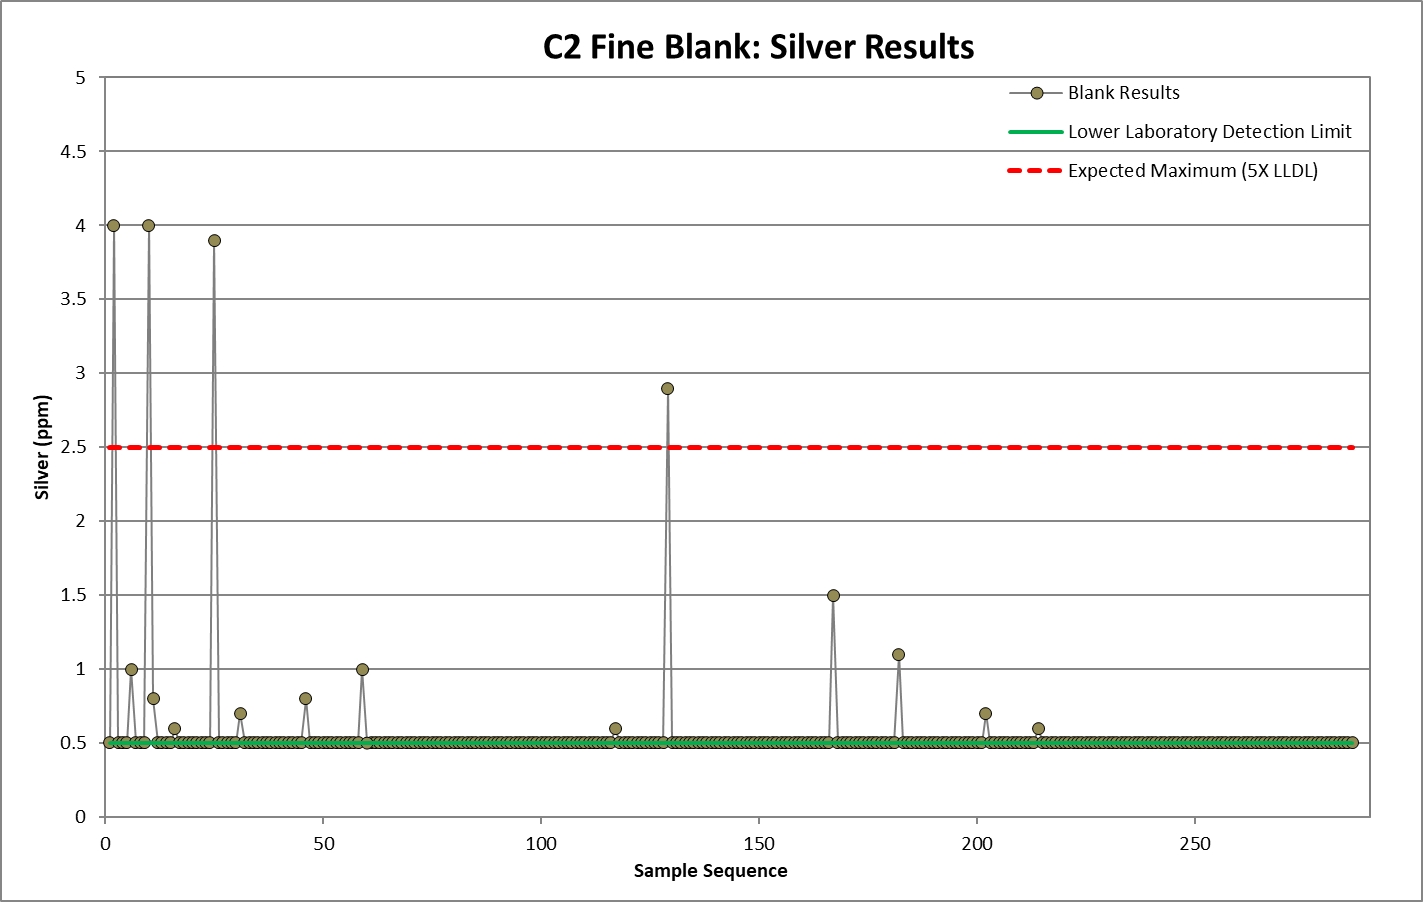
Source: SRK, 2025
|
SRK Consulting (U.S.), Inc.
SEC Technical Report Summary – Sinda Project
|
Page 80
|
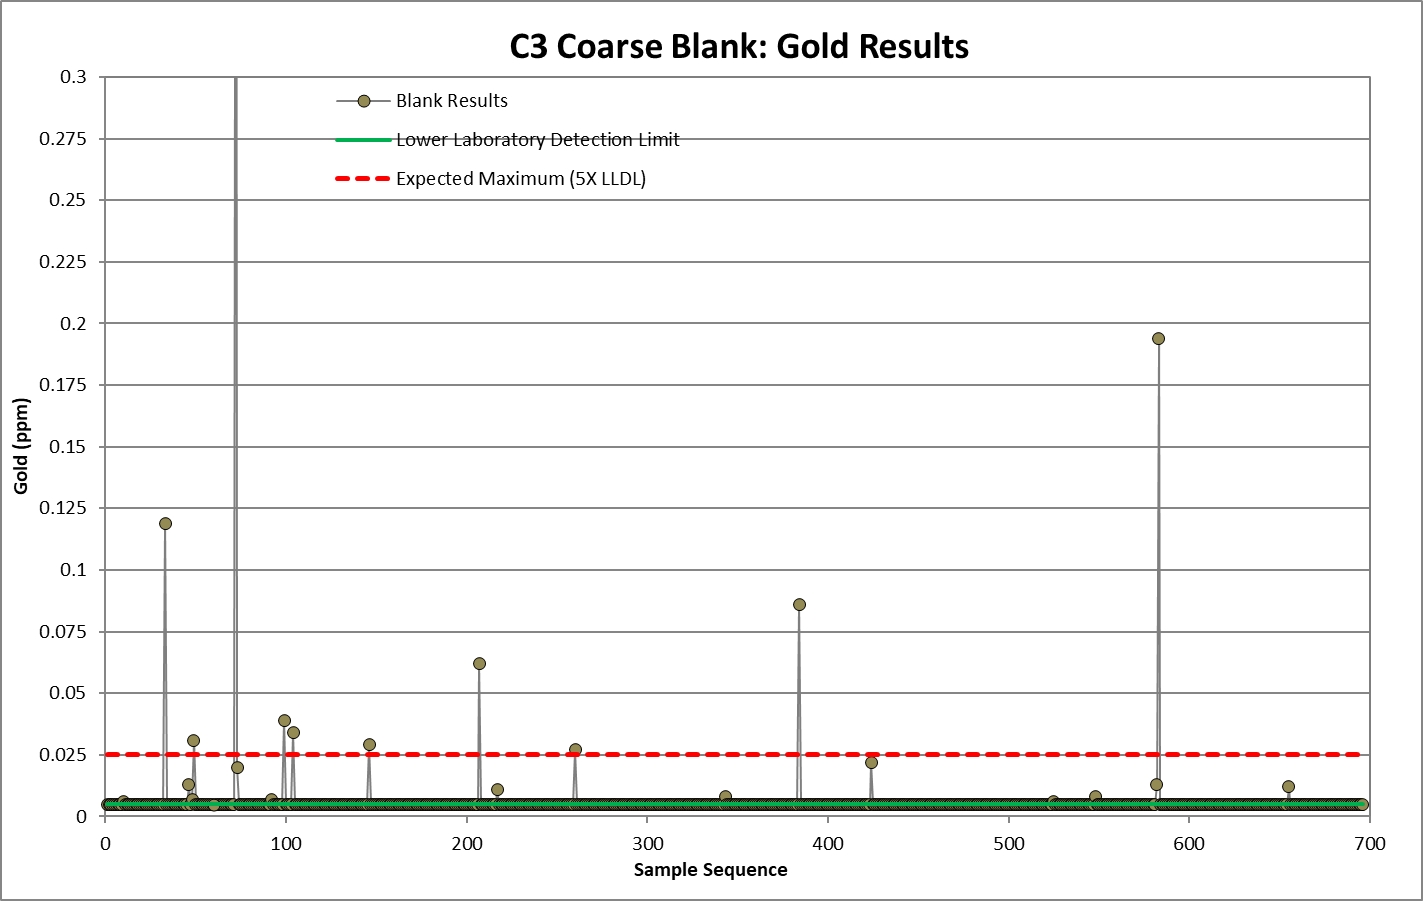
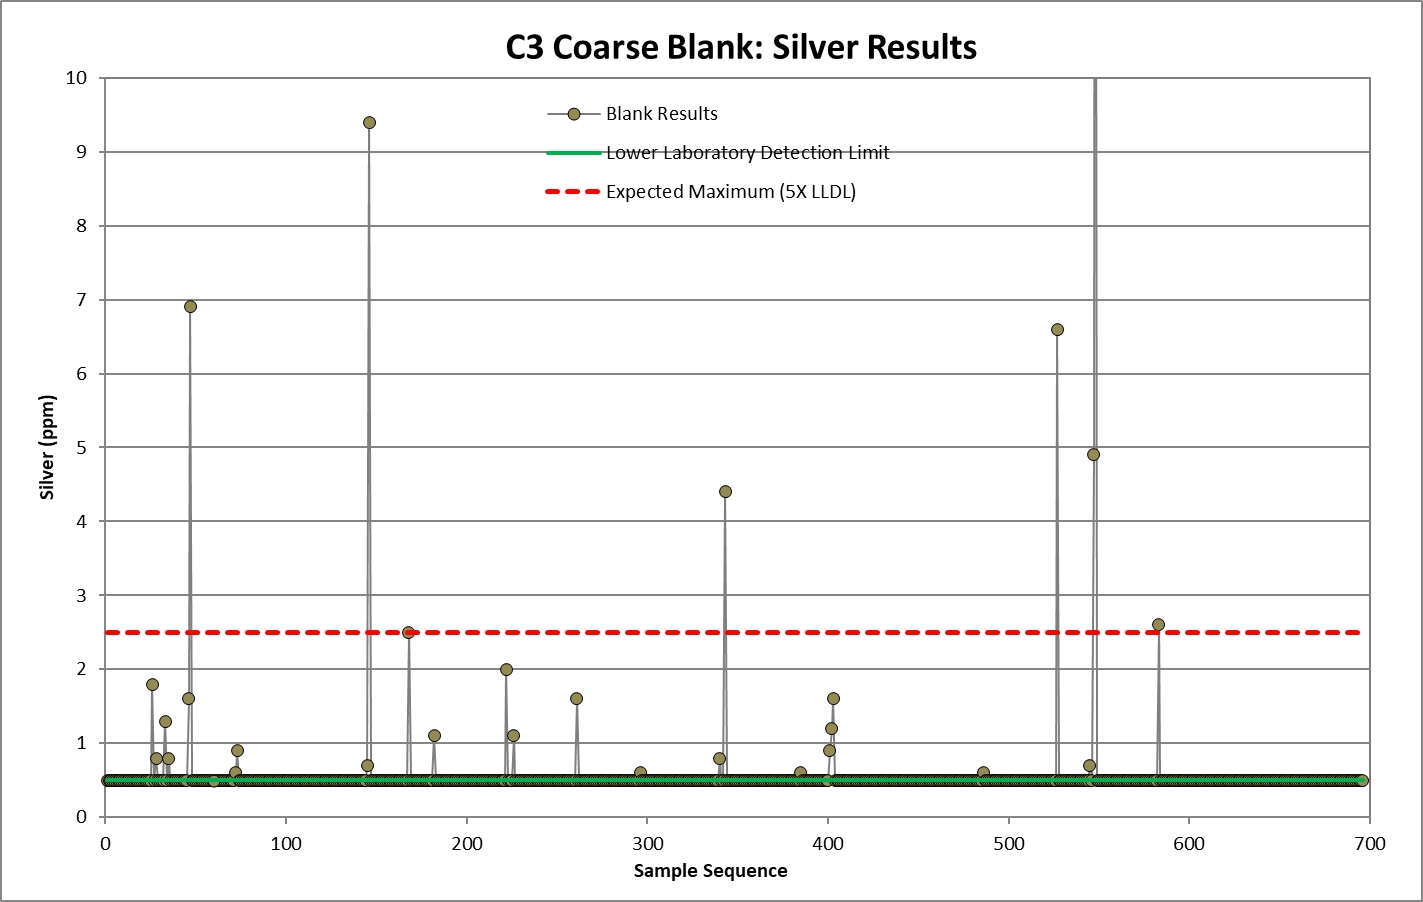
Source: SRK, 2025
|
SRK Consulting (U.S.), Inc.
SEC Technical Report Summary – Sinda Project
|
Page 81
|
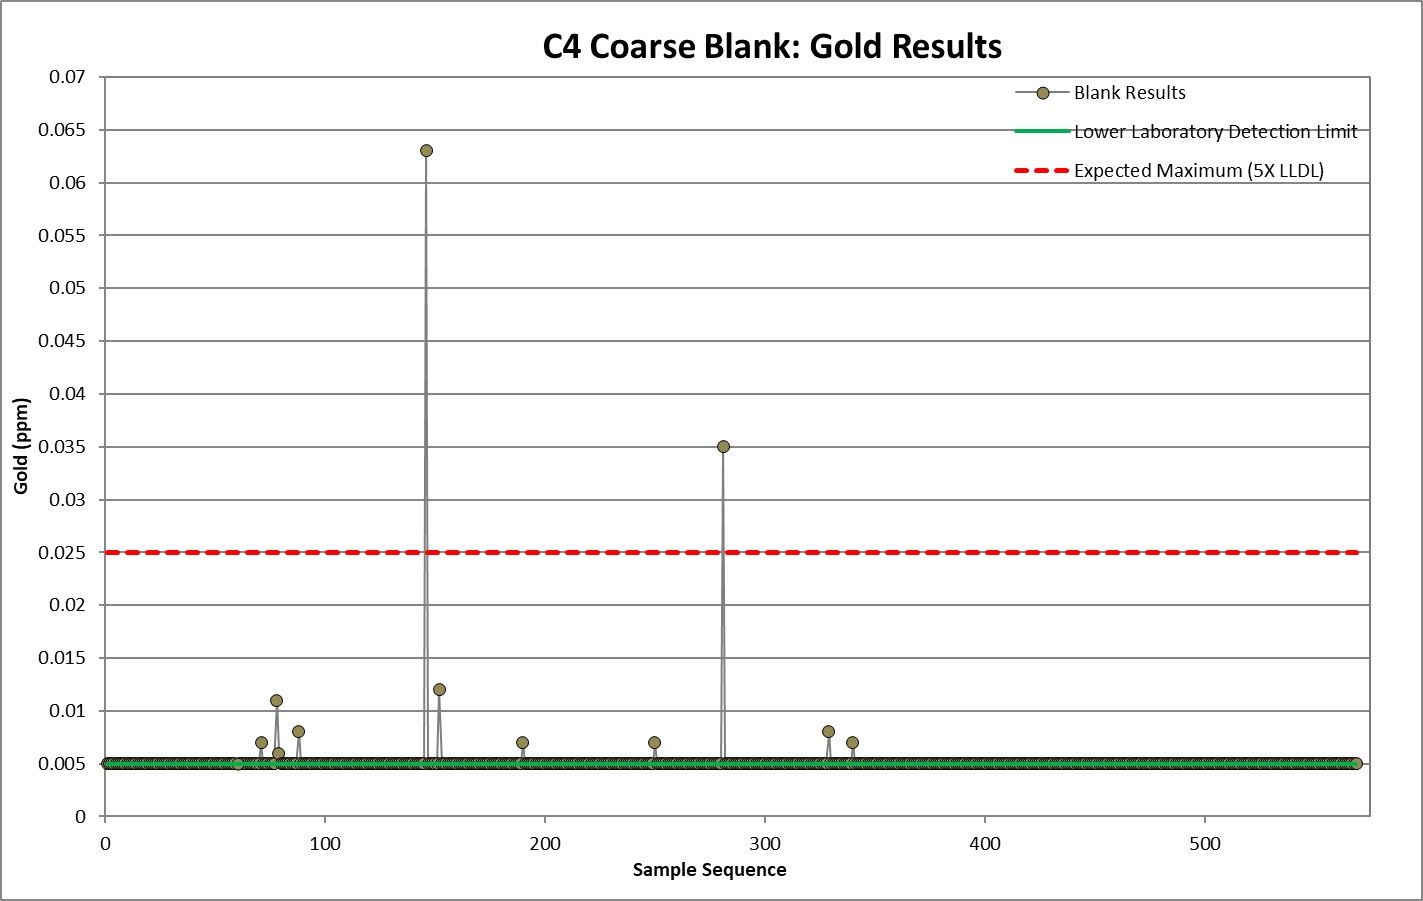
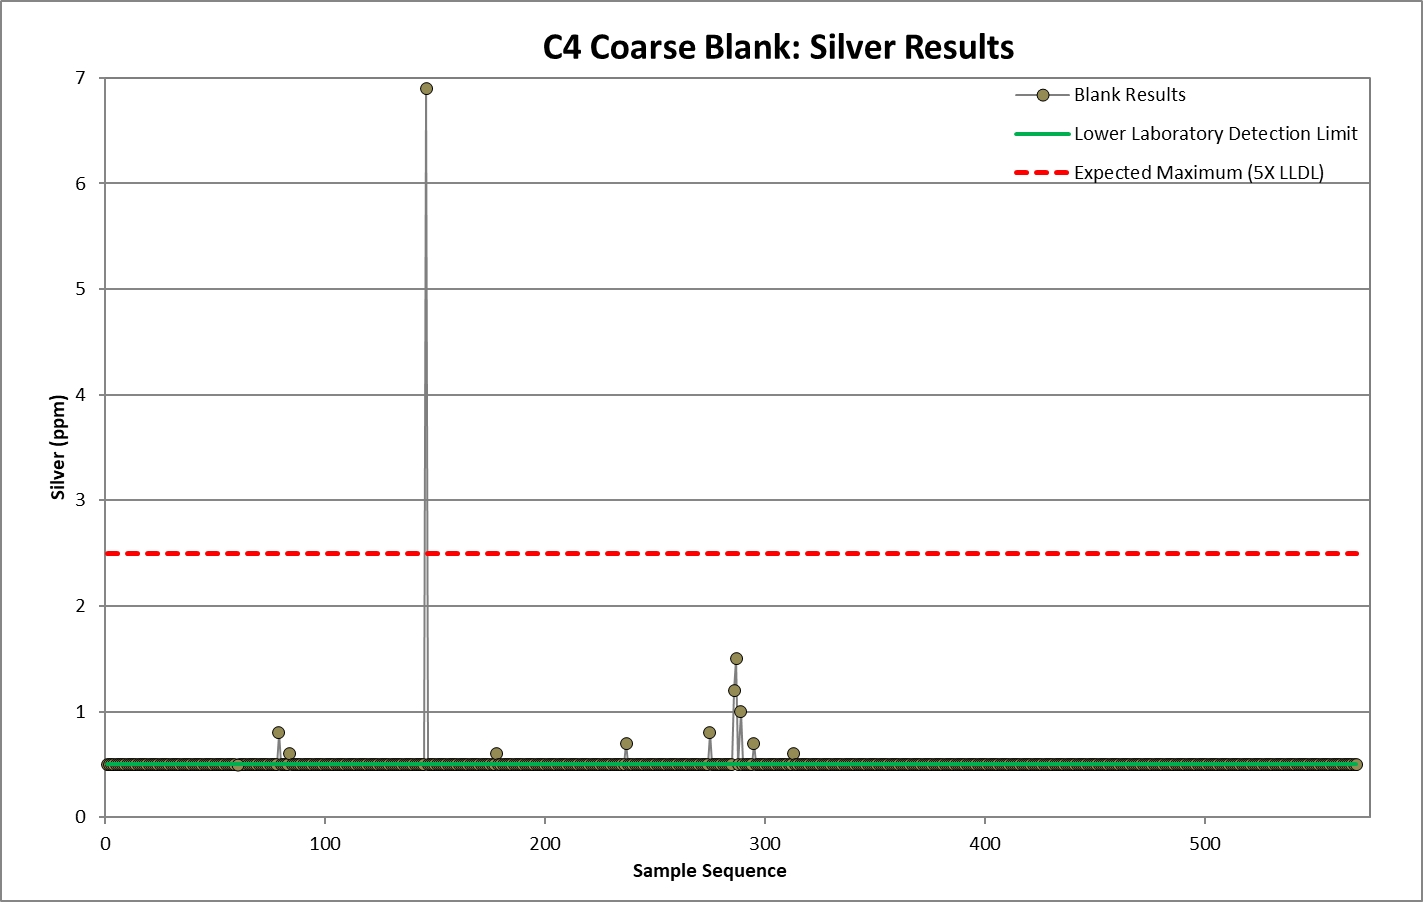
Source: SRK, 2025
|
SRK Consulting (U.S.), Inc.
SEC Technical Report Summary – Sinda Project
|
Page 82
|
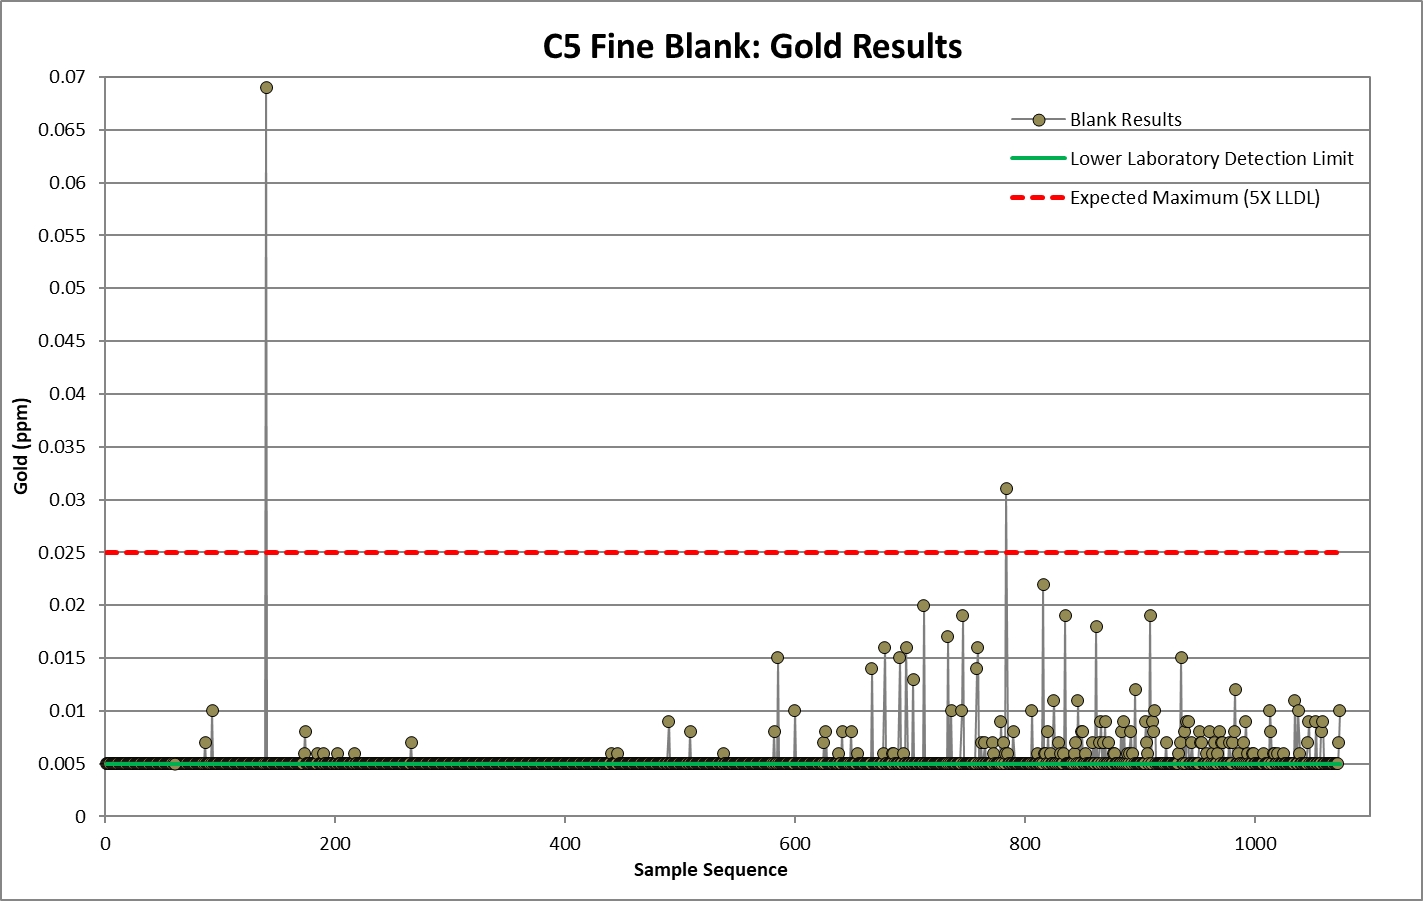
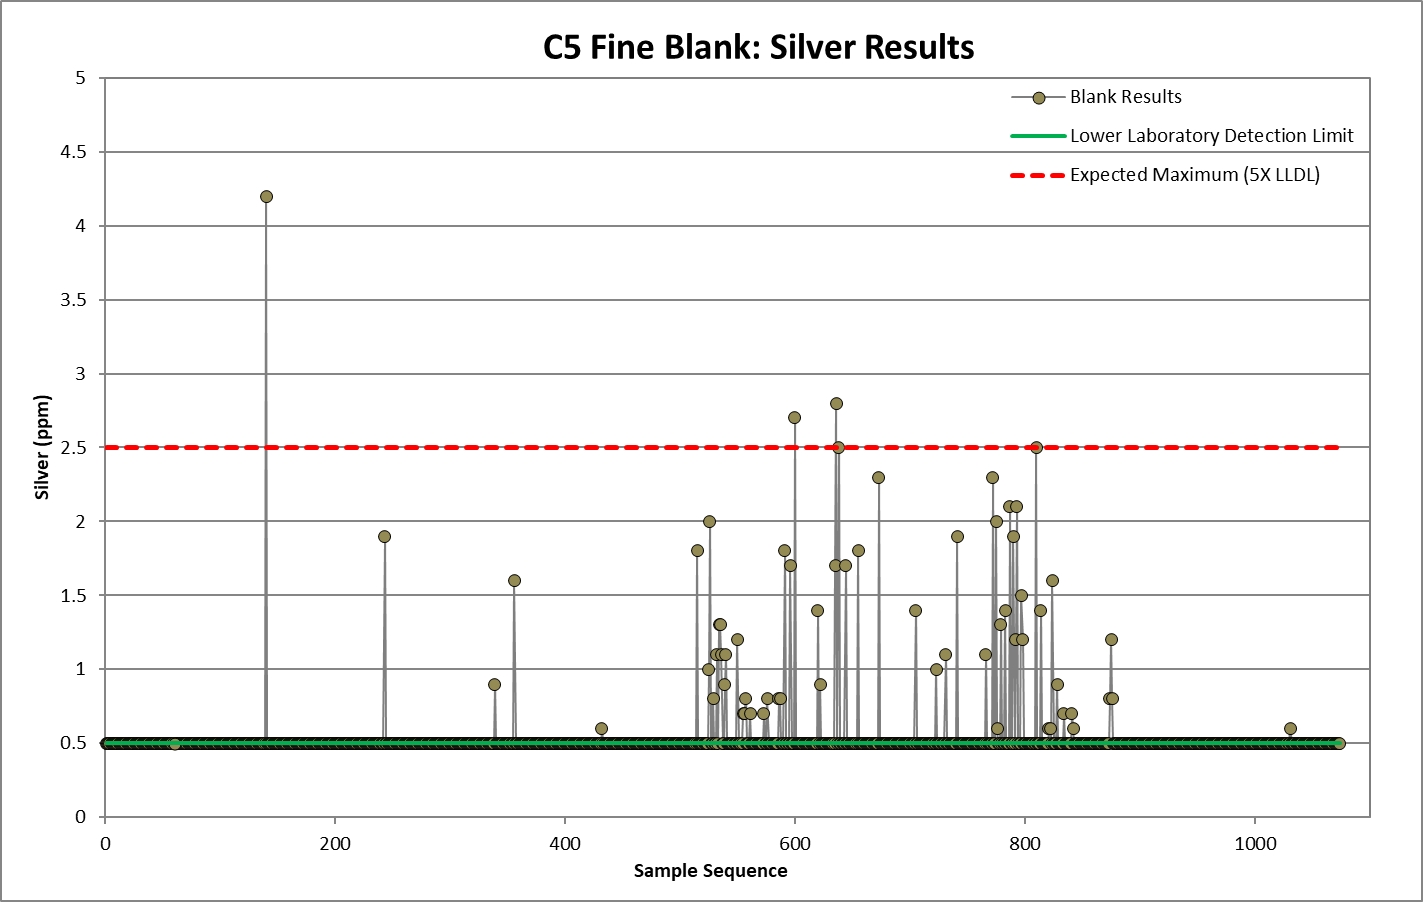
Source: SRK, 2025
|
SRK Consulting (U.S.), Inc.
SEC Technical Report Summary – Sinda Project
|
Page 83
|
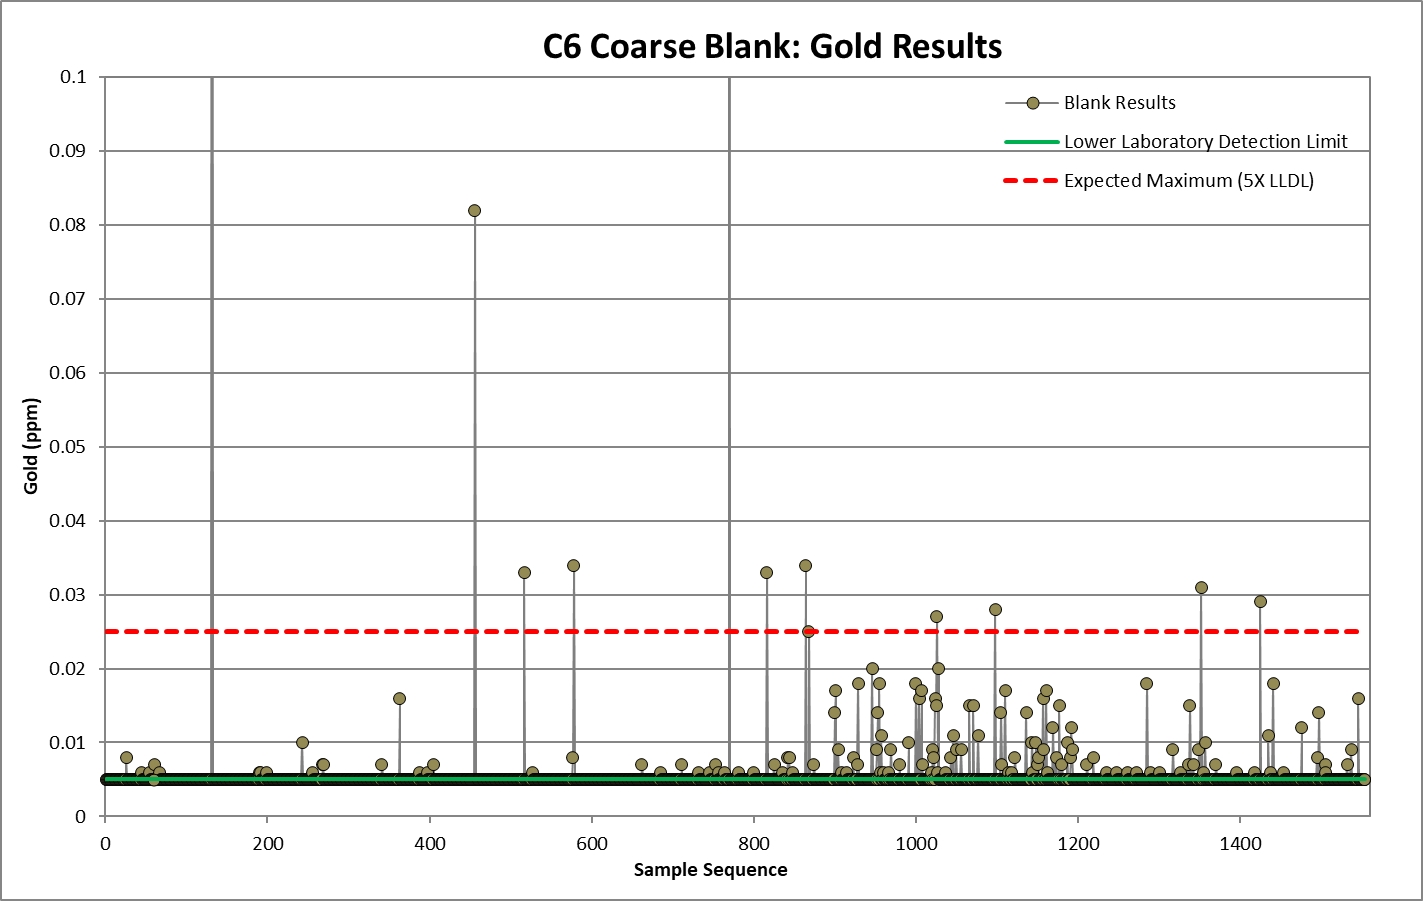
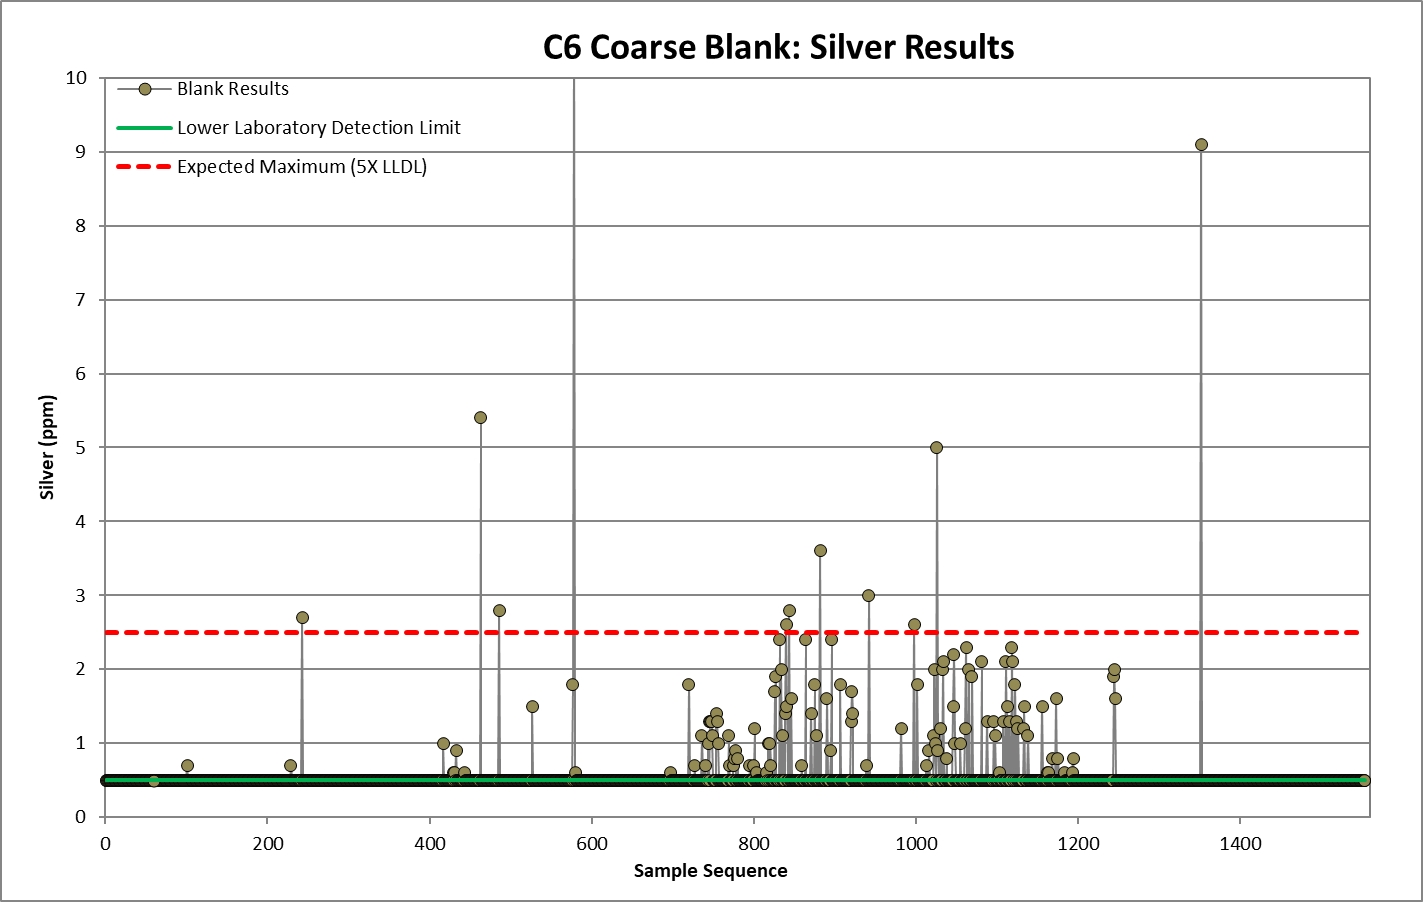
Source: SRK, 2025
|
SRK Consulting (U.S.), Inc.
SEC Technical Report Summary – Sinda Project
|
Page 84
|
Sinda provided data for 3,679 Au duplicate samples and 5,492 Ag duplicates, as summarized in Table 8‑8. The overall duplicate insertion frequency was 6.4%, based
on Ag, which exceeds industry standards. Duplicate material consisted of coarse material, fine pulps, and quarter drill core.
|
Sinda ID
|
Duplicate Type
|
Number of Au Samples
|
Number of Ag Samples
|
||
|
B1
|
Coarse (-10 mesh)
|
1,614
|
2,397
|
||
|
B2
|
Fine (-200 mesh)
|
1,372
|
2,109
|
||
|
B3
|
Quarter drill core
|
693
|
986
|
Source: SRK, 2025
In general, the duplicate results reasonably demonstrate the repeatability of analytical results for the different sample types. Coarse and fine duplicate pairs
are generally near the ±10% confidence limits at higher grades with more spread at lower grades near the lower laboratory detection limits, reflecting adequate analytical and sampling precision. Drill core duplicate results demonstrate more
variability, which represents natural variations in the samples inherent within these types of deposits. SRK cautions that this variability can be exacerbated by potentially inconsistent splitting practices and recommends Sinda remain
attentive to careful and proper representative sample splitting.
Relatively few duplicate pairs are found above 200 ppm AgEq CoG. Given the importance of understanding variance within the grade ranges contained in the Mineral Resource, efforts should be
made to increase the number of duplicate pairs at higher grades. SRK reviewed half absolute relative difference (HARD) results by duplicate type for data filtered above 10 ppm Ag and 0.1 ppm Au. These grade limits exclude lower-grade data
nearer to the detection limits, where small relative differences can appear artificially as poor precision. The results of this analysis are provided in Table 8‑9 and Table 8‑10.
|
Duplicate Type
|
Number of Pairs
|
Duplicates Outside ±10% Tolerance
|
Inside Tolerance (%)
|
|
|
Coarse (B1)
|
292
|
30
|
89.7%
|
|
|
Fine (B2)
|
189
|
15
|
92.1%
|
|
|
Core (B3)
|
62
|
22
|
64.5%
|
Source: SRK, 2025
Notes: Data filtered to above 10 ppm Ag in original sample. HARD values are half the absolute difference between original and duplicate samples divided by the
average of the duplicate pairs.
|
Duplicate Type
|
Number of Pairs
|
Duplicates Outside ±10% Tolerance
|
Inside Tolerance (%)
|
|
|
Coarse (B1)
|
164
|
35
|
78.7%
|
|
|
Fine (B2)
|
112
|
23
|
79.5%
|
|
|
Core (B3)
|
39
|
21
|
46.2%
|
Source: SRK, 2025
Notes: Data filtered to above 0.1 ppm Au in original sample. HARD values are half the absolute difference between original and duplicate samples divided by the average of the duplicate
pairs.
Sinda targets coarse duplicates that report at least 80% of values with less than ±10% HARD values. The higher-grade subset of coarse duplicates (B1) for Ag and Au display adequate
comparison results (e.g., less than 20% outside of tolerance) across the population above nominal CoGs yet vary among individual duplicate pairs.
|
SRK Consulting (U.S.), Inc.
SEC Technical Report Summary – Sinda Project
|
Page 85
|
HARD values for pulp duplicates (B2) should generally indicate at least 90% of values with less than ±10% difference between duplicate pairs. Limited data for the fine duplicates report
acceptable results for Ag, while Au results are skewed with over 10% of paired duplicate data reporting outside acceptable relative difference tolerance. Sinda is conducting further testing to determine if coarse gold is affecting the
sampling and re-analysis of duplicate pulps.
At the current project stage, results are not statistically significant for the quarter drill core duplicates due to the limited sample size available (i.e., less than ~50 pairs) for the
higher-grade subset population. At least 70% of values with less than ±10% HARD values are targeted for core duplicates. The current Sinda threshold of ±10% HARD is conservative for core duplicate comparisons, which often exhibit more
variance, and the tolerance should be evaluated further in future work. The variations in the available core duplicate data indicate the potential for inherent variability characteristic of narrow vein ore deposits and future QA/QC sampling
should continue investigating potential bias as a result of precious metal distribution characteristics, sampling approach, sample preparation or laboratory analytical methods with further duplicate insertion. SRK recommends that additional
higher grade duplicate values (>100 ppm Ag and >0.1 ppm Au) are tested in future sampling programs to increase the population of results above likely mining CoGs.
Charts summarizing the results for all data across the three duplicate types for Au and Ag pairs are provided in Figure 8‑21 through Figure 8‑23.
|
SRK Consulting (U.S.), Inc.
SEC Technical Report Summary – Sinda Project
|
Page 86
|