Shareholder Report
|
6 Months Ended |
|
Mar. 31, 2026
USD ($)
Holding
|
|---|
| Shareholder Report [Line Items] |
|
| Document Type |
N-CSRS
|
| Amendment Flag |
false
|
| Registrant Name |
ALPS SERIES TRUST
|
| Entity Central Index Key |
0001558107
|
| Entity Investment Company Type |
N-1A
|
| Document Period End Date |
Mar. 31, 2026
|
| C000193426 |
|
| Shareholder Report [Line Items] |
|
| Fund Name |
Beacon Planned Return Strategy Fund
|
| Trading Symbol |
Institutional
|
| Annual or Semi-Annual Statement [Text Block] |
This semi-annual shareholder report contains important information about Beacon Planned Return Strategy Fund - Institutional Class for the period of October 1, 2025 to March 31, 2026.
|
| Shareholder Report Annual or Semi-Annual |
semi-annual shareholder report
|
| Additional Information [Text Block] |
You can find additional information about the Fund at https://www.beacontrust.com/services/investment-management/beacon-funds. You can also request this information by contacting us at 1-844-894-9222.
|
| Additional Information Phone Number |
1-844-894-9222
|
| Additional Information Website |
<span style="box-sizing: border-box; color: rgb(51, 62, 72); display: inline; flex-wrap: nowrap; font-size: 12px; font-weight: 400; grid-area: auto; line-height: 16.8px; margin: 0px; overflow: visible; text-align: left; text-align-last: auto; white-space-collapse: preserve-breaks;">https://www.beacontrust.com/services/investment-management/beacon-funds</span>
|
| Expenses [Text Block] |
What were the Fund's Costs for the last six months? (based on a hypothetical $10,000 investment) Table SummaryCLASS NAME | COSTS OF A $10,000 INVESTMENT | COSTS PAID AS A PERCENTAGE OF
A $10,000 INVESTMENT |
|---|
Beacon Planned Return Strategy Fund - Institutional | $64 | 1.27% |
|---|
|
| Expenses Paid, Amount |
$ 0.0127
|
| Expense Ratio, Percent |
6400.00%
|
| Factors Affecting Performance [Text Block] |
How did the Fund perform the past six months?The Beacon Planned Return Strategy Fund - I returned 0.87% for the 6 months ended March 31, 2026. This is in contrast to the CBOE S&P 500 BuyWrite Index, which had a 5.55% return for the same time period. The returns sought to be generated by the Fund are derived from three distinct and sometimes complementary return elements, i.e., returns from Directional/Enhanced market movements, returns from Income (or option premium) and returns from the Hedge that creates constant “downside protection”. During the period, the Directional /Enhanced component detracted value due to the decrease in the S&P 500, the Income component added value through the premium collected from selling out-of-the money call and put options, and the Hedge component added value due to the decrease in the S&P 500. |
| Line Graph [Table Text Block] |
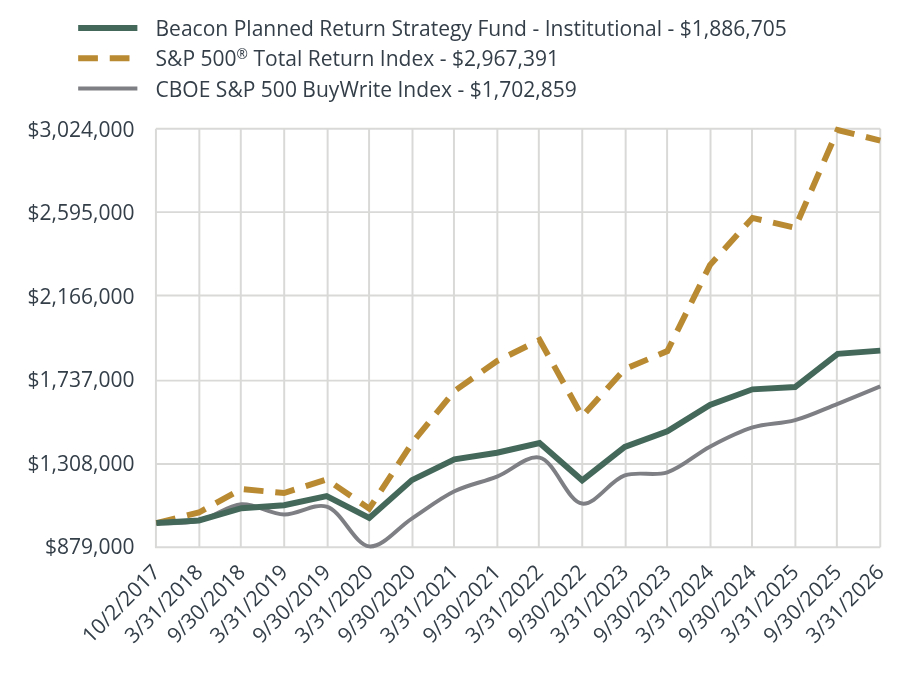 Table Summary | Beacon Planned Return Strategy Fund - Institutional - $1,886,705 | S&P 500® Total Return Index - $2,967,391 | CBOE S&P 500 BuyWrite Index - $1,702,859 |
|---|
10/2/2017 | $1,000,000.00 | $1,000,000.00 | $1,000,000.00 |
|---|
3/31/2018 | $1,013,244.09 | $1,054,264.18 | $1,010,887.60 |
|---|
9/30/2018 | $1,076,446.45 | $1,174,549.41 | $1,096,538.69 |
|---|
3/31/2019 | $1,091,691.78 | $1,154,381.98 | $1,044,148.20 |
|---|
9/30/2019 | $1,138,587.63 | $1,224,513.54 | $1,084,395.69 |
|---|
3/31/2020 | $1,026,380.15 | $1,073,830.43 | $879,937.53 |
|---|
9/30/2020 | $1,220,717.43 | $1,410,016.88 | $1,023,023.12 |
|---|
3/31/2021 | $1,327,212.06 | $1,678,951.36 | $1,163,269.12 |
|---|
9/30/2021 | $1,361,462.70 | $1,833,090.82 | $1,238,906.91 |
|---|
3/31/2022 | $1,411,347.42 | $1,941,637.53 | $1,336,334.83 |
|---|
9/30/2022 | $1,219,717.49 | $1,549,472.99 | $1,100,035.87 |
|---|
3/31/2023 | $1,391,764.80 | $1,791,578.02 | $1,244,705.65 |
|---|
9/30/2023 | $1,471,494.04 | $1,884,428.52 | $1,260,913.75 |
|---|
3/31/2024 | $1,607,838.09 | $2,326,924.02 | $1,392,723.17 |
|---|
9/30/2024 | $1,687,785.84 | $2,569,446.82 | $1,491,727.82 |
|---|
3/31/2025 | $1,699,633.77 | $2,518,934.49 | $1,529,225.39 |
|---|
9/30/2025 | $1,870,459.90 | $3,021,610.30 | $1,613,277.34 |
|---|
3/31/2026 | $1,886,704.67 | $2,967,390.95 | $1,702,859.02 |
|---|
|
| Average Annual Return [Table Text Block] |
Average Annual Total RetunsTable Summary Institutional | 1 Year | 5 Year | Since Inception |
|---|
Beacon Planned Return Strategy Fund - Institutional | 11.01% | 7.29% | 7.76% |
|---|
S&P 500® Total Return Index | 17.80% | 12.06% | 13.66% |
|---|
CBOE S&P 500 BuyWrite Index | 11.35% | 7.92% | 6.47% |
|---|
|
| AssetsNet |
$ 306,578,847
|
| Holdings Count | Holding |
87
|
| InvestmentCompanyPortfolioTurnover |
0.00%
|
| Additional Fund Statistics [Text Block] |
- Total Net Assets$306,578,847
- # of Portfolio Holdings87
- Portfolio Turnover Rate (Institutional)-%
|
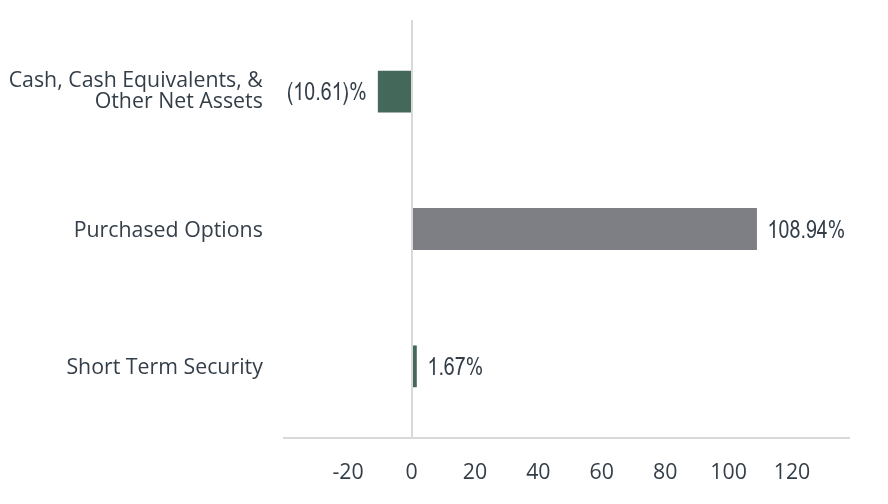
| Holdings [Text Block] |
Table SummaryValue | Value |
|---|
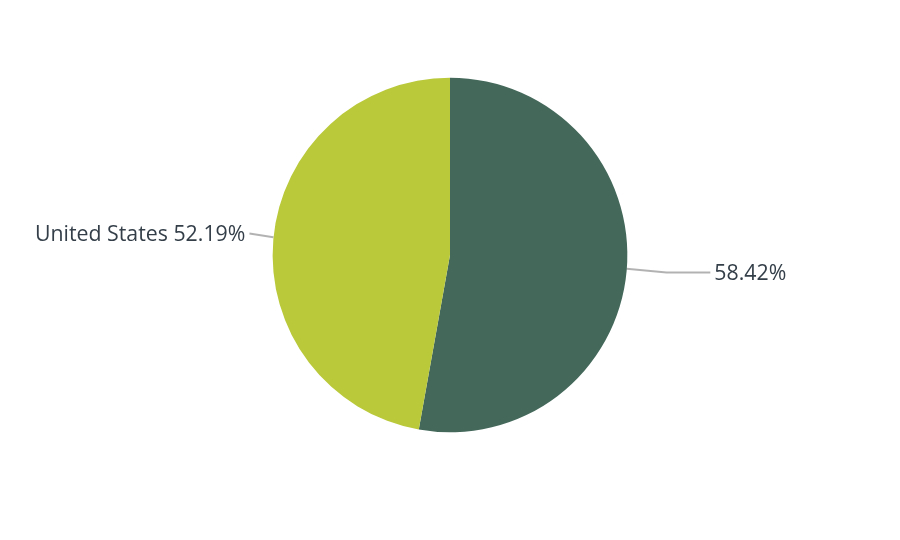
Short Term Security | 1.67% | Purchased Options | 108.94% | Cash, Cash Equivalents, & Other Net Assets | (10.61)% | Table SummaryValue | Value |
|---|
| 58.42% | United States | 52.19% | |
| Largest Holdings [Text Block] |
Table SummaryTop 10 | % |
|---|
Call XSP May 78.55 05/14/2026 | 9.55% | Call XSP June 81.80 06/12/2026 | 9.12% | Call XSP 84.05 07/14/2026 | 8.81% | Call XSP September 87.40 09/14/2026 | 8.29% | Call XSP January 88.70 01/14/2027 | 7.81% | Call XSP December 90.80 12/14/2026 | 7.78% | Call XSP April 76.65 04/14/2026 | 7.33% | Call XSP August 86.15 08/14/2026 | 7.02% | Call XSP Febuary 87.25 02/12/2027 | 6.44% | Call XSP October 87.65 10/14/2026 | 5.89% | Total % of Top 10 Holdings | 78.04% | |
| Material Fund Change [Text Block] |
There have been no material Fund changes during the reporting period. |
| C000241324 |
|
| Shareholder Report [Line Items] |
|
| Fund Name |
Brigade High Income Fund
|
| Class Name |
FOUNDERS
|
| No Trading Symbol [Flag] |
true
|
| Annual or Semi-Annual Statement [Text Block] |
This semi-annual shareholder report contains important information about Brigade High Income Fund - Founders Class for the period of October 1, 2025 to March 31, 2026.
|
| Shareholder Report Annual or Semi-Annual |
semi-annual shareholder report
|
| Additional Information [Text Block] |
You can find additional information about the Fund at https://www.brigadefunds.com/resources. You can also request this information by contacting us at 212.745.9700.
|
| Additional Information Phone Number |
212.745.9700
|
| Additional Information Website |
<span style="box-sizing: border-box; color: rgb(49, 60, 76); display: inline; flex-wrap: nowrap; font-size: 12px; font-weight: 400; grid-area: auto; line-height: 16.8px; margin: 0px; overflow: visible; text-align: left; text-align-last: auto; white-space-collapse: preserve-breaks;">https://www.brigadefunds.com/resources</span>
|
| Expenses [Text Block] |
WHAT WERE THE FUND'S COSTS FOR THE LAST SIX MONTHS? (based on a hypothetical $10,000 investment) Table SummaryCLASS NAME | COSTS OF A $10,000 INVESTMENT | COSTS PAID AS A PERCENTAGE OF
A $10,000 INVESTMENT |
|---|
Brigade High Income Fund - Founders | $26 | 0.52% |
|---|
|
| Expenses Paid, Amount |
$ 0.0052
|
| Expense Ratio, Percent |
2600.00%
|
| Average Annual Return [Table Text Block] |
AVERAGE ANNUAL TOTAL RETURNSTable Summary Founders | 1 Year | Since Inception |
|---|
Brigade High Income Fund - Founders (Incep. May 1, 2023) | 6.53% | 9.95% |
|---|
Bloomberg U.S. Aggregate Bond Index | 4.35% | 3.87% |
|---|
60% ICE BofA US HY Contrained / 40% S&P UBS Leverage Loan | 6.06% | 8.24% |
|---|
ICE BofA US High Yield Constrained Index | 6.90% | 8.44% |
|---|
|
| Performance Inception Date |
May 01, 2023
|
| AssetsNet |
$ 1,045,452,988
|
| Holdings Count | Holding |
381
|
| InvestmentCompanyPortfolioTurnover |
21.00%
|
| Additional Fund Statistics [Text Block] |
- Total Net Assets$1,045,452,988
- # of Portfolio Holdings381
- Portfolio Turnover Rate21%
|
| Holdings [Text Block] |
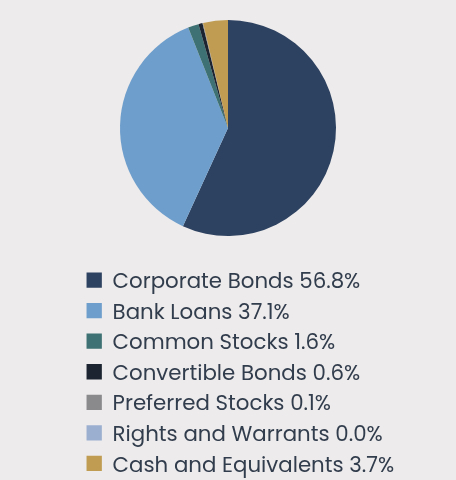
ASSET CLASS WEIGHTINGS(as a % of Net Assets) Table SummaryValue | Value |
|---|
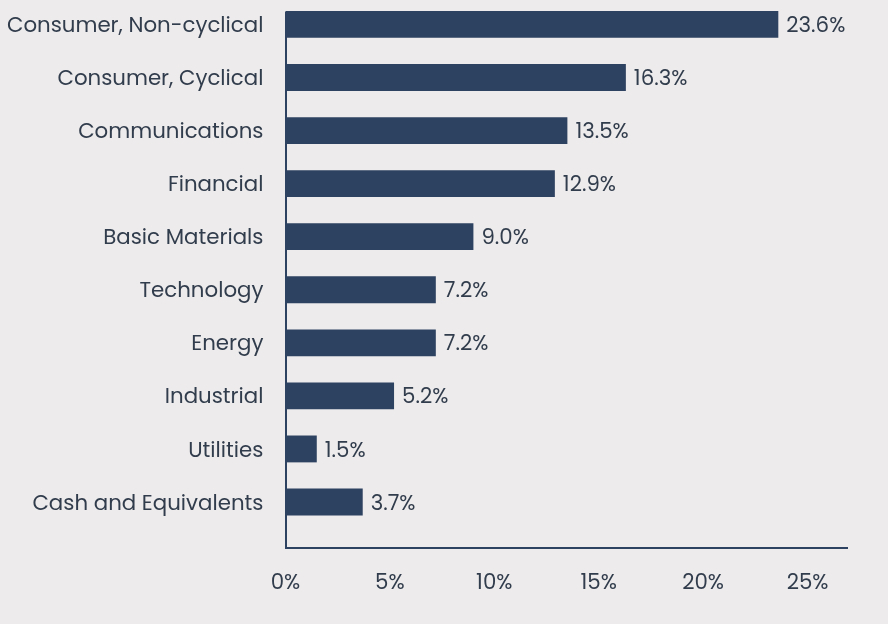
Corporate Bonds | 56.8% | Bank Loans | 37.1% | Common Stocks | 1.6% | Convertible Bonds | 0.6% | Preferred Stocks | 0.1% | Rights and Warrants | 0.0% | Cash and Equivalents | 3.7% | SECTOR WEIGHTINGS(as a % of Net Assets) Table SummaryValue | Value |
|---|
Cash and Equivalents | 3.7% | Utilities | 1.5% | Industrial | 5.2% | Energy | 7.2% | Technology | 7.2% | Basic Materials | 9.0% | Financial | 12.9% | Communications | 13.5% | Consumer, Cyclical | 16.3% | Consumer, Non-cyclical | 23.6% | |
| Largest Holdings [Text Block] |
TOP TEN HOLDINGS(as a % of Net Assets) Table SummaryTop 10 | Top 10 |
|---|
Akumin, Inc. 08/31/2031 9.75% | 1.3% | CCO Holdings LLC / CCO Holdings Capital Corp. 01/15/2034 4.25% | 0.8% | Pluto Acquisition I, Inc. 09/20/2028 3M SOFR + 4.00% | 0.8% | GrubHub Holdings, Inc. 07/31/2030 13.00 (7.00 PIK)% | 0.8% | Envision Healthcare Corp. | 0.8% | Avaya Inc. 08/01/2028 1M SOFR + 7.50% | 0.7% | Global Medical Response TL B 10/02/2028 3M SOFR + 3.50% | 0.7% | Genesis Energy LP / Genesis Energy Finance Corp. 05/15/2033 8.00% | 0.7% | Rain Carbon, Inc. 09/01/2029 12.25% | 0.7% | Icahn Enterprises LP / Icahn Enterprises Finance Corp. 06/15/2030 9.00% | 0.7% | Total % of Top 10 Holdings | 7.9% | |
| Material Fund Change [Text Block] |
There have been no material Fund changes during the reporting period. |
| C000241325 |
|
| Shareholder Report [Line Items] |
|
| Fund Name |
Brigade High Income Fund
|
| Class Name |
INSTITUTIONAL
|
| No Trading Symbol [Flag] |
true
|
| Annual or Semi-Annual Statement [Text Block] |
This semi-annual shareholder report contains important information about Brigade High Income Fund - Institutional Class for the period of October 1, 2025 to March 31, 2026.
|
| Shareholder Report Annual or Semi-Annual |
semi-annual shareholder report
|
| Additional Information [Text Block] |
You can find additional information about the Fund at https://www.brigadefunds.com/resources. You can also request this information by contacting us at 212.745.9700.
|
| Additional Information Phone Number |
212.745.9700
|
| Additional Information Website |
<span style="box-sizing: border-box; color: rgb(49, 60, 76); display: inline; flex-wrap: nowrap; font-size: 12px; font-weight: 400; grid-area: auto; line-height: 16.8px; margin: 0px; overflow: visible; text-align: left; text-align-last: auto; white-space-collapse: preserve-breaks;">https://www.brigadefunds.com/resources</span>
|
| Expenses [Text Block] |
WHAT WERE THE FUND'S COSTS FOR THE LAST SIX MONTHS? (based on a hypothetical $10,000 investment) Table SummaryCLASS NAME | COSTS OF A $10,000 INVESTMENT | COSTS PAID AS A PERCENTAGE OF
A $10,000 INVESTMENT |
|---|
Brigade High Income Fund - Institutional | $26 | 0.52% |
|---|
|
| Expenses Paid, Amount |
$ 0.0052
|
| Expense Ratio, Percent |
2600.00%
|
| Average Annual Return [Table Text Block] |
AVERAGE ANNUAL TOTAL RETURNSTable Summary Institutional | 1 Year | Since Inception |
|---|
Brigade High Income Fund - Institutional (Incep. May 4, 2023) | 6.65% | 9.96% |
|---|
Bloomberg U.S. Aggregate Bond Index | 4.35% | 3.44% |
|---|
60% ICE BofA US HY Contrained / 40% S&P UBS Leverage Loan | 6.06% | 8.43% |
|---|
ICE BofA US High Yield Constrained Index | 6.90% | 8.70% |
|---|
|
| Performance Inception Date |
May 04, 2023
|
| AssetsNet |
$ 1,045,452,988
|
| Holdings Count | Holding |
381
|
| InvestmentCompanyPortfolioTurnover |
21.00%
|
| Additional Fund Statistics [Text Block] |
- Total Net Assets$1,045,452,988
- # of Portfolio Holdings381
- Portfolio Turnover Rate21%
|
| Holdings [Text Block] |
ASSET CLASS WEIGHTINGS(as a % of Net Assets) Table SummaryValue | Value |
|---|
Corporate Bonds | 56.8% | Bank Loans | 37.1% | Common Stocks | 1.6% | Convertible Bonds | 0.6% | Preferred Stocks | 0.1% | Rights and Warrants | 0.0% | Cash and Equivalents | 3.7% | SECTOR WEIGHTINGS(as a % of Net Assets) Table SummaryValue | Value |
|---|
Cash and Equivalents | 3.7% | Utilities | 1.5% | Industrial | 5.2% | Energy | 7.2% | Technology | 7.2% | Basic Materials | 9.0% | Financial | 12.9% | Communications | 13.5% | Consumer, Cyclical | 16.3% | Consumer, Non-cyclical | 23.6% | |
| Largest Holdings [Text Block] |
TOP TEN HOLDINGS(as a % of Net Assets) Table SummaryTop 10 | Top 10 |
|---|
Akumin, Inc. 08/31/2031 9.75% | 1.3% | CCO Holdings LLC / CCO Holdings Capital Corp. 01/15/2034 4.25% | 0.8% | Pluto Acquisition I, Inc. 09/20/2028 3M SOFR + 4.00% | 0.8% | GrubHub Holdings, Inc. 07/31/2030 13.00 (7.00 PIK)% | 0.8% | Envision Healthcare Corp. | 0.8% | Avaya Inc. 08/01/2028 1M SOFR + 7.50% | 0.7% | Global Medical Response TL B 10/02/2028 3M SOFR + 3.50% | 0.7% | Genesis Energy LP / Genesis Energy Finance Corp. 05/15/2033 8.00% | 0.7% | Rain Carbon, Inc. 09/01/2029 12.25% | 0.7% | Icahn Enterprises LP / Icahn Enterprises Finance Corp. 06/15/2030 9.00% | 0.7% | Total % of Top 10 Holdings | 7.9% | |
| Material Fund Change [Text Block] |
There have been no material Fund changes during the reporting period. |
| C000203691 |
|
| Shareholder Report [Line Items] |
|
| Fund Name |
Carret Kansas Tax-Exempt Bond Fund
|
| Trading Symbol |
CLASS A
|
| Annual or Semi-Annual Statement [Text Block] |
This semi-annual shareholder report contains important information about Carret Kansas Tax-Exempt Bond Fund - A for the period of October 1, 2025 to March 31, 2026.
|
| Shareholder Report Annual or Semi-Annual |
semi-annual shareholder report
|
| Additional Information [Text Block] |
You can find additional information about the Fund at https://www.carret.com/kansas-tax-exempt-bond-fund. You can also request this information by contacting us at 888.266.8787.
|
| Additional Information Phone Number |
888.266.8787
|
| Additional Information Website |
<span style="box-sizing: border-box; color: rgb(0, 0, 0); display: inline; flex-wrap: nowrap; font-size: 12px; font-weight: 400; grid-area: auto; line-height: 16.8px; margin: 0px; overflow: visible; text-align: left; text-align-last: auto; white-space-collapse: preserve-breaks;">https://www.carret.com/kansas-tax-exempt-bond-fund</span>
|
| Expenses [Text Block] |
WHAT WERE THE FUND'S COSTS FOR THE LAST SIX MONTHS?
|
| Expenses Paid, Amount |
$ 0.0080
|
| Expense Ratio, Percent |
4000.00%
|
| Factors Affecting Performance [Text Block] |
HOW DID THE FUND PERFORM IN THE LAST SIX MONTHS?For the 6 months ending March 31, 2026, the Carret Kansas Tax-Exempt Bond Fund returned 0.92% compared to a return of 1.38% for the Bloomberg Municipal Bond Index and a return of 0.24% for the Bloomberg 7 Year Municipal Bond Index. The return of the Fund was primarily driven by falling intermediate-duration interest rates in 4Q25 followed by rising intermediate-duration interest rates in 1Q26. The swing in interest rates was tied to Fed rate cuts and slowing economic growth in 4Q25 quickly followed by rising inflationary pressures and geopolitical uncertainly in 1Q26. The balance between strong supply and strong demand combined with a positive credit outlook helped to soften return volatility for the period. |
| Line Graph [Table Text Block] |
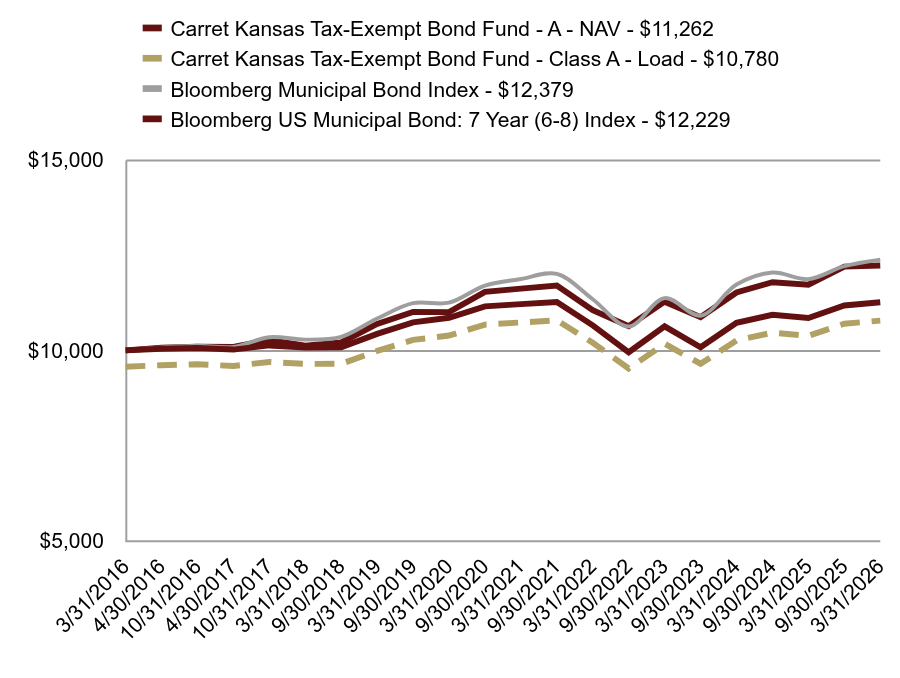 Table Summary | Carret Kansas Tax-Exempt Bond Fund - A - NAV - $11,262 | Carret Kansas Tax-Exempt Bond Fund - Class A - Load - $10,780 | Bloomberg Municipal Bond Index - $12,379 | Bloomberg US Municipal Bond: 7 Year (6-8) Index - $12,229 |
|---|
3/31/2016 | $10,000.00 | $9,571.92 | $10,000.00 | $10,000.13 |
|---|
4/30/2016 | $10,040.08 | $9,610.28 | $10,073.56 | $10,066.92 |
|---|
10/31/2016 | $10,064.49 | $9,633.65 | $10,122.89 | $10,098.93 |
|---|
4/30/2017 | $10,020.49 | $9,591.53 | $10,088.07 | $10,087.56 |
|---|
10/31/2017 | $10,129.98 | $9,696.33 | $10,344.82 | $10,273.34 |
|---|
3/31/2018 | $10,076.23 | $9,644.89 | $10,281.68 | $10,120.27 |
|---|
9/30/2018 | $10,078.75 | $9,647.29 | $10,355.59 | $10,206.78 |
|---|
3/31/2019 | $10,432.09 | $9,985.51 | $10,835.33 | $10,693.13 |
|---|
9/30/2019 | $10,734.17 | $10,274.66 | $11,241.06 | $11,009.95 |
|---|
3/31/2020 | $10,854.29 | $10,389.63 | $11,252.37 | $11,004.38 |
|---|
9/30/2020 | $11,153.83 | $10,676.35 | $11,701.03 | $11,535.97 |
|---|
3/31/2021 | $11,212.85 | $10,732.85 | $11,872.19 | $11,619.92 |
|---|
9/30/2021 | $11,270.62 | $10,788.14 | $12,008.53 | $11,700.17 |
|---|
3/31/2022 | $10,657.36 | $10,201.14 | $11,341.60 | $11,056.34 |
|---|
9/30/2022 | $9,950.21 | $9,524.26 | $10,627.48 | $10,634.69 |
|---|
3/31/2023 | $10,629.02 | $10,174.01 | $11,370.90 | $11,278.29 |
|---|
9/30/2023 | $10,081.17 | $9,649.61 | $10,910.58 | $10,871.72 |
|---|
3/31/2024 | $10,721.16 | $10,262.20 | $11,726.41 | $11,519.96 |
|---|
9/30/2024 | $10,933.56 | $10,465.51 | $12,042.19 | $11,787.61 |
|---|
3/31/2025 | $10,847.60 | $10,383.24 | $11,869.43 | $11,721.51 |
|---|
9/30/2025 | $11,177.89 | $10,699.39 | $12,209.88 | $12,197.43 |
|---|
3/31/2026 | $11,261.89 | $10,779.79 | $12,378.91 | $12,229.21 |
|---|
|
| Average Annual Return [Table Text Block] |
AVERAGE ANNUAL TOTAL RETURNSTable Summary Class A | 1 Year | 5 Year | 10 Year |
|---|
Carret Kansas Tax-Exempt Bond Fund - Class A - NAV | 3.82% | 0.09% | 1.20% |
|---|
Carret Kansas Tax-Exempt Bond Fund - Class A - Load | -0.63% | -0.77% | 0.75% |
|---|
Bloomberg Municipal Bond Index | 4.29% | 0.84% | 2.16% |
|---|
Bloomberg US Municipal Bond: 7 Year (6-8) Index | 4.35% | 1.03% | 2.03% |
|---|
|
| AssetsNet |
$ 131,285,230
|
| Holdings Count | Holding |
169
|
| InvestmentCompanyPortfolioTurnover |
5.00%
|
| Additional Fund Statistics [Text Block] |
- Total Net Assets$131,285,230
- # of Portfolio Holdings169
- Portfolio Turnover Rate5%
|
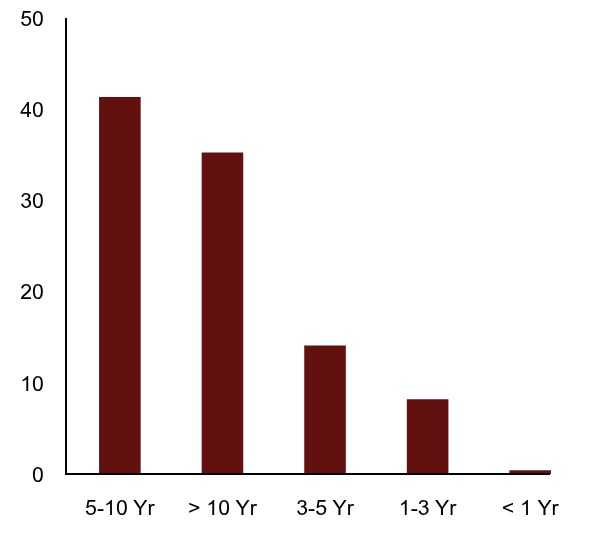
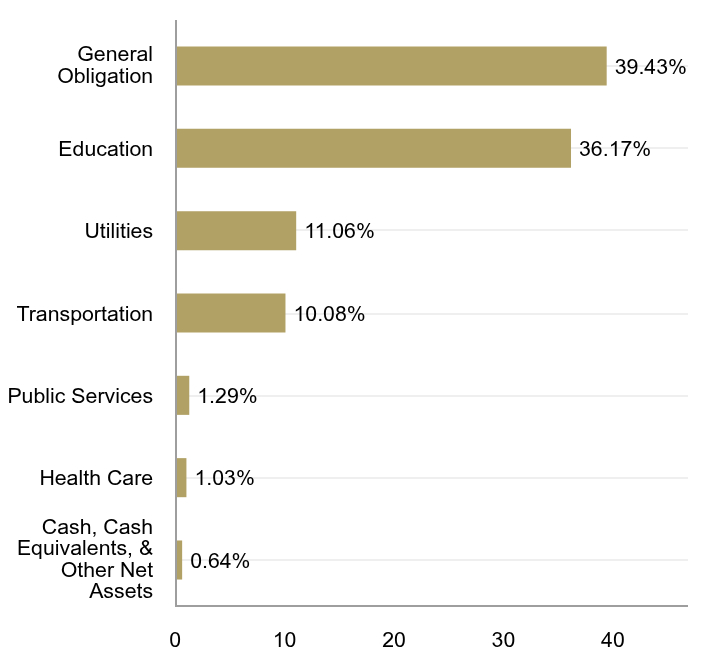
| Holdings [Text Block] |
Table SummaryValue | Value |
|---|
5-10 Yr | 41.4% | > 10 Yr | 35.3% | 3-5 Yr | 14.1% | 1-3 Yr | 8.2% | < 1 Yr | 0.4% | Table SummaryValue | Value |
|---|
Cash, Cash Equivalents,
& Other Net Assets | 0.64% | Health Care | 1.03% | Public Services | 1.29% | Transportation | 10.08% | Utilities | 11.06% | Education | 36.17% | General Obligation | 39.43% | |
| Largest Holdings [Text Block] |
Table SummaryTop 10 | % |
|---|
Johnson County Unified School District No 229 Blue Valley 10/01/2038 5.00% | 1.70% | State of Kansas Department of Transportation 09/01/2031 5.00% | 1.57% | State of Kansas Department of Transportation 09/01/2034 5.00% | 1.57% | Allen County Unified School District No 257 09/01/2043 3.00% | 1.52% | Kansas Development Finance Authority 05/01/2042 5.00% | 1.23% | State of Kansas Department of Transportation 09/01/2028 5.00% | 1.18% | City of Lenexa KS 09/01/2033 3.00% | 1.17% | County of Johnson KS 09/01/2035 4.00% | 1.17% | Douglas County Unified School District No 497 Lawrence 09/01/2031 4.00% | 1.15% | Johnson County Unified School District No 229 Blue Valley 10/01/2040 4.00% | 1.15% | Total % of Top 10 Holdings | 13.41% | |
| Material Fund Change [Text Block] |
There have been no material Fund changes during the reporting period. |
| C000203690 |
|
| Shareholder Report [Line Items] |
|
| Fund Name |
Carret Kansas Tax-Exempt Bond Fund
|
| Trading Symbol |
INSTITUTIONAL
|
| Annual or Semi-Annual Statement [Text Block] |
This semi-annual shareholder report contains important information about Carret Kansas Tax-Exempt Bond Fund - Institutional for the period of October 1, 2025 to March 31, 2026.
|
| Shareholder Report Annual or Semi-Annual |
semi-annual shareholder report
|
| Additional Information [Text Block] |
You can find additional information about the Fund at https://www.carret.com/kansas-tax-exempt-bond-fund. You can also request this information by contacting us at 888.266.8787.
|
| Additional Information Phone Number |
888.266.8787
|
| Additional Information Website |
<span style="box-sizing: border-box; color: rgb(0, 0, 0); display: inline; flex-wrap: nowrap; font-size: 12px; font-weight: 400; grid-area: auto; line-height: 16.8px; margin: 0px; overflow: visible; text-align: left; text-align-last: auto; white-space-collapse: preserve-breaks;">https://www.carret.com/kansas-tax-exempt-bond-fund</span>
|
| Expenses [Text Block] |
WHAT WERE THE FUND'S COSTS FOR THE LAST SIX MONTHS?
|
| Expenses Paid, Amount |
$ 0.0048
|
| Expense Ratio, Percent |
2400.00%
|
| Factors Affecting Performance [Text Block] |
HOW DID THE FUND PERFORM IN THE LAST SIX MONTHS?For the 6 months ending March 31, 2026, the Carret Kansas Tax-Exempt Bond Fund returned 0.92% compared to a return of 1.38% for the Bloomberg Municipal Bond Index and a return of 0.24% for the Bloomberg 7 Year Municipal Bond Index. The return of the Fund was primarily driven by falling intermediate-duration interest rates in 4Q25 followed by rising intermediate-duration interest rates in 1Q26. The swing in interest rates was tied to Fed rate cuts and slowing economic growth in 4Q25 quickly followed by rising inflationary pressures and geopolitical uncertainly in 1Q26. The balance between strong supply and strong demand combined with a positive credit outlook helped to soften return volatility for the period. |
| Line Graph [Table Text Block] |
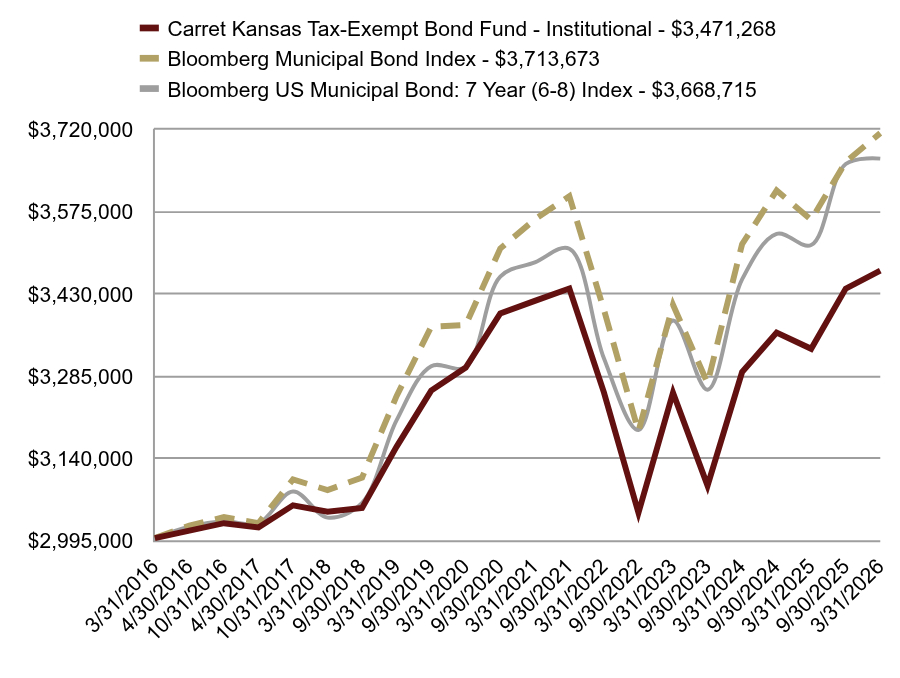 Table Summary | Carret Kansas Tax-Exempt Bond Fund - Institutional - $3,471,268 | Bloomberg Municipal Bond Index - $3,713,673 | Bloomberg US Municipal Bond: 7 Year (6-8) Index - $3,668,715 |
|---|
3/31/2016 | $3,000,000.00 | $3,000,000.00 | $2,999,999.80 |
|---|
4/30/2016 | $3,012,981.71 | $3,022,067.66 | $3,020,038.30 |
|---|
10/31/2016 | $3,026,219.83 | $3,036,868.49 | $3,029,640.08 |
|---|
4/30/2017 | $3,018,811.59 | $3,026,422.42 | $3,026,230.75 |
|---|
10/31/2017 | $3,057,788.82 | $3,103,445.51 | $3,081,962.83 |
|---|
3/31/2018 | $3,046,476.64 | $3,084,503.66 | $3,036,041.27 |
|---|
9/30/2018 | $3,053,099.42 | $3,106,678.18 | $3,061,993.90 |
|---|
3/31/2019 | $3,161,147.90 | $3,250,598.89 | $3,207,899.22 |
|---|
9/30/2019 | $3,259,879.35 | $3,372,318.35 | $3,302,942.93 |
|---|
3/31/2020 | $3,300,459.64 | $3,375,711.32 | $3,301,273.06 |
|---|
9/30/2020 | $3,395,778.89 | $3,510,308.04 | $3,460,746.11 |
|---|
3/31/2021 | $3,418,007.29 | $3,561,656.77 | $3,485,933.39 |
|---|
9/30/2021 | $3,439,920.00 | $3,602,559.42 | $3,510,007.42 |
|---|
3/31/2022 | $3,256,823.87 | $3,402,481.05 | $3,316,858.56 |
|---|
9/30/2022 | $3,044,546.54 | $3,188,243.05 | $3,190,365.54 |
|---|
3/31/2023 | $3,256,293.10 | $3,411,270.72 | $3,383,444.82 |
|---|
9/30/2023 | $3,092,351.53 | $3,273,174.16 | $3,261,474.38 |
|---|
3/31/2024 | $3,292,665.11 | $3,517,922.18 | $3,455,945.22 |
|---|
9/30/2024 | $3,362,096.47 | $3,612,658.18 | $3,536,238.37 |
|---|
3/31/2025 | $3,333,599.31 | $3,560,828.56 | $3,516,408.61 |
|---|
9/30/2025 | $3,439,623.98 | $3,662,964.97 | $3,659,182.91 |
|---|
3/31/2026 | $3,471,267.95 | $3,713,672.51 | $3,668,715.11 |
|---|
|
| Average Annual Return [Table Text Block] |
AVERAGE ANNUAL TOTAL RETURNSTable Summary Institutional | 1 Year | 5 Year | 10 Year |
|---|
Carret Kansas Tax-Exempt Bond Fund - Institutional | 4.13% | 0.31% | 1.47% |
|---|
Bloomberg Municipal Bond Index | 4.29% | 0.84% | 2.16% |
|---|
Bloomberg US Municipal Bond: 7 Year (6-8) Index | 4.35% | 1.03% | 2.03% |
|---|
|
| AssetsNet |
$ 131,285,230
|
| Holdings Count | Holding |
169
|
| InvestmentCompanyPortfolioTurnover |
5.00%
|
| Additional Fund Statistics [Text Block] |
- Total Net Assets$131,285,230
- # of Portfolio Holdings169
- Portfolio Turnover Rate5%
|
| Holdings [Text Block] |
Table SummaryValue | Value |
|---|
5-10 Yr | 41.4% | > 10 Yr | 35.3% | 3-5 Yr | 14.1% | 1-3 Yr | 8.2% | < 1 Yr | 0.4% | Table SummaryValue | Value |
|---|
Cash, Cash Equivalents,
& Other Net Assets | 0.64% | Health Care | 1.03% | Public Services | 1.29% | Transportation | 10.08% | Utilities | 11.06% | Education | 36.17% | General Obligation | 39.43% | |
| Largest Holdings [Text Block] |
Table SummaryTop 10 | % |
|---|
Johnson County Unified School District No 229 Blue Valley 10/01/2038 5.00% | 1.70% | State of Kansas Department of Transportation 09/01/2031 5.00% | 1.57% | State of Kansas Department of Transportation 09/01/2034 5.00% | 1.57% | Allen County Unified School District No 257 09/01/2043 3.00% | 1.52% | Kansas Development Finance Authority 05/01/2042 5.00% | 1.23% | State of Kansas Department of Transportation 09/01/2028 5.00% | 1.18% | City of Lenexa KS 09/01/2033 3.00% | 1.17% | County of Johnson KS 09/01/2035 4.00% | 1.17% | Douglas County Unified School District No 497 Lawrence 09/01/2031 4.00% | 1.15% | Johnson County Unified School District No 229 Blue Valley 10/01/2040 4.00% | 1.15% | Total % of Top 10 Holdings | 13.41% | |
| Material Fund Change [Text Block] |
There have been no material Fund changes during the reporting period. |
| C000225903 |
|
| Shareholder Report [Line Items] |
|
| Fund Name |
CLARKSTON FOUNDERS FUND
|
| Class Name |
Founders
|
| Trading Symbol |
CFMDX
|
| Annual or Semi-Annual Statement [Text Block] |
This semi-annual shareholder report contains important information about Clarkston Founders Fund - Founders Class for the period of October 1, 2025 to March 31, 2026.
|
| Shareholder Report Annual or Semi-Annual |
Semi-Annual Shareholder Report
|
| Additional Information [Text Block] |
You can find additional information about the Fund at https://www.clarkstonfunds.com/literature/clarkston-founders-fund. You can also request this information by contacting us at 844.680.6562.
|
| Additional Information Phone Number |
844.680.6562
|
| Additional Information Website |
<span style="box-sizing: border-box; color: rgb(74, 79, 84); display: inline; flex-wrap: nowrap; font-size: 12px; font-weight: 400; grid-area: auto; line-height: 14.4px; margin: 0px; overflow: visible; text-align: justify; text-align-last: left; white-space-collapse: preserve-breaks;">https://www.clarkstonfunds.com/literature/clarkston-founders-fund</span>
|
| Expenses [Text Block] |
WHAT WERE THE FUND COSTS FOR THE LAST SIX MONTHS? (based on a hypothetical $10,000 investment) Table SummaryCLASS NAME | COSTS OF A $10,000 INVESTMENT | COSTS PAID AS A PERCENTAGE OF
A $10,000 INVESTMENT |
|---|
Clarkston Founders Fund - Founders Class | $40 | 0.80% |
|---|
|
| Expenses Paid, Amount |
$ 0.0080
|
| Expense Ratio, Percent |
4000.00%
|
| Factors Affecting Performance [Text Block] |
HOW DID THE FUND PERFORM IN THE LAST SIX MONTHS?During the six-month period ended March 31, 2026, the Fund’s Founders Class had a return of -1.72% compared to 1.45% for the Russell Midcap® Index and -1.65% for the Russell® 3000 Index. Three largest contributors to the Fund’s performance for the period: Warner Bros. Discovery, Inc. (WBD), a media and entertainment company that operates worldwide. FedEx Corporation (FDX), a provider of transportation, e-commerce, and business services in the United States and internationally that operates through two segments: Federal Express and FedEx Freight. Affiliated Managers Group, Inc. (AMG), which operates as an investment management company providing investment management services to mutual funds, institutional clients, retail and high net worth individuals in the United States.
Three largest detractors from the Fund’s performance for the period: CCC Intelligent Solutions Holdings Inc. (CCC), a software as a service (SaaS) company for the property and casualty insurance economy in the United States and China that connects trading partners, facilitates commerce, and supports mission-critical, artificial intelligence enabled digital workflow across the insurers, repairers, automakers, parts suppliers, lenders, and others. Clarivate PLC (CLVT), an information services provider in the Americas, the Middle East, Africa, Europe, and the Asia Pacific that operates through three segments: Academia & Government, Life Sciences & Healthcare, and Intellectual Property. Avantor, Inc. (AVTR), a provider of products and services to customers in the biopharma, healthcare, education and government, advanced technologies, and applied materials industries in the Americas, Europe, Asia, the Middle East, and Africa.
|
| Average Annual Return [Table Text Block] |
AVERAGE ANNUAL TOTAL RETURNSTable Summary Founders | 1 Year | 5 Year | Since Inception |
|---|
Clarkston Founders Fund - Founders Class (Incept. February 16, 2021) | 3.25% | 2.12% | 2.79% |
|---|
Russell 3000® Index | 18.09% | 10.87% | 10.64% |
|---|
Russell Midcap® Index | 15.98% | 7.26% | 7.09% |
|---|
|
| Performance Inception Date |
Feb. 16, 2021
|
| AssetsNet |
$ 162,970,696
|
| Holdings Count | Holding |
29
|
| InvestmentCompanyPortfolioTurnover |
14.00%
|
| Additional Fund Statistics [Text Block] |
- Total Net Assets$162,970,696
- # of Portfolio Holdings (excluding cash)29
- Portfolio Turnover Rate14%
|
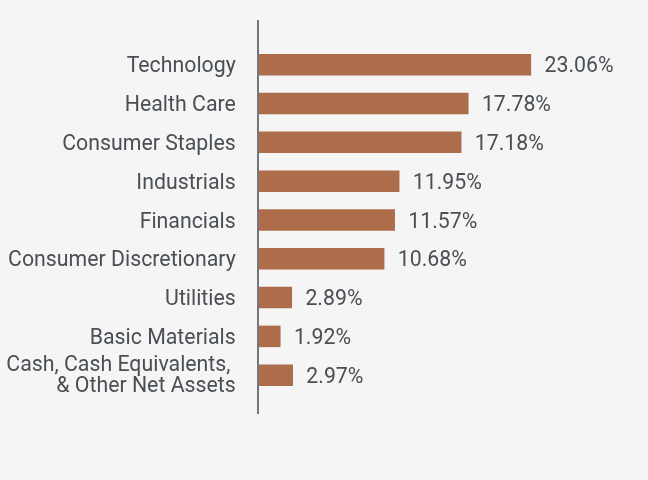
| Holdings [Text Block] |
SECTOR WEIGHTINGS (as a % of Net Assets)Table SummaryValue | Value |
|---|
Cash, Cash Equivalents,
& Other Net Assets | 2.97% | Basic Materials | 1.92% | Utilities | 2.89% | Consumer Discretionary | 10.68% | Financials | 11.57% | Industrials | 11.95% | Consumer Staples | 17.18% | Health Care | 17.78% | Technology | 23.06% | TOP TEN HOLDINGS (as a % of Net Assets)Table SummaryTop 10 | % |
|---|
Clarivate PLC | 12.11% | Post Holdings, Inc. | 9.40% | Affiliated Managers Group, Inc. | 7.30% | Avantor, Inc. | 5.53% | CCC Intelligent Solutions Holdings Inc. | 5.52% | IQVIA Holdings, Inc. | 3.77% | LKQ Corp. | 3.69% | Becton Dickinson & Co. | 3.67% | Middleby Corp. | 3.50% | Fidelity National Information Services, Inc. | 3.45% | Total % of Top 10 Holdings | 57.94% | |
| Material Fund Change [Text Block] |
There have been no material Fund changes during the reporting period. |
| C000168469 |
|
| Shareholder Report [Line Items] |
|
| Fund Name |
CLARKSTON FOUNDERS FUND
|
| Class Name |
Institutional
|
| Trading Symbol |
CIMDX
|
| Annual or Semi-Annual Statement [Text Block] |
This semi-annual shareholder report contains important information about Clarkston Founders Fund - Institutional Class for the period of October 1, 2025 to March 31, 2026.
|
| Shareholder Report Annual or Semi-Annual |
Semi-Annual Shareholder Report
|
| Additional Information [Text Block] |
You can find additional information about the Fund at https://www.clarkstonfunds.com/literature/clarkston-founders-fund. You can also request this information by contacting us at 844.680.6562.
|
| Additional Information Phone Number |
844.680.6562
|
| Additional Information Website |
<span style="box-sizing: border-box; color: rgb(74, 79, 84); display: inline; flex-wrap: nowrap; font-size: 12px; font-weight: 400; grid-area: auto; line-height: 14.4px; margin: 0px; overflow: visible; text-align: justify; text-align-last: left; white-space-collapse: preserve-breaks;">https://www.clarkstonfunds.com/literature/clarkston-founders-fund</span>
|
| Expenses [Text Block] |
WHAT WERE THE FUND COSTS FOR THE LAST SIX MONTHS? (based on a hypothetical $10,000 investment) Table SummaryCLASS NAME | COSTS OF A $10,000 INVESTMENT | COSTS PAID AS A PERCENTAGE OF
A $10,000 INVESTMENT |
|---|
Clarkston Founders Fund - Institutional Class | $44 | 0.90% |
|---|
|
| Expenses Paid, Amount |
$ 0.0090
|
| Expense Ratio, Percent |
4400.00%
|
| Factors Affecting Performance [Text Block] |
HOW DID THE FUND PERFORM IN THE LAST SIX MONTHS?During the six-month period ended March 31, 2026, the Fund’s Institutional Class had a return of -1.88% compared to 1.45% for the Russell Midcap® Index and -1.65% for the Russell® 3000 Index. Three largest contributors to the Fund’s performance for the period: Warner Bros. Discovery, Inc. (WBD), a media and entertainment company that operates worldwide. FedEx Corporation (FDX), a provider of transportation, e-commerce, and business services in the United States and internationally that operates through two segments: Federal Express and FedEx Freight. Affiliated Managers Group, Inc. (AMG), which operates as an investment management company providing investment management services to mutual funds, institutional clients, retail and high net worth individuals in the United States.
Three largest detractors from the Fund’s performance for the period: CCC Intelligent Solutions Holdings Inc. (CCC), a software as a service (SaaS) company for the property and casualty insurance economy in the United States and China that connects trading partners, facilitates commerce, and supports mission-critical, artificial intelligence enabled digital workflow across the insurers, repairers, automakers, parts suppliers, lenders, and others. Clarivate PLC (CLVT), an information services provider in the Americas, the Middle East, Africa, Europe, and the Asia Pacific that operates through three segments: Academia & Government, Life Sciences & Healthcare, and Intellectual Property. Avantor, Inc. (AVTR), a provider of products and services to customers in the biopharma, healthcare, education and government, advanced technologies, and applied materials industries in the Americas, Europe, Asia, the Middle East, and Africa.
|
| Average Annual Return [Table Text Block] |
AVERAGE ANNUAL TOTAL RETURNSTable Summary Institutional | 1 Year | 5 Year | Since Inception |
|---|
Clarkston Founders Fund - Institutional Class (Incept. January 31, 2017) | 3.09% | 2.01% | 7.30% |
|---|
Russell 3000® Index | 18.09% | 10.87% | 13.45% |
|---|
Russell Midcap® Index | 15.98% | 7.26% | 10.37% |
|---|
|
| Performance Inception Date |
Jan. 31, 2017
|
| AssetsNet |
$ 162,970,696
|
| Holdings Count | Holding |
29
|
| InvestmentCompanyPortfolioTurnover |
14.00%
|
| Additional Fund Statistics [Text Block] |
- Total Net Assets$162,970,696
- # of Portfolio Holdings (excluding cash)29
- Portfolio Turnover Rate14%
|
| Holdings [Text Block] |
SECTOR WEIGHTINGS (as a % of Net Assets)Table SummaryValue | Value |
|---|
Cash, Cash Equivalents,
& Other Net Assets | 2.97% | Basic Materials | 1.92% | Utilities | 2.89% | Consumer Discretionary | 10.68% | Financials | 11.57% | Industrials | 11.95% | Consumer Staples | 17.18% | Health Care | 17.78% | Technology | 23.06% | TOP TEN HOLDINGS (as a % of Net Assets)Table SummaryTop 10 | % |
|---|
Clarivate PLC | 12.11% | Post Holdings, Inc. | 9.40% | Affiliated Managers Group, Inc. | 7.30% | Avantor, Inc. | 5.53% | CCC Intelligent Solutions Holdings Inc. | 5.52% | IQVIA Holdings, Inc. | 3.77% | LKQ Corp. | 3.69% | Becton Dickinson & Co. | 3.67% | Middleby Corp. | 3.50% | Fidelity National Information Services, Inc. | 3.45% | Total % of Top 10 Holdings | 57.94% | |
| Material Fund Change [Text Block] |
There have been no material Fund changes during the reporting period. |
| C000159698 |
|
| Shareholder Report [Line Items] |
|
| Fund Name |
CLARKSTON FUND
|
| Class Name |
Institutional
|
| Trading Symbol |
CILGX
|
| Annual or Semi-Annual Statement [Text Block] |
This semi-annual shareholder report contains important information about Clarkston Fund - Institutional Class for the period of October 1, 2025 to March 31, 2026.
|
| Shareholder Report Annual or Semi-Annual |
Semi-Annual Shareholder Report
|
| Additional Information [Text Block] |
You can find additional information about the Fund at https://www.clarkstonfunds.com/literature/clarkston-fund. You can also request this information by contacting us at 844.680.6562.
|
| Additional Information Phone Number |
844.680.6562
|
| Additional Information Website |
<span style="box-sizing: border-box; color: rgb(74, 79, 84); display: inline; flex-wrap: nowrap; font-size: 12px; font-weight: 400; grid-area: auto; line-height: 14.4px; margin: 0px; overflow: visible; text-align: justify; text-align-last: left; white-space-collapse: preserve-breaks;">https://www.clarkstonfunds.com/literature/clarkston-fund</span>
|
| Expenses [Text Block] |
WHAT WERE THE FUND COSTS FOR THE LAST SIX MONTHS? (based on a hypothetical $10,000 investment) Table SummaryCLASS NAME | COSTS OF A $10,000 INVESTMENT | COSTS PAID AS A PERCENTAGE OF
A $10,000 INVESTMENT |
|---|
Clarkston Fund - Institutional Class | $32 | 0.65% |
|---|
|
| Expenses Paid, Amount |
$ 0.0065
|
| Expense Ratio, Percent |
3200.00%
|
| Factors Affecting Performance [Text Block] |
HOW DID THE FUND PERFORM IN THE LAST SIX MONTHS?During the six-month period ended March 31, 2026, the Fund’s Institutional Class had a return of -1.75% compared to -1.87% for the Russell 1000® Index and -1.65% for the Russell® 3000 Index. Three largest contributors to the Fund’s performance for the period: Warner Bros. Discovery, Inc. (WBD), a media and entertainment company that operates worldwide. FedEx Corporation (FDX), a provider of transportation, e-commerce, and business services in the United States and internationally that operates through two segments: Federal Express and FedEx Freight. Anheuser-Busch InBev SA/NV ADR (BUD), a company that produces and sells beer in North America, Middle Americas, South America, Europe, the Middle East, Africa, and the Asia Pacific.
Three largest detractors from the Fund’s performance for the period: Gartner, Inc. (IT), a provider of business and technology insights for decisions and performance on an organization's priorities in the United States, Canada, Europe, the Middle East, Africa, and internationally. Clarivate PLC (CLVT), an information services provider in the Americas, the Middle East, Africa, Europe, and the Asia Pacific that operates through three segments: Academia & Government, Life Sciences & Healthcare, and Intellectual Property. Avantor, Inc. (AVTR), a provider of products and services to customers in the biopharma, healthcare, education and government, advanced technologies, and applied materials industries in the Americas, Europe, Asia, the Middle East, and Africa.
|
| Average Annual Return [Table Text Block] |
AVERAGE ANNUAL TOTAL RETURNSTable Summary Institutional | 1 Year | 5 Year | Since Inception |
|---|
Clarkston Fund - Institutional Class (Incept. April 1, 2016) | 3.17% | 3.12% | 7.93% |
|---|
Russell 3000® Index | 18.09% | 10.87% | 13.65% |
|---|
Russell 1000® Index | 17.74% | 11.34% | 13.90% |
|---|
|
| Performance Inception Date |
Apr. 01, 2016
|
| AssetsNet |
$ 96,810,558
|
| Holdings Count | Holding |
27
|
| InvestmentCompanyPortfolioTurnover |
9.00%
|
| Additional Fund Statistics [Text Block] |
- Total Net Assets$96,810,558
- # of Portfolio Holdings (excluding cash)27
- Portfolio Turnover Rate9%
|
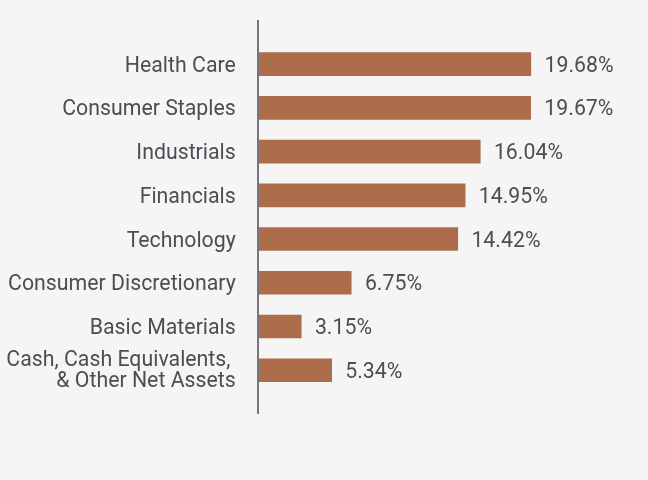
| Holdings [Text Block] |
SECTOR WEIGHTINGS (as a % of Net Assets)Table SummaryValue | Value |
|---|
Cash, Cash Equivalents,
& Other Net Assets | 5.34% | Basic Materials | 3.15% | Consumer Discretionary | 6.75% | Technology | 14.42% | Financials | 14.95% | Industrials | 16.04% | Consumer Staples | 19.67% | Health Care | 19.68% | TOP TEN HOLDINGS (as a % of Net Assets)Table SummaryTop 10 | % |
|---|
Post Holdings, Inc. | 10.11% | Affiliated Managers Group, Inc. | 8.00% | Clarivate PLC | 7.17% | IQVIA Holdings, Inc. | 5.11% | Avantor, Inc. | 5.06% | Becton Dickinson & Co. | 5.03% | Fidelity National Information Services, Inc. | 4.60% | Fortive Corp. | 4.57% | Airbnb, Inc. | 3.91% | Lamb Weston Holdings, Inc. | 3.71% | Total % of Top 10 Holdings | 57.27% | |
| Material Fund Change [Text Block] |
There have been no material Fund changes during the reporting period. |
| C000159696 |
|
| Shareholder Report [Line Items] |
|
| Fund Name |
CLARKSTON PARTNERS FUND
|
| Class Name |
Founders
|
| Trading Symbol |
CFSMX
|
| Annual or Semi-Annual Statement [Text Block] |
This semi-annual shareholder report contains important information about Clarkston Partners Fund - Founders Class for the period of October 1, 2025 to March 31, 2026.
|
| Shareholder Report Annual or Semi-Annual |
Semi-Annual Shareholder Report
|
| Additional Information [Text Block] |
You can find additional information about the Fund at https://www.clarkstonfunds.com/literature/clarkston-partners-fund. You can also request this information by contacting us at 844.680.6562.
|
| Additional Information Phone Number |
844.680.6562
|
| Additional Information Website |
<span style="box-sizing: border-box; color: rgb(74, 79, 84); display: inline; flex-wrap: nowrap; font-size: 12px; font-weight: 400; grid-area: auto; line-height: 14.4px; margin: 0px; overflow: visible; text-align: justify; text-align-last: left; white-space-collapse: preserve-breaks;">https://www.clarkstonfunds.com/literature/clarkston-partners-fund</span>
|
| Expenses [Text Block] |
WHAT WERE THE FUND COSTS FOR THE LAST SIX MONTHS? (based on a hypothetical $10,000 investment) Table SummaryCLASS NAME | COSTS OF A $10,000 INVESTMENT | COSTS PAID AS A PERCENTAGE OF
A $10,000 INVESTMENT |
|---|
Clarkston Partners Fund - Founders Class | $42 | 0.85% |
|---|
|
| Expenses Paid, Amount |
$ 0.0085
|
| Expense Ratio, Percent |
4200.00%
|
| Factors Affecting Performance [Text Block] |
HOW DID THE FUND PERFORM IN THE LAST SIX MONTHS?During the six-month period ended March 31, 2026, the Fund’s Founders Class had a return of -3.60% compared to 4.30% for the Russell 2500TM Index and -1.65% for the Russell® 3000 Index. Three largest contributors to the Fund’s performance for the period: Neogen Corporation (NEOG), a company that develops, manufactures, and markets various products and services for food and animal safety in the United States and internationally. Affiliated Managers Group, Inc. (AMG), which operates as an investment management company providing investment management services to mutual funds, institutional clients, retail and high net worth individuals in the United States. C.H. Robinson Worldwide, Inc. (CHRW), a provider of freight transportation and related logistics and supply chain services in the United States and internationally.
Three largest detractors from the Fund’s performance for the period: CCC Intelligent Solutions Holdings Inc. (CCC), a software as a service (SaaS) company for the property and casualty insurance economy in the United States and China that connects trading partners, facilitates commerce, and supports mission-critical, artificial intelligence enabled digital workflow across the insurers, repairers, automakers, parts suppliers, lenders, and others. Clarivate PLC (CLVT), an information services provider in the Americas, the Middle East, Africa, Europe, and the Asia Pacific that operates through three segments: Academia & Government, Life Sciences & Healthcare, and Intellectual Property. Avantor, Inc. (AVTR), a provider of products and services to customers in the biopharma, healthcare, education and government, advanced technologies, and applied materials industries in the Americas, Europe, Asia, the Middle East, and Africa.
|
| Average Annual Return [Table Text Block] |
AVERAGE ANNUAL TOTAL RETURNSTable Summary Founders | 1 Year | 5 Year | 10 Year |
|---|
Clarkston Partners Fund - Founders Class (Incept. September 15, 2015) | -4.87% | -1.03% | 6.26% |
|---|
Russell 3000® Index | 18.09% | 10.87% | 13.72% |
|---|
Russell 2500™ Index | 23.45% | 5.48% | 10.58% |
|---|
|
| Performance Inception Date |
Sep. 15, 2015
|
| AssetsNet |
$ 311,984,989
|
| Holdings Count | Holding |
27
|
| InvestmentCompanyPortfolioTurnover |
11.00%
|
| Additional Fund Statistics [Text Block] |
- Total Net Assets$311,984,989
- # of Portfolio Holdings (excluding cash)27
- Portfolio Turnover Rate11%
|
| Holdings [Text Block] |
SECTOR WEIGHTINGS (as a % of Net Assets)Table SummaryValue | Value |
|---|
Cash, Cash Equivalents,
& Other Net Assets | 1.12% | Utilities | 3.14% | Consumer Discretionary | 8.66% | Industrials | 9.43% | Financials | 13.27% | Health Care | 19.10% | Technology | 22.07% | Consumer Staples | 23.21% | TOP TEN HOLDINGS (as a % of Net Assets)Table SummaryTop 10 | % |
|---|
Clarivate PLC | 11.19% | Post Holdings, Inc. | 9.51% | Affiliated Managers Group, Inc. | 7.81% | CCC Intelligent Solutions Holdings Inc. | 5.96% | Avantor, Inc. | 5.91% | John Wiley & Sons, Inc. | 4.70% | LKQ Corp. | 3.96% | Envista Holdings Corp. | 3.86% | Middleby Corp. | 3.53% | Waystar Holding Corp. | 3.52% | Total % of Top 10 Holdings | 59.95% | |
| Material Fund Change [Text Block] |
There have been no material Fund changes during the reporting period. |
| C000159697 |
|
| Shareholder Report [Line Items] |
|
| Fund Name |
CLARKSTON PARTNERS FUND
|
| Class Name |
Institutional
|
| Trading Symbol |
CISMX
|
| Annual or Semi-Annual Statement [Text Block] |
This semi-annual shareholder report contains important information about Clarkston Partners Fund - Institutional Class for the period of October 1, 2025 to March 31, 2026.
|
| Shareholder Report Annual or Semi-Annual |
Semi-Annual Shareholder Report
|
| Additional Information [Text Block] |
You can find additional information about the Fund at https://www.clarkstonfunds.com/literature/clarkston-partners-fund. You can also request this information by contacting us at 844.680.6562.
|
| Additional Information Phone Number |
844.680.6562
|
| Additional Information Website |
<span style="box-sizing: border-box; color: rgb(74, 79, 84); display: inline; flex-wrap: nowrap; font-size: 12px; font-weight: 400; grid-area: auto; line-height: 14.4px; margin: 0px; overflow: visible; text-align: justify; text-align-last: left; white-space-collapse: preserve-breaks;">https://www.clarkstonfunds.com/literature/clarkston-partners-fund</span>
|
| Expenses [Text Block] |
WHAT WERE THE FUND COSTS FOR THE LAST SIX MONTHS? (based on a hypothetical $10,000 investment) Table SummaryCLASS NAME | COSTS OF A $10,000 INVESTMENT | COSTS PAID AS A PERCENTAGE OF
A $10,000 INVESTMENT |
|---|
Clarkston Partners Fund - Institutional Class | $46 | 0.94% |
|---|
|
| Expenses Paid, Amount |
$ 0.0094
|
| Expense Ratio, Percent |
4600.00%
|
| Factors Affecting Performance [Text Block] |
HOW DID THE FUND PERFORM IN THE LAST SIX MONTHS?During the six-month period ended March 31, 2026, the Fund’s Institutional Class had a return of -3.67% compared to 4.30% for the Russell 2500TM Index and -1.65% for the Russell® 3000 Index. Three largest contributors to the Fund’s performance for the period: Neogen Corporation (NEOG), a company that develops, manufactures, and markets various products and services for food and animal safety in the United States and internationally. Affiliated Managers Group, Inc. (AMG), which operates as an investment management company providing investment management services to mutual funds, institutional clients, retail and high net worth individuals in the United States. C.H. Robinson Worldwide, Inc. (CHRW), a provider of freight transportation and related logistics and supply chain services in the United States and internationally.
Three largest detractors from the Fund’s performance for the period: CCC Intelligent Solutions Holdings Inc. (CCC), a software as a service (SaaS) company for the property and casualty insurance economy in the United States and China that connects trading partners, facilitates commerce, and supports mission-critical, artificial intelligence enabled digital workflow across the insurers, repairers, automakers, parts suppliers, lenders, and others. Clarivate PLC (CLVT), an information services provider in the Americas, the Middle East, Africa, Europe, and the Asia Pacific that operates through three segments: Academia & Government, Life Sciences & Healthcare, and Intellectual Property. Avantor, Inc. (AVTR), a provider of products and services to customers in the biopharma, healthcare, education and government, advanced technologies, and applied materials industries in the Americas, Europe, Asia, the Middle East, and Africa.
|
| Average Annual Return [Table Text Block] |
AVERAGE ANNUAL TOTAL RETURNSTable Summary Institutional | 1 Year | 5 Year | 10 Year |
|---|
Clarkston Partners Fund - Institutional Class (Incept. September 15, 2015) | -5.02% | -1.12% | 6.15% |
|---|
Russell 3000® Index | 18.09% | 10.87% | 13.72% |
|---|
Russell 2500™ Index | 23.45% | 5.48% | 10.58% |
|---|
|
| Performance Inception Date |
Sep. 15, 2015
|
| AssetsNet |
$ 311,984,989
|
| Holdings Count | Holding |
27
|
| InvestmentCompanyPortfolioTurnover |
11.00%
|
| Additional Fund Statistics [Text Block] |
- Total Net Assets$311,984,989
- # of Portfolio Holdings (excluding cash)27
- Portfolio Turnover Rate11%
|
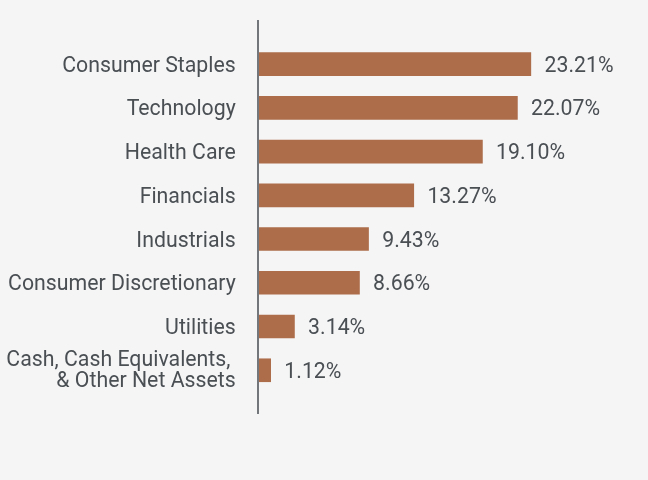
| Holdings [Text Block] |
SECTOR WEIGHTINGS (as a % of Net Assets)Table SummaryValue | Value |
|---|
Cash, Cash Equivalents,
& Other Net Assets | 1.12% | Utilities | 3.14% | Consumer Discretionary | 8.66% | Industrials | 9.43% | Financials | 13.27% | Health Care | 19.10% | Technology | 22.07% | Consumer Staples | 23.21% | TOP TEN HOLDINGS (as a % of Net Assets)Table SummaryTop 10 | % |
|---|
Clarivate PLC | 11.19% | Post Holdings, Inc. | 9.51% | Affiliated Managers Group, Inc. | 7.81% | CCC Intelligent Solutions Holdings Inc. | 5.96% | Avantor, Inc. | 5.91% | John Wiley & Sons, Inc. | 4.70% | LKQ Corp. | 3.96% | Envista Holdings Corp. | 3.86% | Middleby Corp. | 3.53% | Waystar Holding Corp. | 3.52% | Total % of Top 10 Holdings | 59.95% | |
| Material Fund Change [Text Block] |
There have been no material Fund changes during the reporting period. |
| C000266372 |
|
| Shareholder Report [Line Items] |
|
| No Trading Symbol [Flag] |
true
|
| Annual or Semi-Annual Statement [Text Block] |
This semi-annual shareholder report contains important information about Fundsmith Equity ETF for the period of December 1, 2025 to March 31, 2026.
|
| Shareholder Report Annual or Semi-Annual |
semi-annual shareholder report
|
| Additional Information [Text Block] |
You can find additional information about the Fund at https://www.fundsmithetf.us/#documents. You can also request this information by contacting us at (203) 813-5519.
|
| Material Fund Change Notice [Text Block] |
*The reporting period is less than a full semi-annual reporting period. Expenses paid for a full semi-annual reporting period would be higher.
|
| Additional Information Phone Number |
(203) 813-5519
|
| Additional Information Website |
https://www.fundsmithetf.us/#documents
|
| Expenses [Text Block] |
What were the Fund’s costs over the period?*(based on a hypothetical $10,000 investment) Table SummaryFund Name | Cost of a $10,000
Investment | Cost Paid as a Percentage of a
$10,000 Investment |
|---|
Fundsmith Equity ETF | $31 | 1.00% |
|---|
*The reporting period is less than a full semi-annual reporting period. Expenses paid for a full semi-annual reporting period would be higher. |
| Expenses Paid, Amount |
$ 31
|
| Expense Ratio, Percent |
1.00%
|
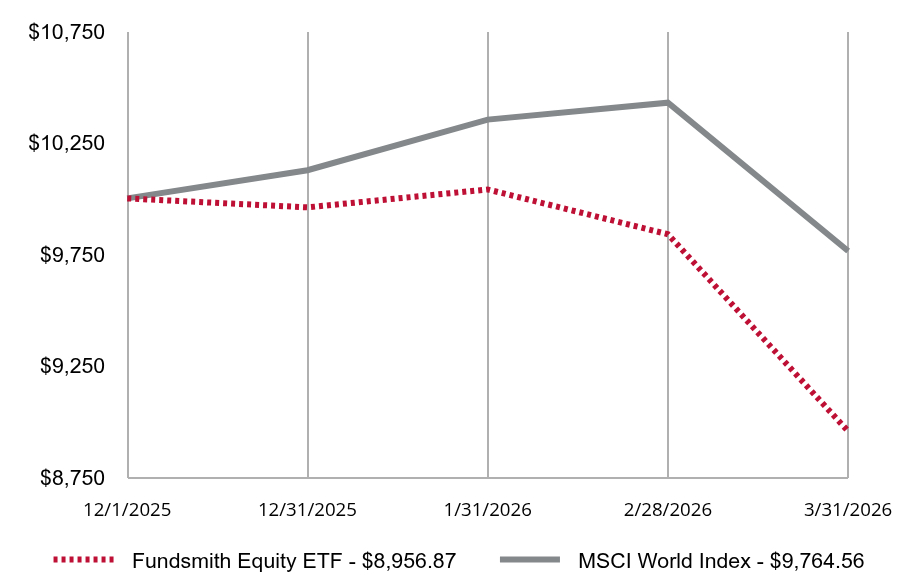
| Factors Affecting Performance [Text Block] |
How has the Fund performed since inception?For the period from inception on December 1, 2025 to March 31, 2026, the Fund declined 10.43% compared to the decline of 2.35% for the MSCI World Index. Relative performance was impacted by the war with Iran which led to strong performance in the Energy sector where at period end, we had a zero weighting and by the on-going boom in Information Technology due to investor enthusiasm with AI stocks in which we were significantly underweight exiting the period due to our belief that a bubble is developing. The Fund's overweight to Health Care was also a negative detractor. Positive contributors included Taiwan Semiconductor, Texas Instruments, and Marriott, while holdings such as LVMH, EssilorLuxottica, Wolters Kluwer, and ADP detracted. |
| Line Graph [Table Text Block] |
How has the Fund performed since inception?TOTAL RETURN BASED ON $10,000 INVESTMENTTable Summary | Fundsmith Equity ETF | MSCI World Index |
|---|
12/1/2025 | $10,000.00 | $10,000.01 |
|---|
12/31/2025 | $9,959.88 | $10,126.37 |
|---|
1/31/2026 | $10,040.12 | $10,352.99 |
|---|
2/28/2026 | $9,839.52 | $10,428.83 |
|---|
3/31/2026 | $8,956.87 | $9,764.56 |
|---|
|
| Performance Inception Date |
Dec. 01, 2025
|
| AssetsNet |
$ 13,670,344
|
| Holdings Count | Holding |
28
|
| InvestmentCompanyPortfolioTurnover |
17.00%
|
| Additional Fund Statistics [Text Block] |
- Total Net Assets$13,670,344
- Number of Portfolio Holdings28
- Portfolio Turnover Rate17%
|
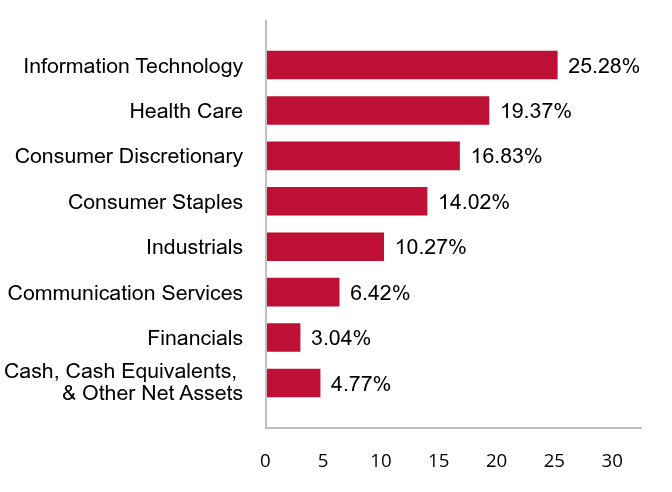
| Holdings [Text Block] |
Table SummaryValue | Value |
|---|
Cash, Cash Equivalents,
& Other Net Assets | 4.77% | Financials | 3.04% | Communication Services | 6.42% | Industrials | 10.27% | Consumer Staples | 14.02% | Consumer Discretionary | 16.83% | Health Care | 19.37% | Information Technology | 25.28% | Table SummaryValue | Value |
|---|
Common Stock | 95.23% | Cash, Cash Equivalents, & Other Net Assets | 4.77% | |
| Largest Holdings [Text Block] |
Availability of Additional Information Additional information about the Fund, including its prospectus, financial information, and holdings, can be found by visiting https://www.fundsmithetf.us/#documents. |
| Material Fund Change [Text Block] |
There have been no material Fund changes during the reporting period. |
| C000225205 |
|
| Shareholder Report [Line Items] |
|
| Fund Name |
Hillman Value Fund
|
| Trading Symbol |
HCMAX
|
| Annual or Semi-Annual Statement [Text Block] |
This semi-annual shareholder report contains important information about Hillman Value Fund for the period of October 1, 2025 to March 31, 2026.
|
| Shareholder Report Annual or Semi-Annual |
semi-annual shareholder report
|
| Additional Information [Text Block] |
You can find additional information about the Fund at https://hcmfunds.com/resources. You can also request this information by contacting us at 1-855-400-5944.
|
| Material Fund Change Notice [Text Block] |
|
| Additional Information Phone Number |
1-855-400-5944
|
| Additional Information Website |
<span style="box-sizing: border-box; color: rgb(10, 10, 10); display: inline; flex-wrap: nowrap; font-size: 12px; font-weight: 400; grid-area: auto; line-height: 14.4px; margin: 0px; overflow: visible; text-align: left; text-align-last: auto; white-space-collapse: preserve-breaks;">https://hcmfunds.com/resources</span>
|
| Expenses [Text Block] |
What were the Fund costs for the last six months? (based on a hypothetical $10,000 investment) Table SummaryFUND NAME | COSTS OF A $10,000 INVESTMENT | COSTS PAID AS A PERCENTAGE OF
A $10,000 INVESTMENT |
|---|
Hillman Value Fund | $48 | 0.95% |
|---|
|
| Expenses Paid, Amount |
$ 0.0095
|
| Expense Ratio, Percent |
4800.00%
|
| Factors Affecting Performance [Text Block] |
How did the Fund perform in the last six months? For the six months ending March 31, 2026, the Hillman Value Fund returned 1.62% versus a return of 5.99% for its benchmark, the Russell 1000 Value Total Return Index. The Fund enjoyed strong performance in the Materials, Health Care, Communication Services, and Industrials Sectors. The Information Technology, Consumer Discretionary, Financials, and Consumer Staples Sectors negatively impacted results. The premiums generated from option writing nominally benefited performance. |
| Average Annual Return [Table Text Block] |
AVERAGE ANNUAL TOTAL RETURNSTable Summary Fund | 1 Year | 5 Year | 10 Year |
|---|
Hillman Value Fund | 8.64% | 6.51% | 10.97% |
|---|
FT Wilshire 5000 Index - TR | 18.31% | 11.10% | 13.87% |
|---|
Russell 1000® Value Index TR | 15.87% | 9.43% | 10.58% |
|---|
|
| AssetsNet |
$ 82,915,532
|
| Holdings Count | Holding |
38
|
| InvestmentCompanyPortfolioTurnover |
12.00%
|
| Additional Fund Statistics [Text Block] |
- Total Net Assets$82,915,532
- # of Portfolio Holdings38
- Portfolio Turnover Rate12%
|
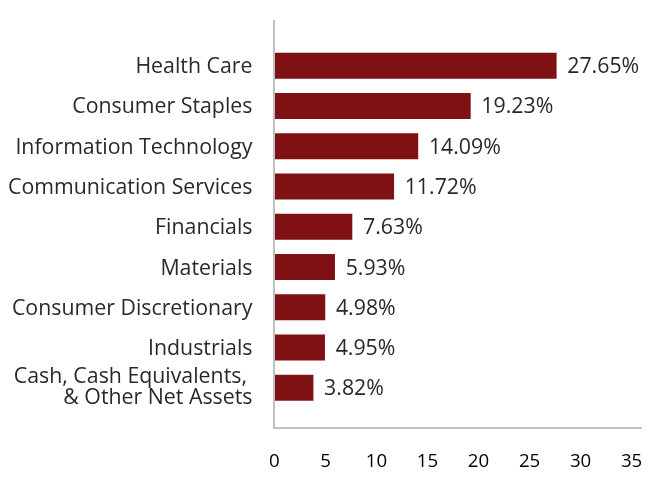
| Holdings [Text Block] |
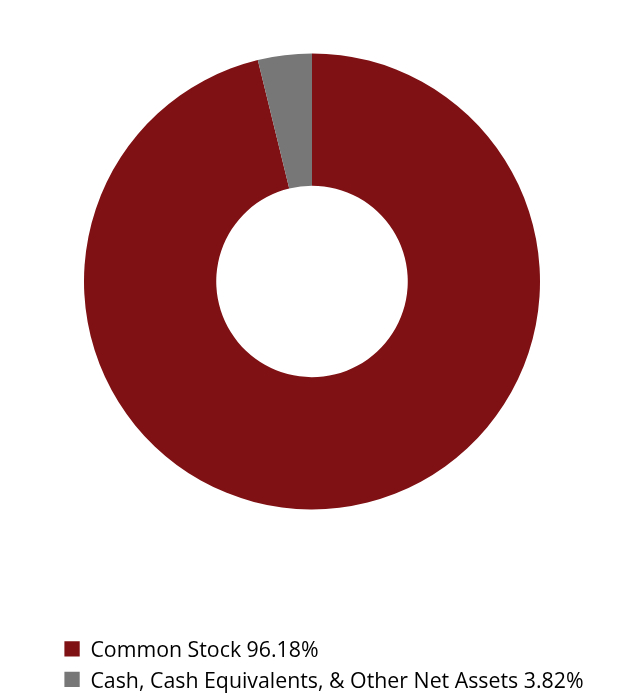
Table SummaryValue | Value |
|---|
Cash, Cash Equivalents,
& Other Net Assets | 3.82% | Industrials | 4.95% | Consumer Discretionary | 4.98% | Materials | 5.93% | Financials | 7.63% | Communication Services | 11.72% | Information Technology | 14.09% | Consumer Staples | 19.23% | Health Care | 27.65% | Table SummaryValue | Value |
|---|
Common Stock | 96.18% | Cash, Cash Equivalents, & Other Net Assets | 3.82% | |
| Material Fund Change [Text Block] |
There have been no material Fund changes during the reporting period. |