Shareholder Report
|
6 Months Ended |
|
Mar. 31, 2026
USD ($)
Holding
|
|---|
| Shareholder Report [Line Items] |
|
| Document Type |
N-CSRS
|
| Amendment Flag |
false
|
| Registrant Name |
RIVERNORTH FUNDS
|
| Entity Central Index Key |
0001370177
|
| Entity Investment Company Type |
N-1A
|
| Document Period End Date |
Mar. 31, 2026
|
| C000095455 |
|
| Shareholder Report [Line Items] |
|
| Fund Name |
RIVERNORTH/DOUBLELINE STRATEGIC INCOME FUND
|
| Class Name |
CLASS I
|
| Trading Symbol |
RNSIX
|
| Annual or Semi-Annual Statement [Text Block] |
Semi-Annual Shareholder Report
|
| Shareholder Report Annual or Semi-Annual |
semi-annual shareholder report
|
| Additional Information [Text Block] |
You can find additional information about the Fund at https://www.rivernorth.com/investments/rnsix-rndlx/. You can also request this information by contacting us at 888.848.7569.
|
| Additional Information Phone Number |
888.848.7569
|
| Additional Information Website |
https://www.rivernorth.com/investments/rnsix-rndlx/
|
| Expenses [Text Block] |
WHAT WERE THE FUND'S COSTS FOR THE LAST SIX MONTHS? (based on a hypothetical $10,000 investment) Table SummaryCLASS NAME | COST OF A $10,000 INVESTMENT | COSTS PAID AS A PERCENTAGE OF A $10,000 INVESTMENT |
|---|
RiverNorth/DoubleLine Strategic Income Fund - Class I | $47 | 0.93% |
|---|
|
| Expenses Paid, Amount |
$ 47
|
| Expense Ratio, Percent |
0.93%
|
| Line Graph [Table Text Block] |
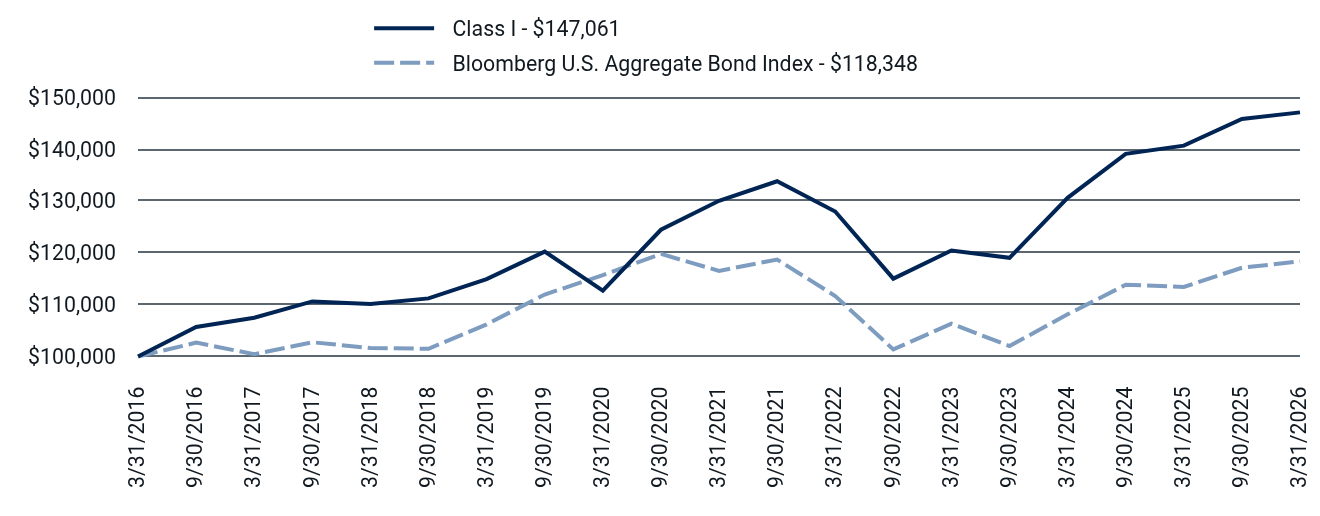
Table Summary | Class I - $147,061 | Bloomberg U.S. Aggregate Bond Index - $118,348 |
|---|
3/31/2016 | $100,000 | $100,000 |
|---|
9/30/2016 | $105,694 | $102,682 |
|---|
3/31/2017 | $107,487 | $100,441 |
|---|
9/30/2017 | $110,632 | $102,757 |
|---|
3/31/2018 | $110,141 | $101,649 |
|---|
9/30/2018 | $111,210 | $101,507 |
|---|
3/31/2019 | $114,930 | $106,203 |
|---|
9/30/2019 | $120,217 | $111,959 |
|---|
3/31/2020 | $112,723 | $115,691 |
|---|
9/30/2020 | $124,439 | $119,779 |
|---|
3/31/2021 | $130,017 | $116,513 |
|---|
9/30/2021 | $133,791 | $118,706 |
|---|
3/31/2022 | $127,949 | $111,675 |
|---|
9/30/2022 | $115,011 | $101,376 |
|---|
3/31/2023 | $120,438 | $106,333 |
|---|
9/30/2023 | $119,037 | $102,029 |
|---|
3/31/2024 | $130,597 | $108,139 |
|---|
9/30/2024 | $139,065 | $113,832 |
|---|
3/31/2025 | $140,646 | $113,416 |
|---|
9/30/2025 | $145,793 | $117,115 |
|---|
3/31/2026 | $147,061 | $118,348 |
|---|
|
| Average Annual Return [Table Text Block] |
AVERAGE ANNUAL TOTAL RETURNSTable Summary RiverNorth/DoubleLine Strategic Income Fund | 6 months | 1 Year | 5 Year | 10 Year |
|---|
Class I | 0.87% | 4.56% | 2.49% | 3.93% |
|---|
Bloomberg U.S. Aggregate Bond Index | 1.05% | 4.35% | 0.31% | 1.70% |
|---|
|
| Holdings Count | Holding |
1,306
|
| Advisory Fees Paid, Amount |
$ 4,219,429
|
| InvestmentCompanyPortfolioTurnover |
24.00%
|
| Additional Fund Statistics [Text Block] |
- Total Net Assets$995,345,275
- # of Portfolio Holdings1,306
- Portfolio Turnover Rate (Class I)24%
- Advisory Fees Paid$4,219,429
|
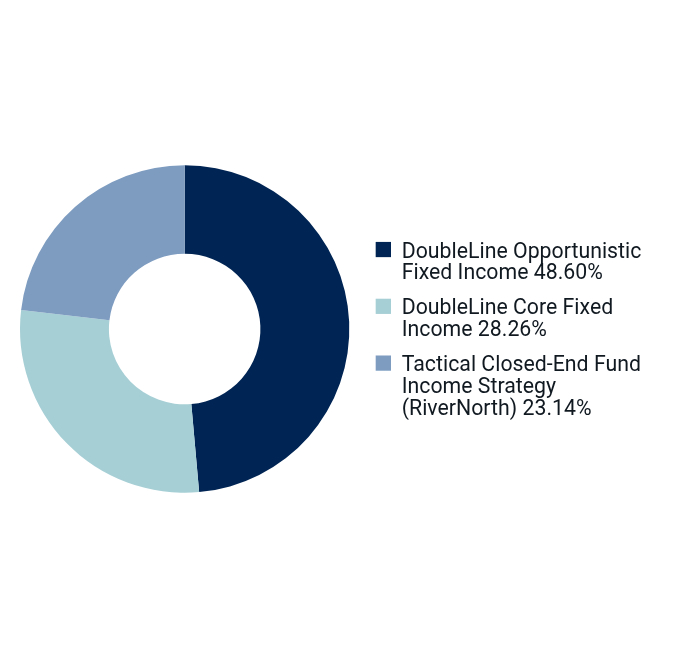
| Holdings [Text Block] |
(percentages are based on total investments) Table SummaryValue | Value |
|---|
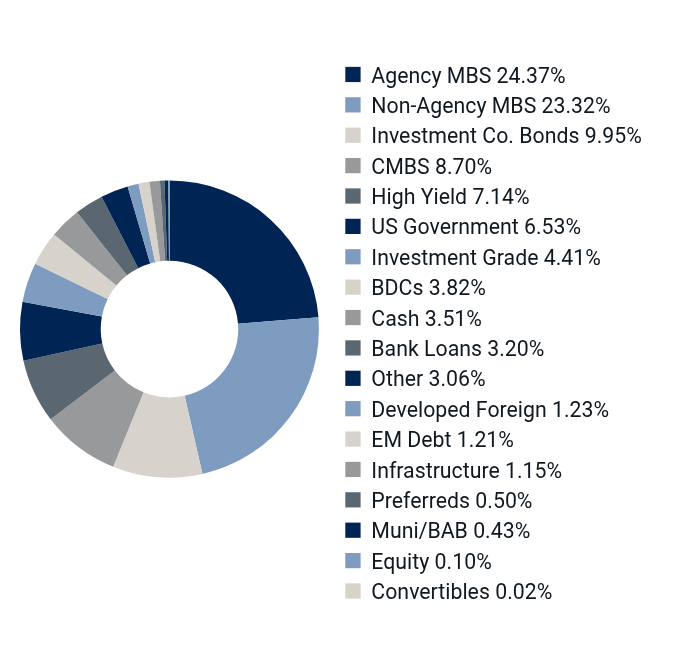
DoubleLine Opportunistic Fixed Income | 48.60% | DoubleLine Core Fixed Income | 28.26% | Tactical Closed-End Fund Income Strategy (RiverNorth) | 23.14% | (percentages are based on net assets) Table SummaryValue | Value |
|---|
Agency MBS | 24.37% | Non-Agency MBS | 23.32% | Investment Co. Bonds | 9.95% | CMBS | 8.70% | High Yield | 7.14% | US Government | 6.53% | Investment Grade | 4.41% | BDCs | 3.82% | Cash | 3.51% | Bank Loans | 3.20% | Other | 3.06% | Developed Foreign | 1.23% | EM Debt | 1.21% | Infrastructure | 1.15% | Preferreds | 0.50% | Muni/BAB | 0.43% | Equity | 0.10% | Convertibles | 0.02% | |
| Material Fund Change [Text Block] |
There have been no material Fund changes during the reporting period. |
| C000095454 |
|
| Shareholder Report [Line Items] |
|
| Fund Name |
RIVERNORTH/DOUBLELINE STRATEGIC INCOME FUND
|
| Class Name |
CLASS R
|
| Trading Symbol |
RNDLX
|
| Annual or Semi-Annual Statement [Text Block] |
Semi-Annual Shareholder Report
|
| Shareholder Report Annual or Semi-Annual |
semi-annual shareholder report
|
| Additional Information [Text Block] |
You can find additional information about the Fund at https://www.rivernorth.com/investments/rnsix-rndlx/. You can also request this information by contacting us at 888.848.7569.
|
| Additional Information Phone Number |
888.848.7569
|
| Additional Information Website |
https://www.rivernorth.com/investments/rnsix-rndlx/
|
| Expenses [Text Block] |
WHAT WERE THE FUND'S COSTS FOR THE LAST SIX MONTHS? (based on a hypothetical $10,000 investment) Table SummaryCLASS NAME | COST OF A $10,000 INVESTMENT | COSTS PAID AS A PERCENTAGE OF A $10,000 INVESTMENT |
|---|
RiverNorth/DoubleLine Strategic Income Fund - Class R | $59 | 1.18% |
|---|
|
| Expenses Paid, Amount |
$ 59
|
| Expense Ratio, Percent |
1.18%
|
| Line Graph [Table Text Block] |
Table Summary | Class R - $14,349 | Bloomberg U.S. Aggregate Bond Index - $11,835 |
|---|
3/31/2016 | $10,000 | $10,000 |
|---|
9/30/2016 | $10,566 | $10,268 |
|---|
3/31/2017 | $10,731 | $10,044 |
|---|
9/30/2017 | $11,031 | $10,276 |
|---|
3/31/2018 | $10,968 | $10,165 |
|---|
9/30/2018 | $11,050 | $10,151 |
|---|
3/31/2019 | $11,416 | $10,620 |
|---|
9/30/2019 | $11,925 | $11,196 |
|---|
3/31/2020 | $11,169 | $11,569 |
|---|
9/30/2020 | $12,312 | $11,978 |
|---|
3/31/2021 | $12,847 | $11,651 |
|---|
9/30/2021 | $13,202 | $11,871 |
|---|
3/31/2022 | $12,611 | $11,168 |
|---|
9/30/2022 | $11,324 | $10,138 |
|---|
3/31/2023 | $11,828 | $10,633 |
|---|
9/30/2023 | $11,690 | $10,203 |
|---|
3/31/2024 | $12,806 | $10,814 |
|---|
9/30/2024 | $13,619 | $11,383 |
|---|
3/31/2025 | $13,757 | $11,342 |
|---|
9/30/2025 | $14,242 | $11,711 |
|---|
3/31/2026 | $14,349 | $11,835 |
|---|
|
| Average Annual Return [Table Text Block] |
AVERAGE ANNUAL TOTAL RETURNSTable Summary RiverNorth/DoubleLine Strategic Income Fund | 6 months | 1 Year | 5 Year | 10 Year |
|---|
Class R | 0.75% | 4.30% | 2.24% | 3.68% |
|---|
Bloomberg U.S. Aggregate Bond Index | 1.05% | 4.35% | 0.31% | 1.70% |
|---|
|
| Holdings Count | Holding |
1,306
|
| Advisory Fees Paid, Amount |
$ 4,219,429
|
| InvestmentCompanyPortfolioTurnover |
24.00%
|
| Additional Fund Statistics [Text Block] |
- Total Net Assets$995,345,275
- # of Portfolio Holdings1,306
- Portfolio Turnover Rate (Class R)24%
- Advisory Fees Paid$4,219,429
|
| Holdings [Text Block] |
(percentages are based on total investments) Table SummaryValue | Value |
|---|
DoubleLine Opportunistic Fixed Income | 48.60% | DoubleLine Core Fixed Income | 28.26% | Tactical Closed-End Fund Income Strategy (RiverNorth) | 23.14% | (percentages are based on net assets) Table SummaryValue | Value |
|---|
Agency MBS | 24.37% | Non-Agency MBS | 23.32% | Investment Co. Bonds | 9.95% | CMBS | 8.70% | High Yield | 7.14% | US Government | 6.53% | Investment Grade | 4.41% | BDCs | 3.82% | Cash | 3.51% | Bank Loans | 3.20% | Other | 3.06% | Developed Foreign | 1.23% | EM Debt | 1.21% | Infrastructure | 1.15% | Preferreds | 0.50% | Muni/BAB | 0.43% | Equity | 0.10% | Convertibles | 0.02% | |
| Material Fund Change [Text Block] |
There have been no material Fund changes during the reporting period. |
| C000119956 |
|
| Shareholder Report [Line Items] |
|
| Fund Name |
RIVERNORTH/OAKTREE HIGH INCOME FUND
|
| Class Name |
CLASS I
|
| Trading Symbol |
RNHIX
|
| Annual or Semi-Annual Statement [Text Block] |
Semi-Annual Shareholder Report
|
| Shareholder Report Annual or Semi-Annual |
semi-annual shareholder report
|
| Additional Information [Text Block] |
You can find additional information about the Fund at https://www.rivernorth.com/investments/rnhix-rnotx/. You can also request this information by contacting us at 888.848.7569.
|
| Additional Information Phone Number |
888.848.7569
|
| Additional Information Website |
https://www.rivernorth.com/investments/rnhix-rnotx/
|
| Expenses [Text Block] |
WHAT WERE THE FUND'S COSTS FOR THE LAST SIX MONTHS? (based on a hypothetical $10,000 investment) Table SummaryCLASS NAME | COST OF A $10,000 INVESTMENT | COSTS PAID AS A PERCENTAGE OF A $10,000 INVESTMENT |
|---|
RiverNorth/Oaktree High Income Fund - Class I | $67 | 1.35% |
|---|
|
| Expenses Paid, Amount |
$ 67
|
| Expense Ratio, Percent |
1.35%
|
| Line Graph [Table Text Block] |
 Table Summary | Class I - $161,430 | Bloomberg U.S. Aggregate Bond Index - $118,348 | ICE BofAML Non-Financial Developed HY Constrained Index - $170,951 | S&P UBS Leveraged Loan Index - $172,296 |
|---|
3/31/2016 | $100,000 | $100,000 | $100,000 | $100,000 |
|---|
9/30/2016 | $108,048 | $102,682 | $110,241 | $106,049 |
|---|
3/31/2017 | $112,551 | $100,441 | $114,201 | $109,742 |
|---|
9/30/2017 | $115,727 | $102,757 | $121,074 | $111,734 |
|---|
3/31/2018 | $116,008 | $101,649 | $121,512 | $114,832 |
|---|
9/30/2018 | $118,296 | $101,507 | $123,608 | $117,968 |
|---|
3/31/2019 | $119,999 | $106,203 | $125,421 | $118,653 |
|---|
9/30/2019 | $124,031 | $111,959 | $129,021 | $121,641 |
|---|
3/31/2020 | $109,559 | $115,691 | $114,304 | $107,369 |
|---|
9/30/2020 | $124,008 | $119,779 | $132,749 | $122,656 |
|---|
3/31/2021 | $131,395 | $116,513 | $142,822 | $129,669 |
|---|
9/30/2021 | $134,614 | $118,706 | $147,042 | $133,033 |
|---|
3/31/2022 | $131,820 | $111,675 | $139,933 | $133,847 |
|---|
9/30/2022 | $121,107 | $101,376 | $120,986 | $129,543 |
|---|
3/31/2023 | $130,369 | $106,333 | $133,631 | $136,688 |
|---|
9/30/2023 | $133,935 | $102,029 | $135,983 | $145,701 |
|---|
3/31/2024 | $144,179 | $108,139 | $147,948 | $153,640 |
|---|
9/30/2024 | $151,555 | $113,832 | $158,156 | $159,764 |
|---|
3/31/2025 | $153,110 | $113,416 | $158,921 | $164,421 |
|---|
9/30/2025 | $161,154 | $117,115 | $170,999 | $171,086 |
|---|
3/31/2026 | $161,430 | $118,348 | $170,951 | $172,296 |
|---|
|
| Average Annual Return [Table Text Block] |
AVERAGE ANNUAL TOTAL RETURNSTable Summary RiverNorth/Oaktree High Income Fund | 6 months | 1 Year | 5 Year | 10 Year |
|---|
Class I | 0.17% | 5.43% | 4.20% | 4.91% |
|---|
Bloomberg U.S. Aggregate Bond Index | 1.05% | 4.35% | 0.31% | 1.70% |
|---|
ICE BofAML Non-Financial Developed HY Constrained Index | -0.03% | 7.57% | 3.66% | 5.51% |
|---|
S&P UBS Leveraged Loan Index | 0.71% | 4.79% | 5.85% | 5.59% |
|---|
|
| Holdings Count | Holding |
379
|
| Advisory Fees Paid, Amount |
$ 287,893
|
| InvestmentCompanyPortfolioTurnover |
38.00%
|
| Additional Fund Statistics [Text Block] |
- Total Net Assets$57,112,378
- # of Portfolio Holdings379
- Portfolio Turnover Rate (Class I)38%
- Advisory Fees Paid$287,893
|
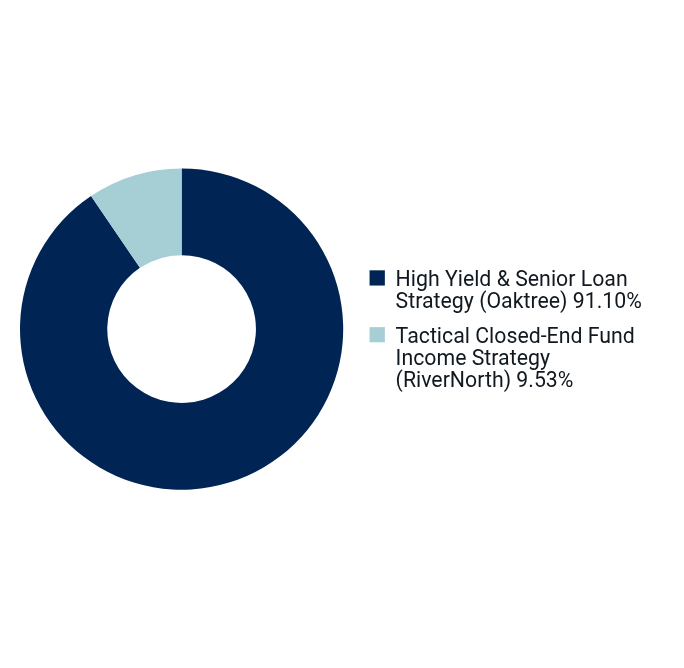
| Holdings [Text Block] |
(percentages are based on total investments) Table SummaryValue | Value |
|---|
High Yield & Senior Loan Strategy (Oaktree) | 91.10% | Tactical Closed-End Fund Income Strategy (RiverNorth) | 9.53% | (percentages are based on net assets) Table SummaryValue | Value |
|---|
High Yield | 58.93% | Developed Foreign | 26.25% | Cash | 5.28% | BDCs | 3.03% | Investment Co. Bonds | 3.01% | Investment Grade | 1.31% | Convertibles | 1.22% | Other | 0.22% | Equity | 0.20% | Bank Loans | 0.18% | SPACs | 0.07% | Preferreds | 0.02% | Muni/BAB | 0.01% | EM Debt | 0.01% | Agency MBS | 0.01% | |
| Material Fund Change [Text Block] |
There have been no material Fund changes during the reporting period. |
| C000119955 |
|
| Shareholder Report [Line Items] |
|
| Fund Name |
RIVERNORTH/OAKTREE HIGH INCOME FUND
|
| Class Name |
CLASS R
|
| Trading Symbol |
RNOTX
|
| Annual or Semi-Annual Statement [Text Block] |
Semi-Annual Shareholder Report
|
| Shareholder Report Annual or Semi-Annual |
semi-annual shareholder report
|
| Additional Information [Text Block] |
You can find additional information about the Fund at https://www.rivernorth.com/investments/rnhix-rnotx/. You can also request this information by contacting us at 888.848.7569.
|
| Additional Information Phone Number |
888.848.7569
|
| Additional Information Website |
https://www.rivernorth.com/investments/rnhix-rnotx/
|
| Expenses [Text Block] |
WHAT WERE THE FUND'S COSTS FOR THE LAST SIX MONTHS? (based on a hypothetical $10,000 investment) Table SummaryCLASS NAME | COST OF A $10,000 INVESTMENT | COSTS PAID AS A PERCENTAGE OF A $10,000 INVESTMENT |
|---|
RiverNorth/Oaktree High Income Fund - Class R | $80 | 1.60% |
|---|
|
| Expenses Paid, Amount |
$ 80
|
| Expense Ratio, Percent |
1.60%
|
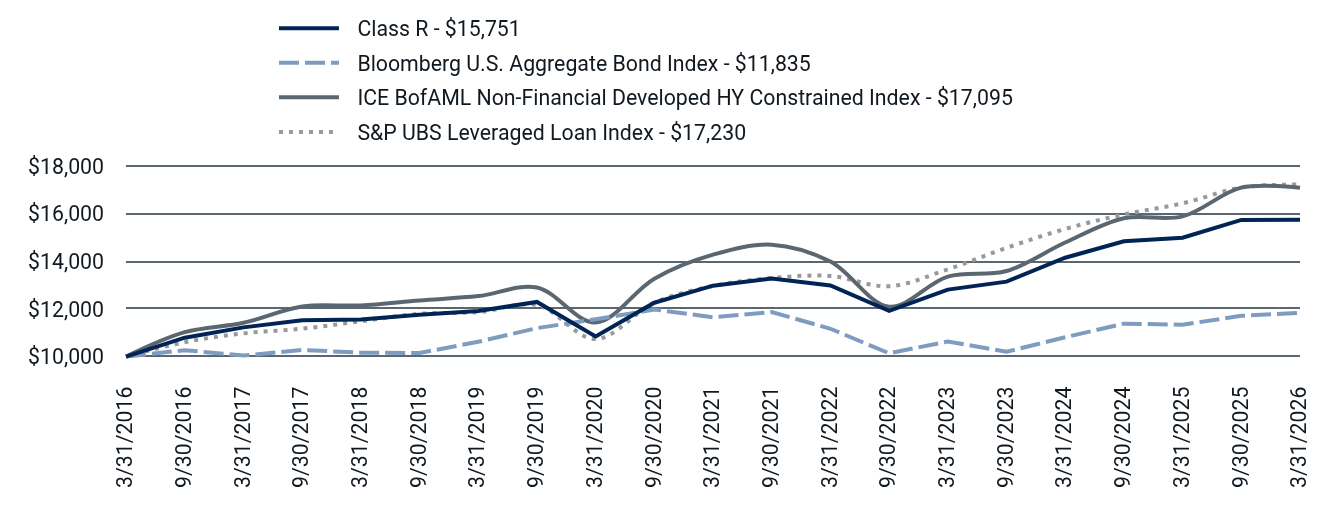
| Line Graph [Table Text Block] |
Table Summary | Class R - $15,751 | Bloomberg U.S. Aggregate Bond Index - $11,835 | ICE BofAML Non-Financial Developed HY Constrained Index - $17,095 | S&P UBS Leveraged Loan Index - $17,230 |
|---|
3/31/2016 | $10,000 | $10,000 | $10,000 | $10,000 |
|---|
9/30/2016 | $10,793 | $10,268 | $11,024 | $10,605 |
|---|
3/31/2017 | $11,227 | $10,044 | $11,420 | $10,974 |
|---|
9/30/2017 | $11,531 | $10,276 | $12,107 | $11,173 |
|---|
3/31/2018 | $11,556 | $10,165 | $12,151 | $11,483 |
|---|
9/30/2018 | $11,757 | $10,151 | $12,361 | $11,797 |
|---|
3/31/2019 | $11,912 | $10,620 | $12,542 | $11,865 |
|---|
9/30/2019 | $12,297 | $11,196 | $12,902 | $12,164 |
|---|
3/31/2020 | $10,847 | $11,569 | $11,430 | $10,737 |
|---|
9/30/2020 | $12,264 | $11,978 | $13,275 | $12,266 |
|---|
3/31/2021 | $12,979 | $11,651 | $14,282 | $12,967 |
|---|
9/30/2021 | $13,283 | $11,871 | $14,704 | $13,303 |
|---|
3/31/2022 | $12,990 | $11,168 | $13,993 | $13,385 |
|---|
9/30/2022 | $11,919 | $10,138 | $12,099 | $12,954 |
|---|
3/31/2023 | $12,815 | $10,633 | $13,363 | $13,669 |
|---|
9/30/2023 | $13,150 | $10,203 | $13,598 | $14,570 |
|---|
3/31/2024 | $14,155 | $10,814 | $14,795 | $15,364 |
|---|
9/30/2024 | $14,844 | $11,383 | $15,816 | $15,976 |
|---|
3/31/2025 | $14,994 | $11,342 | $15,892 | $16,442 |
|---|
9/30/2025 | $15,744 | $11,711 | $17,100 | $17,109 |
|---|
3/31/2026 | $15,751 | $11,835 | $17,095 | $17,230 |
|---|
|
| Average Annual Return [Table Text Block] |
AVERAGE ANNUAL TOTAL RETURNSTable Summary RiverNorth/Oaktree High Income Fund | 6 months | 1 Year | 5 Year | 10 Year |
|---|
Class R | -0.07% | 5.04% | 3.95% | 4.65% |
|---|
Bloomberg U.S. Aggregate Bond Index | 1.05% | 4.35% | 0.31% | 1.70% |
|---|
ICE BofAML Non-Financial Developed HY Constrained Index | -0.03% | 7.57% | 3.66% | 5.51% |
|---|
S&P UBS Leveraged Loan Index | 0.71% | 4.79% | 5.85% | 5.59% |
|---|
|
| Holdings Count | Holding |
379
|
| Advisory Fees Paid, Amount |
$ 287,893
|
| InvestmentCompanyPortfolioTurnover |
38.00%
|
| Additional Fund Statistics [Text Block] |
- Total Net Assets$57,112,378
- # of Portfolio Holdings379
- Portfolio Turnover Rate (Class R)38%
- Advisory Fees Paid$287,893
|
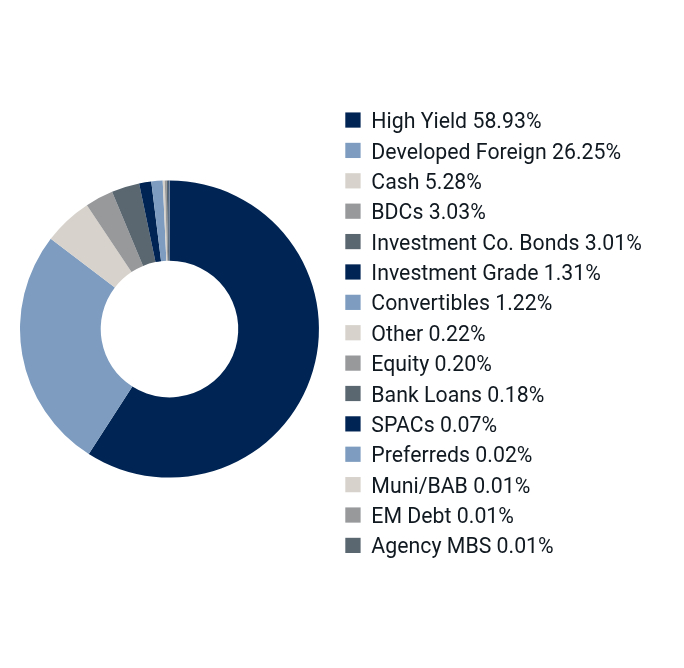
| Holdings [Text Block] |
(percentages are based on total investments) Table SummaryValue | Value |
|---|
High Yield & Senior Loan Strategy (Oaktree) | 91.10% | Tactical Closed-End Fund Income Strategy (RiverNorth) | 9.53% | (percentages are based on net assets) Table SummaryValue | Value |
|---|
High Yield | 58.93% | Developed Foreign | 26.25% | Cash | 5.28% | BDCs | 3.03% | Investment Co. Bonds | 3.01% | Investment Grade | 1.31% | Convertibles | 1.22% | Other | 0.22% | Equity | 0.20% | Bank Loans | 0.18% | SPACs | 0.07% | Preferreds | 0.02% | Muni/BAB | 0.01% | EM Debt | 0.01% | Agency MBS | 0.01% | |
| Material Fund Change [Text Block] |
There have been no material Fund changes during the reporting period. |