Shareholder Report
|
12 Months Ended |
|
Mar. 31, 2026
USD ($)
Holding
|
|---|
| Shareholder Report [Line Items] |
|
| Document Type |
N-CSR
|
| Amendment Flag |
false
|
| Registrant Name |
Rydex Series Funds
|
| Entity Central Index Key |
0000899148
|
| Entity Investment Company Type |
N-1A
|
| Document Period End Date |
Mar. 31, 2026
|
| C000010303 |
|
| Shareholder Report [Line Items] |
|
| Fund Name |
Banking Fund
|
| Class Name |
Investor Class
|
| Trading Symbol |
RYKIX
|
| Annual or Semi-Annual Statement [Text Block] |
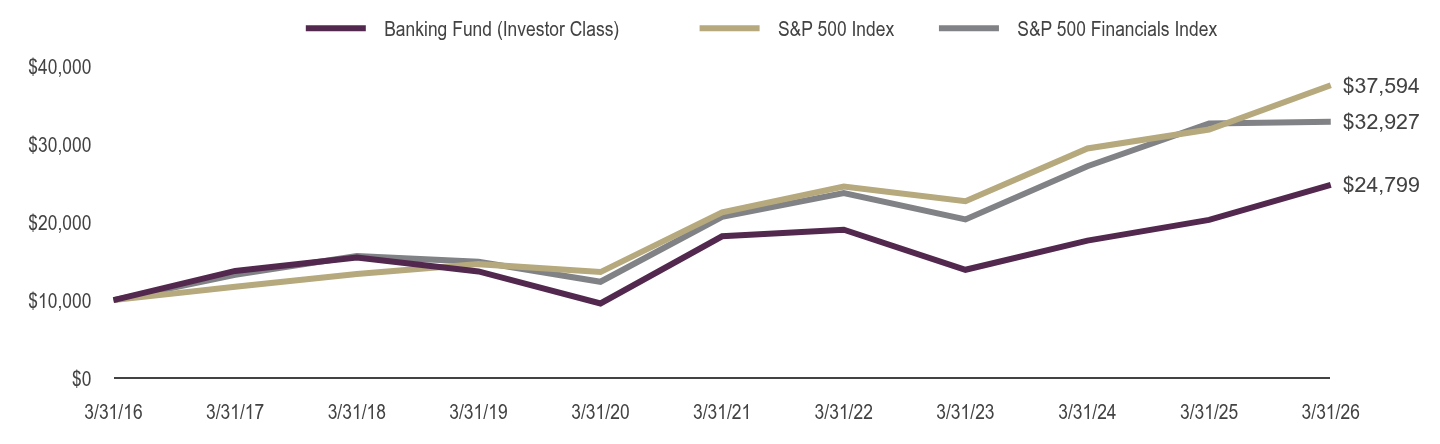
This annual shareholder report contains important information about the Banking Fund for the period from April 1, 2025 to March 31, 2026.
|
| Shareholder Report Annual or Semi-Annual |
Annual Shareholder Report
|
| Additional Information [Text Block] |
You can find additional information about the fund at GuggenheimInvestments.com/mutual-funds/literature. You can also request this information by contacting 800 820 0888 or services@guggenheiminvestments.com.
|
| Additional Information Phone Number |
800 820 0888
|
| Additional Information Email |
<span style="box-sizing: border-box; color: rgb(67, 67, 67); display: inline; flex-wrap: nowrap; font-size: 10.6667px; font-weight: 400; grid-area: auto; line-height: 12.8px; margin: 0px; overflow: visible; text-align: left; text-align-last: auto; white-space-collapse: preserve-breaks;">services@guggenheiminvestments.com</span>
|
| Additional Information Website |
<span style="box-sizing: border-box; color: rgb(67, 67, 67); display: inline; flex-wrap: nowrap; font-size: 10.6667px; font-weight: 400; grid-area: auto; line-height: 12.8px; margin: 0px; overflow: visible; text-align: left; text-align-last: auto; white-space-collapse: preserve-breaks;">GuggenheimInvestments.com/mutual-funds/literature</span>
|
| Expenses [Text Block] |
What were the Fund's costs for the last year? * Based on a hypothetical $10,000 investment Table SummaryClass | Costs of a $10,000 Investment | Costs Paid as a % of a $10,000 Investment |
|---|
Investor Class | $158 | 1.42% |
|---|
Table Summary* | Excludes expenses of the underlying funds in which the fund invests, if any. |
|---|
|
| Expenses Paid, Amount |
$ 158
|
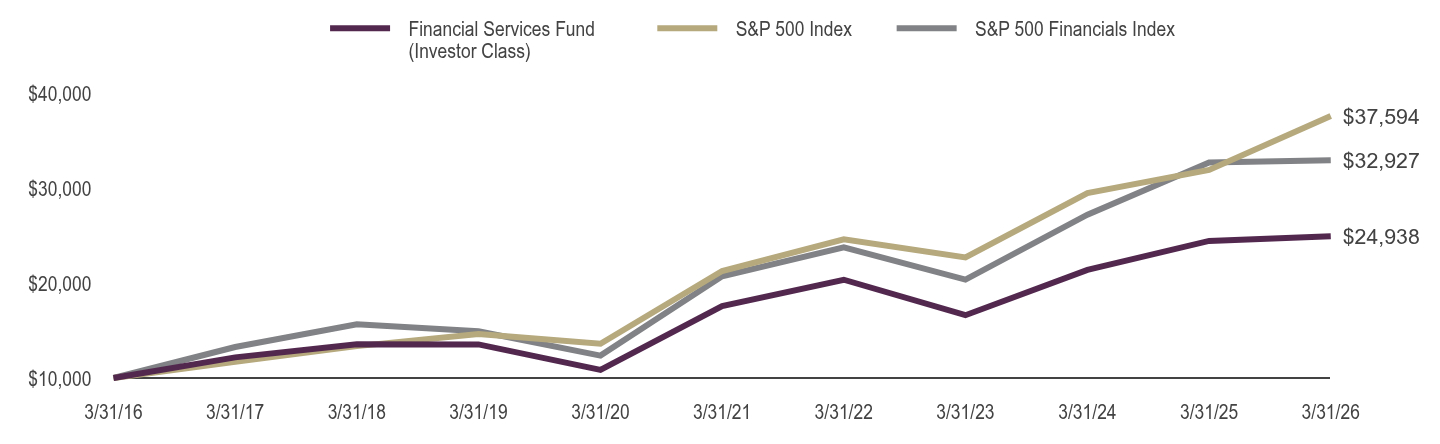
| Factors Affecting Performance [Text Block] |
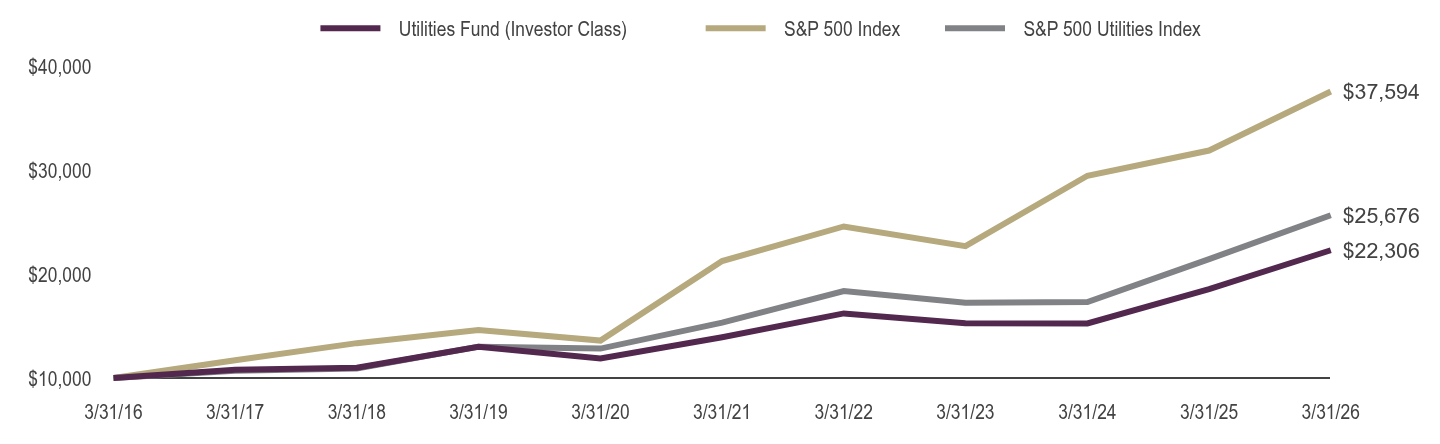
What factors materially affected the Fund's performance over the last year? The industries that contributed the most to performance were diversified banks, regional banks, and asset management & custody banks. No industry detracted from performance. The holdings that contributed the most to performance were Citigroup, Inc., Nu Holdings, Ltd.—Class A, and Bank of New York Mellon Corp. Those that detracted the most were Pinnacle Financial Partners, Inc., ICICI Bank Limited Sponsored ADR, and HDFC Bank Limited Sponsored ADR. |
| Line Graph [Table Text Block] |
Table Summary | Banking Fund (Investor Class) | S&P 500 Index | S&P 500 Financials Index |
|---|
3/31/16 | $10,000 | $10,000 | $10,000 |
|---|
3/31/17 | $13,753 | $11,717 | $13,261 |
|---|
3/31/18 | $15,490 | $13,357 | $15,652 |
|---|
3/31/19 | $13,689 | $14,625 | $14,920 |
|---|
3/31/20 | $9,577 | $13,605 | $12,362 |
|---|
3/31/21 | $18,201 | $21,271 | $20,706 |
|---|
3/31/22 | $19,043 | $24,599 | $23,749 |
|---|
3/31/23 | $13,898 | $22,698 | $20,368 |
|---|
3/31/24 | $17,649 | $29,480 | $27,200 |
|---|
3/31/25 | $20,307 | $31,913 | $32,691 |
|---|
3/31/26 | $24,799 | $37,594 | $32,927 |
|---|
|
| Average Annual Return [Table Text Block] |
Table SummaryAverage Annual Total Returns | One Year | Five Years | Ten Years |
|---|
Investor Class | 22.12% | 6.38% | 9.51% |
|---|
S&P 500 Index | 17.80% | 12.06% | 14.16% |
|---|
S&P 500 Financials Index | 0.72% | 9.72% | 12.66% |
|---|
|
| AssetsNet |
$ 7,045,507
|
| Holdings Count | Holding |
76
|
| Advisory Fees Paid, Amount |
$ 108,218
|
| InvestmentCompanyPortfolioTurnover |
179.00%
|
| Additional Fund Statistics [Text Block] |
Fund Statistics as of March 31, 2026 - Net Assets$7,045,507
- Total Number of Portfolio Holdings76
- Portfolio Turnover Rate179%
- Total Advisory Fees Paid$108,218
|
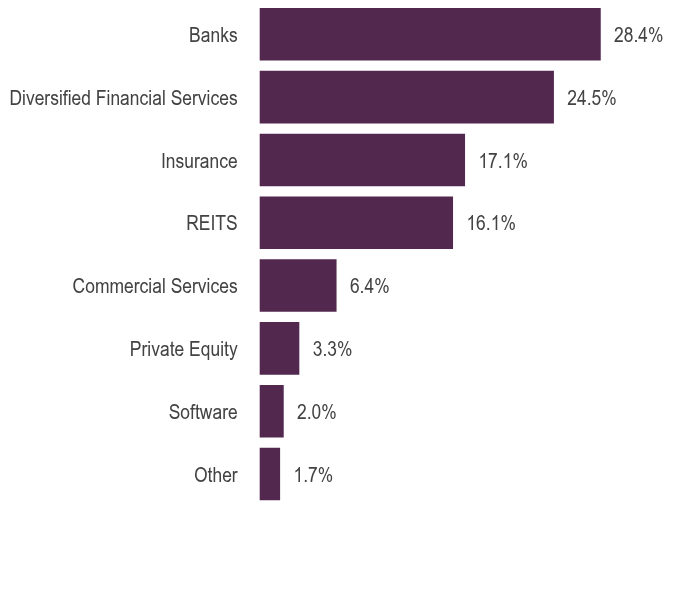
| Holdings [Text Block] |
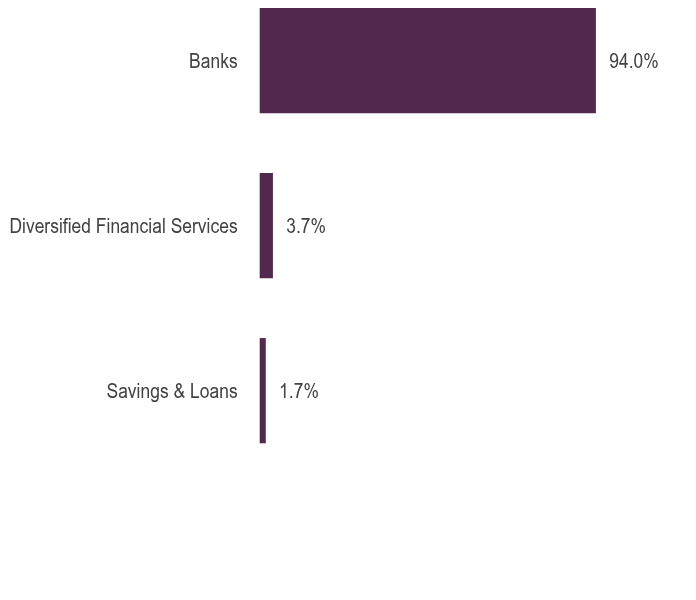
Holdings DiversificationFootnote Reference1 (% of Net Assets) as of March 31, 2026 Table SummaryValue | Value |
|---|
Savings & Loans | 1.7% | Diversified Financial Services | 3.7% | Banks | 94.0% | |
| Largest Holdings [Text Block] |
10 Largest HoldingsFootnote Reference2 (% of Net Assets) as of March 31, 2026 Table SummaryCitigroup, Inc. | 4.1% |
|---|
Wells Fargo & Co. | 4.1% |
|---|
JPMorgan Chase & Co. | 4.0% |
|---|
Bank of America Corp. | 4.0% |
|---|
Capital One Financial Corp. | 3.8% |
|---|
PNC Financial Services Group, Inc. | 3.2% |
|---|
U.S. Bancorp | 3.1% |
|---|
Bank of New York Mellon Corp. | 3.1% |
|---|
Truist Financial Corp. | 2.7% |
|---|
NU Holdings Limited/Cayman Islands — Class A | 2.6% |
|---|
Total | 34.7% |
|---|
|
| Material Fund Change [Text Block] |
|
| C000010305 |
|
| Shareholder Report [Line Items] |
|
| Fund Name |
Banking Fund
|
| Class Name |
Class A
|
| Trading Symbol |
RYBKX
|
| Annual or Semi-Annual Statement [Text Block] |
This annual shareholder report contains important information about the Banking Fund for the period from April 1, 2025 to March 31, 2026.
|
| Shareholder Report Annual or Semi-Annual |
Annual Shareholder Report
|
| Additional Information [Text Block] |
You can find additional information about the fund at GuggenheimInvestments.com/mutual-funds/literature. You can also request this information by contacting 800 820 0888 or services@guggenheiminvestments.com.
|
| Additional Information Phone Number |
800 820 0888
|
| Additional Information Email |
<span style="box-sizing: border-box; color: rgb(67, 67, 67); display: inline; flex-wrap: nowrap; font-size: 10.6667px; font-weight: 400; grid-area: auto; line-height: 12.8px; margin: 0px; overflow: visible; text-align: left; text-align-last: auto; white-space-collapse: preserve-breaks;">services@guggenheiminvestments.com</span>
|
| Additional Information Website |
<span style="box-sizing: border-box; color: rgb(67, 67, 67); display: inline; flex-wrap: nowrap; font-size: 10.6667px; font-weight: 400; grid-area: auto; line-height: 12.8px; margin: 0px; overflow: visible; text-align: left; text-align-last: auto; white-space-collapse: preserve-breaks;">GuggenheimInvestments.com/mutual-funds/literature</span>
|
| Expenses [Text Block] |
What were the Fund's costs for the last year? * Based on a hypothetical $10,000 investment Table SummaryClass | Costs of a $10,000 Investment | Costs Paid as a % of a $10,000 Investment |
|---|
Class A | $181 | 1.63% |
|---|
Table Summary* | Excludes expenses of the underlying funds in which the fund invests, if any. |
|---|
|
| Expenses Paid, Amount |
$ 181
|
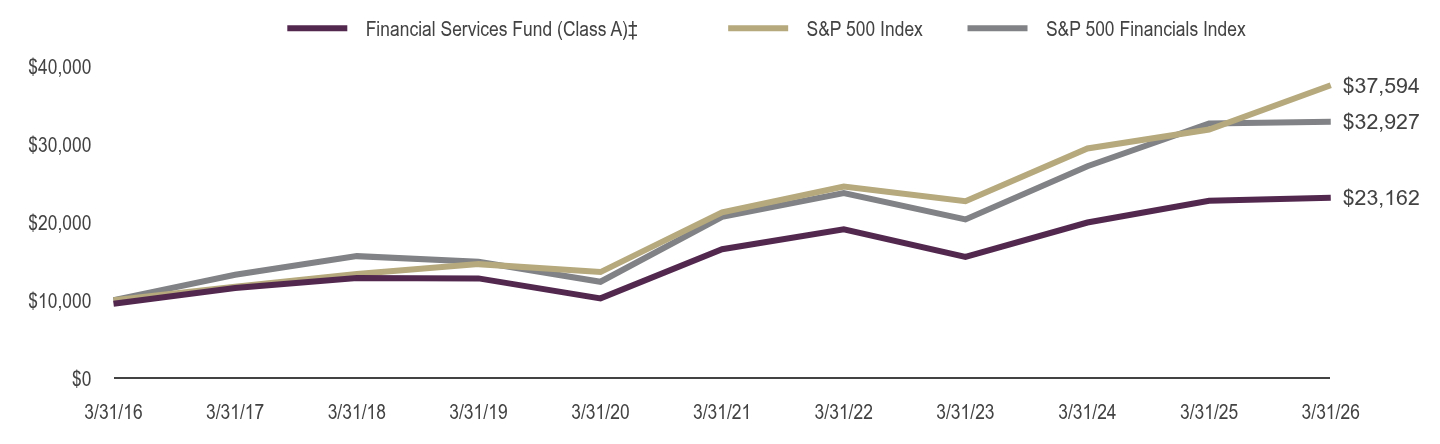
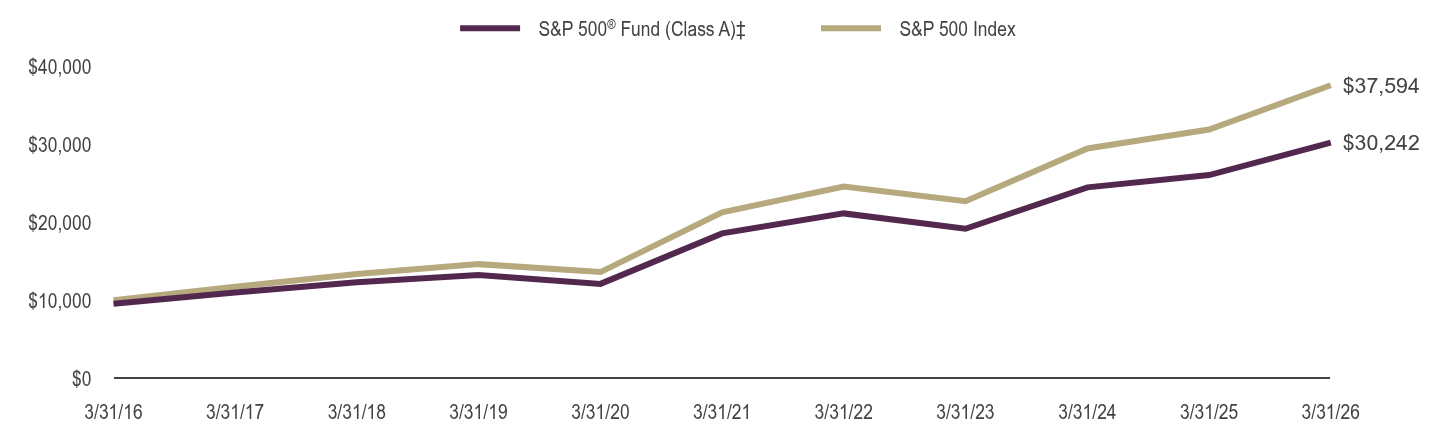
| Factors Affecting Performance [Text Block] |
What factors materially affected the Fund's performance over the last year? The industries that contributed the most to performance were diversified banks, regional banks, and asset management & custody banks. No industry detracted from performance. The holdings that contributed the most to performance were Citigroup, Inc., Nu Holdings, Ltd.—Class A, and Bank of New York Mellon Corp. Those that detracted the most were Pinnacle Financial Partners, Inc., ICICI Bank Limited Sponsored ADR, and HDFC Bank Limited Sponsored ADR. |
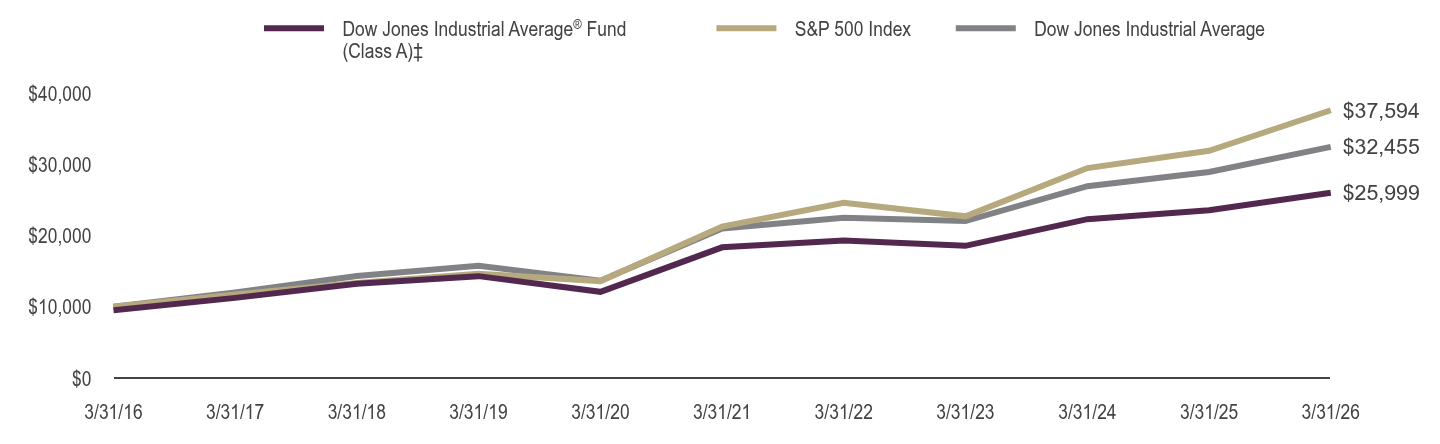
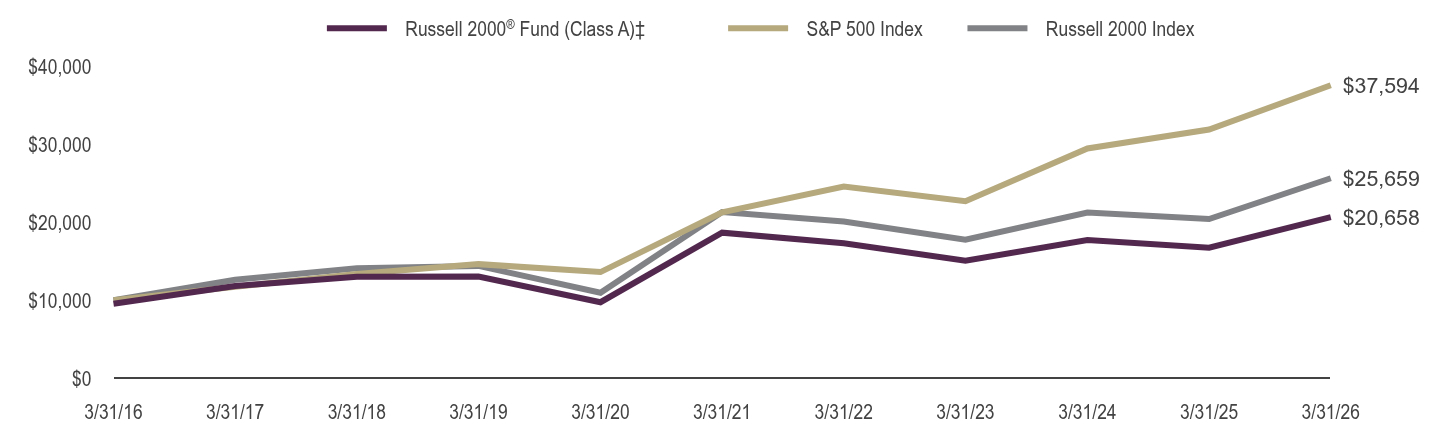
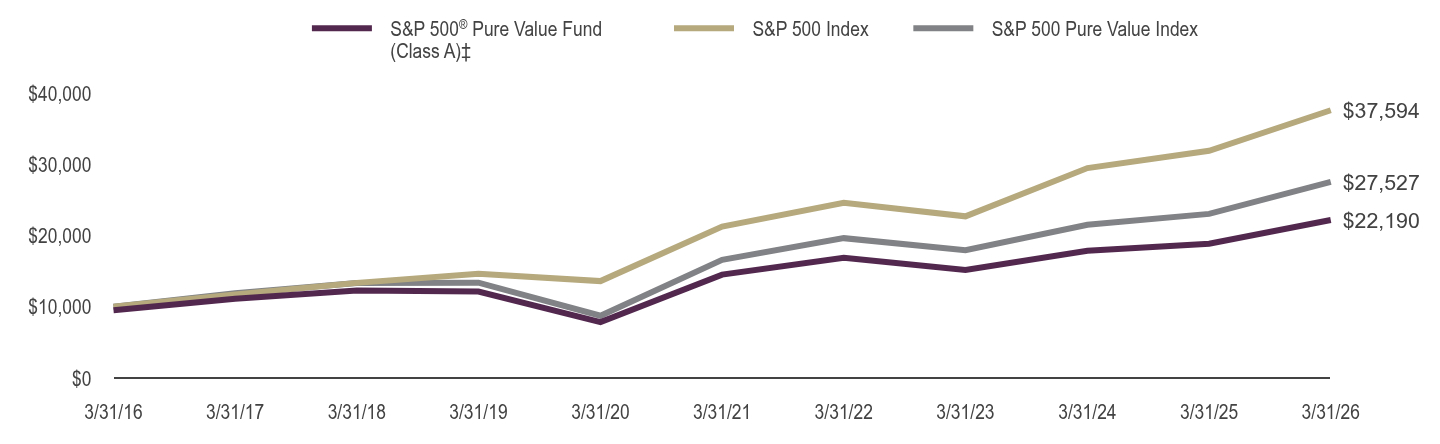
| Line Graph [Table Text Block] |
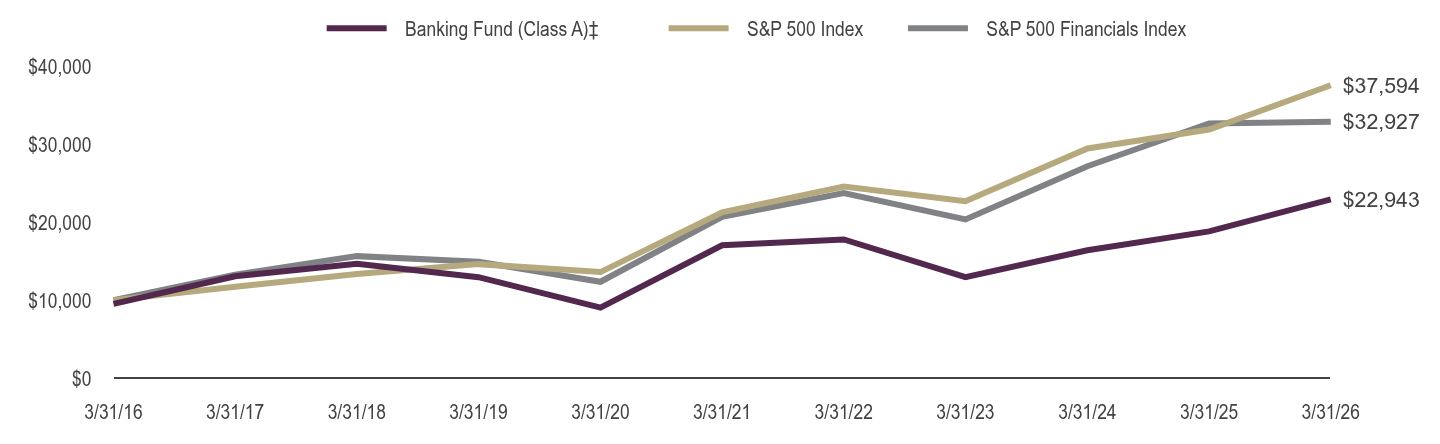
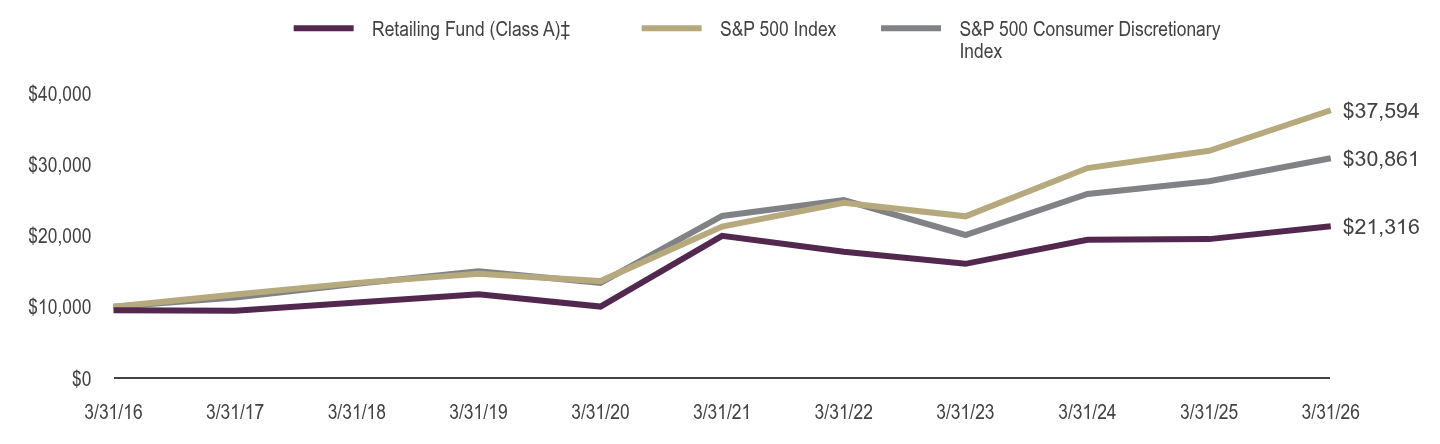
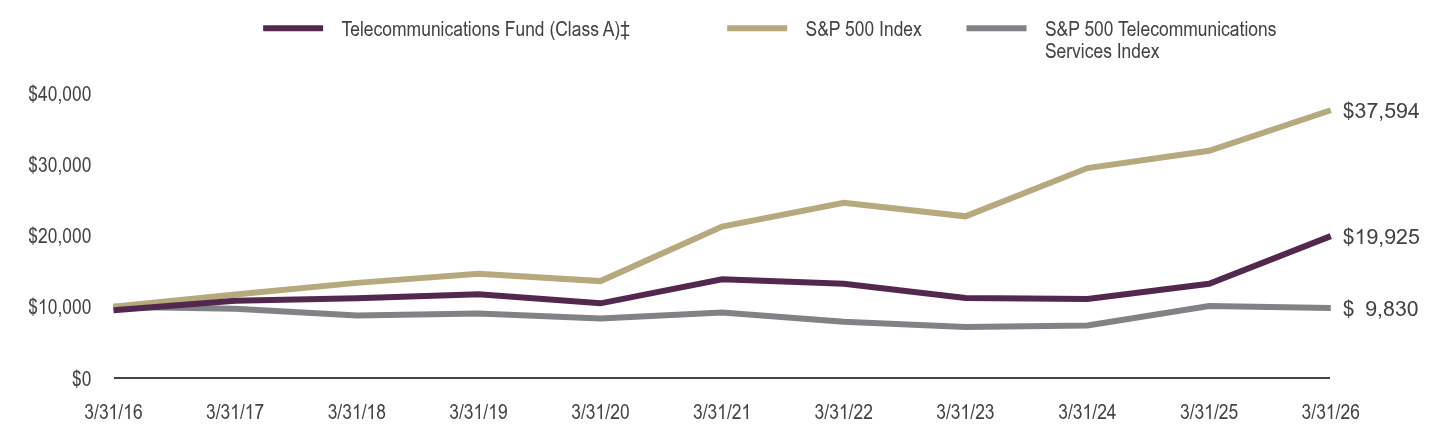
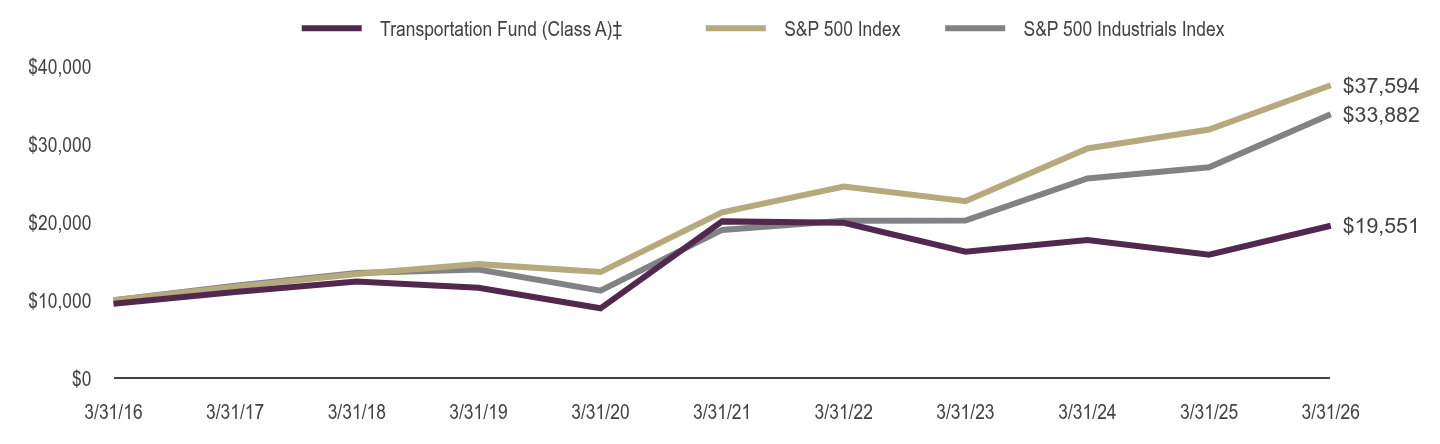
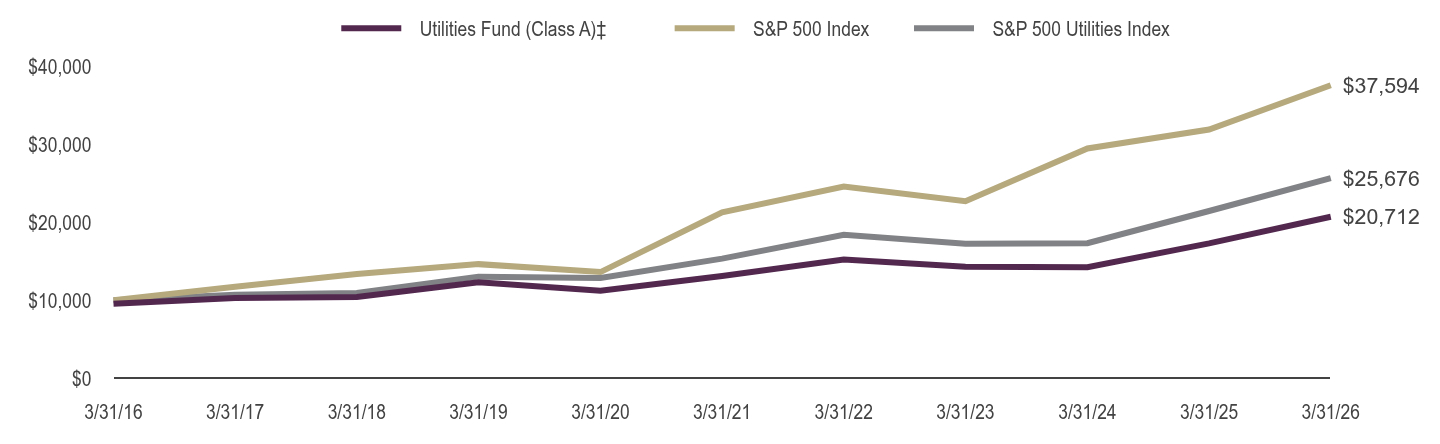
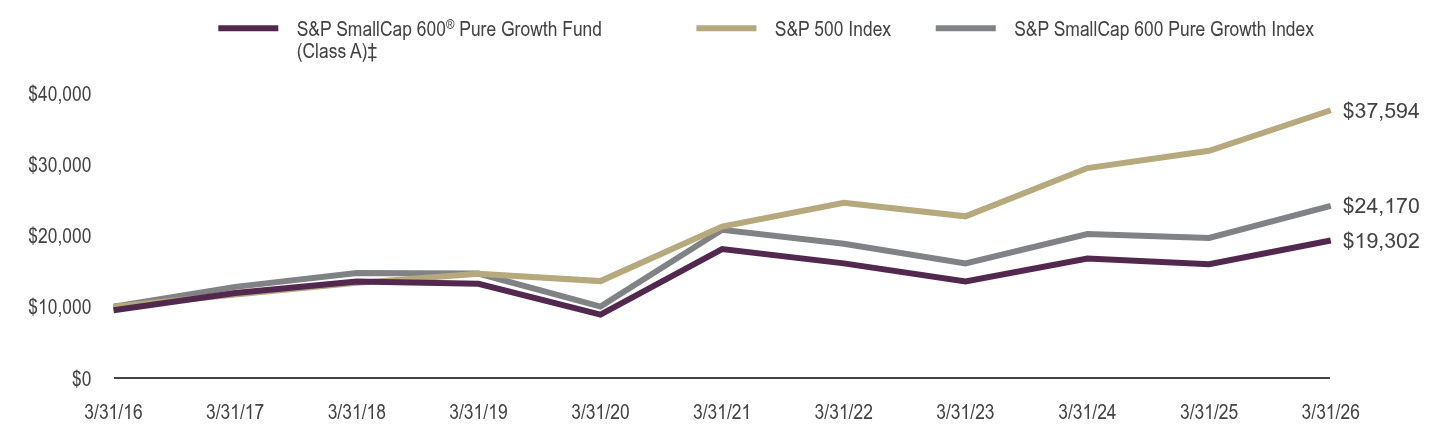
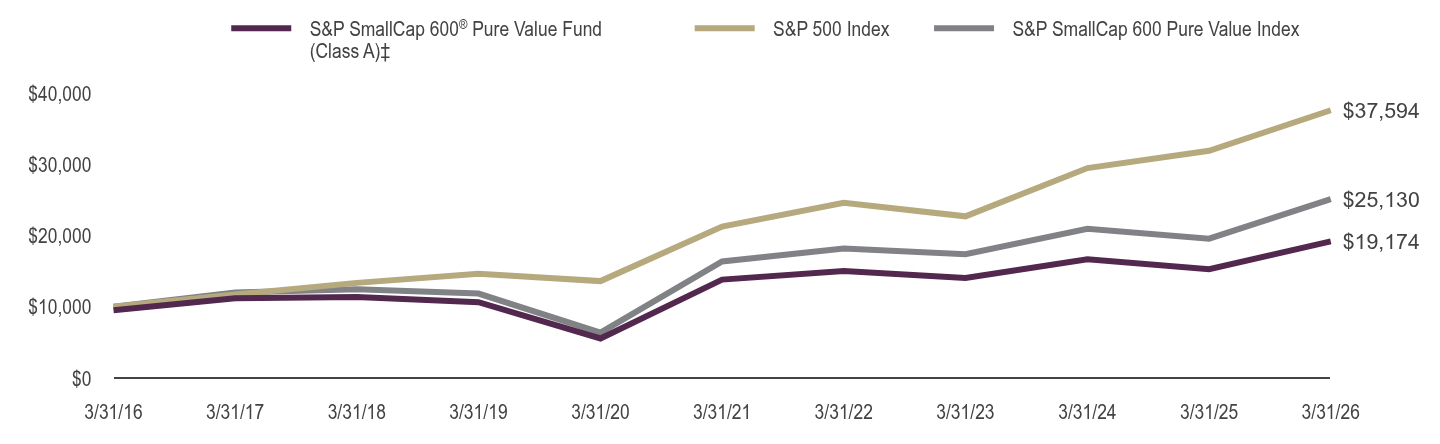
Table Summary | Banking Fund (Class A)‡ | S&P 500 Index | S&P 500 Financials Index |
|---|
3/31/16 | $9,525 | $10,000 | $10,000 |
|---|
3/31/17 | $13,070 | $11,717 | $13,261 |
|---|
3/31/18 | $14,687 | $13,357 | $15,652 |
|---|
3/31/19 | $12,946 | $14,625 | $14,920 |
|---|
3/31/20 | $9,033 | $13,605 | $12,362 |
|---|
3/31/21 | $17,047 | $21,271 | $20,706 |
|---|
3/31/22 | $17,791 | $24,599 | $23,749 |
|---|
3/31/23 | $12,955 | $22,698 | $20,368 |
|---|
3/31/24 | $16,409 | $29,480 | $27,200 |
|---|
3/31/25 | $18,831 | $31,913 | $32,691 |
|---|
3/31/26 | $22,943 | $37,594 | $32,927 |
|---|
|
| Average Annual Return [Table Text Block] |
Table SummaryAverage Annual Total Returns | One Year | Five Years | Ten Years |
|---|
Class A (without sales charge) | 21.84% | 6.12% | 9.19% |
|---|
Class A (with sales charge) ‡ | 16.05% | 5.09% | 8.66% |
|---|
S&P 500 Index | 17.80% | 12.06% | 14.16% |
|---|
S&P 500 Financials Index | 0.72% | 9.72% | 12.66% |
|---|
|
| AssetsNet |
$ 7,045,507
|
| Holdings Count | Holding |
76
|
| Advisory Fees Paid, Amount |
$ 108,218
|
| InvestmentCompanyPortfolioTurnover |
179.00%
|
| Additional Fund Statistics [Text Block] |
Fund Statistics as of March 31, 2026 - Net Assets$7,045,507
- Total Number of Portfolio Holdings76
- Portfolio Turnover Rate179%
- Total Advisory Fees Paid$108,218
|
| Holdings [Text Block] |
Holdings DiversificationFootnote Reference1 (% of Net Assets) as of March 31, 2026 Table SummaryValue | Value |
|---|
Savings & Loans | 1.7% | Diversified Financial Services | 3.7% | Banks | 94.0% | |
| Largest Holdings [Text Block] |
10 Largest HoldingsFootnote Reference2 (% of Net Assets) as of March 31, 2026 Table SummaryCitigroup, Inc. | 4.1% |
|---|
Wells Fargo & Co. | 4.1% |
|---|
JPMorgan Chase & Co. | 4.0% |
|---|
Bank of America Corp. | 4.0% |
|---|
Capital One Financial Corp. | 3.8% |
|---|
PNC Financial Services Group, Inc. | 3.2% |
|---|
U.S. Bancorp | 3.1% |
|---|
Bank of New York Mellon Corp. | 3.1% |
|---|
Truist Financial Corp. | 2.7% |
|---|
NU Holdings Limited/Cayman Islands — Class A | 2.6% |
|---|
Total | 34.7% |
|---|
|
| Material Fund Change [Text Block] |
|
| C000010306 |
|
| Shareholder Report [Line Items] |
|
| Fund Name |
Banking Fund
|
| Class Name |
Class C
|
| Trading Symbol |
RYKCX
|
| Annual or Semi-Annual Statement [Text Block] |
This annual shareholder report contains important information about the Banking Fund for the period from April 1, 2025 to March 31, 2026.
|
| Shareholder Report Annual or Semi-Annual |
Annual Shareholder Report
|
| Additional Information [Text Block] |
You can find additional information about the fund at GuggenheimInvestments.com/mutual-funds/literature. You can also request this information by contacting 800 820 0888 or services@guggenheiminvestments.com.
|
| Additional Information Phone Number |
800 820 0888
|
| Additional Information Email |
<span style="box-sizing: border-box; color: rgb(67, 67, 67); display: inline; flex-wrap: nowrap; font-size: 10.6667px; font-weight: 400; grid-area: auto; line-height: 12.8px; margin: 0px; overflow: visible; text-align: left; text-align-last: auto; white-space-collapse: preserve-breaks;">services@guggenheiminvestments.com</span>
|
| Additional Information Website |
<span style="box-sizing: border-box; color: rgb(67, 67, 67); display: inline; flex-wrap: nowrap; font-size: 10.6667px; font-weight: 400; grid-area: auto; line-height: 12.8px; margin: 0px; overflow: visible; text-align: left; text-align-last: auto; white-space-collapse: preserve-breaks;">GuggenheimInvestments.com/mutual-funds/literature</span>
|
| Expenses [Text Block] |
What were the Fund's costs for the last year? * Based on a hypothetical $10,000 investment Table SummaryClass | Costs of a $10,000 Investment | Costs Paid as a % of a $10,000 Investment |
|---|
Class C | $265 | 2.40% |
|---|
Table Summary* | Excludes expenses of the underlying funds in which the fund invests, if any. |
|---|
|
| Expenses Paid, Amount |
$ 265
|
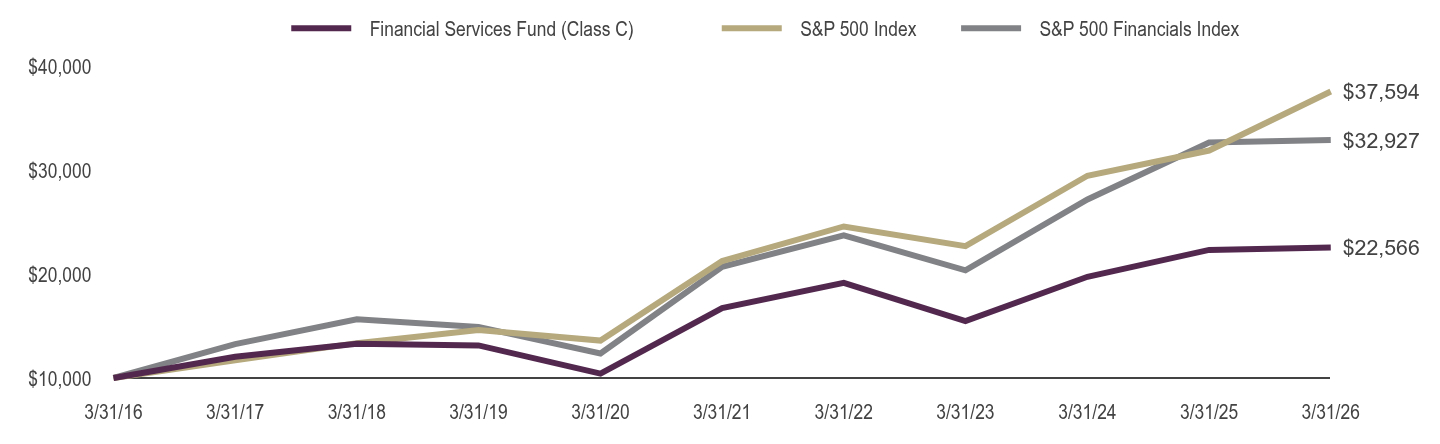
| Factors Affecting Performance [Text Block] |
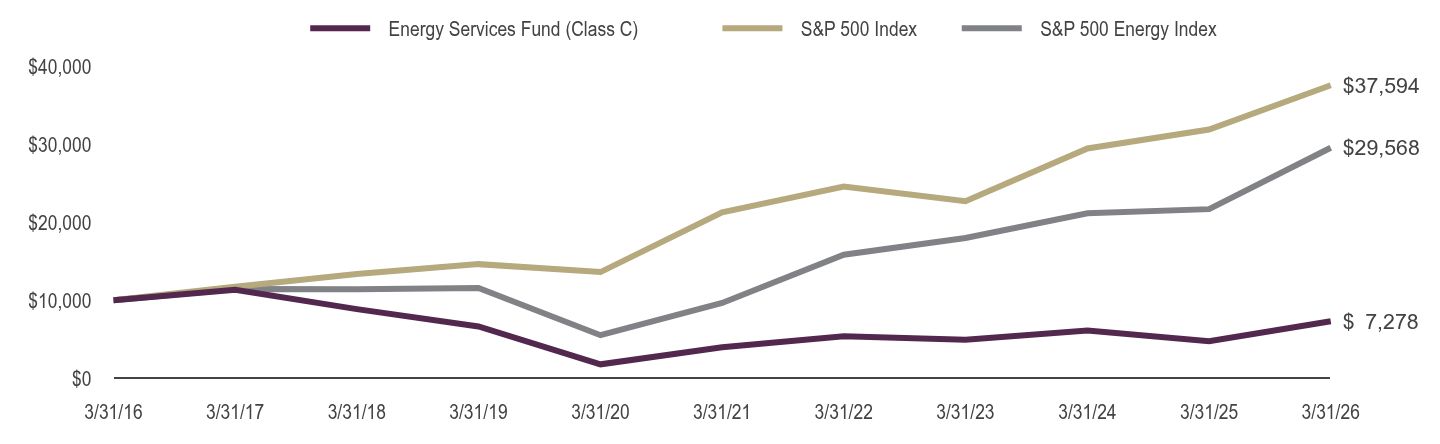
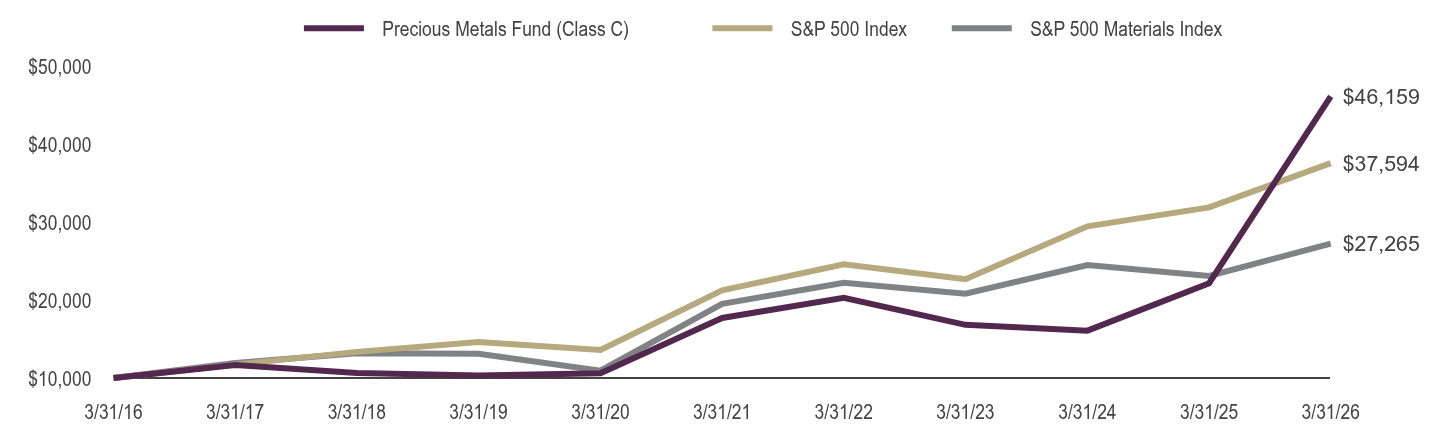
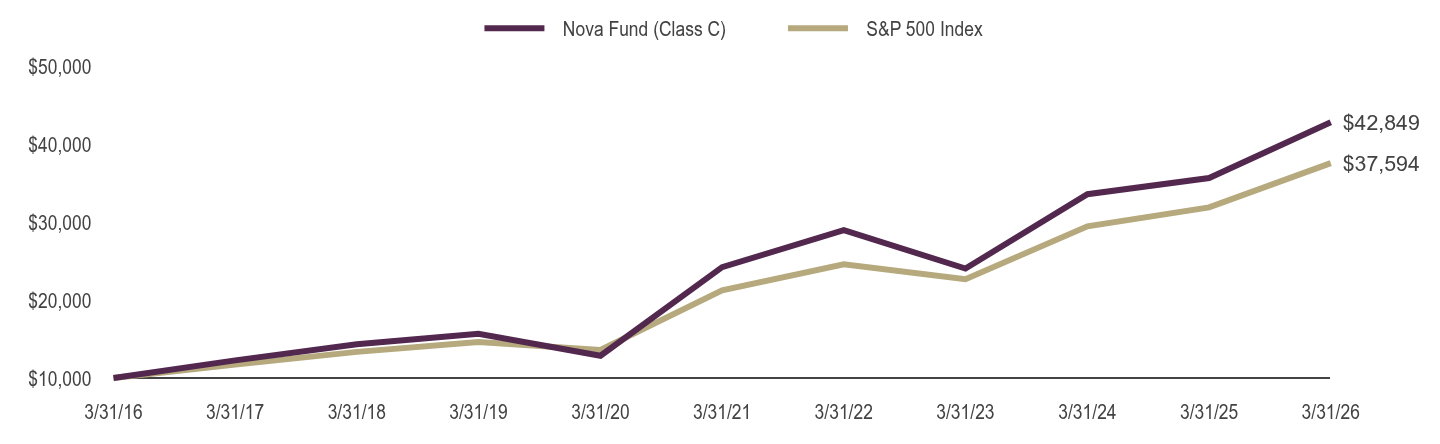
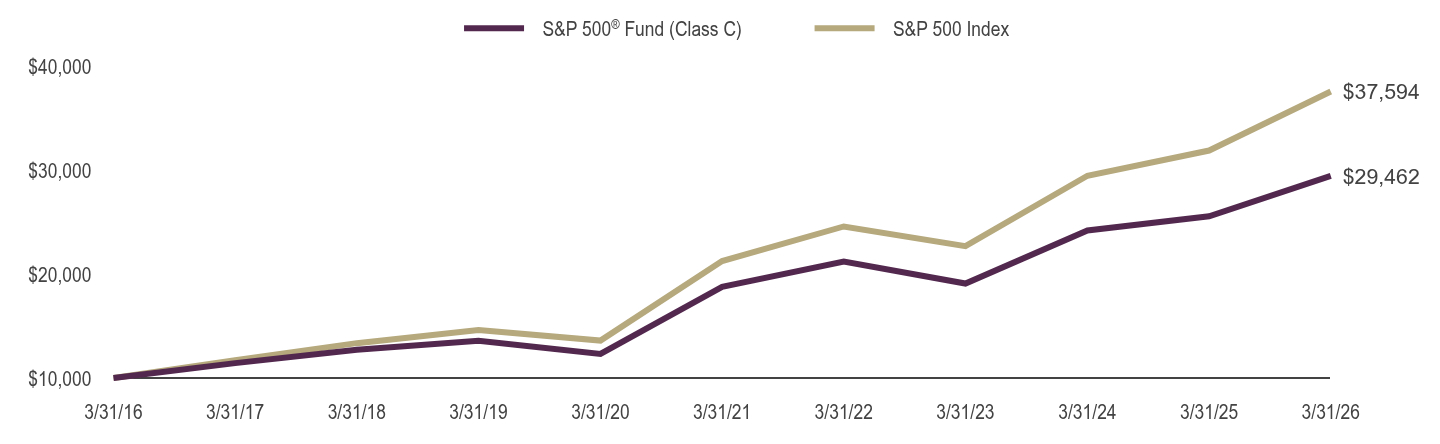
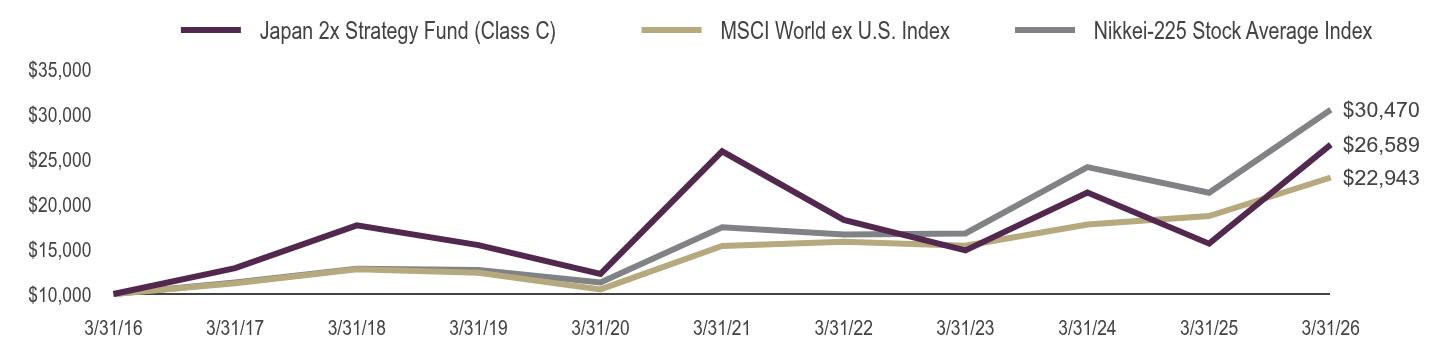
What factors materially affected the Fund's performance over the last year? The industries that contributed the most to performance were diversified banks, regional banks, and asset management & custody banks. No industry detracted from performance. The holdings that contributed the most to performance were Citigroup, Inc., Nu Holdings, Ltd.—Class A, and Bank of New York Mellon Corp. Those that detracted the most were Pinnacle Financial Partners, Inc., ICICI Bank Limited Sponsored ADR, and HDFC Bank Limited Sponsored ADR. |
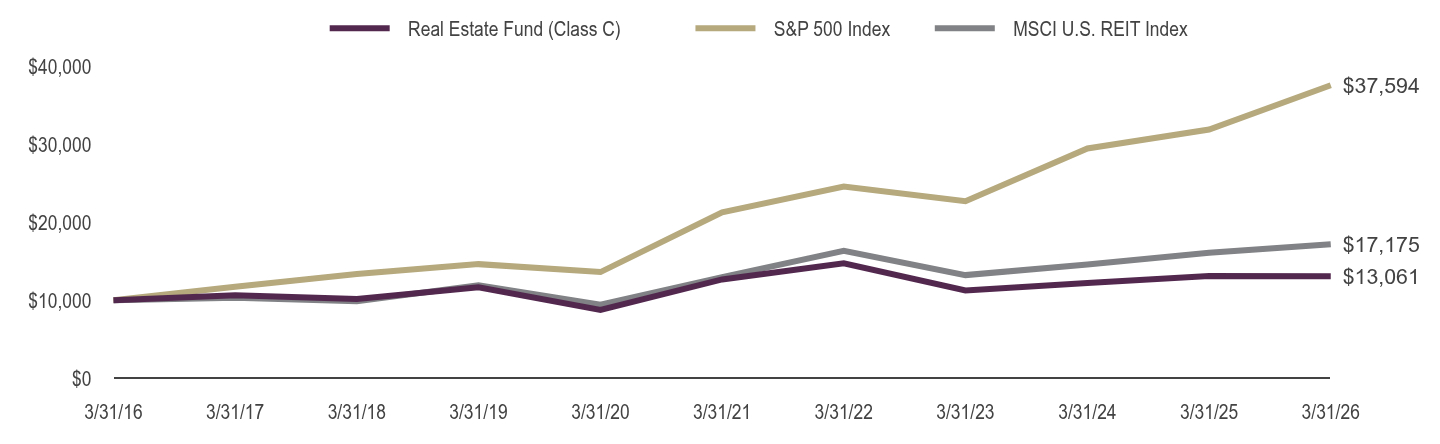
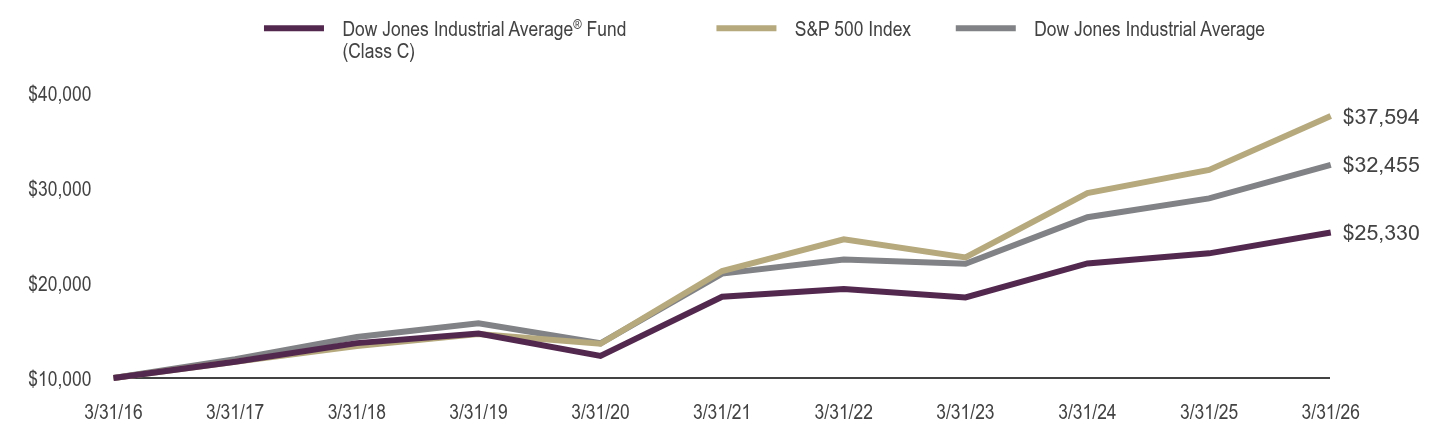
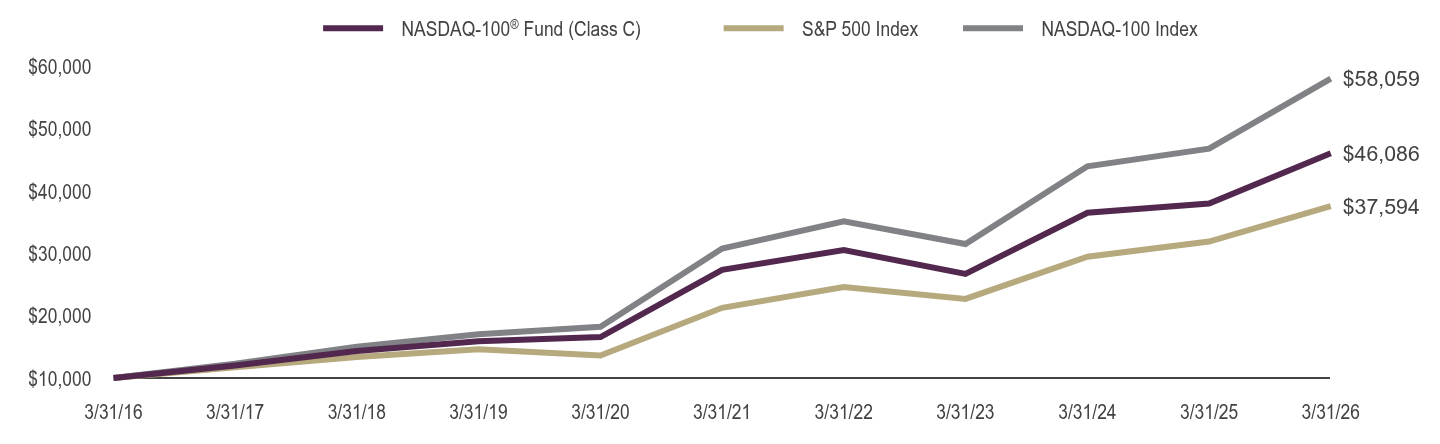
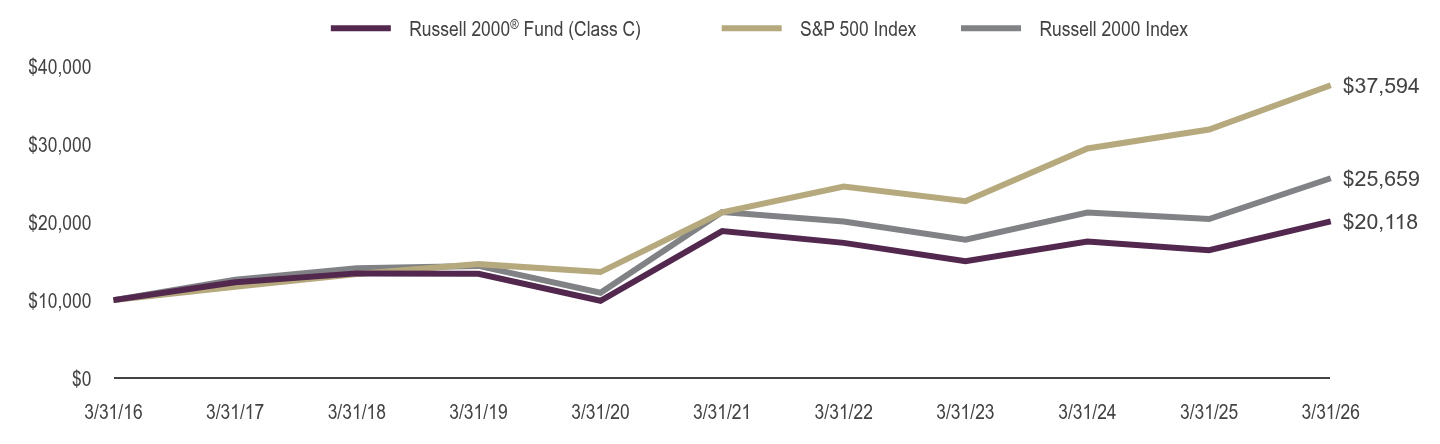
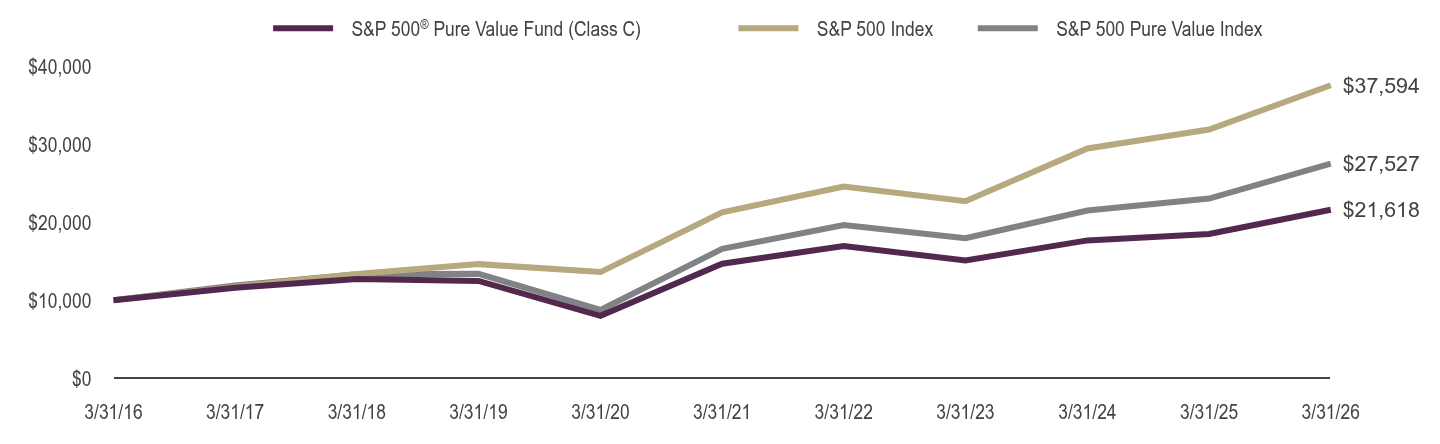
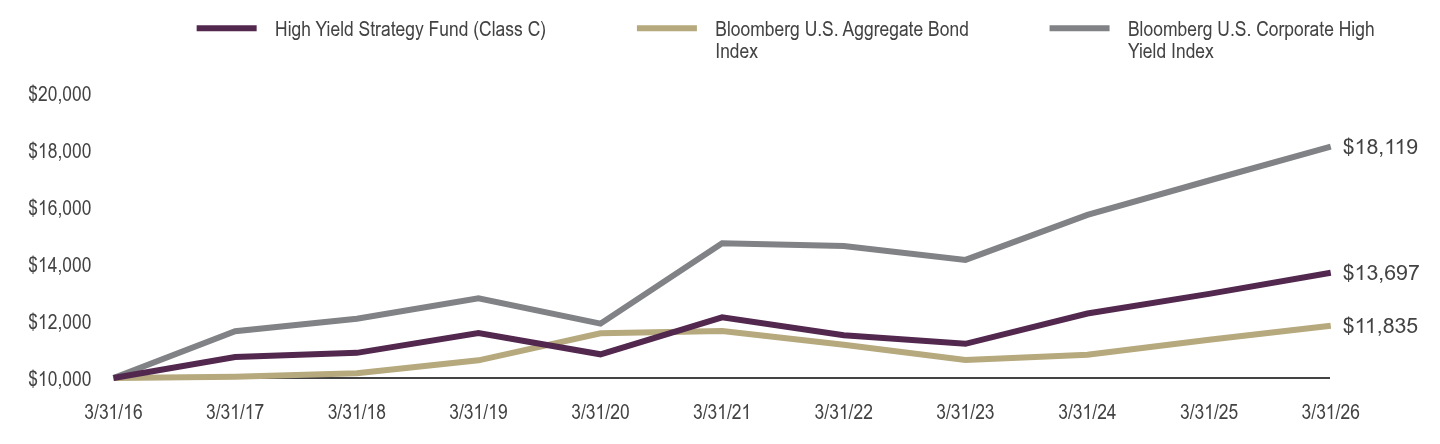
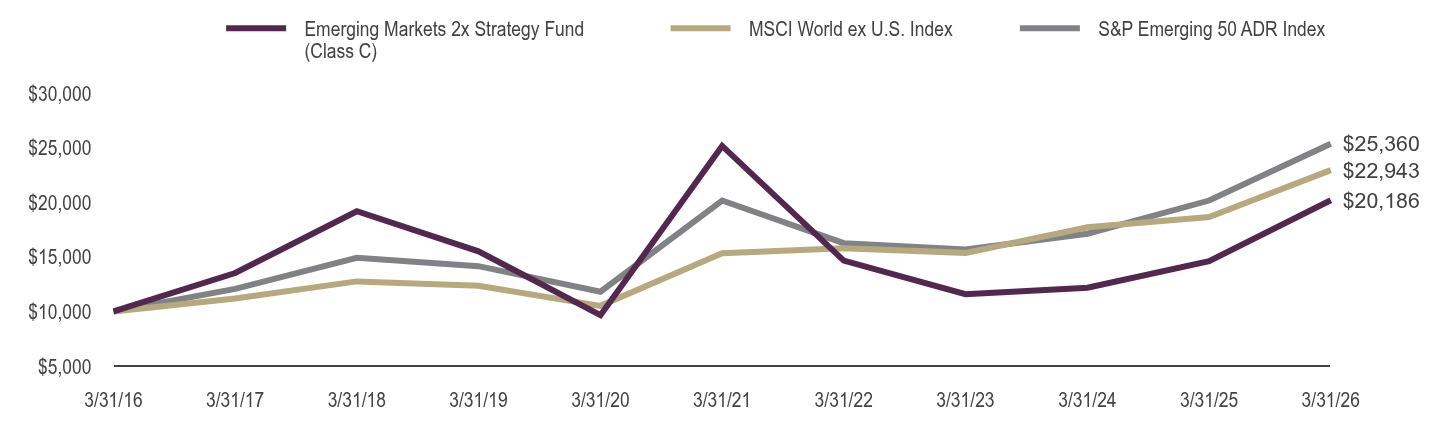
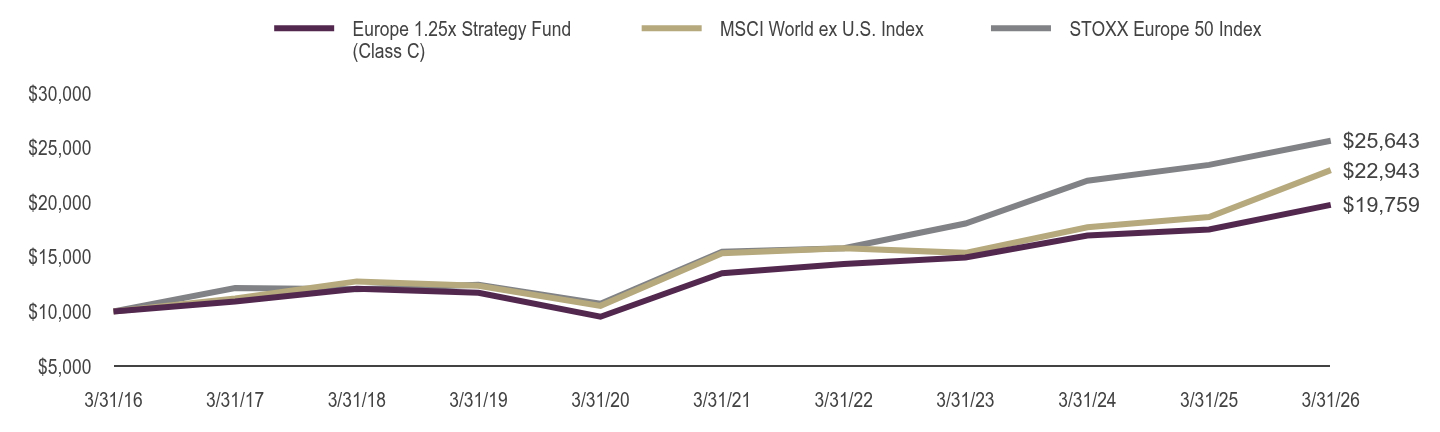
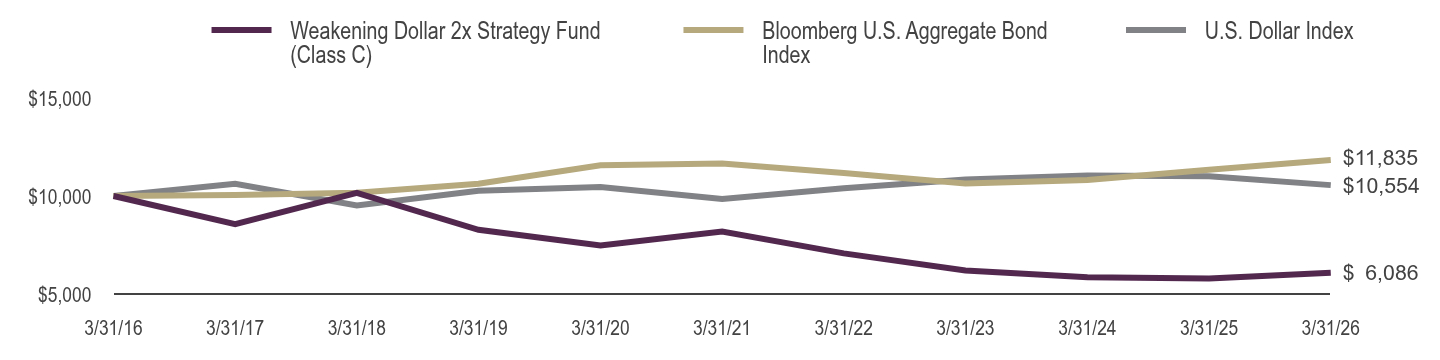
| Line Graph [Table Text Block] |
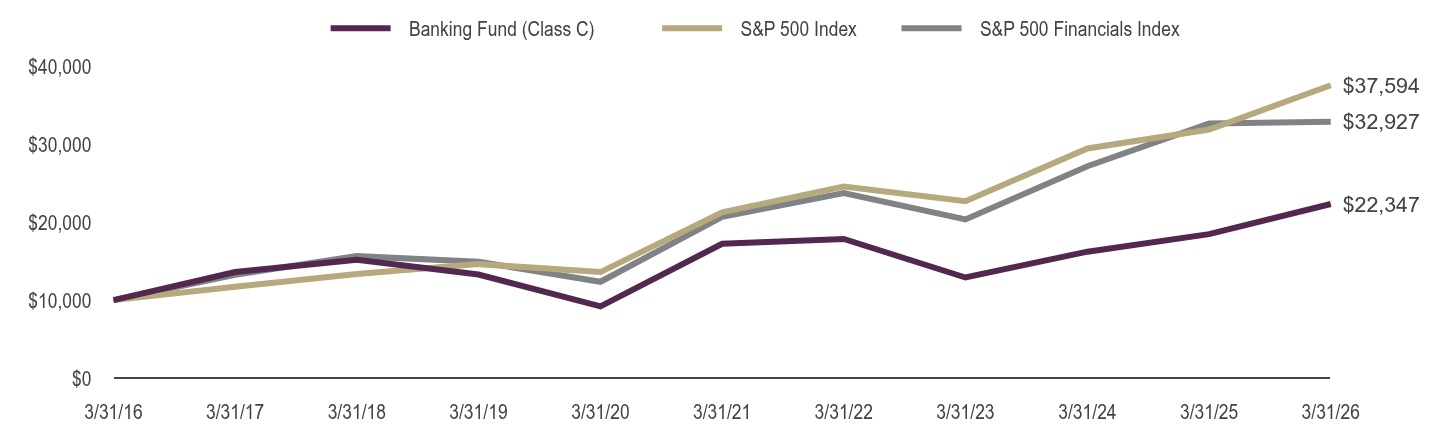
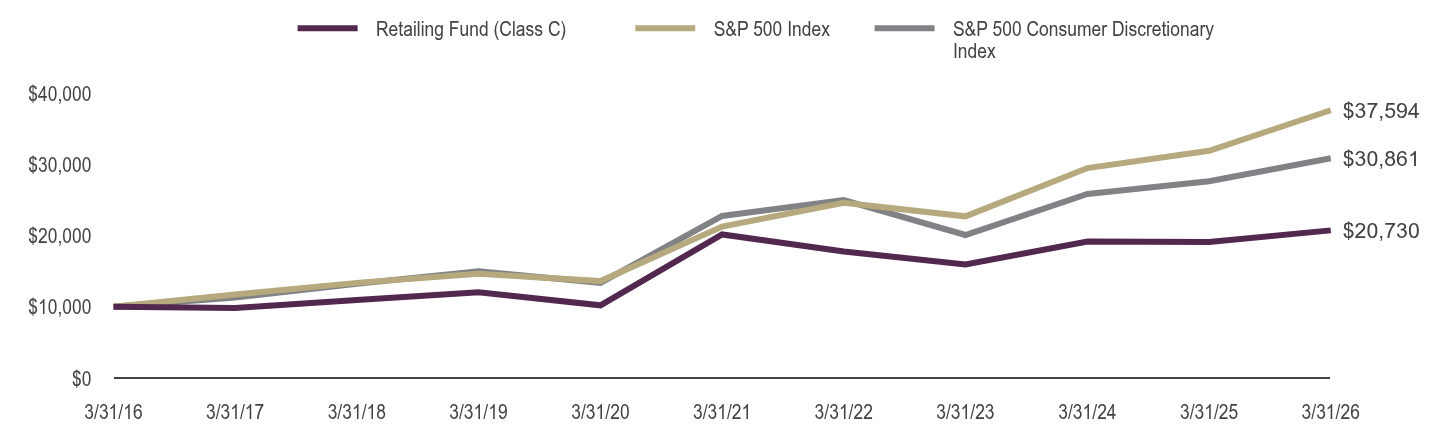
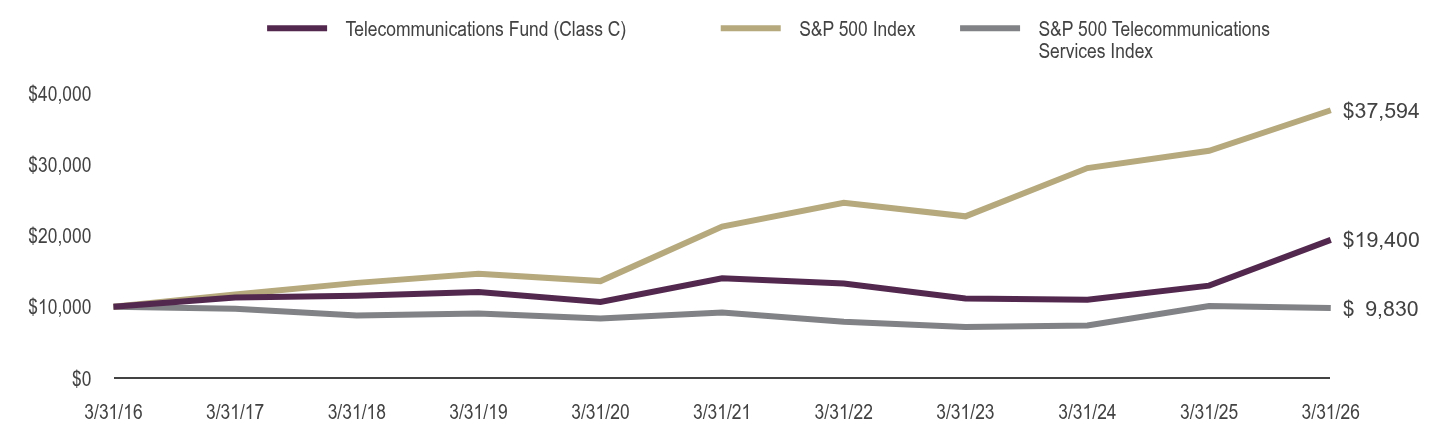
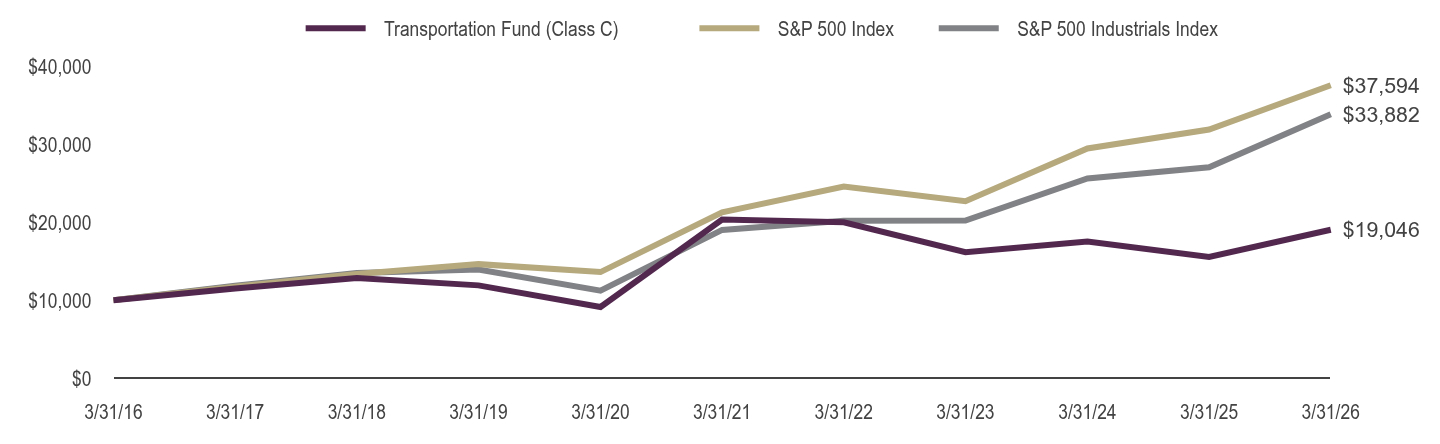
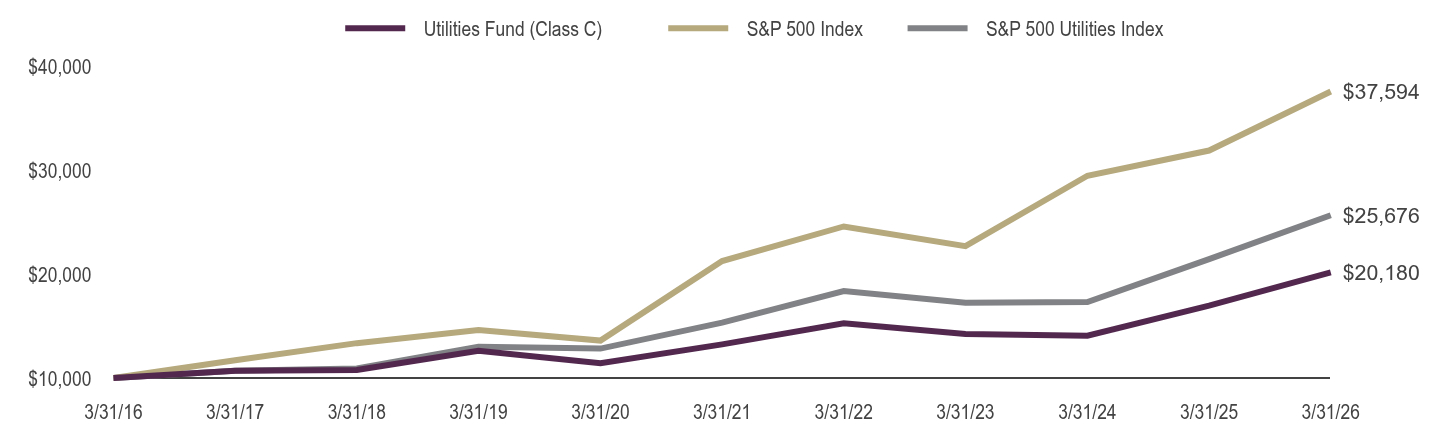
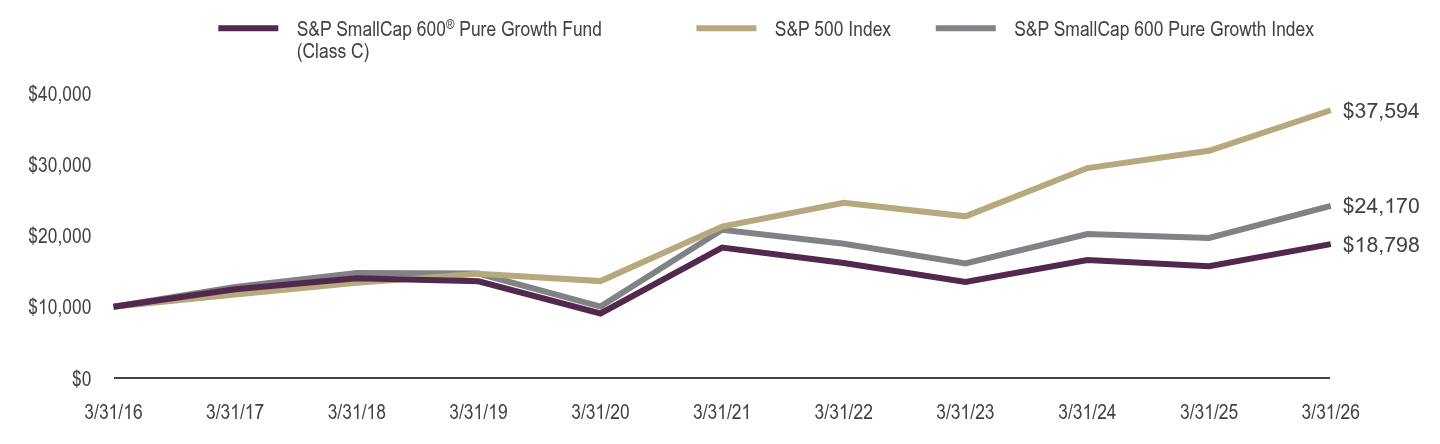
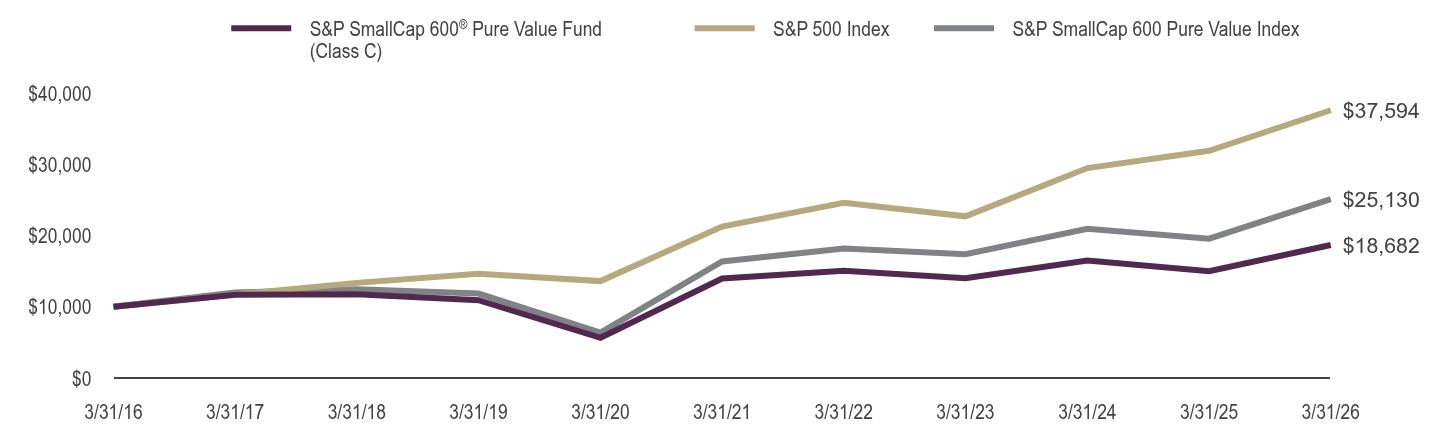
Table Summary | Banking Fund (Class C) | S&P 500 Index | S&P 500 Financials Index |
|---|
3/31/16 | $10,000 | $10,000 | $10,000 |
|---|
3/31/17 | $13,618 | $11,717 | $13,261 |
|---|
3/31/18 | $15,189 | $13,357 | $15,652 |
|---|
3/31/19 | $13,289 | $14,625 | $14,920 |
|---|
3/31/20 | $9,203 | $13,605 | $12,362 |
|---|
3/31/21 | $17,240 | $21,271 | $20,706 |
|---|
3/31/22 | $17,857 | $24,599 | $23,749 |
|---|
3/31/23 | $12,905 | $22,698 | $20,368 |
|---|
3/31/24 | $16,225 | $29,480 | $27,200 |
|---|
3/31/25 | $18,481 | $31,913 | $32,691 |
|---|
3/31/26 | $22,347 | $37,594 | $32,927 |
|---|
|
| Average Annual Return [Table Text Block] |
Table SummaryAverage Annual Total Returns | One Year | Five Years | Ten Years |
|---|
Class C (without CDSC) | 20.92% | 5.33% | 8.37% |
|---|
Class C (with CDSC) ‡ | 19.92% | 5.33% | 8.37% |
|---|
S&P 500 Index | 17.80% | 12.06% | 14.16% |
|---|
S&P 500 Financials Index | 0.72% | 9.72% | 12.66% |
|---|
|
| AssetsNet |
$ 7,045,507
|
| Holdings Count | Holding |
76
|
| Advisory Fees Paid, Amount |
$ 108,218
|
| InvestmentCompanyPortfolioTurnover |
179.00%
|
| Additional Fund Statistics [Text Block] |
Fund Statistics as of March 31, 2026 - Net Assets$7,045,507
- Total Number of Portfolio Holdings76
- Portfolio Turnover Rate179%
- Total Advisory Fees Paid$108,218
|
| Holdings [Text Block] |
Holdings DiversificationFootnote Reference1 (% of Net Assets) as of March 31, 2026 Table SummaryValue | Value |
|---|
Savings & Loans | 1.7% | Diversified Financial Services | 3.7% | Banks | 94.0% | |
| Largest Holdings [Text Block] |
10 Largest HoldingsFootnote Reference2 (% of Net Assets) as of March 31, 2026 Table SummaryCitigroup, Inc. | 4.1% |
|---|
Wells Fargo & Co. | 4.1% |
|---|
JPMorgan Chase & Co. | 4.0% |
|---|
Bank of America Corp. | 4.0% |
|---|
Capital One Financial Corp. | 3.8% |
|---|
PNC Financial Services Group, Inc. | 3.2% |
|---|
U.S. Bancorp | 3.1% |
|---|
Bank of New York Mellon Corp. | 3.1% |
|---|
Truist Financial Corp. | 2.7% |
|---|
NU Holdings Limited/Cayman Islands — Class A | 2.6% |
|---|
Total | 34.7% |
|---|
|
| Material Fund Change [Text Block] |
|
| C000010304 |
|
| Shareholder Report [Line Items] |
|
| Fund Name |
Banking Fund
|
| Class Name |
Class H
|
| Trading Symbol |
RYKAX
|
| Annual or Semi-Annual Statement [Text Block] |
This annual shareholder report contains important information about the Banking Fund for the period from April 1, 2025 to March 31, 2026.
|
| Shareholder Report Annual or Semi-Annual |
Annual Shareholder Report
|
| Additional Information [Text Block] |
You can find additional information about the fund at GuggenheimInvestments.com/mutual-funds/literature. You can also request this information by contacting 800 820 0888 or services@guggenheiminvestments.com.
|
| Additional Information Phone Number |
800 820 0888
|
| Additional Information Email |
<span style="box-sizing: border-box; color: rgb(67, 67, 67); display: inline; flex-wrap: nowrap; font-size: 10.6667px; font-weight: 400; grid-area: auto; line-height: 12.8px; margin: 0px; overflow: visible; text-align: left; text-align-last: auto; white-space-collapse: preserve-breaks;">services@guggenheiminvestments.com</span>
|
| Additional Information Website |
<span style="box-sizing: border-box; color: rgb(67, 67, 67); display: inline; flex-wrap: nowrap; font-size: 10.6667px; font-weight: 400; grid-area: auto; line-height: 12.8px; margin: 0px; overflow: visible; text-align: left; text-align-last: auto; white-space-collapse: preserve-breaks;">GuggenheimInvestments.com/mutual-funds/literature</span>
|
| Expenses [Text Block] |
What were the Fund's costs for the last year? * Based on a hypothetical $10,000 investment Table SummaryClass | Costs of a $10,000 Investment | Costs Paid as a % of a $10,000 Investment |
|---|
Class H | $181 | 1.63% |
|---|
Table Summary* | Excludes expenses of the underlying funds in which the fund invests, if any. |
|---|
|
| Expenses Paid, Amount |
$ 181
|
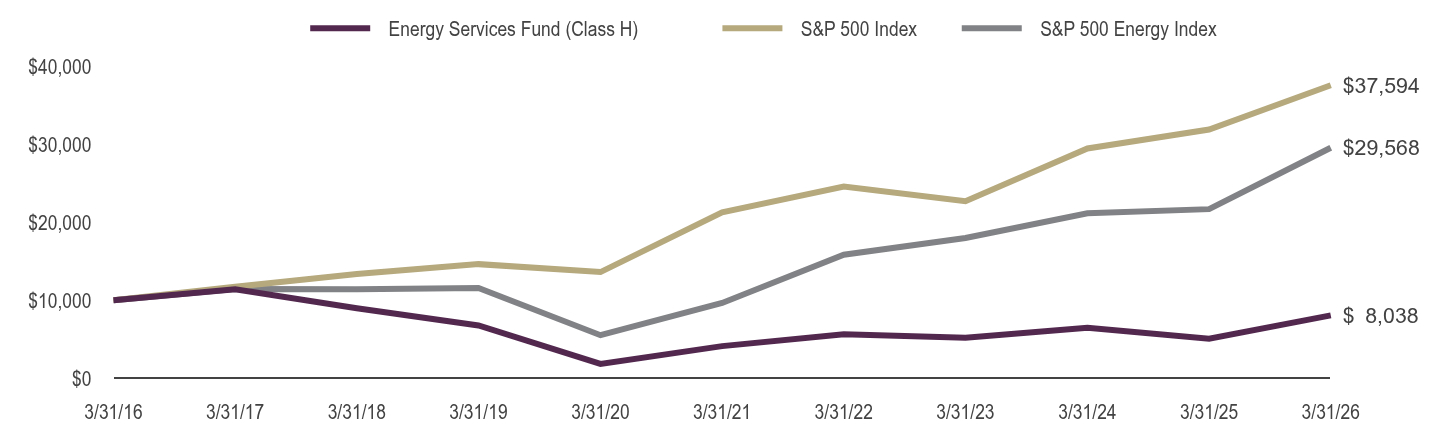
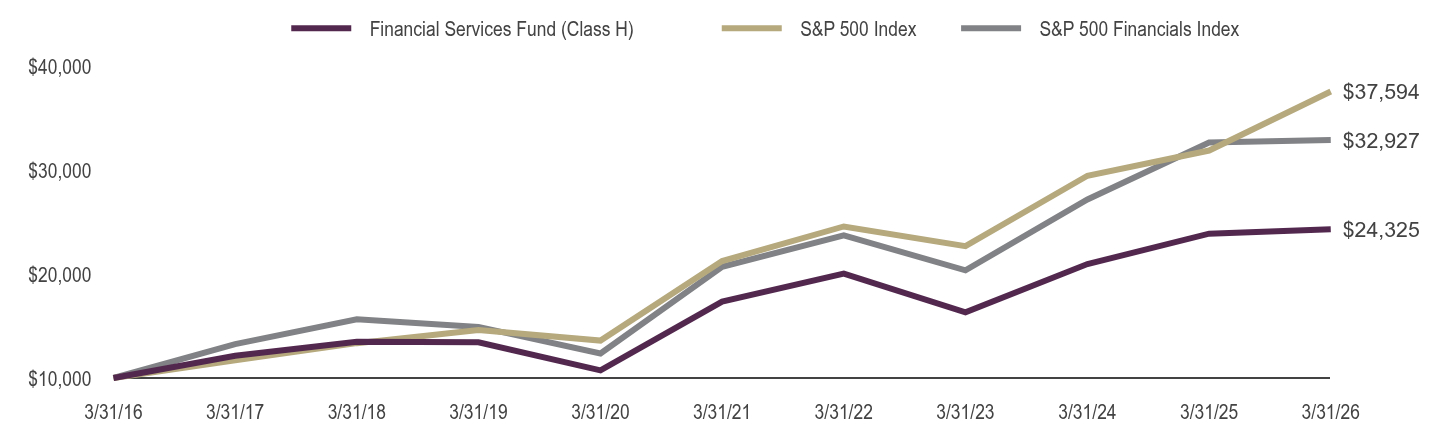
| Factors Affecting Performance [Text Block] |
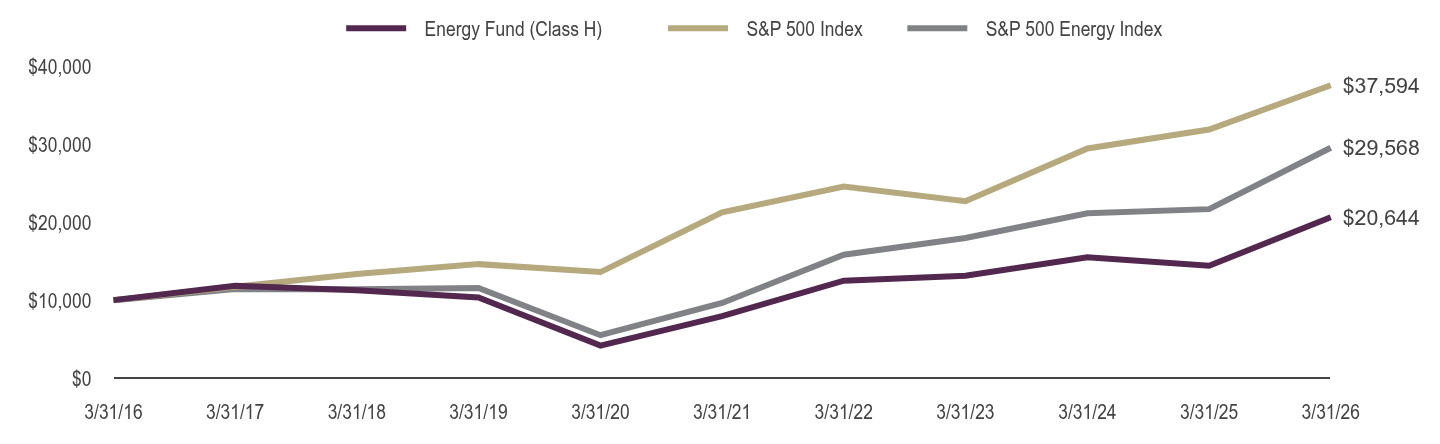
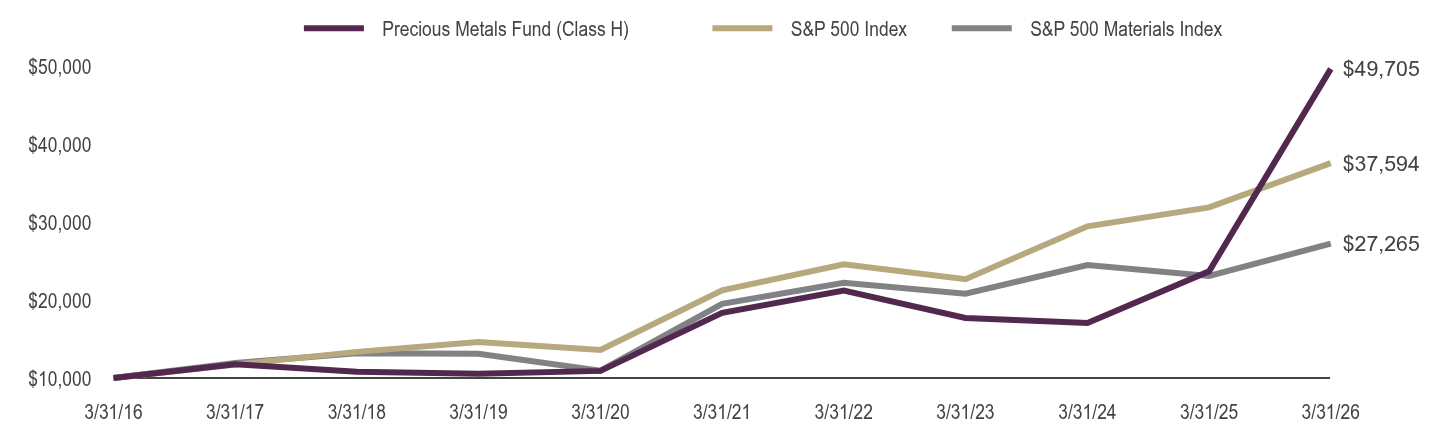
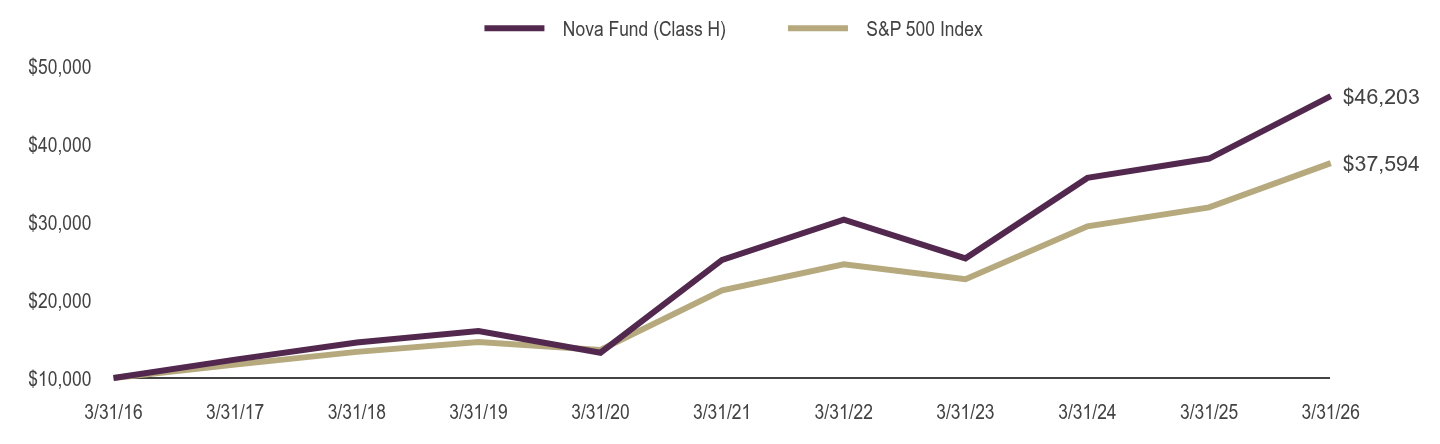
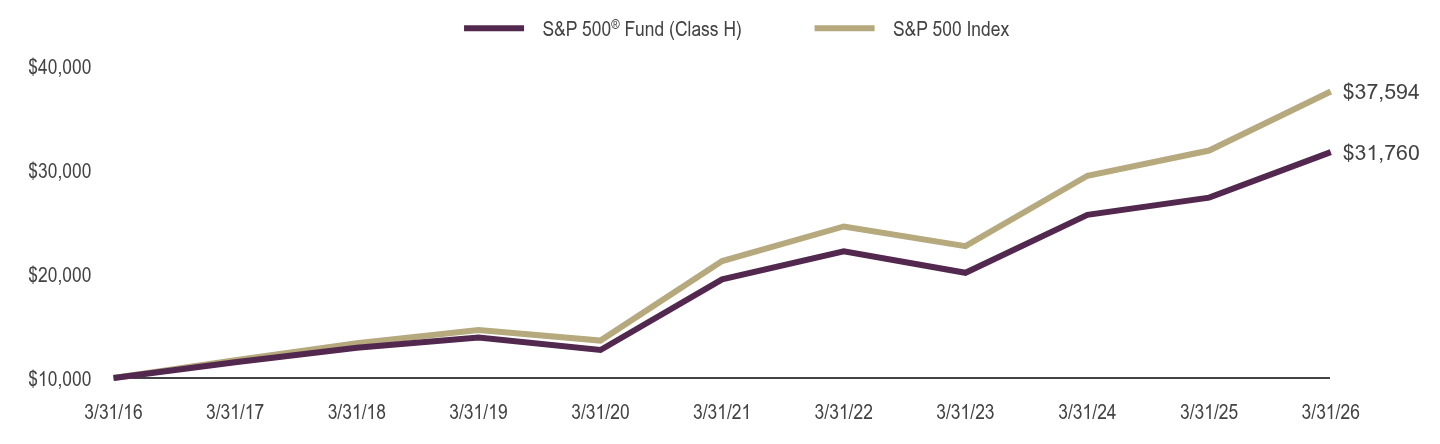
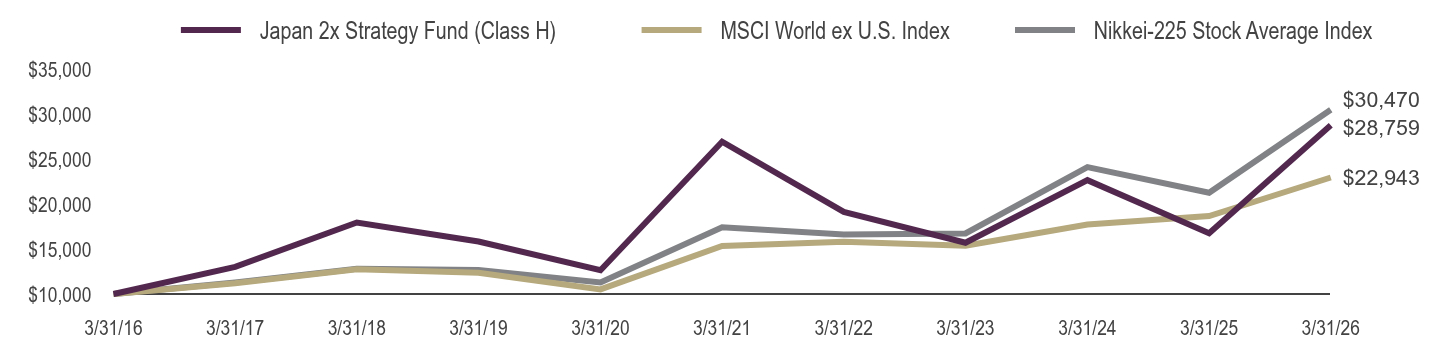
What factors materially affected the Fund's performance over the last year? The industries that contributed the most to performance were diversified banks, regional banks, and asset management & custody banks. No industry detracted from performance. The holdings that contributed the most to performance were Citigroup, Inc., Nu Holdings, Ltd.—Class A, and Bank of New York Mellon Corp. Those that detracted the most were Pinnacle Financial Partners, Inc., ICICI Bank Limited Sponsored ADR, and HDFC Bank Limited Sponsored ADR. |
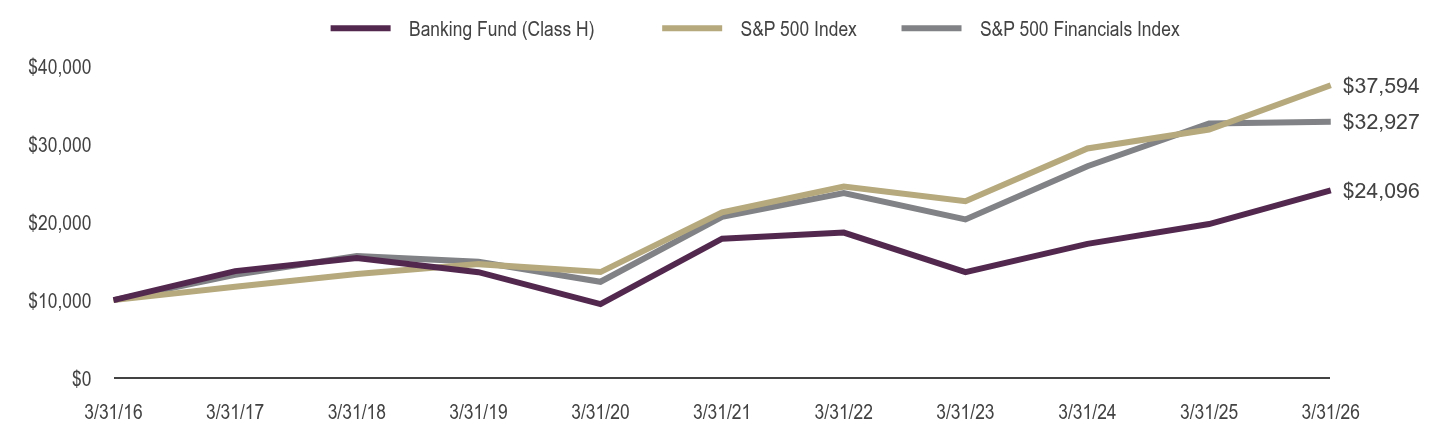
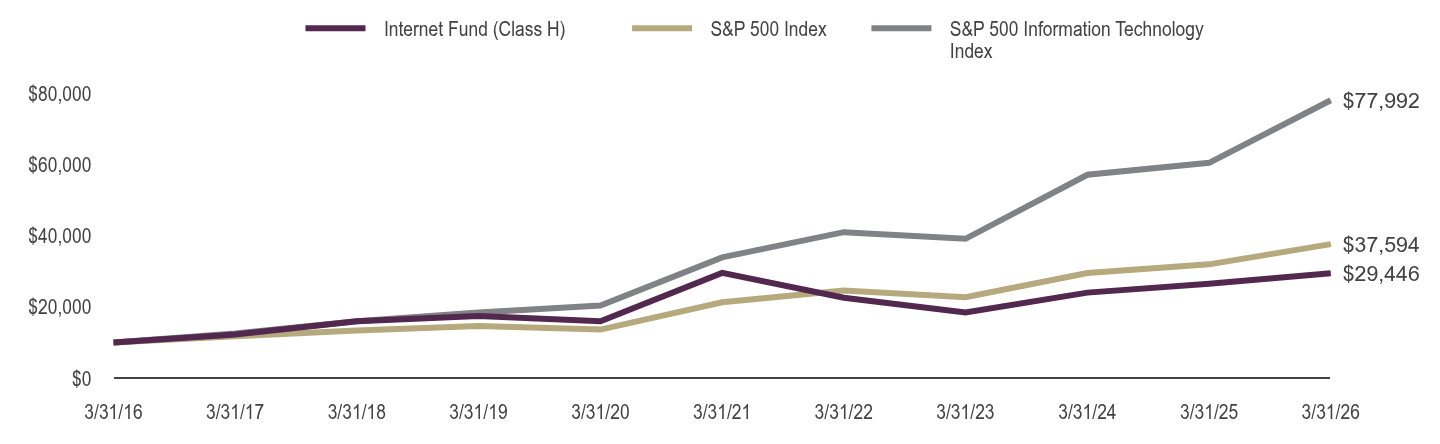
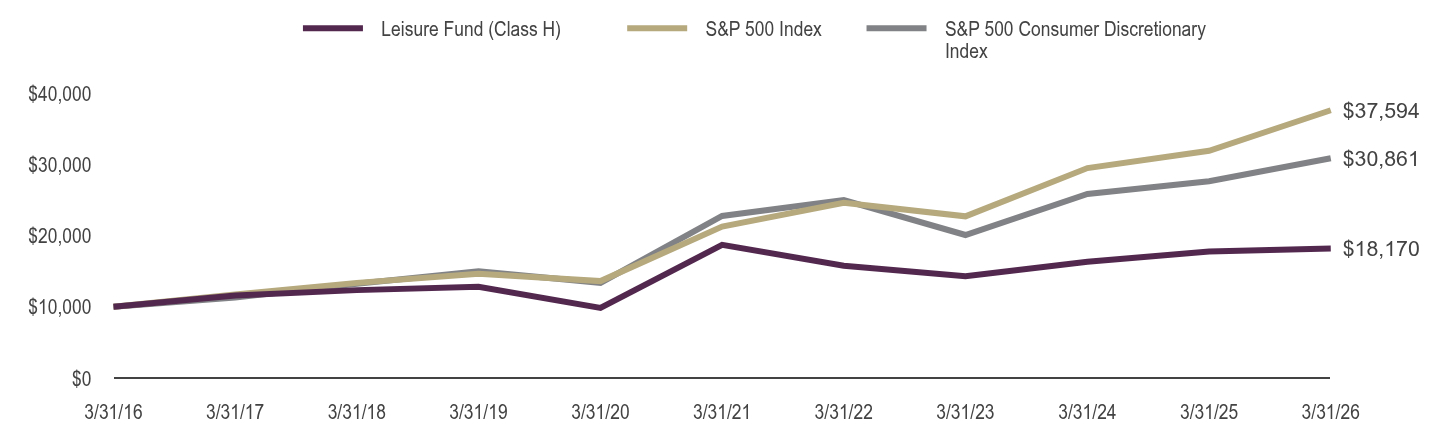
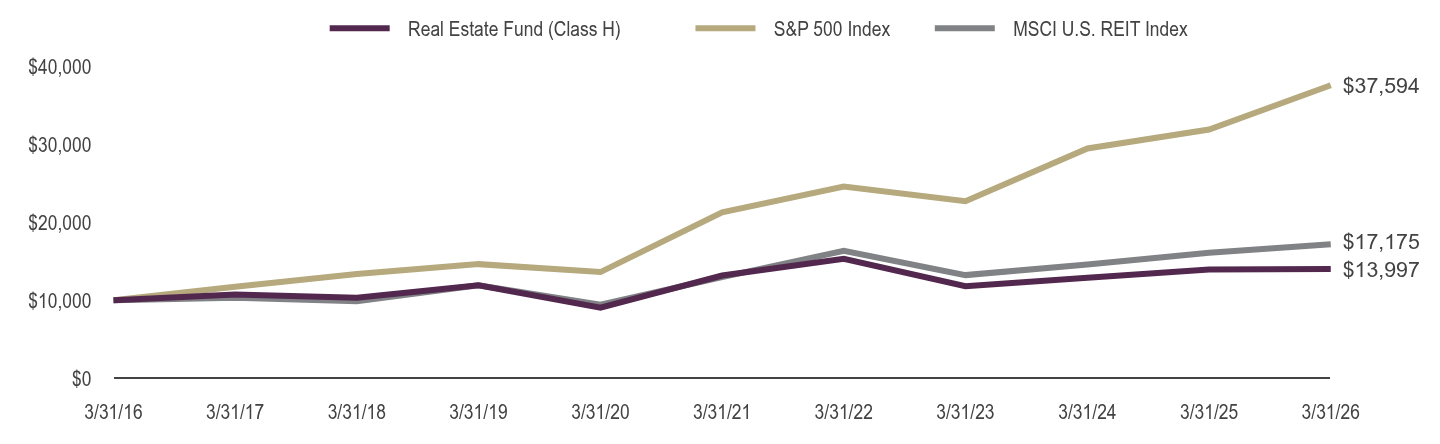
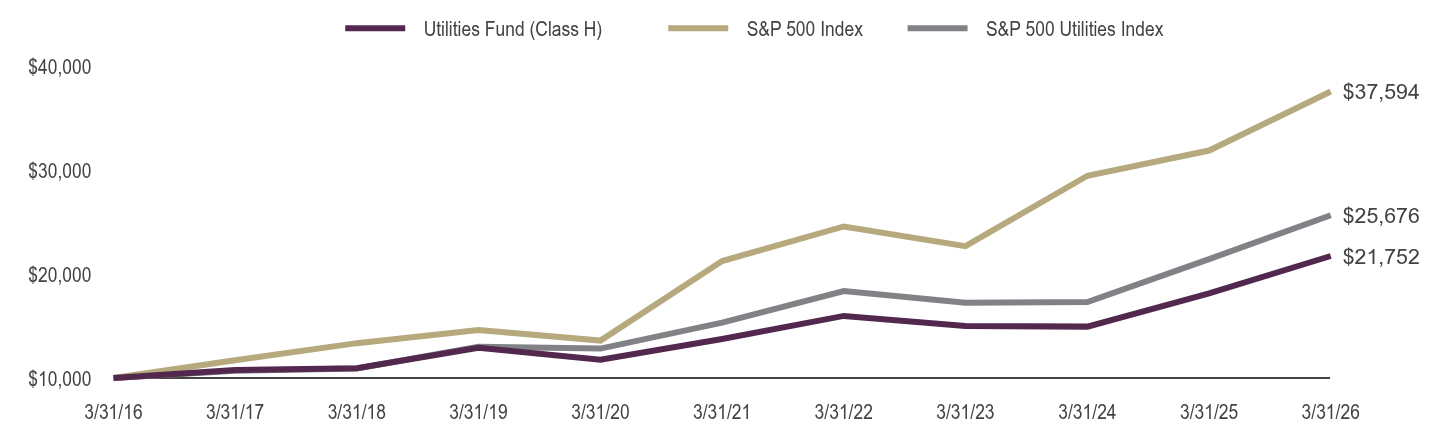
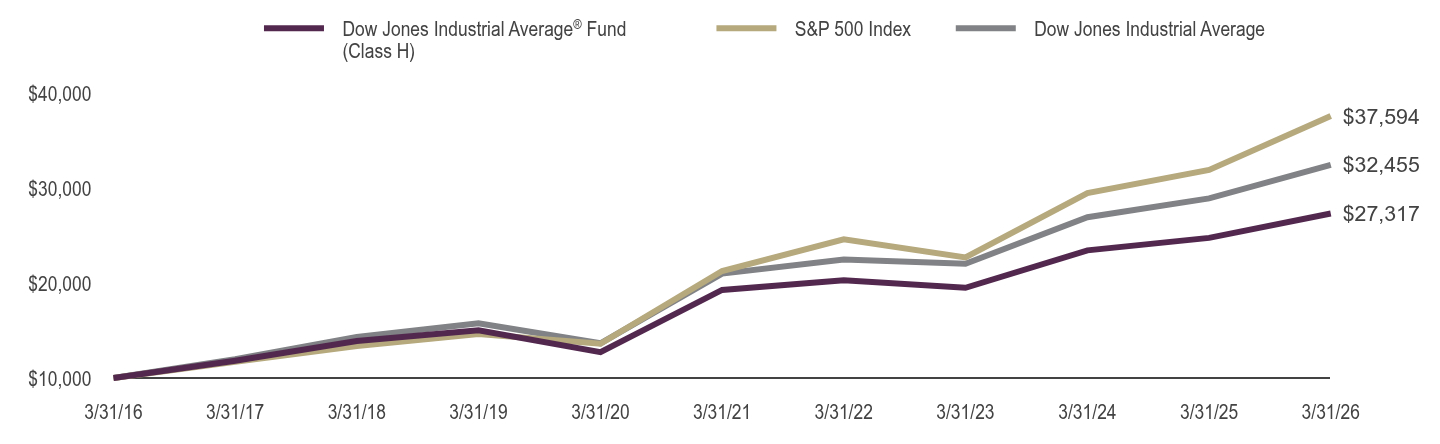
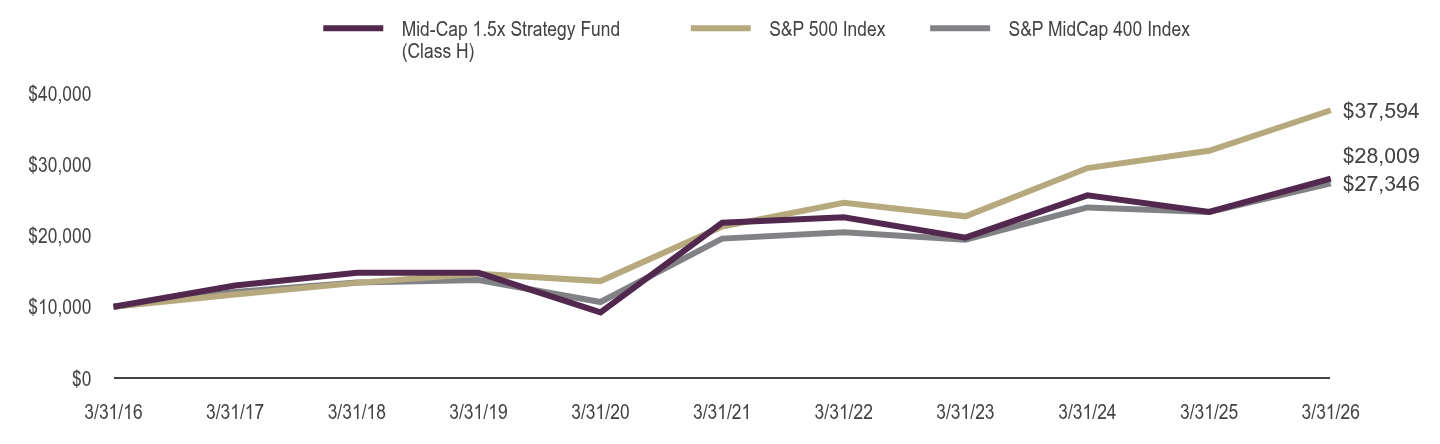
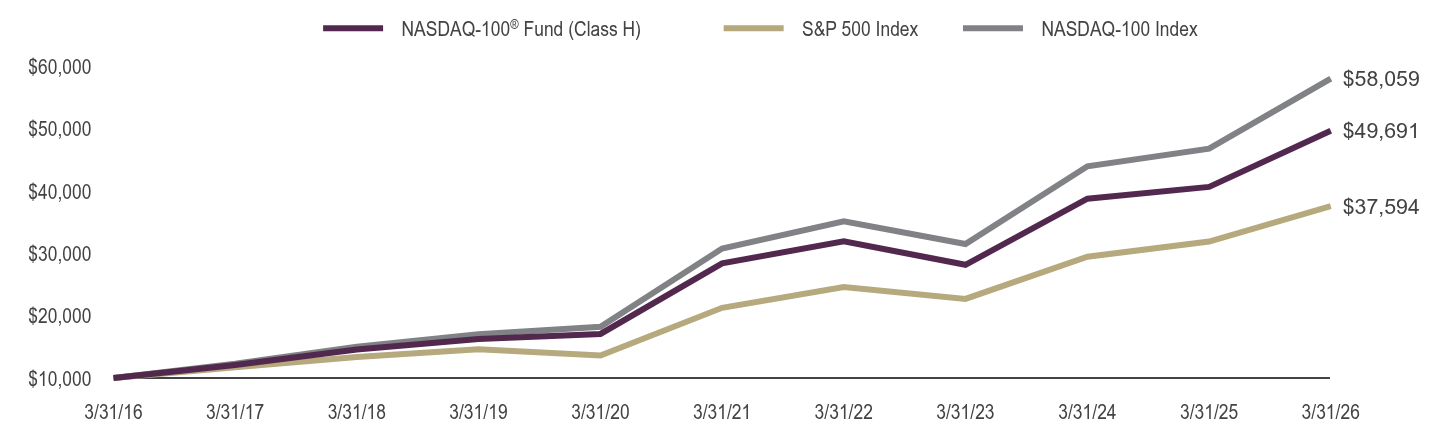
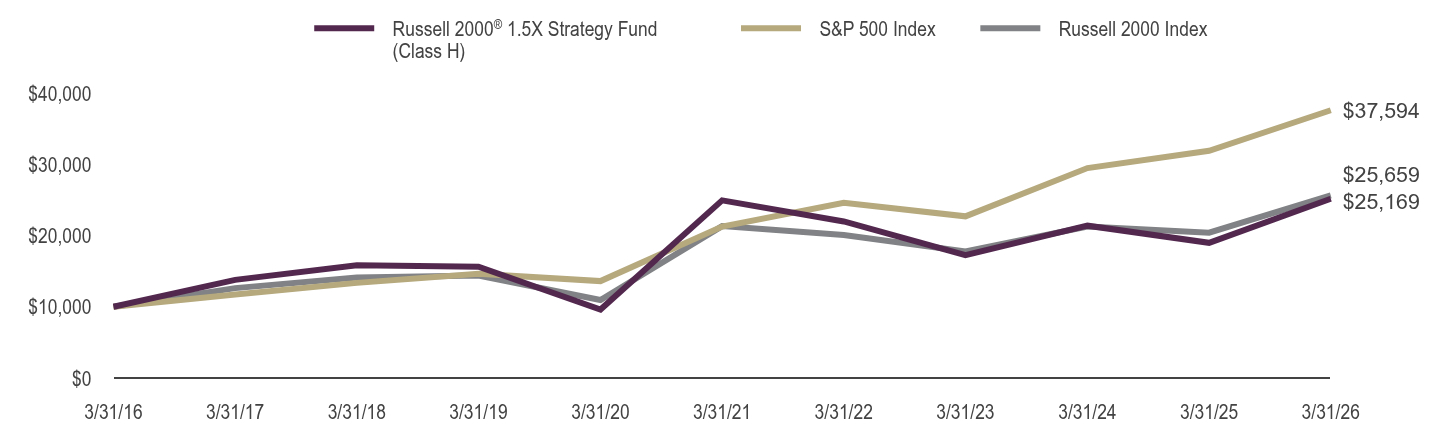
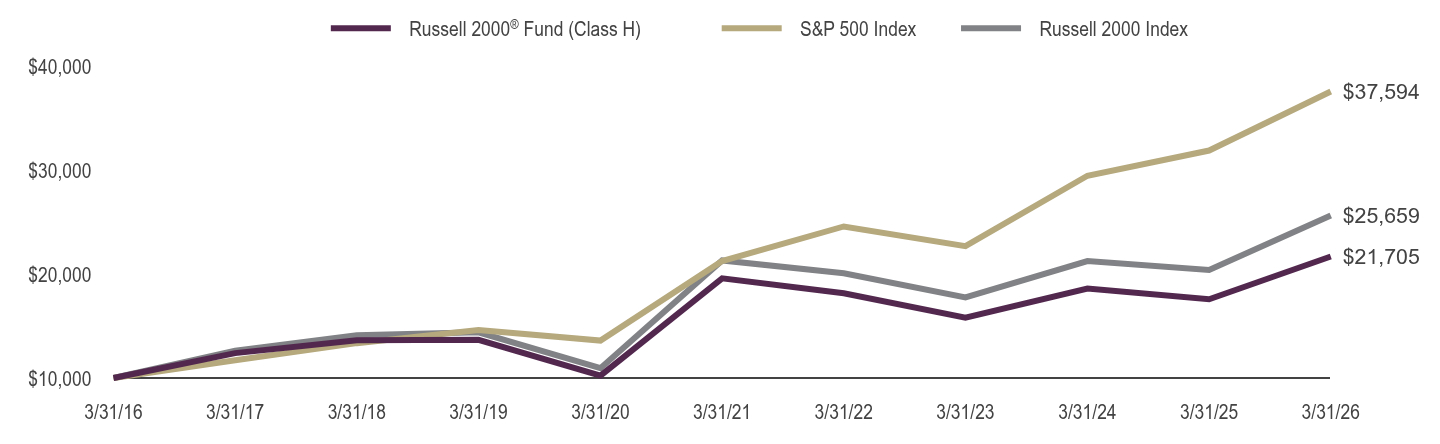
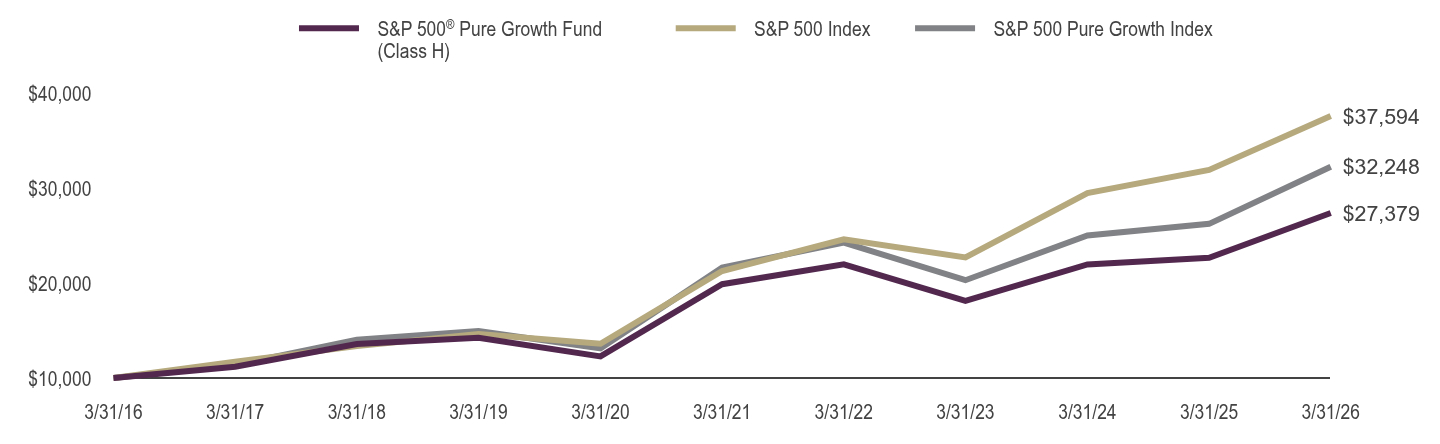
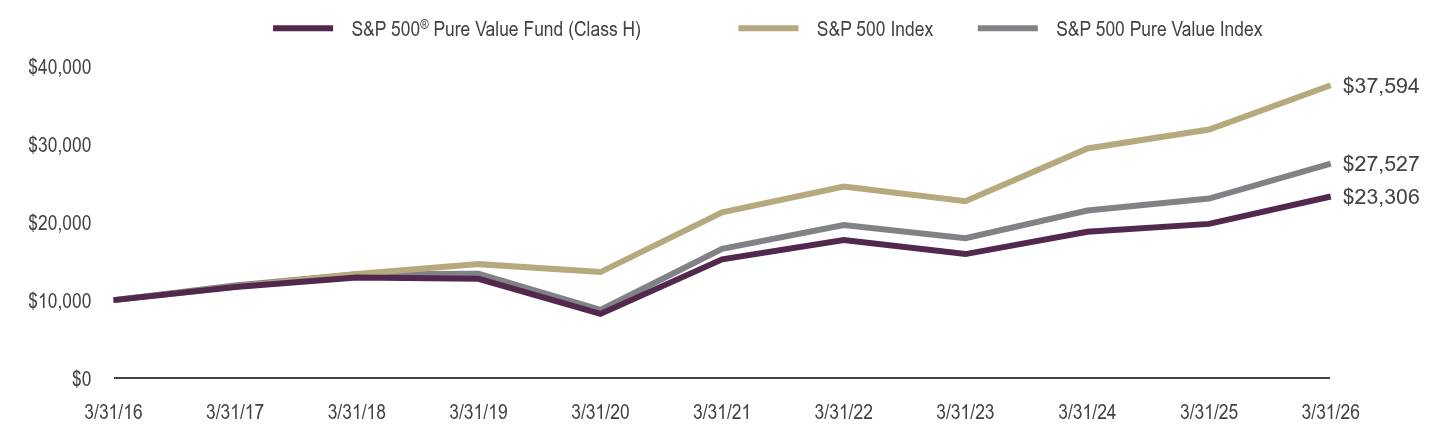
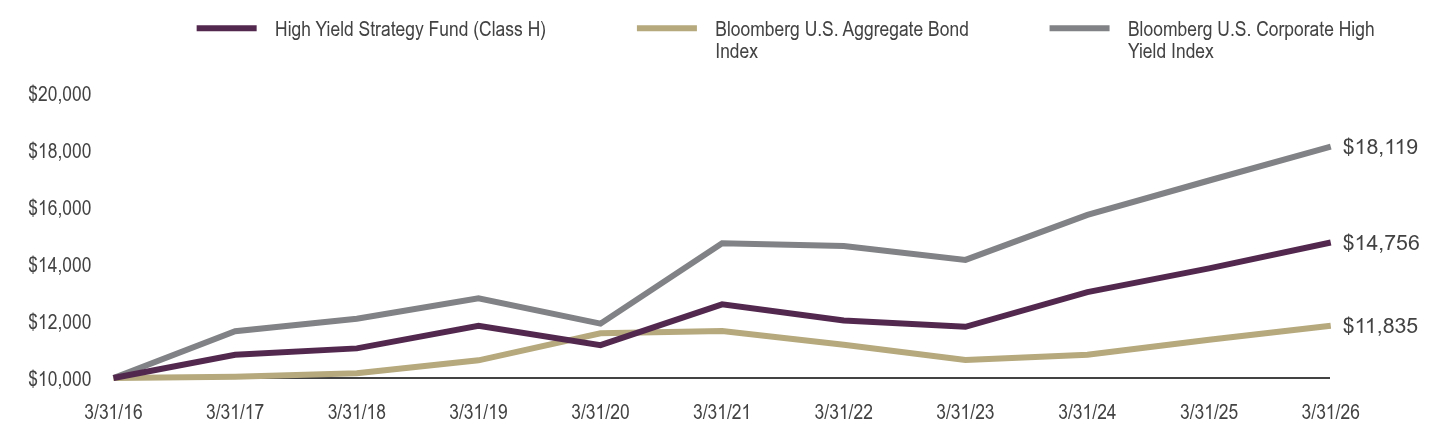
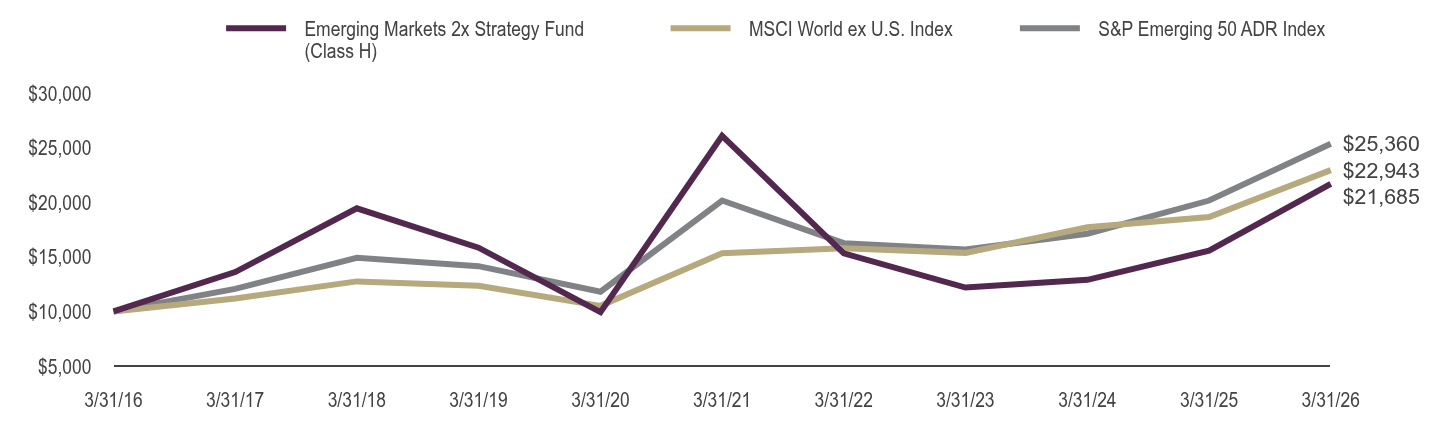
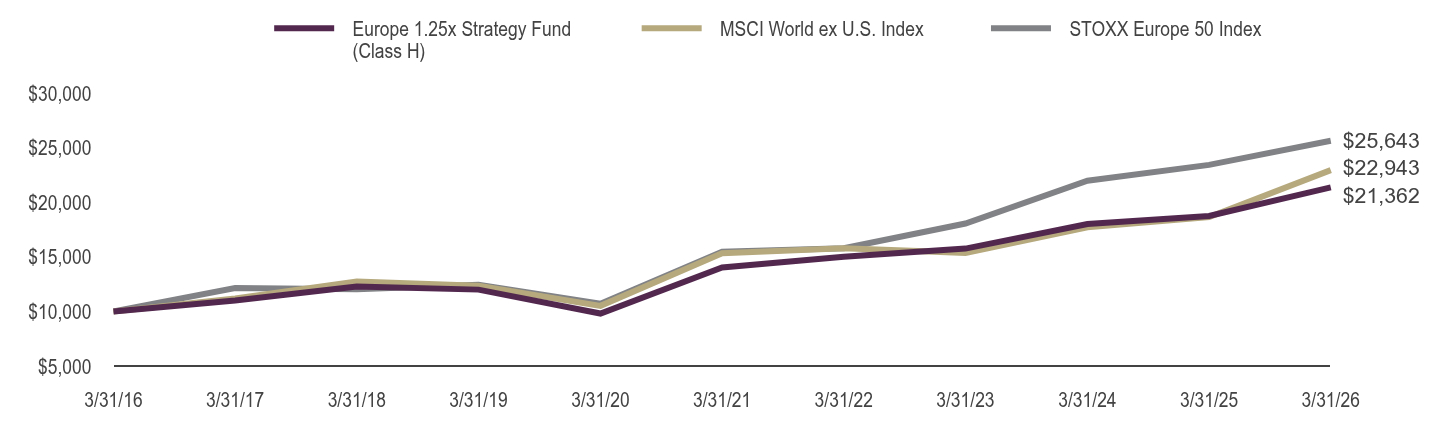
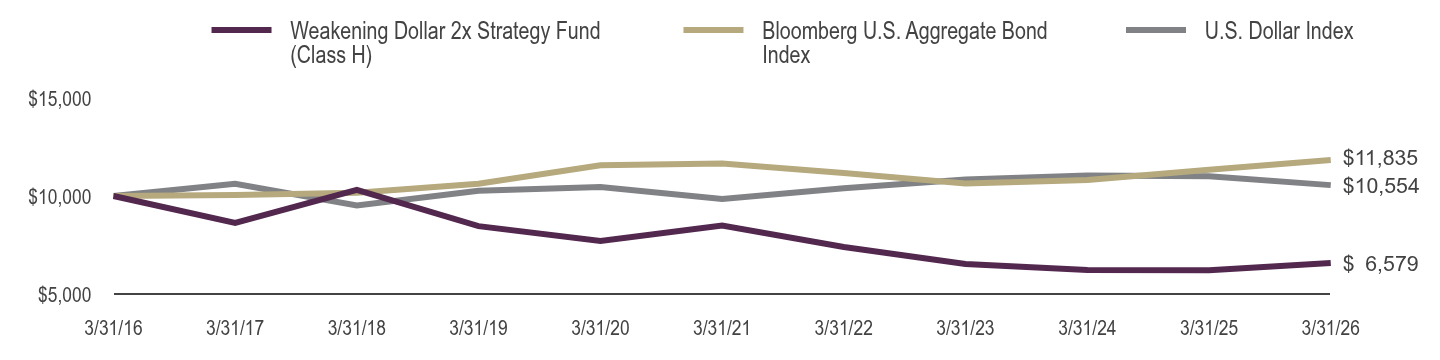
| Line Graph [Table Text Block] |
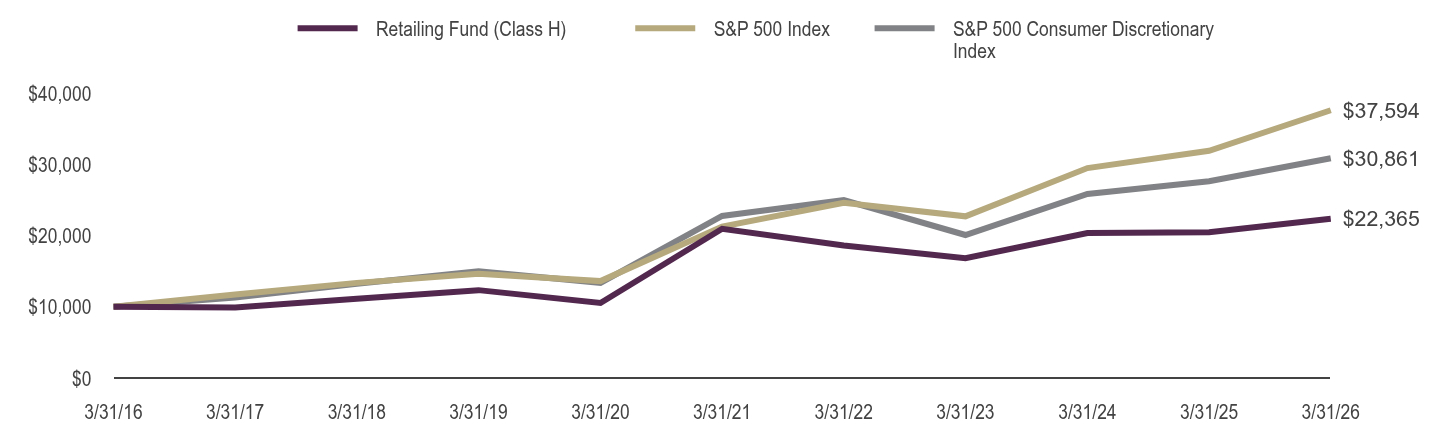
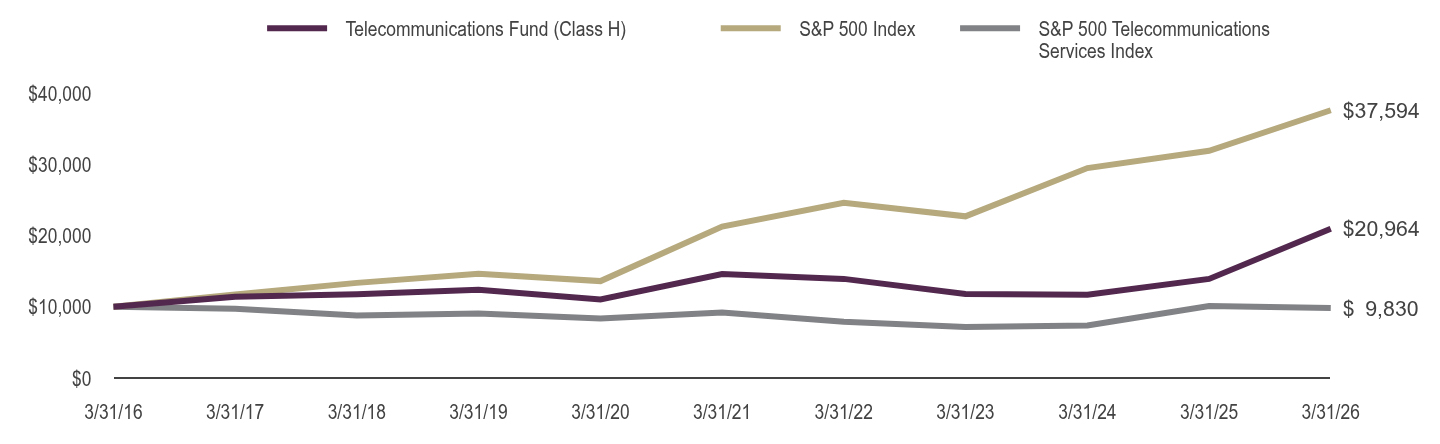
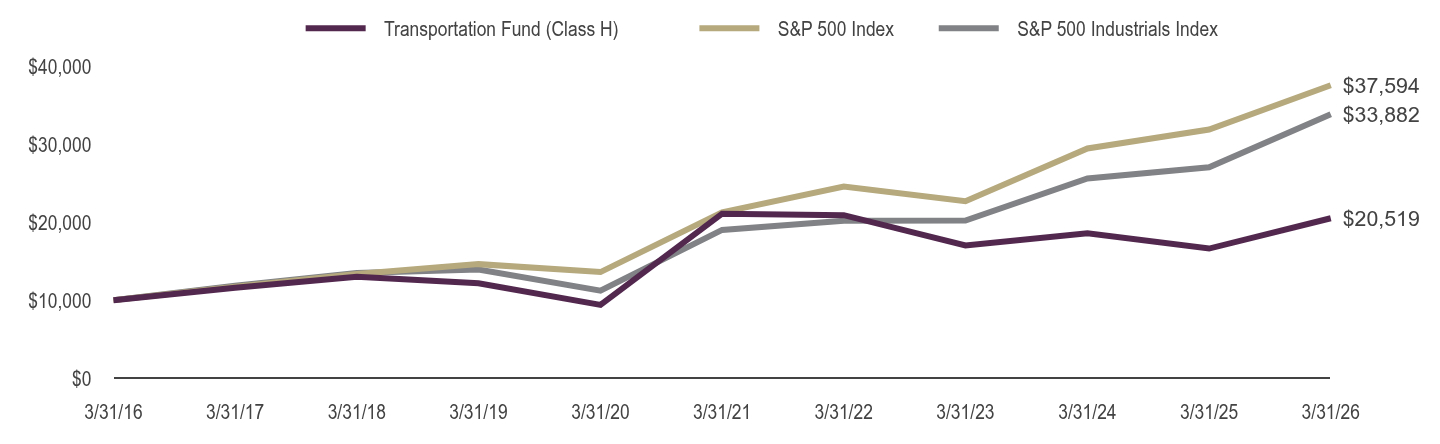
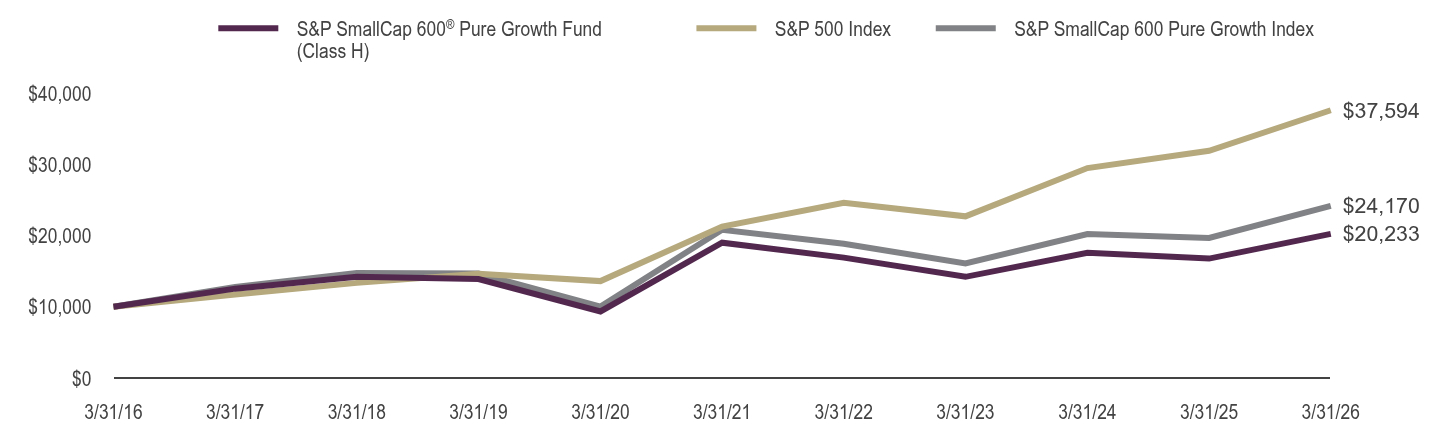
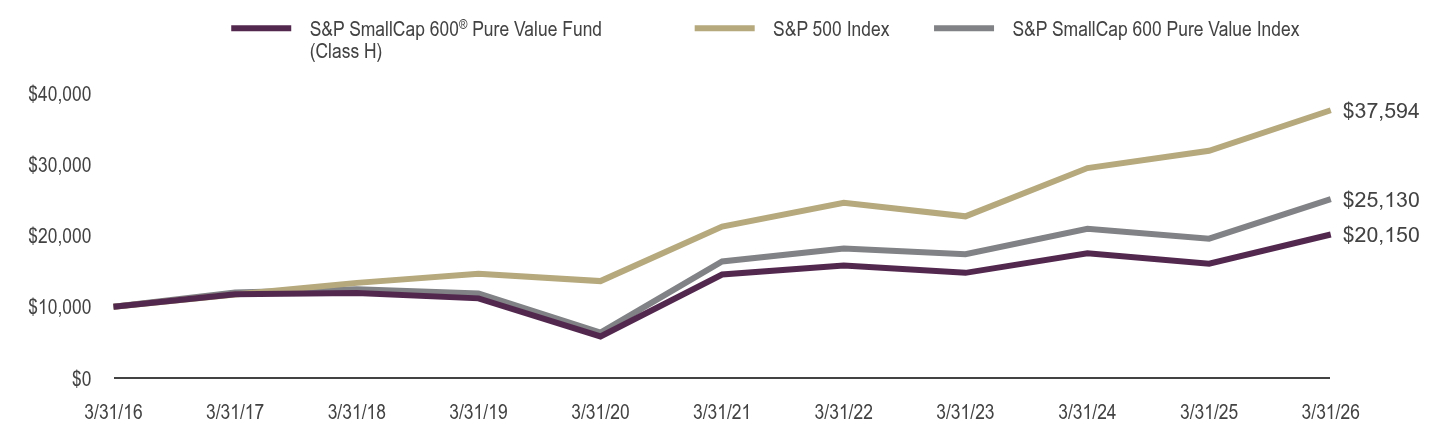
Table Summary | Banking Fund (Class H) | S&P 500 Index | S&P 500 Financials Index |
|---|
3/31/16 | $10,000 | $10,000 | $10,000 |
|---|
3/31/17 | $13,726 | $11,717 | $13,261 |
|---|
3/31/18 | $15,425 | $13,357 | $15,652 |
|---|
3/31/19 | $13,591 | $14,625 | $14,920 |
|---|
3/31/20 | $9,488 | $13,605 | $12,362 |
|---|
3/31/21 | $17,899 | $21,271 | $20,706 |
|---|
3/31/22 | $18,683 | $24,599 | $23,749 |
|---|
3/31/23 | $13,605 | $22,698 | $20,368 |
|---|
3/31/24 | $17,232 | $29,480 | $27,200 |
|---|
3/31/25 | $19,776 | $31,913 | $32,691 |
|---|
3/31/26 | $24,096 | $37,594 | $32,927 |
|---|
|
| Average Annual Return [Table Text Block] |
Table SummaryAverage Annual Total Returns | One Year | Five Years | Ten Years |
|---|
Class H | 21.84% | 6.13% | 9.19% |
|---|
S&P 500 Index | 17.80% | 12.06% | 14.16% |
|---|
S&P 500 Financials Index | 0.72% | 9.72% | 12.66% |
|---|
|
| AssetsNet |
$ 7,045,507
|
| Holdings Count | Holding |
76
|
| Advisory Fees Paid, Amount |
$ 108,218
|
| InvestmentCompanyPortfolioTurnover |
179.00%
|
| Additional Fund Statistics [Text Block] |
Fund Statistics as of March 31, 2026 - Net Assets$7,045,507
- Total Number of Portfolio Holdings76
- Portfolio Turnover Rate179%
- Total Advisory Fees Paid$108,218
|
| Holdings [Text Block] |
Holdings DiversificationFootnote Reference1 (% of Net Assets) as of March 31, 2026 Table SummaryValue | Value |
|---|
Savings & Loans | 1.7% | Diversified Financial Services | 3.7% | Banks | 94.0% | |
| Largest Holdings [Text Block] |
10 Largest HoldingsFootnote Reference2 (% of Net Assets) as of March 31, 2026 Table SummaryCitigroup, Inc. | 4.1% |
|---|
Wells Fargo & Co. | 4.1% |
|---|
JPMorgan Chase & Co. | 4.0% |
|---|
Bank of America Corp. | 4.0% |
|---|
Capital One Financial Corp. | 3.8% |
|---|
PNC Financial Services Group, Inc. | 3.2% |
|---|
U.S. Bancorp | 3.1% |
|---|
Bank of New York Mellon Corp. | 3.1% |
|---|
Truist Financial Corp. | 2.7% |
|---|
NU Holdings Limited/Cayman Islands — Class A | 2.6% |
|---|
Total | 34.7% |
|---|
|
| Material Fund Change [Text Block] |
|
| C000010626 |
|
| Shareholder Report [Line Items] |
|
| Fund Name |
Basic Materials Fund
|
| Class Name |
Investor Class
|
| Trading Symbol |
RYBIX
|
| Annual or Semi-Annual Statement [Text Block] |
This annual shareholder report contains important information about the Basic Materials Fund for the period from April 1, 2025 to March 31, 2026.
|
| Shareholder Report Annual or Semi-Annual |
Annual Shareholder Report
|
| Additional Information [Text Block] |
You can find additional information about the fund at GuggenheimInvestments.com/mutual-funds/literature. You can also request this information by contacting 800 820 0888 or services@guggenheiminvestments.com.
|
| Additional Information Phone Number |
800 820 0888
|
| Additional Information Email |
<span style="box-sizing: border-box; color: rgb(67, 67, 67); display: inline; flex-wrap: nowrap; font-size: 10.6667px; font-weight: 400; grid-area: auto; line-height: 12.8px; margin: 0px; overflow: visible; text-align: left; text-align-last: auto; white-space-collapse: preserve-breaks;">services@guggenheiminvestments.com</span>
|
| Additional Information Website |
<span style="box-sizing: border-box; color: rgb(67, 67, 67); display: inline; flex-wrap: nowrap; font-size: 10.6667px; font-weight: 400; grid-area: auto; line-height: 12.8px; margin: 0px; overflow: visible; text-align: left; text-align-last: auto; white-space-collapse: preserve-breaks;">GuggenheimInvestments.com/mutual-funds/literature</span>
|
| Expenses [Text Block] |
What were the Fund's costs for the last year? * Based on a hypothetical $10,000 investment Table SummaryClass | Costs of a $10,000 Investment | Costs Paid as a % of a $10,000 Investment |
|---|
Investor Class | $166 | 1.38% |
|---|
Table Summary* | Excludes expenses of the underlying funds in which the fund invests, if any. |
|---|
|
| Expenses Paid, Amount |
$ 166
|
| Factors Affecting Performance [Text Block] |
What factors materially affected the Fund's performance over the last year? The industries that contributed the most to performance were gold, steel, and silver. Those that detracted the most were paper & plastic packaging products & materials, semiconductor materials & equipment, and forest products. The holdings that contributed the most to performance were Newmont Corp., Barrick Mining Corp., and Kinross Gold Corp. Those that detracted the most were Graphic Packaging Holding Co., International Paper Co., and FMC Corp. |
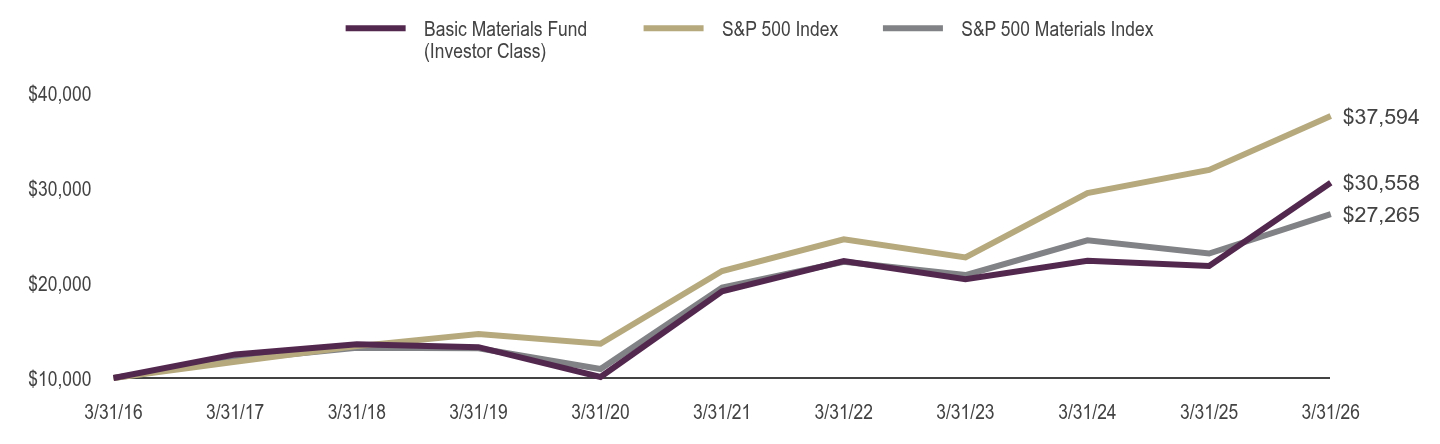
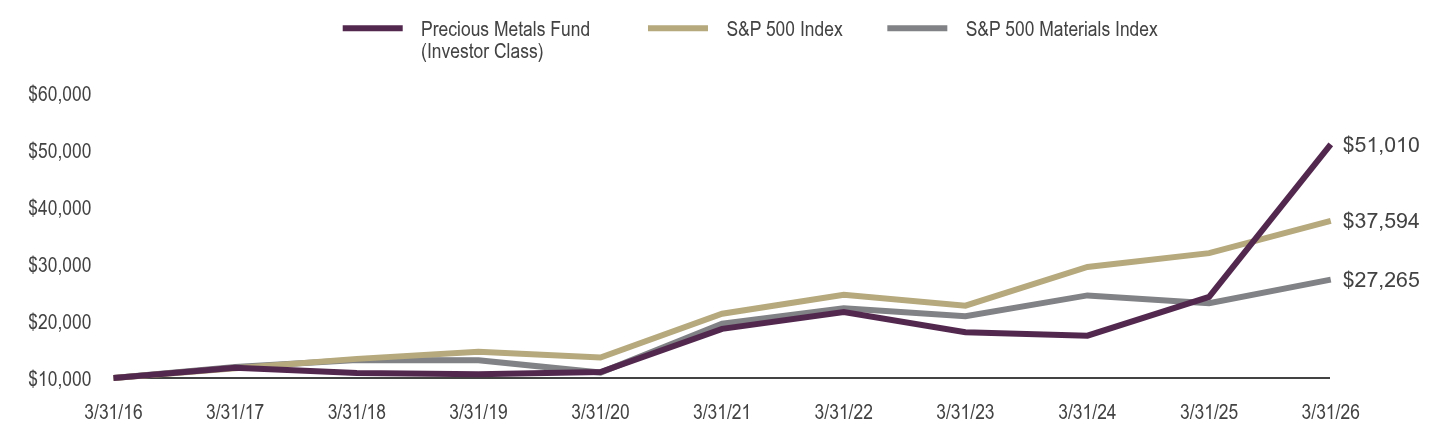
| Line Graph [Table Text Block] |
Table Summary | Basic Materials Fund (Investor Class) | S&P 500 Index | S&P 500 Materials Index |
|---|
3/31/16 | $10,000 | $10,000 | $10,000 |
|---|
3/31/17 | $12,485 | $11,717 | $11,922 |
|---|
3/31/18 | $13,564 | $13,357 | $13,178 |
|---|
3/31/19 | $13,244 | $14,625 | $13,121 |
|---|
3/31/20 | $10,117 | $13,605 | $10,947 |
|---|
3/31/21 | $19,121 | $21,271 | $19,517 |
|---|
3/31/22 | $22,318 | $24,599 | $22,234 |
|---|
3/31/23 | $20,400 | $22,698 | $20,837 |
|---|
3/31/24 | $22,348 | $29,480 | $24,499 |
|---|
3/31/25 | $21,801 | $31,913 | $23,111 |
|---|
3/31/26 | $30,558 | $37,594 | $27,265 |
|---|
|
| Average Annual Return [Table Text Block] |
Table SummaryAverage Annual Total Returns | One Year | Five Years | Ten Years |
|---|
Investor Class | 40.16% | 9.83% | 11.82% |
|---|
S&P 500 Index | 17.80% | 12.06% | 14.16% |
|---|
S&P 500 Materials Index | 17.97% | 6.91% | 10.55% |
|---|
|
| AssetsNet |
$ 37,159,270
|
| Holdings Count | Holding |
104
|
| Advisory Fees Paid, Amount |
$ 230,757
|
| InvestmentCompanyPortfolioTurnover |
136.00%
|
| Additional Fund Statistics [Text Block] |
Fund Statistics as of March 31, 2026 - Net Assets$37,159,270
- Total Number of Portfolio Holdings104
- Portfolio Turnover Rate136%
- Total Advisory Fees Paid$230,757
|
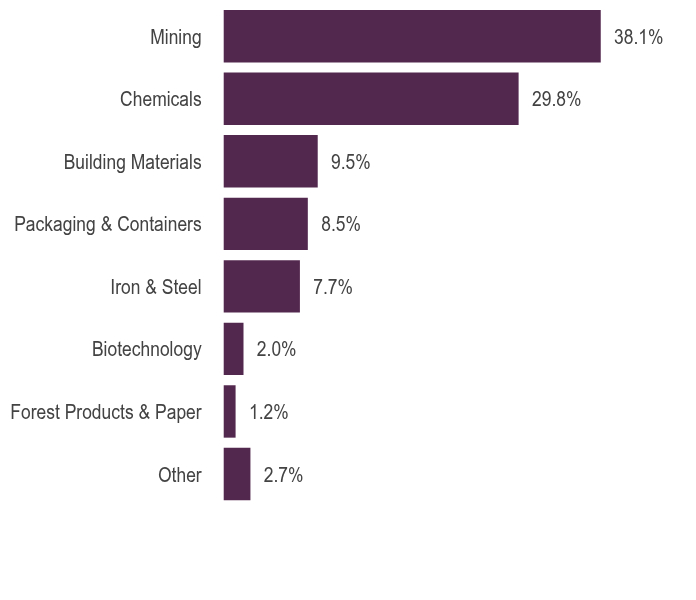
| Holdings [Text Block] |
Holdings DiversificationFootnote Reference1 (% of Net Assets) as of March 31, 2026 Table SummaryValue | Value |
|---|
Other | 2.7% | Forest Products & Paper | 1.2% | Biotechnology | 2.0% | Iron & Steel | 7.7% | Packaging & Containers | 8.5% | Building Materials | 9.5% | Chemicals | 29.8% | Mining | 38.1% | |
| Largest Holdings [Text Block] |
10 Largest HoldingsFootnote Reference2 (% of Net Assets) as of March 31, 2026 Table SummaryLinde plc | 4.0% |
|---|
Newmont Corp. | 2.8% |
|---|
Freeport-McMoRan, Inc. | 2.5% |
|---|
Sherwin-Williams Co. | 2.3% |
|---|
Ecolab, Inc. | 2.2% |
|---|
Air Products and Chemicals, Inc. | 2.1% |
|---|
Corteva, Inc. | 2.0% |
|---|
Coeur Mining, Inc. | 1.7% |
|---|
Nucor Corp. | 1.7% |
|---|
Vulcan Materials Co. | 1.6% |
|---|
Total | 22.9% |
|---|
|
| Material Fund Change [Text Block] |
|
| C000010628 |
|
| Shareholder Report [Line Items] |
|
| Fund Name |
Basic Materials Fund
|
| Class Name |
Class A
|
| Trading Symbol |
RYBMX
|
| Annual or Semi-Annual Statement [Text Block] |
This annual shareholder report contains important information about the Basic Materials Fund for the period from April 1, 2025 to March 31, 2026.
|
| Shareholder Report Annual or Semi-Annual |
Annual Shareholder Report
|
| Additional Information [Text Block] |
You can find additional information about the fund at GuggenheimInvestments.com/mutual-funds/literature. You can also request this information by contacting 800 820 0888 or services@guggenheiminvestments.com.
|
| Additional Information Phone Number |
800 820 0888
|
| Additional Information Email |
<span style="box-sizing: border-box; color: rgb(67, 67, 67); display: inline; flex-wrap: nowrap; font-size: 10.6667px; font-weight: 400; grid-area: auto; line-height: 12.8px; margin: 0px; overflow: visible; text-align: left; text-align-last: auto; white-space-collapse: preserve-breaks;">services@guggenheiminvestments.com</span>
|
| Additional Information Website |
<span style="box-sizing: border-box; color: rgb(67, 67, 67); display: inline; flex-wrap: nowrap; font-size: 10.6667px; font-weight: 400; grid-area: auto; line-height: 12.8px; margin: 0px; overflow: visible; text-align: left; text-align-last: auto; white-space-collapse: preserve-breaks;">GuggenheimInvestments.com/mutual-funds/literature</span>
|
| Expenses [Text Block] |
What were the Fund's costs for the last year? * Based on a hypothetical $10,000 investment Table SummaryClass | Costs of a $10,000 Investment | Costs Paid as a % of a $10,000 Investment |
|---|
Class A | $195 | 1.63% |
|---|
Table Summary* | Excludes expenses of the underlying funds in which the fund invests, if any. |
|---|
|
| Expenses Paid, Amount |
$ 195
|
| Factors Affecting Performance [Text Block] |
What factors materially affected the Fund's performance over the last year? The industries that contributed the most to performance were gold, steel, and silver. Those that detracted the most were paper & plastic packaging products & materials, semiconductor materials & equipment, and forest products. The holdings that contributed the most to performance were Newmont Corp., Barrick Mining Corp., and Kinross Gold Corp. Those that detracted the most were Graphic Packaging Holding Co., International Paper Co., and FMC Corp. |
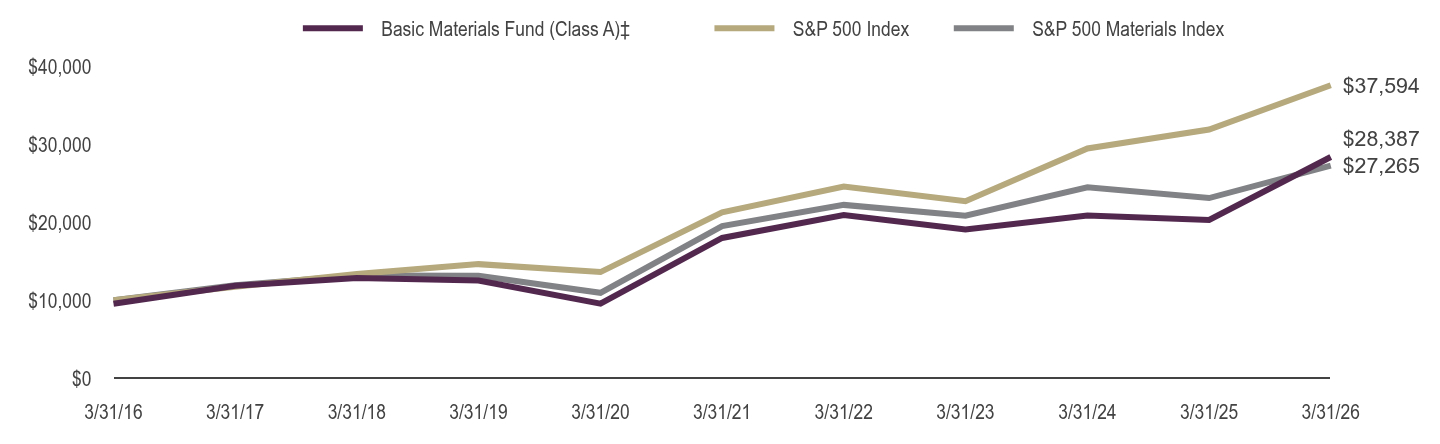
| Line Graph [Table Text Block] |
Table Summary | Basic Materials Fund (Class A)‡ | S&P 500 Index | S&P 500 Materials Index |
|---|
3/31/16 | $9,525 | $10,000 | $10,000 |
|---|
3/31/17 | $11,860 | $11,717 | $11,922 |
|---|
3/31/18 | $12,854 | $13,357 | $13,178 |
|---|
3/31/19 | $12,520 | $14,625 | $13,121 |
|---|
3/31/20 | $9,540 | $13,605 | $10,947 |
|---|
3/31/21 | $17,984 | $21,271 | $19,517 |
|---|
3/31/22 | $20,940 | $24,599 | $22,234 |
|---|
3/31/23 | $19,091 | $22,698 | $20,837 |
|---|
3/31/24 | $20,865 | $29,480 | $24,499 |
|---|
3/31/25 | $20,302 | $31,913 | $23,111 |
|---|
3/31/26 | $28,387 | $37,594 | $27,265 |
|---|
|
| Average Annual Return [Table Text Block] |
Table SummaryAverage Annual Total Returns | One Year | Five Years | Ten Years |
|---|
Class A (without sales charge) | 39.83% | 9.56% | 11.54% |
|---|
Class A (with sales charge) ‡ | 33.18% | 8.50% | 11.00% |
|---|
S&P 500 Index | 17.80% | 12.06% | 14.16% |
|---|
S&P 500 Materials Index | 17.97% | 6.91% | 10.55% |
|---|
|
| AssetsNet |
$ 37,159,270
|
| Holdings Count | Holding |
104
|
| Advisory Fees Paid, Amount |
$ 230,757
|
| InvestmentCompanyPortfolioTurnover |
136.00%
|
| Additional Fund Statistics [Text Block] |
Fund Statistics as of March 31, 2026 - Net Assets$37,159,270
- Total Number of Portfolio Holdings104
- Portfolio Turnover Rate136%
- Total Advisory Fees Paid$230,757
|
| Holdings [Text Block] |
Holdings DiversificationFootnote Reference1 (% of Net Assets) as of March 31, 2026 Table SummaryValue | Value |
|---|
Other | 2.7% | Forest Products & Paper | 1.2% | Biotechnology | 2.0% | Iron & Steel | 7.7% | Packaging & Containers | 8.5% | Building Materials | 9.5% | Chemicals | 29.8% | Mining | 38.1% | |
| Largest Holdings [Text Block] |
10 Largest HoldingsFootnote Reference2 (% of Net Assets) as of March 31, 2026 Table SummaryLinde plc | 4.0% |
|---|
Newmont Corp. | 2.8% |
|---|
Freeport-McMoRan, Inc. | 2.5% |
|---|
Sherwin-Williams Co. | 2.3% |
|---|
Ecolab, Inc. | 2.2% |
|---|
Air Products and Chemicals, Inc. | 2.1% |
|---|
Corteva, Inc. | 2.0% |
|---|
Coeur Mining, Inc. | 1.7% |
|---|
Nucor Corp. | 1.7% |
|---|
Vulcan Materials Co. | 1.6% |
|---|
Total | 22.9% |
|---|
|
| Material Fund Change [Text Block] |
|
| C000010629 |
|
| Shareholder Report [Line Items] |
|
| Fund Name |
Basic Materials Fund
|
| Class Name |
Class C
|
| Trading Symbol |
RYBCX
|
| Annual or Semi-Annual Statement [Text Block] |
This annual shareholder report contains important information about the Basic Materials Fund for the period from April 1, 2025 to March 31, 2026.
|
| Shareholder Report Annual or Semi-Annual |
Annual Shareholder Report
|
| Additional Information [Text Block] |
You can find additional information about the fund at GuggenheimInvestments.com/mutual-funds/literature. You can also request this information by contacting 800 820 0888 or services@guggenheiminvestments.com.
|
| Additional Information Phone Number |
800 820 0888
|
| Additional Information Email |
<span style="box-sizing: border-box; color: rgb(67, 67, 67); display: inline; flex-wrap: nowrap; font-size: 10.6667px; font-weight: 400; grid-area: auto; line-height: 12.8px; margin: 0px; overflow: visible; text-align: left; text-align-last: auto; white-space-collapse: preserve-breaks;">services@guggenheiminvestments.com</span>
|
| Additional Information Website |
<span style="box-sizing: border-box; color: rgb(67, 67, 67); display: inline; flex-wrap: nowrap; font-size: 10.6667px; font-weight: 400; grid-area: auto; line-height: 12.8px; margin: 0px; overflow: visible; text-align: left; text-align-last: auto; white-space-collapse: preserve-breaks;">GuggenheimInvestments.com/mutual-funds/literature</span>
|
| Expenses [Text Block] |
What were the Fund's costs for the last year? * Based on a hypothetical $10,000 investment Table SummaryClass | Costs of a $10,000 Investment | Costs Paid as a % of a $10,000 Investment |
|---|
Class C | $284 | 2.38% |
|---|
Table Summary* | Excludes expenses of the underlying funds in which the fund invests, if any. |
|---|
|
| Expenses Paid, Amount |
$ 284
|
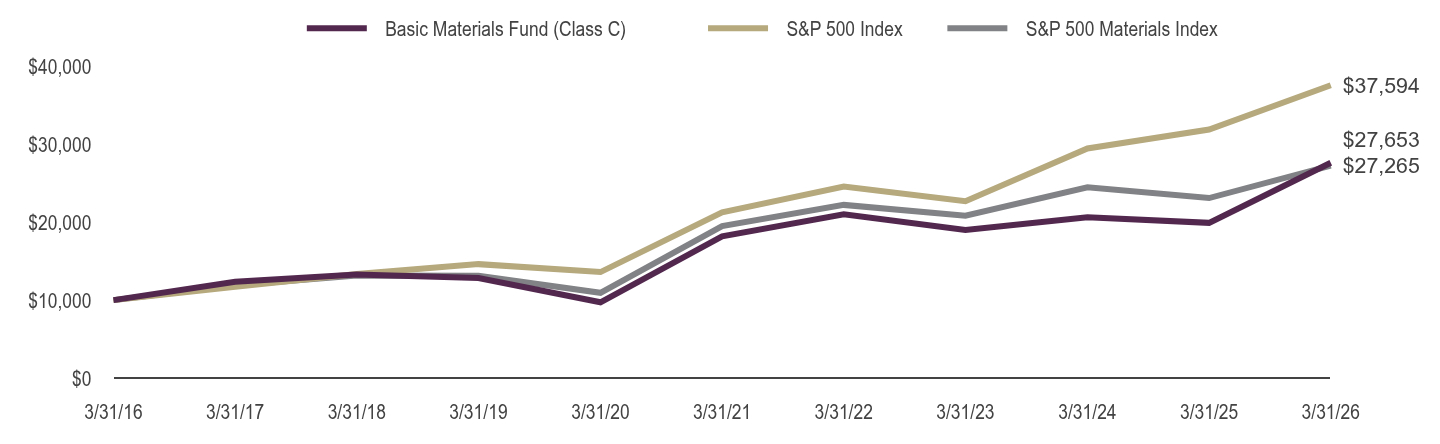
| Factors Affecting Performance [Text Block] |
What factors materially affected the Fund's performance over the last year? The industries that contributed the most to performance were gold, steel, and silver. Those that detracted the most were paper & plastic packaging products & materials, semiconductor materials & equipment, and forest products. The holdings that contributed the most to performance were Newmont Corp., Barrick Mining Corp., and Kinross Gold Corp. Those that detracted the most were Graphic Packaging Holding Co., International Paper Co., and FMC Corp. |
| Line Graph [Table Text Block] |
Table Summary | Basic Materials Fund (Class C) | S&P 500 Index | S&P 500 Materials Index |
|---|
3/31/16 | $10,000 | $10,000 | $10,000 |
|---|
3/31/17 | $12,362 | $11,717 | $11,922 |
|---|
3/31/18 | $13,297 | $13,357 | $13,178 |
|---|
3/31/19 | $12,852 | $14,625 | $13,121 |
|---|
3/31/20 | $9,723 | $13,605 | $10,947 |
|---|
3/31/21 | $18,189 | $21,271 | $19,517 |
|---|
3/31/22 | $21,020 | $24,599 | $22,234 |
|---|
3/31/23 | $19,022 | $22,698 | $20,837 |
|---|
3/31/24 | $20,633 | $29,480 | $24,499 |
|---|
3/31/25 | $19,926 | $31,913 | $23,111 |
|---|
3/31/26 | $27,653 | $37,594 | $27,265 |
|---|
|
| Average Annual Return [Table Text Block] |
Table SummaryAverage Annual Total Returns | One Year | Five Years | Ten Years |
|---|
Class C (without CDSC) | 38.78% | 8.74% | 10.71% |
|---|
Class C (with CDSC) ‡ | 37.78% | 8.74% | 10.71% |
|---|
S&P 500 Index | 17.80% | 12.06% | 14.16% |
|---|
S&P 500 Materials Index | 17.97% | 6.91% | 10.55% |
|---|
|
| AssetsNet |
$ 37,159,270
|
| Holdings Count | Holding |
104
|
| Advisory Fees Paid, Amount |
$ 230,757
|
| InvestmentCompanyPortfolioTurnover |
136.00%
|
| Additional Fund Statistics [Text Block] |
Fund Statistics as of March 31, 2026 - Net Assets$37,159,270
- Total Number of Portfolio Holdings104
- Portfolio Turnover Rate136%
- Total Advisory Fees Paid$230,757
|
| Holdings [Text Block] |
Holdings DiversificationFootnote Reference1 (% of Net Assets) as of March 31, 2026 Table SummaryValue | Value |
|---|
Other | 2.7% | Forest Products & Paper | 1.2% | Biotechnology | 2.0% | Iron & Steel | 7.7% | Packaging & Containers | 8.5% | Building Materials | 9.5% | Chemicals | 29.8% | Mining | 38.1% | |
| Largest Holdings [Text Block] |
10 Largest HoldingsFootnote Reference2 (% of Net Assets) as of March 31, 2026 Table SummaryLinde plc | 4.0% |
|---|
Newmont Corp. | 2.8% |
|---|
Freeport-McMoRan, Inc. | 2.5% |
|---|
Sherwin-Williams Co. | 2.3% |
|---|
Ecolab, Inc. | 2.2% |
|---|
Air Products and Chemicals, Inc. | 2.1% |
|---|
Corteva, Inc. | 2.0% |
|---|
Coeur Mining, Inc. | 1.7% |
|---|
Nucor Corp. | 1.7% |
|---|
Vulcan Materials Co. | 1.6% |
|---|
Total | 22.9% |
|---|
|
| Material Fund Change [Text Block] |
|
| C000010627 |
|
| Shareholder Report [Line Items] |
|
| Fund Name |
Basic Materials Fund
|
| Class Name |
Class H
|
| Trading Symbol |
RYBAX
|
| Annual or Semi-Annual Statement [Text Block] |
This annual shareholder report contains important information about the Basic Materials Fund for the period from April 1, 2025 to March 31, 2026.
|
| Shareholder Report Annual or Semi-Annual |
Annual Shareholder Report
|
| Additional Information [Text Block] |
You can find additional information about the fund at GuggenheimInvestments.com/mutual-funds/literature. You can also request this information by contacting 800 820 0888 or services@guggenheiminvestments.com.
|
| Additional Information Phone Number |
800 820 0888
|
| Additional Information Email |
<span style="box-sizing: border-box; color: rgb(67, 67, 67); display: inline; flex-wrap: nowrap; font-size: 10.6667px; font-weight: 400; grid-area: auto; line-height: 12.8px; margin: 0px; overflow: visible; text-align: left; text-align-last: auto; white-space-collapse: preserve-breaks;">services@guggenheiminvestments.com</span>
|
| Additional Information Website |
<span style="box-sizing: border-box; color: rgb(67, 67, 67); display: inline; flex-wrap: nowrap; font-size: 10.6667px; font-weight: 400; grid-area: auto; line-height: 12.8px; margin: 0px; overflow: visible; text-align: left; text-align-last: auto; white-space-collapse: preserve-breaks;">GuggenheimInvestments.com/mutual-funds/literature</span>
|
| Expenses [Text Block] |
What were the Fund's costs for the last year? * Based on a hypothetical $10,000 investment Table SummaryClass | Costs of a $10,000 Investment | Costs Paid as a % of a $10,000 Investment |
|---|
Class H | $195 | 1.63% |
|---|
Table Summary* | Excludes expenses of the underlying funds in which the fund invests, if any. |
|---|
|
| Expenses Paid, Amount |
$ 195
|
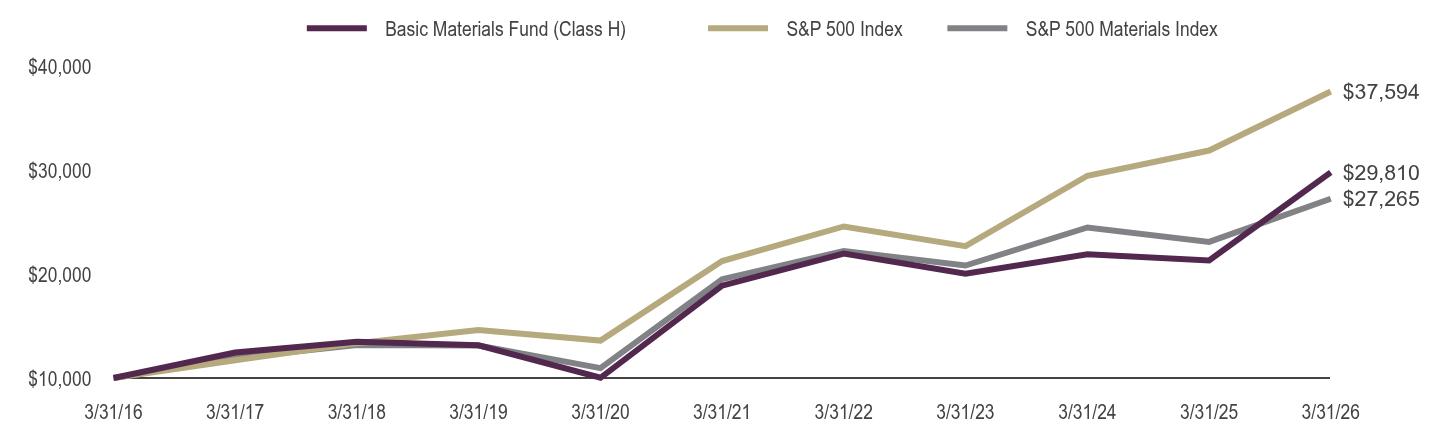
| Factors Affecting Performance [Text Block] |
What factors materially affected the Fund's performance over the last year? The industries that contributed the most to performance were gold, steel, and silver. Those that detracted the most were paper & plastic packaging products & materials, semiconductor materials & equipment, and forest products. The holdings that contributed the most to performance were Newmont Corp., Barrick Mining Corp., and Kinross Gold Corp. Those that detracted the most were Graphic Packaging Holding Co., International Paper Co., and FMC Corp. |
| Line Graph [Table Text Block] |
Table Summary | Basic Materials Fund (Class H) | S&P 500 Index | S&P 500 Materials Index |
|---|
3/31/16 | $10,000 | $10,000 | $10,000 |
|---|
3/31/17 | $12,458 | $11,717 | $11,922 |
|---|
3/31/18 | $13,502 | $13,357 | $13,178 |
|---|
3/31/19 | $13,153 | $14,625 | $13,121 |
|---|
3/31/20 | $10,022 | $13,605 | $10,947 |
|---|
3/31/21 | $18,891 | $21,271 | $19,517 |
|---|
3/31/22 | $21,994 | $24,599 | $22,234 |
|---|
3/31/23 | $20,048 | $22,698 | $20,837 |
|---|
3/31/24 | $21,910 | $29,480 | $24,499 |
|---|
3/31/25 | $21,320 | $31,913 | $23,111 |
|---|
3/31/26 | $29,810 | $37,594 | $27,265 |
|---|
|
| Average Annual Return [Table Text Block] |
Table SummaryAverage Annual Total Returns | One Year | Five Years | Ten Years |
|---|
Class H | 39.81% | 9.55% | 11.54% |
|---|
S&P 500 Index | 17.80% | 12.06% | 14.16% |
|---|
S&P 500 Materials Index | 17.97% | 6.91% | 10.55% |
|---|
|
| AssetsNet |
$ 37,159,270
|
| Holdings Count | Holding |
104
|
| Advisory Fees Paid, Amount |
$ 230,757
|
| InvestmentCompanyPortfolioTurnover |
136.00%
|
| Additional Fund Statistics [Text Block] |
Fund Statistics as of March 31, 2026 - Net Assets$37,159,270
- Total Number of Portfolio Holdings104
- Portfolio Turnover Rate136%
- Total Advisory Fees Paid$230,757
|
| Holdings [Text Block] |
Holdings DiversificationFootnote Reference1 (% of Net Assets) as of March 31, 2026 Table SummaryValue | Value |
|---|
Other | 2.7% | Forest Products & Paper | 1.2% | Biotechnology | 2.0% | Iron & Steel | 7.7% | Packaging & Containers | 8.5% | Building Materials | 9.5% | Chemicals | 29.8% | Mining | 38.1% | |
| Largest Holdings [Text Block] |
10 Largest HoldingsFootnote Reference2 (% of Net Assets) as of March 31, 2026 Table SummaryLinde plc | 4.0% |
|---|
Newmont Corp. | 2.8% |
|---|
Freeport-McMoRan, Inc. | 2.5% |
|---|
Sherwin-Williams Co. | 2.3% |
|---|
Ecolab, Inc. | 2.2% |
|---|
Air Products and Chemicals, Inc. | 2.1% |
|---|
Corteva, Inc. | 2.0% |
|---|
Coeur Mining, Inc. | 1.7% |
|---|
Nucor Corp. | 1.7% |
|---|
Vulcan Materials Co. | 1.6% |
|---|
Total | 22.9% |
|---|
|
| Material Fund Change [Text Block] |
|
| C000010594 |
|
| Shareholder Report [Line Items] |
|
| Fund Name |
Biotechnology Fund
|
| Class Name |
Investor Class
|
| Trading Symbol |
RYOIX
|
| Annual or Semi-Annual Statement [Text Block] |
This annual shareholder report contains important information about the Biotechnology Fund for the period from April 1, 2025 to March 31, 2026.
|
| Shareholder Report Annual or Semi-Annual |
Annual Shareholder Report
|
| Additional Information [Text Block] |
You can find additional information about the fund at GuggenheimInvestments.com/mutual-funds/literature. You can also request this information by contacting 800 820 0888 or services@guggenheiminvestments.com.
|
| Additional Information Phone Number |
800 820 0888
|
| Additional Information Email |
<span style="box-sizing: border-box; color: rgb(67, 67, 67); display: inline; flex-wrap: nowrap; font-size: 10.6667px; font-weight: 400; grid-area: auto; line-height: 12.8px; margin: 0px; overflow: visible; text-align: left; text-align-last: auto; white-space-collapse: preserve-breaks;">services@guggenheiminvestments.com</span>
|
| Additional Information Website |
<span style="box-sizing: border-box; color: rgb(67, 67, 67); display: inline; flex-wrap: nowrap; font-size: 10.6667px; font-weight: 400; grid-area: auto; line-height: 12.8px; margin: 0px; overflow: visible; text-align: left; text-align-last: auto; white-space-collapse: preserve-breaks;">GuggenheimInvestments.com/mutual-funds/literature</span>
|
| Expenses [Text Block] |
What were the Fund's costs for the last year? * Based on a hypothetical $10,000 investment Table SummaryClass | Costs of a $10,000 Investment | Costs Paid as a % of a $10,000 Investment |
|---|
Investor Class | $162 | 1.38% |
|---|
Table Summary* | Excludes expenses of the underlying funds in which the fund invests, if any. |
|---|
|
| Expenses Paid, Amount |
$ 162
|
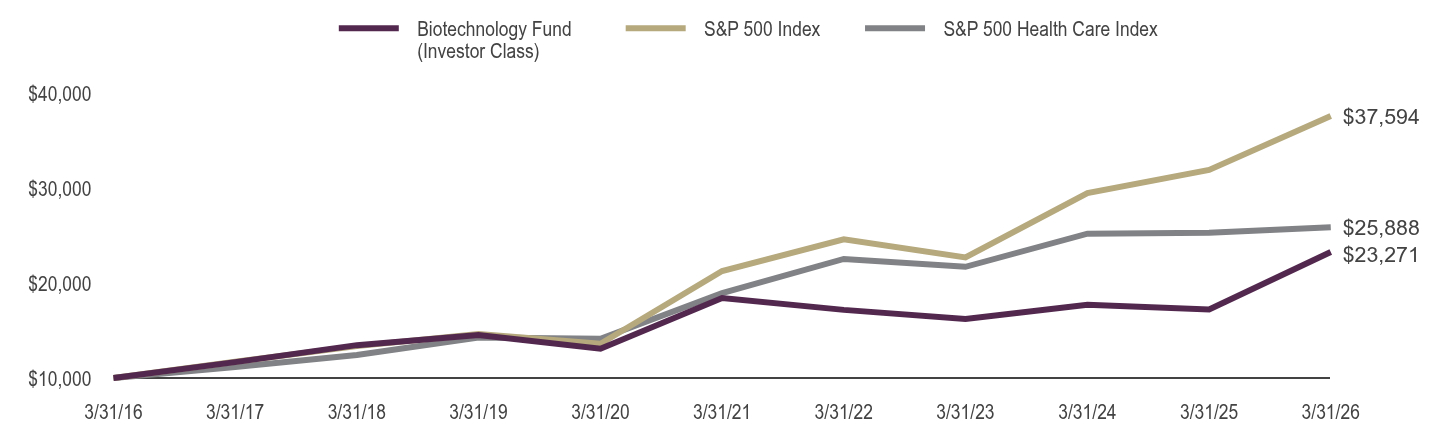
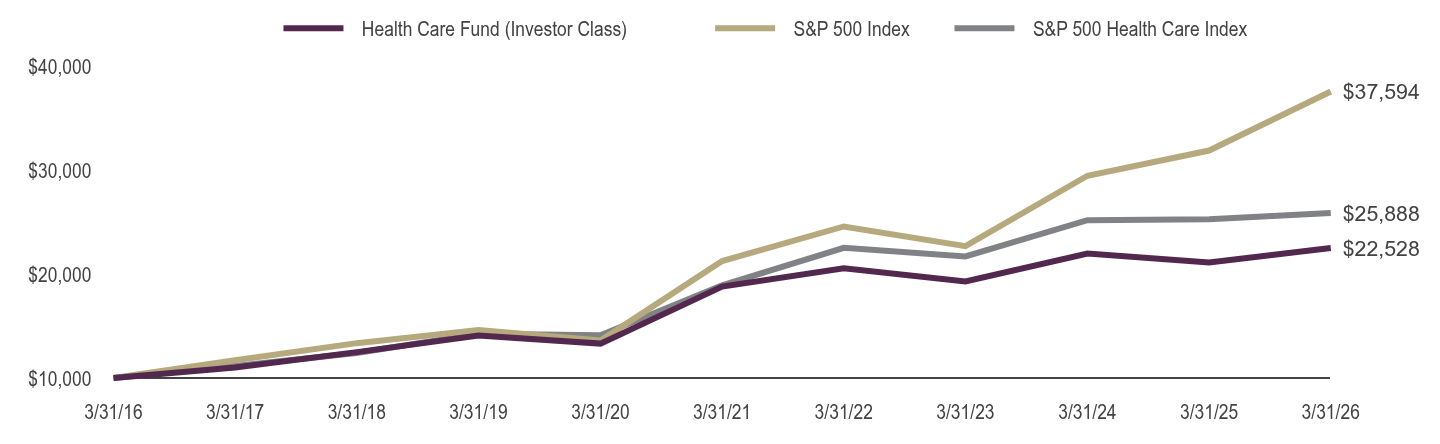
| Factors Affecting Performance [Text Block] |
What factors materially affected the Fund's performance over the last year? The industries that contributed the most to performance were biotechnology, pharmaceuticals, and life sciences tools & services. None detracted from performance. The holdings that contributed the most to performance were Insmed Inc., Arrowhead Pharmaceuticals, Inc., and Exact Sciences Corp. Those that detracted the most were Sarepta Therapeutics, Inc., ADMA Biologics, Inc., and BioMarin Pharmaceutical, Inc. |
| Line Graph [Table Text Block] |
Table Summary | Biotechnology Fund (Investor Class) | S&P 500 Index | S&P 500 Health Care Index |
|---|
3/31/16 | $10,000 | $10,000 | $10,000 |
|---|
3/31/17 | $11,671 | $11,717 | $11,159 |
|---|
3/31/18 | $13,460 | $13,357 | $12,417 |
|---|
3/31/19 | $14,529 | $14,625 | $14,266 |
|---|
3/31/20 | $13,090 | $13,605 | $14,121 |
|---|
3/31/21 | $18,430 | $21,271 | $18,928 |
|---|
3/31/22 | $17,175 | $24,599 | $22,542 |
|---|
3/31/23 | $16,206 | $22,698 | $21,709 |
|---|
3/31/24 | $17,713 | $29,480 | $25,202 |
|---|
3/31/25 | $17,209 | $31,913 | $25,303 |
|---|
3/31/26 | $23,271 | $37,594 | $25,888 |
|---|
|
| Average Annual Return [Table Text Block] |
Table SummaryAverage Annual Total Returns | One Year | Five Years | Ten Years |
|---|
Investor Class | 35.22% | 4.78% | 8.81% |
|---|
S&P 500 Index | 17.80% | 12.06% | 14.16% |
|---|
S&P 500 Health Care Index | 2.31% | 6.46% | 9.98% |
|---|
|
| AssetsNet |
$ 133,913,068
|
| Holdings Count | Holding |
75
|
| Advisory Fees Paid, Amount |
$ 812,727
|
| InvestmentCompanyPortfolioTurnover |
75.00%
|
| Additional Fund Statistics [Text Block] |
Fund Statistics as of March 31, 2026 - Net Assets$133,913,068
- Total Number of Portfolio Holdings75
- Portfolio Turnover Rate75%
- Total Advisory Fees Paid$812,727
|
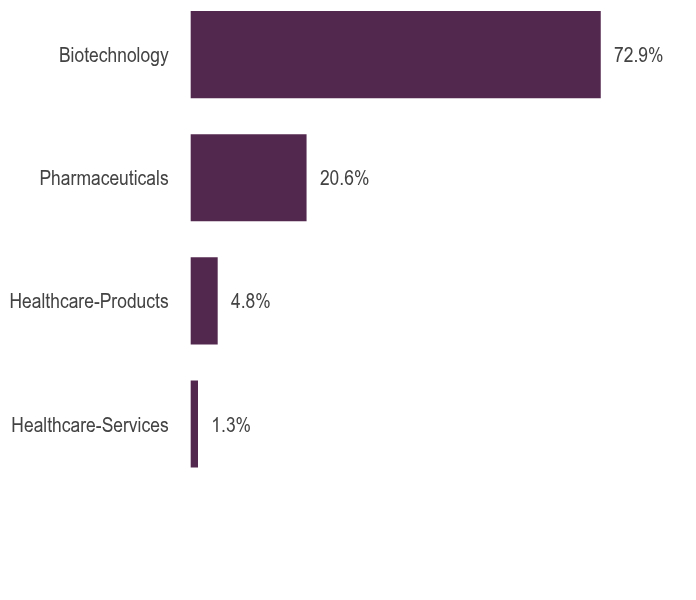
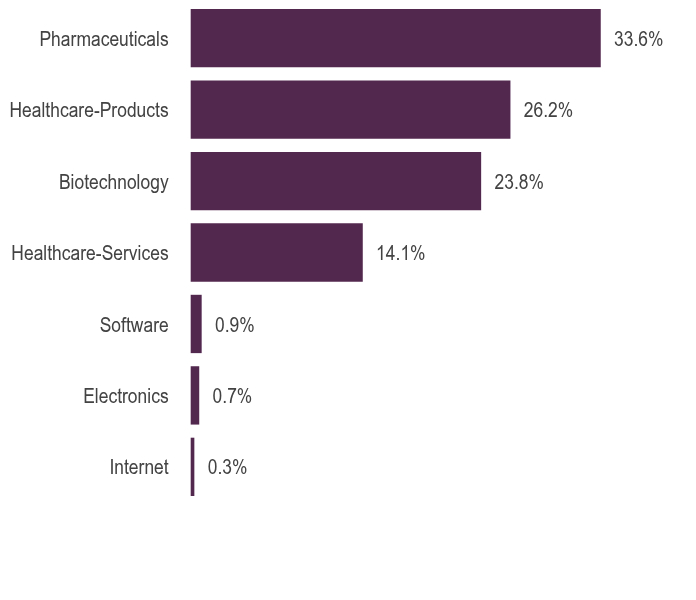
| Holdings [Text Block] |
Holdings DiversificationFootnote Reference1 (% of Net Assets) as of March 31, 2026 Table SummaryValue | Value |
|---|
Healthcare-Services | 1.3% | Healthcare-Products | 4.8% | Pharmaceuticals | 20.6% | Biotechnology | 72.9% | |
| Largest Holdings [Text Block] |
10 Largest HoldingsFootnote Reference2 (% of Net Assets) as of March 31, 2026 Table SummaryAbbVie, Inc. | 7.5% |
|---|
Amgen, Inc. | 5.3% |
|---|
Gilead Sciences, Inc. | 5.0% |
|---|
Vertex Pharmaceuticals, Inc. | 4.0% |
|---|
Regeneron Pharmaceuticals, Inc. | 3.6% |
|---|
Alnylam Pharmaceuticals, Inc. | 2.6% |
|---|
Insmed, Inc. | 2.5% |
|---|
BeOne Medicines Ltd., ADR | 2.3% |
|---|
Natera, Inc. | 2.1% |
|---|
United Therapeutics Corp. | 2.1% |
|---|
Total | 37.0% |
|---|
|
| Material Fund Change [Text Block] |
|
| C000010596 |
|
| Shareholder Report [Line Items] |
|
| Fund Name |
Biotechnology Fund
|
| Class Name |
Class A
|
| Trading Symbol |
RYBOX
|
| Annual or Semi-Annual Statement [Text Block] |
This annual shareholder report contains important information about the Biotechnology Fund for the period from April 1, 2025 to March 31, 2026.
|
| Shareholder Report Annual or Semi-Annual |
Annual Shareholder Report
|
| Additional Information [Text Block] |
You can find additional information about the fund at GuggenheimInvestments.com/mutual-funds/literature. You can also request this information by contacting 800 820 0888 or services@guggenheiminvestments.com.
|
| Additional Information Phone Number |
800 820 0888
|
| Additional Information Email |
<span style="box-sizing: border-box; color: rgb(67, 67, 67); display: inline; flex-wrap: nowrap; font-size: 10.6667px; font-weight: 400; grid-area: auto; line-height: 12.8px; margin: 0px; overflow: visible; text-align: left; text-align-last: auto; white-space-collapse: preserve-breaks;">services@guggenheiminvestments.com</span>
|
| Additional Information Website |
<span style="box-sizing: border-box; color: rgb(67, 67, 67); display: inline; flex-wrap: nowrap; font-size: 10.6667px; font-weight: 400; grid-area: auto; line-height: 12.8px; margin: 0px; overflow: visible; text-align: left; text-align-last: auto; white-space-collapse: preserve-breaks;">GuggenheimInvestments.com/mutual-funds/literature</span>
|
| Expenses [Text Block] |
What were the Fund's costs for the last year? * Based on a hypothetical $10,000 investment Table SummaryClass | Costs of a $10,000 Investment | Costs Paid as a % of a $10,000 Investment |
|---|
Class A | $191 | 1.63% |
|---|
Table Summary* | Excludes expenses of the underlying funds in which the fund invests, if any. |
|---|
|
| Expenses Paid, Amount |
$ 191
|
| Factors Affecting Performance [Text Block] |
What factors materially affected the Fund's performance over the last year? The industries that contributed the most to performance were biotechnology, pharmaceuticals, and life sciences tools & services. None detracted from performance. The holdings that contributed the most to performance were Insmed Inc., Arrowhead Pharmaceuticals, Inc., and Exact Sciences Corp. Those that detracted the most were Sarepta Therapeutics, Inc., ADMA Biologics, Inc., and BioMarin Pharmaceutical, Inc. |
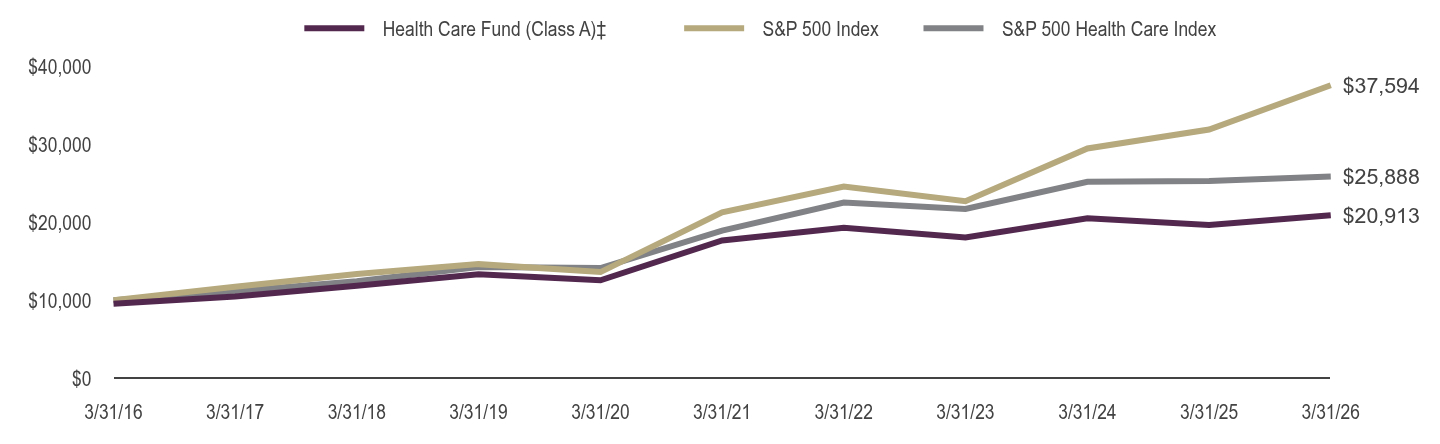
| Line Graph [Table Text Block] |
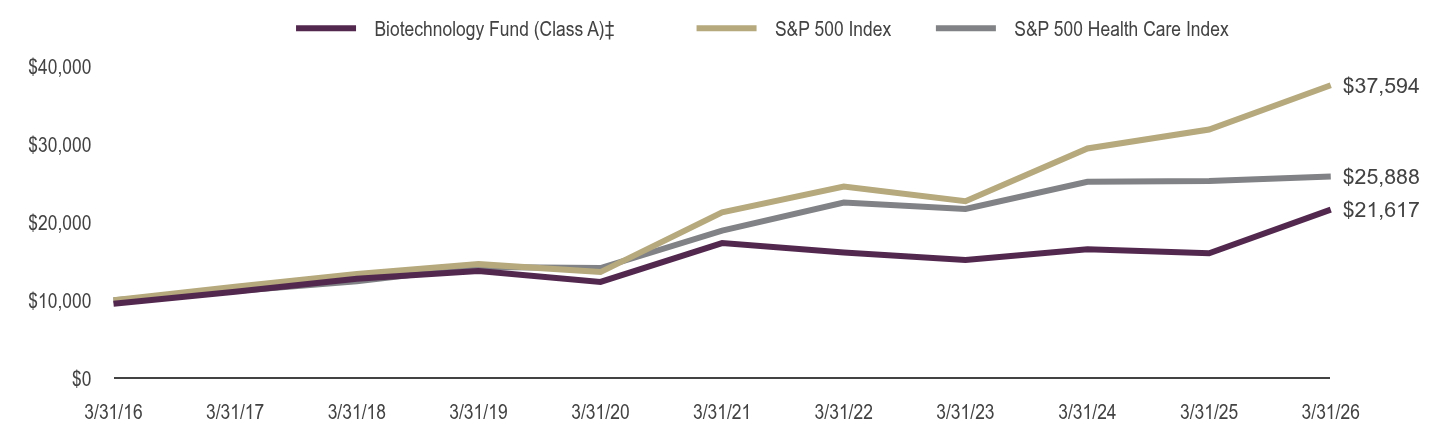
Table Summary | Biotechnology Fund (Class A)‡ | S&P 500 Index | S&P 500 Health Care Index |
|---|
3/31/16 | $9,525 | $10,000 | $10,000 |
|---|
3/31/17 | $11,089 | $11,717 | $11,159 |
|---|
3/31/18 | $12,756 | $13,357 | $12,417 |
|---|
3/31/19 | $13,735 | $14,625 | $14,266 |
|---|
3/31/20 | $12,343 | $13,605 | $14,121 |
|---|
3/31/21 | $17,335 | $21,271 | $18,928 |
|---|
3/31/22 | $16,114 | $24,599 | $22,542 |
|---|
3/31/23 | $15,168 | $22,698 | $21,709 |
|---|
3/31/24 | $16,538 | $29,480 | $25,202 |
|---|
3/31/25 | $16,026 | $31,913 | $25,303 |
|---|
3/31/26 | $21,617 | $37,594 | $25,888 |
|---|
|
| Average Annual Return [Table Text Block] |
Table SummaryAverage Annual Total Returns | One Year | Five Years | Ten Years |
|---|
Class A (without sales charge) | 34.88% | 4.51% | 8.54% |
|---|
Class A (with sales charge) ‡ | 28.48% | 3.50% | 8.01% |
|---|
S&P 500 Index | 17.80% | 12.06% | 14.16% |
|---|
S&P 500 Health Care Index | 2.31% | 6.46% | 9.98% |
|---|
|
| AssetsNet |
$ 133,913,068
|
| Holdings Count | Holding |
75
|
| Advisory Fees Paid, Amount |
$ 812,727
|
| InvestmentCompanyPortfolioTurnover |
75.00%
|
| Additional Fund Statistics [Text Block] |
Fund Statistics as of March 31, 2026 - Net Assets$133,913,068
- Total Number of Portfolio Holdings75
- Portfolio Turnover Rate75%
- Total Advisory Fees Paid$812,727
|
| Holdings [Text Block] |
Holdings DiversificationFootnote Reference1 (% of Net Assets) as of March 31, 2026 Table SummaryValue | Value |
|---|
Healthcare-Services | 1.3% | Healthcare-Products | 4.8% | Pharmaceuticals | 20.6% | Biotechnology | 72.9% | |
| Largest Holdings [Text Block] |
10 Largest HoldingsFootnote Reference2 (% of Net Assets) as of March 31, 2026 Table SummaryAbbVie, Inc. | 7.5% |
|---|
Amgen, Inc. | 5.3% |
|---|
Gilead Sciences, Inc. | 5.0% |
|---|
Vertex Pharmaceuticals, Inc. | 4.0% |
|---|
Regeneron Pharmaceuticals, Inc. | 3.6% |
|---|
Alnylam Pharmaceuticals, Inc. | 2.6% |
|---|
Insmed, Inc. | 2.5% |
|---|
BeOne Medicines Ltd., ADR | 2.3% |
|---|
Natera, Inc. | 2.1% |
|---|
United Therapeutics Corp. | 2.1% |
|---|
Total | 37.0% |
|---|
|
| Material Fund Change [Text Block] |
|
| C000010597 |
|
| Shareholder Report [Line Items] |
|
| Fund Name |
Biotechnology Fund
|
| Class Name |
Class C
|
| Trading Symbol |
RYCFX
|
| Annual or Semi-Annual Statement [Text Block] |
This annual shareholder report contains important information about the Biotechnology Fund for the period from April 1, 2025 to March 31, 2026.
|
| Shareholder Report Annual or Semi-Annual |
Annual Shareholder Report
|
| Additional Information [Text Block] |
You can find additional information about the fund at GuggenheimInvestments.com/mutual-funds/literature. You can also request this information by contacting 800 820 0888 or services@guggenheiminvestments.com.
|
| Additional Information Phone Number |
800 820 0888
|
| Additional Information Email |
<span style="box-sizing: border-box; color: rgb(67, 67, 67); display: inline; flex-wrap: nowrap; font-size: 10.6667px; font-weight: 400; grid-area: auto; line-height: 12.8px; margin: 0px; overflow: visible; text-align: left; text-align-last: auto; white-space-collapse: preserve-breaks;">services@guggenheiminvestments.com</span>
|
| Additional Information Website |
<span style="box-sizing: border-box; color: rgb(67, 67, 67); display: inline; flex-wrap: nowrap; font-size: 10.6667px; font-weight: 400; grid-area: auto; line-height: 12.8px; margin: 0px; overflow: visible; text-align: left; text-align-last: auto; white-space-collapse: preserve-breaks;">GuggenheimInvestments.com/mutual-funds/literature</span>
|
| Expenses [Text Block] |
What were the Fund's costs for the last year? * Based on a hypothetical $10,000 investment Table SummaryClass | Costs of a $10,000 Investment | Costs Paid as a % of a $10,000 Investment |
|---|
Class C | $278 | 2.38% |
|---|
Table Summary* | Excludes expenses of the underlying funds in which the fund invests, if any. |
|---|
|
| Expenses Paid, Amount |
$ 278
|
| Factors Affecting Performance [Text Block] |
What factors materially affected the Fund's performance over the last year? The industries that contributed the most to performance were biotechnology, pharmaceuticals, and life sciences tools & services. None detracted from performance. The holdings that contributed the most to performance were Insmed Inc., Arrowhead Pharmaceuticals, Inc., and Exact Sciences Corp. Those that detracted the most were Sarepta Therapeutics, Inc., ADMA Biologics, Inc., and BioMarin Pharmaceutical, Inc. |
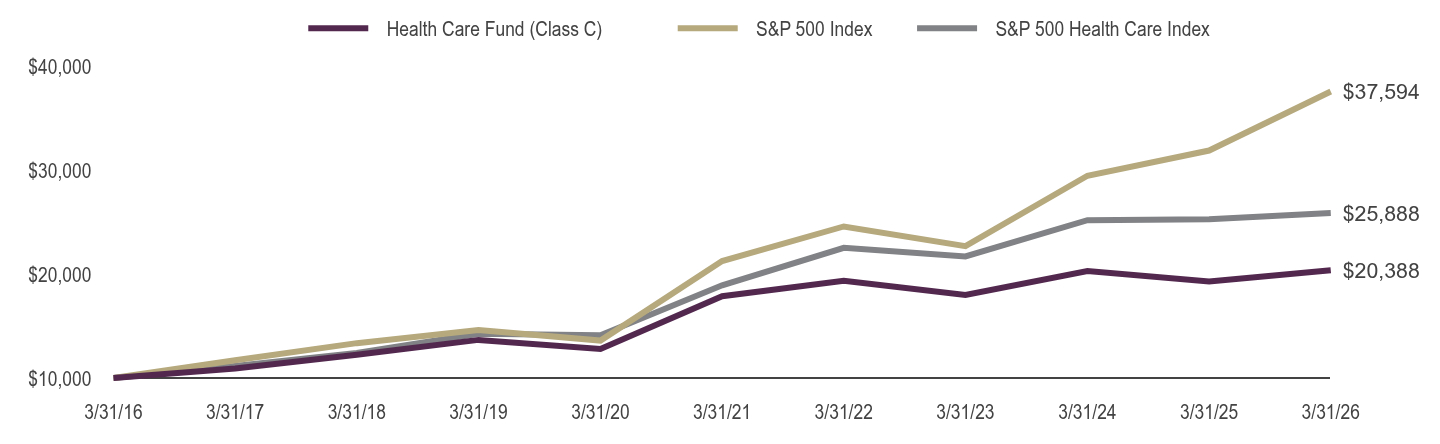
| Line Graph [Table Text Block] |
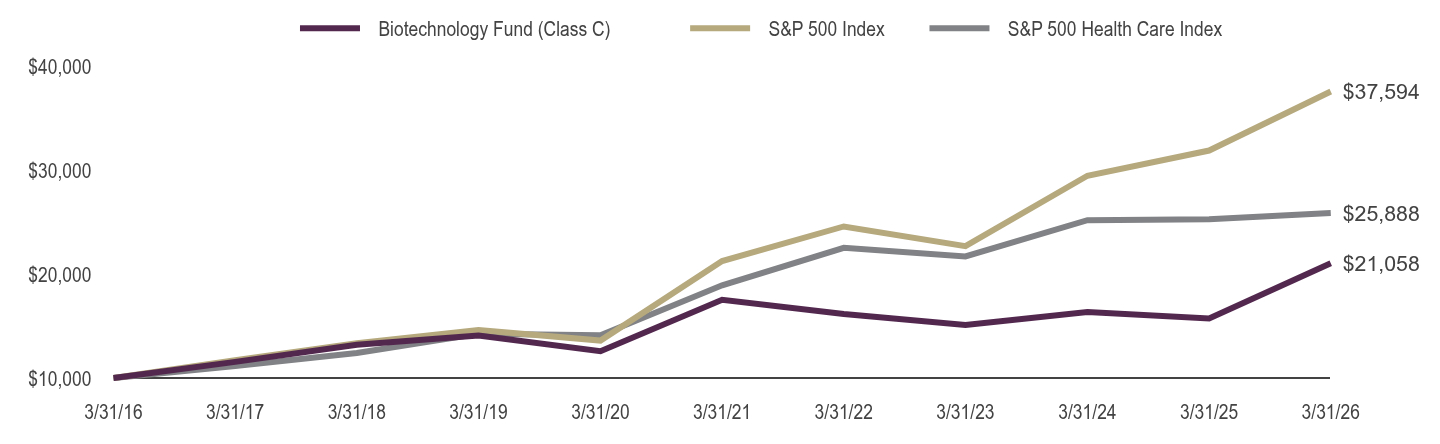
Table Summary | Biotechnology Fund (Class C) | S&P 500 Index | S&P 500 Health Care Index |
|---|
3/31/16 | $10,000 | $10,000 | $10,000 |
|---|
3/31/17 | $11,555 | $11,717 | $11,159 |
|---|
3/31/18 | $13,194 | $13,357 | $12,417 |
|---|
3/31/19 | $14,101 | $14,625 | $14,266 |
|---|
3/31/20 | $12,578 | $13,605 | $14,121 |
|---|
3/31/21 | $17,531 | $21,271 | $18,928 |
|---|
3/31/22 | $16,175 | $24,599 | $22,542 |
|---|
3/31/23 | $15,110 | $22,698 | $21,709 |
|---|
3/31/24 | $16,353 | $29,480 | $25,202 |
|---|
3/31/25 | $15,728 | $31,913 | $25,303 |
|---|
3/31/26 | $21,058 | $37,594 | $25,888 |
|---|
|
| Average Annual Return [Table Text Block] |
Table SummaryAverage Annual Total Returns | One Year | Five Years | Ten Years |
|---|
Class C (without CDSC) | 33.89% | 3.73% | 7.73% |
|---|
Class C (with CDSC) ‡ | 32.89% | 3.73% | 7.73% |
|---|
S&P 500 Index | 17.80% | 12.06% | 14.16% |
|---|
S&P 500 Health Care Index | 2.31% | 6.46% | 9.98% |
|---|
|
| AssetsNet |
$ 133,913,068
|
| Holdings Count | Holding |
75
|
| Advisory Fees Paid, Amount |
$ 812,727
|
| InvestmentCompanyPortfolioTurnover |
75.00%
|
| Additional Fund Statistics [Text Block] |
Fund Statistics as of March 31, 2026 - Net Assets$133,913,068
- Total Number of Portfolio Holdings75
- Portfolio Turnover Rate75%
- Total Advisory Fees Paid$812,727
|
| Holdings [Text Block] |
Holdings DiversificationFootnote Reference1 (% of Net Assets) as of March 31, 2026 Table SummaryValue | Value |
|---|
Healthcare-Services | 1.3% | Healthcare-Products | 4.8% | Pharmaceuticals | 20.6% | Biotechnology | 72.9% | |
| Largest Holdings [Text Block] |
10 Largest HoldingsFootnote Reference2 (% of Net Assets) as of March 31, 2026 Table SummaryAbbVie, Inc. | 7.5% |
|---|
Amgen, Inc. | 5.3% |
|---|
Gilead Sciences, Inc. | 5.0% |
|---|
Vertex Pharmaceuticals, Inc. | 4.0% |
|---|
Regeneron Pharmaceuticals, Inc. | 3.6% |
|---|
Alnylam Pharmaceuticals, Inc. | 2.6% |
|---|
Insmed, Inc. | 2.5% |
|---|
BeOne Medicines Ltd., ADR | 2.3% |
|---|
Natera, Inc. | 2.1% |
|---|
United Therapeutics Corp. | 2.1% |
|---|
Total | 37.0% |
|---|
|
| Material Fund Change [Text Block] |
|
| C000010595 |
|
| Shareholder Report [Line Items] |
|
| Fund Name |
Biotechnology Fund
|
| Class Name |
Class H
|
| Trading Symbol |
RYOAX
|
| Annual or Semi-Annual Statement [Text Block] |
This annual shareholder report contains important information about the Biotechnology Fund for the period from April 1, 2025 to March 31, 2026.
|
| Shareholder Report Annual or Semi-Annual |
Annual Shareholder Report
|
| Additional Information [Text Block] |
You can find additional information about the fund at GuggenheimInvestments.com/mutual-funds/literature. You can also request this information by contacting 800 820 0888 or services@guggenheiminvestments.com.
|
| Additional Information Phone Number |
800 820 0888
|
| Additional Information Email |
<span style="box-sizing: border-box; color: rgb(67, 67, 67); display: inline; flex-wrap: nowrap; font-size: 10.6667px; font-weight: 400; grid-area: auto; line-height: 12.8px; margin: 0px; overflow: visible; text-align: left; text-align-last: auto; white-space-collapse: preserve-breaks;">services@guggenheiminvestments.com</span>
|
| Additional Information Website |
<span style="box-sizing: border-box; color: rgb(67, 67, 67); display: inline; flex-wrap: nowrap; font-size: 10.6667px; font-weight: 400; grid-area: auto; line-height: 12.8px; margin: 0px; overflow: visible; text-align: left; text-align-last: auto; white-space-collapse: preserve-breaks;">GuggenheimInvestments.com/mutual-funds/literature</span>
|
| Expenses [Text Block] |
What were the Fund's costs for the last year? * Based on a hypothetical $10,000 investment Table SummaryClass | Costs of a $10,000 Investment | Costs Paid as a % of a $10,000 Investment |
|---|
Class H | $191 | 1.63% |
|---|
Table Summary* | Excludes expenses of the underlying funds in which the fund invests, if any. |
|---|
|
| Expenses Paid, Amount |
$ 191
|
| Factors Affecting Performance [Text Block] |
What factors materially affected the Fund's performance over the last year? The industries that contributed the most to performance were biotechnology, pharmaceuticals, and life sciences tools & services. None detracted from performance. The holdings that contributed the most to performance were Insmed Inc., Arrowhead Pharmaceuticals, Inc., and Exact Sciences Corp. Those that detracted the most were Sarepta Therapeutics, Inc., ADMA Biologics, Inc., and BioMarin Pharmaceutical, Inc. |
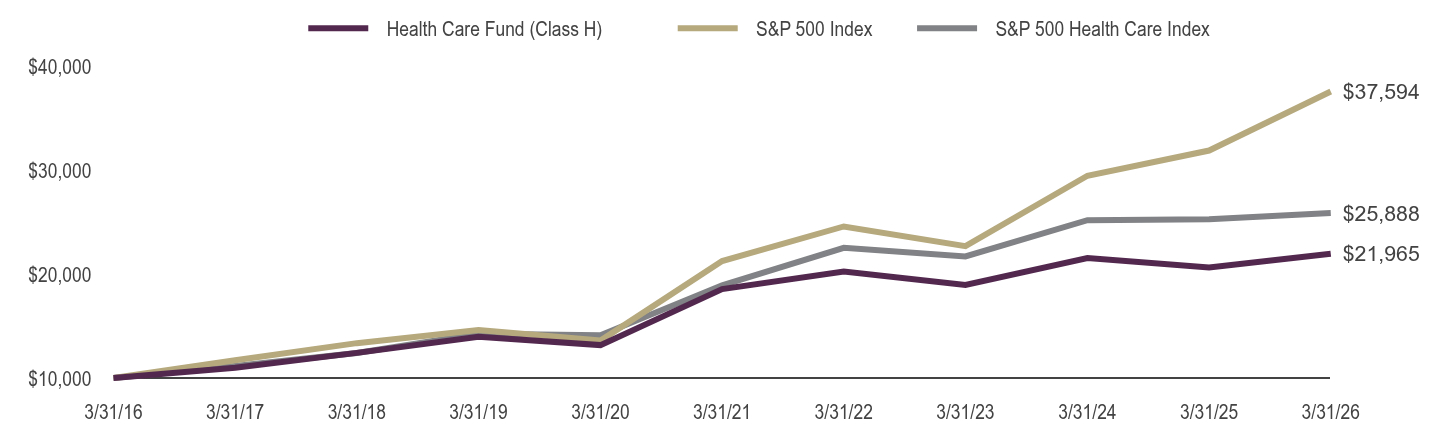
| Line Graph [Table Text Block] |
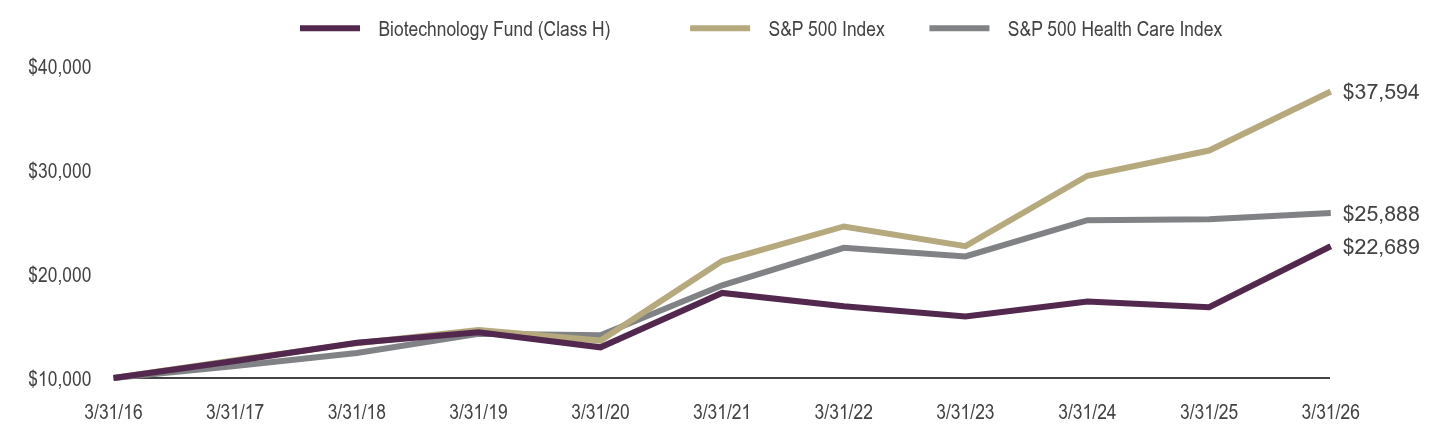
Table Summary | Biotechnology Fund (Class H) | S&P 500 Index | S&P 500 Health Care Index |
|---|
3/31/16 | $10,000 | $10,000 | $10,000 |
|---|
3/31/17 | $11,639 | $11,717 | $11,159 |
|---|
3/31/18 | $13,389 | $13,357 | $12,417 |
|---|
3/31/19 | $14,414 | $14,625 | $14,266 |
|---|
3/31/20 | $12,955 | $13,605 | $14,121 |
|---|
3/31/21 | $18,195 | $21,271 | $18,928 |
|---|
3/31/22 | $16,914 | $24,599 | $22,542 |
|---|
3/31/23 | $15,921 | $22,698 | $21,709 |
|---|
3/31/24 | $17,358 | $29,480 | $25,202 |
|---|
3/31/25 | $16,820 | $31,913 | $25,303 |
|---|
3/31/26 | $22,689 | $37,594 | $25,888 |
|---|
|
| Average Annual Return [Table Text Block] |
Table SummaryAverage Annual Total Returns | One Year | Five Years | Ten Years |
|---|
Class H | 34.89% | 4.51% | 8.54% |
|---|
S&P 500 Index | 17.80% | 12.06% | 14.16% |
|---|
S&P 500 Health Care Index | 2.31% | 6.46% | 9.98% |
|---|
|
| AssetsNet |
$ 133,913,068
|
| Holdings Count | Holding |
75
|
| Advisory Fees Paid, Amount |
$ 812,727
|
| InvestmentCompanyPortfolioTurnover |
75.00%
|
| Additional Fund Statistics [Text Block] |
Fund Statistics as of March 31, 2026 - Net Assets$133,913,068
- Total Number of Portfolio Holdings75
- Portfolio Turnover Rate75%
- Total Advisory Fees Paid$812,727
|
| Holdings [Text Block] |
Holdings DiversificationFootnote Reference1 (% of Net Assets) as of March 31, 2026 Table SummaryValue | Value |
|---|
Healthcare-Services | 1.3% | Healthcare-Products | 4.8% | Pharmaceuticals | 20.6% | Biotechnology | 72.9% | |
| Largest Holdings [Text Block] |
10 Largest HoldingsFootnote Reference2 (% of Net Assets) as of March 31, 2026 Table SummaryAbbVie, Inc. | 7.5% |
|---|
Amgen, Inc. | 5.3% |
|---|
Gilead Sciences, Inc. | 5.0% |
|---|
Vertex Pharmaceuticals, Inc. | 4.0% |
|---|
Regeneron Pharmaceuticals, Inc. | 3.6% |
|---|
Alnylam Pharmaceuticals, Inc. | 2.6% |
|---|
Insmed, Inc. | 2.5% |
|---|
BeOne Medicines Ltd., ADR | 2.3% |
|---|
Natera, Inc. | 2.1% |
|---|
United Therapeutics Corp. | 2.1% |
|---|
Total | 37.0% |
|---|
|
| Material Fund Change [Text Block] |
|
| C000010630 |
|
| Shareholder Report [Line Items] |
|
| Fund Name |
Consumer Products Fund
|
| Class Name |
Investor Class
|
| Trading Symbol |
RYCIX
|
| Annual or Semi-Annual Statement [Text Block] |
This annual shareholder report contains important information about the Consumer Products Fund for the period from April 1, 2025 to March 31, 2026.
|
| Shareholder Report Annual or Semi-Annual |
Annual Shareholder Report
|
| Additional Information [Text Block] |
You can find additional information about the fund at GuggenheimInvestments.com/mutual-funds/literature. You can also request this information by contacting 800 820 0888 or services@guggenheiminvestments.com.
|
| Additional Information Phone Number |
800 820 0888
|
| Additional Information Email |
<span style="box-sizing: border-box; color: rgb(67, 67, 67); display: inline; flex-wrap: nowrap; font-size: 10.6667px; font-weight: 400; grid-area: auto; line-height: 12.8px; margin: 0px; overflow: visible; text-align: left; text-align-last: auto; white-space-collapse: preserve-breaks;">services@guggenheiminvestments.com</span>
|
| Additional Information Website |
<span style="box-sizing: border-box; color: rgb(67, 67, 67); display: inline; flex-wrap: nowrap; font-size: 10.6667px; font-weight: 400; grid-area: auto; line-height: 12.8px; margin: 0px; overflow: visible; text-align: left; text-align-last: auto; white-space-collapse: preserve-breaks;">GuggenheimInvestments.com/mutual-funds/literature</span>
|
| Expenses [Text Block] |
What were the Fund's costs for the last year? * Based on a hypothetical $10,000 investment Table SummaryClass | Costs of a $10,000 Investment | Costs Paid as a % of a $10,000 Investment |
|---|
Investor Class | $136 | 1.39% |
|---|
Table Summary* | Excludes expenses of the underlying funds in which the fund invests, if any. |
|---|
|
| Expenses Paid, Amount |
$ 136
|
| Factors Affecting Performance [Text Block] |
What factors materially affected the Fund's performance over the last year? The industries that contributed the most to performance were agricultural products & services, tobacco, and soft drinks & non-alcoholic beverages. Those that detracted the most were packaged foods & meats, household products, and personal care products. The holdings that contributed the most to performance were Casey’s General Stores, Inc., Archer-Daniels-Midland Co., and Bunge Global, SA. Those that detracted the most were BellRing Brands, Inc., Procter & Gamble Co., and Kimberly-Clark Corp. |
| Line Graph [Table Text Block] |
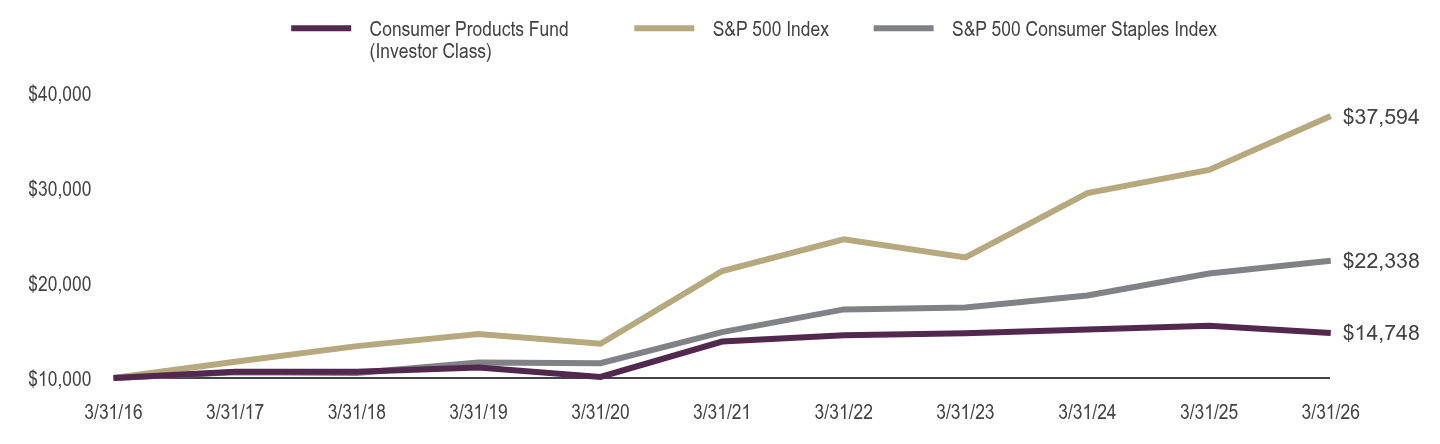
Table Summary | Consumer Products Fund (Investor Class) | S&P 500 Index | S&P 500 Consumer Staples Index |
|---|
3/31/16 | $10,000 | $10,000 | $10,000 |
|---|
3/31/17 | $10,662 | $11,717 | $10,616 |
|---|
3/31/18 | $10,658 | $13,357 | $10,522 |
|---|
3/31/19 | $11,094 | $14,625 | $11,625 |
|---|
3/31/20 | $10,116 | $13,605 | $11,557 |
|---|
3/31/21 | $13,836 | $21,271 | $14,836 |
|---|
3/31/22 | $14,512 | $24,599 | $17,225 |
|---|
3/31/23 | $14,715 | $22,698 | $17,436 |
|---|
3/31/24 | $15,114 | $29,480 | $18,689 |
|---|
3/31/25 | $15,496 | $31,913 | $21,012 |
|---|
3/31/26 | $14,748 | $37,594 | $22,338 |
|---|
|
| Average Annual Return [Table Text Block] |
Table SummaryAverage Annual Total Returns | One Year | Five Years | Ten Years |
|---|
Investor Class | -4.84% | 1.28% | 3.96% |
|---|
S&P 500 Index | 17.80% | 12.06% | 14.16% |
|---|
S&P 500 Consumer Staples Index | 6.31% | 8.53% | 8.37% |
|---|
|
| AssetsNet |
$ 30,453,679
|
| Holdings Count | Holding |
70
|
| Advisory Fees Paid, Amount |
$ 283,491
|
| InvestmentCompanyPortfolioTurnover |
45.00%
|
| Additional Fund Statistics [Text Block] |
Fund Statistics as of March 31, 2026 - Net Assets$30,453,679
- Total Number of Portfolio Holdings70
- Portfolio Turnover Rate45%
- Total Advisory Fees Paid$283,491
|
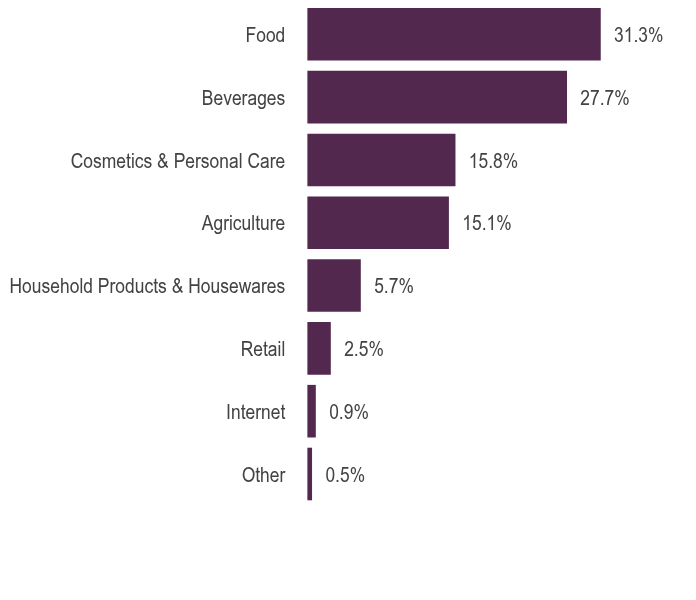
| Holdings [Text Block] |
Holdings DiversificationFootnote Reference1 (% of Net Assets) as of March 31, 2026 Table SummaryValue | Value |
|---|
Other | 0.5% | Internet | 0.9% | Retail | 2.5% | Household Products & Housewares | 5.7% | Agriculture | 15.1% | Cosmetics & Personal Care | 15.8% | Beverages | 27.7% | Food | 31.3% | |
| Largest Holdings [Text Block] |
10 Largest HoldingsFootnote Reference2 (% of Net Assets) as of March 31, 2026 Table SummaryProcter & Gamble Co. | 5.6% |
|---|
Coca-Cola Co. | 5.0% |
|---|
Philip Morris International, Inc. | 4.8% |
|---|
PepsiCo, Inc. | 4.5% |
|---|
Altria Group, Inc. | 3.7% |
|---|
Mondelez International, Inc. — Class A | 3.3% |
|---|
Colgate-Palmolive Co. | 3.0% |
|---|
Monster Beverage Corp. | 2.5% |
|---|
Hershey Co. | 2.3% |
|---|
Kroger Co. | 2.2% |
|---|
Total | 36.9% |
|---|
|
| Material Fund Change [Text Block] |
|
| C000010632 |
|
| Shareholder Report [Line Items] |
|
| Fund Name |
Consumer Products Fund
|
| Class Name |
Class A
|
| Trading Symbol |
RYPDX
|
| Annual or Semi-Annual Statement [Text Block] |
This annual shareholder report contains important information about the Consumer Products Fund for the period from April 1, 2025 to March 31, 2026.
|
| Shareholder Report Annual or Semi-Annual |
Annual Shareholder Report
|
| Additional Information [Text Block] |
You can find additional information about the fund at GuggenheimInvestments.com/mutual-funds/literature. You can also request this information by contacting 800 820 0888 or services@guggenheiminvestments.com.
|
| Additional Information Phone Number |
800 820 0888
|
| Additional Information Email |
<span style="box-sizing: border-box; color: rgb(67, 67, 67); display: inline; flex-wrap: nowrap; font-size: 10.6667px; font-weight: 400; grid-area: auto; line-height: 12.8px; margin: 0px; overflow: visible; text-align: left; text-align-last: auto; white-space-collapse: preserve-breaks;">services@guggenheiminvestments.com</span>
|
| Additional Information Website |
<span style="box-sizing: border-box; color: rgb(67, 67, 67); display: inline; flex-wrap: nowrap; font-size: 10.6667px; font-weight: 400; grid-area: auto; line-height: 12.8px; margin: 0px; overflow: visible; text-align: left; text-align-last: auto; white-space-collapse: preserve-breaks;">GuggenheimInvestments.com/mutual-funds/literature</span>
|
| Expenses [Text Block] |
What were the Fund's costs for the last year? * Based on a hypothetical $10,000 investment Table SummaryClass | Costs of a $10,000 Investment | Costs Paid as a % of a $10,000 Investment |
|---|
Class A | $160 | 1.64% |
|---|
Table Summary* | Excludes expenses of the underlying funds in which the fund invests, if any. |
|---|
|
| Expenses Paid, Amount |
$ 160
|
| Factors Affecting Performance [Text Block] |
What factors materially affected the Fund's performance over the last year? The industries that contributed the most to performance were agricultural products & services, tobacco, and soft drinks & non-alcoholic beverages. Those that detracted the most were packaged foods & meats, household products, and personal care products. The holdings that contributed the most to performance were Casey’s General Stores, Inc., Archer-Daniels-Midland Co., and Bunge Global, SA. Those that detracted the most were BellRing Brands, Inc., Procter & Gamble Co., and Kimberly-Clark Corp. |
| Line Graph [Table Text Block] |
Table Summary | Consumer Products Fund (Class A)‡ | S&P 500 Index | S&P 500 Consumer Staples Index |
|---|
3/31/16 | $9,525 | $10,000 | $10,000 |
|---|
3/31/17 | $10,130 | $11,717 | $10,616 |
|---|
3/31/18 | $10,103 | $13,357 | $10,522 |
|---|
3/31/19 | $10,488 | $14,625 | $11,625 |
|---|
3/31/20 | $9,540 | $13,605 | $11,557 |
|---|
3/31/21 | $13,016 | $21,271 | $14,836 |
|---|
3/31/22 | $13,621 | $24,599 | $17,225 |
|---|
3/31/23 | $13,775 | $22,698 | $17,436 |
|---|
3/31/24 | $14,113 | $29,480 | $18,689 |
|---|
3/31/25 | $14,434 | $31,913 | $21,012 |
|---|
3/31/26 | $13,704 | $37,594 | $22,338 |
|---|
|
| Average Annual Return [Table Text Block] |
Table SummaryAverage Annual Total Returns | One Year | Five Years | Ten Years |
|---|
Class A (without sales charge) | -5.06% | 1.04% | 3.70% |
|---|
Class A (with sales charge) ‡ | -9.58% | 0.06% | 3.20% |
|---|
S&P 500 Index | 17.80% | 12.06% | 14.16% |
|---|
S&P 500 Consumer Staples Index | 6.31% | 8.53% | 8.37% |
|---|
|
| AssetsNet |
$ 30,453,679
|
| Holdings Count | Holding |
70
|
| Advisory Fees Paid, Amount |
$ 283,491
|
| InvestmentCompanyPortfolioTurnover |
45.00%
|
| Additional Fund Statistics [Text Block] |
Fund Statistics as of March 31, 2026 - Net Assets$30,453,679
- Total Number of Portfolio Holdings70
- Portfolio Turnover Rate45%
- Total Advisory Fees Paid$283,491
|
| Holdings [Text Block] |
Holdings DiversificationFootnote Reference1 (% of Net Assets) as of March 31, 2026 Table SummaryValue | Value |
|---|
Other | 0.5% | Internet | 0.9% | Retail | 2.5% | Household Products & Housewares | 5.7% | Agriculture | 15.1% | Cosmetics & Personal Care | 15.8% | Beverages | 27.7% | Food | 31.3% | |
| Largest Holdings [Text Block] |
10 Largest HoldingsFootnote Reference2 (% of Net Assets) as of March 31, 2026 Table SummaryProcter & Gamble Co. | 5.6% |
|---|
Coca-Cola Co. | 5.0% |
|---|
Philip Morris International, Inc. | 4.8% |
|---|
PepsiCo, Inc. | 4.5% |
|---|
Altria Group, Inc. | 3.7% |
|---|
Mondelez International, Inc. — Class A | 3.3% |
|---|
Colgate-Palmolive Co. | 3.0% |
|---|
Monster Beverage Corp. | 2.5% |
|---|
Hershey Co. | 2.3% |
|---|
Kroger Co. | 2.2% |
|---|
Total | 36.9% |
|---|
|
| Material Fund Change [Text Block] |
|
| C000010633 |
|
| Shareholder Report [Line Items] |
|
| Fund Name |
Consumer Products Fund
|
| Class Name |
Class C
|
| Trading Symbol |
RYCPX
|
| Annual or Semi-Annual Statement [Text Block] |
This annual shareholder report contains important information about the Consumer Products Fund for the period from April 1, 2025 to March 31, 2026.
|
| Shareholder Report Annual or Semi-Annual |
Annual Shareholder Report
|
| Additional Information [Text Block] |
You can find additional information about the fund at GuggenheimInvestments.com/mutual-funds/literature. You can also request this information by contacting 800 820 0888 or services@guggenheiminvestments.com.
|
| Additional Information Phone Number |
800 820 0888
|
| Additional Information Email |
<span style="box-sizing: border-box; color: rgb(67, 67, 67); display: inline; flex-wrap: nowrap; font-size: 10.6667px; font-weight: 400; grid-area: auto; line-height: 12.8px; margin: 0px; overflow: visible; text-align: left; text-align-last: auto; white-space-collapse: preserve-breaks;">services@guggenheiminvestments.com</span>
|
| Additional Information Website |
<span style="box-sizing: border-box; color: rgb(67, 67, 67); display: inline; flex-wrap: nowrap; font-size: 10.6667px; font-weight: 400; grid-area: auto; line-height: 12.8px; margin: 0px; overflow: visible; text-align: left; text-align-last: auto; white-space-collapse: preserve-breaks;">GuggenheimInvestments.com/mutual-funds/literature</span>
|
| Expenses [Text Block] |
What were the Fund's costs for the last year? * Based on a hypothetical $10,000 investment Table SummaryClass | Costs of a $10,000 Investment | Costs Paid as a % of a $10,000 Investment |
|---|
Class C | $231 | 2.38% |
|---|
Table Summary* | Excludes expenses of the underlying funds in which the fund invests, if any. |
|---|
|
| Expenses Paid, Amount |
$ 231
|
| Factors Affecting Performance [Text Block] |
What factors materially affected the Fund's performance over the last year? The industries that contributed the most to performance were agricultural products & services, tobacco, and soft drinks & non-alcoholic beverages. Those that detracted the most were packaged foods & meats, household products, and personal care products. The holdings that contributed the most to performance were Casey’s General Stores, Inc., Archer-Daniels-Midland Co., and Bunge Global, SA. Those that detracted the most were BellRing Brands, Inc., Procter & Gamble Co., and Kimberly-Clark Corp. |
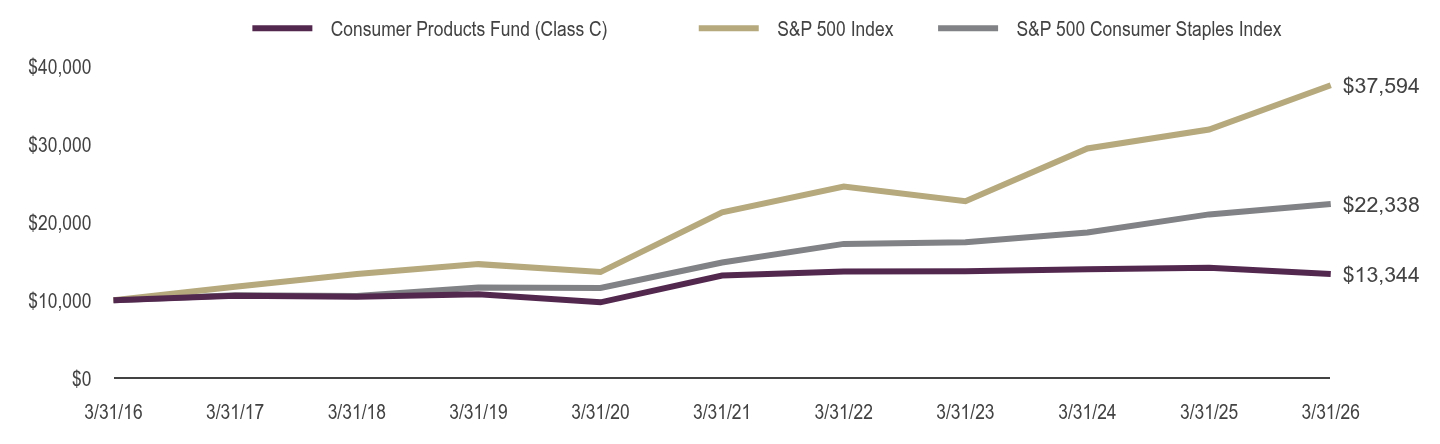
| Line Graph [Table Text Block] |
Table Summary | Consumer Products Fund (Class C) | S&P 500 Index | S&P 500 Consumer Staples Index |
|---|
3/31/16 | $10,000 | $10,000 | $10,000 |
|---|
3/31/17 | $10,555 | $11,717 | $10,616 |
|---|
3/31/18 | $10,447 | $13,357 | $10,522 |
|---|
3/31/19 | $10,767 | $14,625 | $11,625 |
|---|
3/31/20 | $9,719 | $13,605 | $11,557 |
|---|
3/31/21 | $13,160 | $21,271 | $14,836 |
|---|
3/31/22 | $13,669 | $24,599 | $17,225 |
|---|
3/31/23 | $13,720 | $22,698 | $17,436 |
|---|
3/31/24 | $13,954 | $29,480 | $18,689 |
|---|
3/31/25 | $14,164 | $31,913 | $21,012 |
|---|
3/31/26 | $13,344 | $37,594 | $22,338 |
|---|
|
| Average Annual Return [Table Text Block] |
Table SummaryAverage Annual Total Returns | One Year | Five Years | Ten Years |
|---|
Class C (without CDSC) | -5.79% | 0.28% | 2.93% |
|---|
Class C (with CDSC) ‡ | -6.49% | 0.28% | 2.93% |
|---|
S&P 500 Index | 17.80% | 12.06% | 14.16% |
|---|
S&P 500 Consumer Staples Index | 6.31% | 8.53% | 8.37% |
|---|
|
| AssetsNet |
$ 30,453,679
|
| Holdings Count | Holding |
70
|
| Advisory Fees Paid, Amount |
$ 283,491
|
| InvestmentCompanyPortfolioTurnover |
45.00%
|
| Additional Fund Statistics [Text Block] |
Fund Statistics as of March 31, 2026 - Net Assets$30,453,679
- Total Number of Portfolio Holdings70
- Portfolio Turnover Rate45%
- Total Advisory Fees Paid$283,491
|
| Holdings [Text Block] |
Holdings DiversificationFootnote Reference1 (% of Net Assets) as of March 31, 2026 Table SummaryValue | Value |
|---|
Other | 0.5% | Internet | 0.9% | Retail | 2.5% | Household Products & Housewares | 5.7% | Agriculture | 15.1% | Cosmetics & Personal Care | 15.8% | Beverages | 27.7% | Food | 31.3% | |
| Largest Holdings [Text Block] |
10 Largest HoldingsFootnote Reference2 (% of Net Assets) as of March 31, 2026 Table SummaryProcter & Gamble Co. | 5.6% |
|---|
Coca-Cola Co. | 5.0% |
|---|
Philip Morris International, Inc. | 4.8% |
|---|
PepsiCo, Inc. | 4.5% |
|---|
Altria Group, Inc. | 3.7% |
|---|
Mondelez International, Inc. — Class A | 3.3% |
|---|
Colgate-Palmolive Co. | 3.0% |
|---|
Monster Beverage Corp. | 2.5% |
|---|
Hershey Co. | 2.3% |
|---|
Kroger Co. | 2.2% |
|---|
Total | 36.9% |
|---|
|
| Material Fund Change [Text Block] |
|
| C000010631 |
|
| Shareholder Report [Line Items] |
|
| Fund Name |
Consumer Products Fund
|
| Class Name |
Class H
|
| Trading Symbol |
RYCAX
|
| Annual or Semi-Annual Statement [Text Block] |
This annual shareholder report contains important information about the Consumer Products Fund for the period from April 1, 2025 to March 31, 2026.
|
| Shareholder Report Annual or Semi-Annual |
Annual Shareholder Report
|
| Additional Information [Text Block] |
You can find additional information about the fund at GuggenheimInvestments.com/mutual-funds/literature. You can also request this information by contacting 800 820 0888 or services@guggenheiminvestments.com.
|
| Additional Information Phone Number |
800 820 0888
|
| Additional Information Email |
<span style="box-sizing: border-box; color: rgb(67, 67, 67); display: inline; flex-wrap: nowrap; font-size: 10.6667px; font-weight: 400; grid-area: auto; line-height: 12.8px; margin: 0px; overflow: visible; text-align: left; text-align-last: auto; white-space-collapse: preserve-breaks;">services@guggenheiminvestments.com</span>
|
| Additional Information Website |
<span style="box-sizing: border-box; color: rgb(67, 67, 67); display: inline; flex-wrap: nowrap; font-size: 10.6667px; font-weight: 400; grid-area: auto; line-height: 12.8px; margin: 0px; overflow: visible; text-align: left; text-align-last: auto; white-space-collapse: preserve-breaks;">GuggenheimInvestments.com/mutual-funds/literature</span>
|
| Expenses [Text Block] |
What were the Fund's costs for the last year? * Based on a hypothetical $10,000 investment Table SummaryClass | Costs of a $10,000 Investment | Costs Paid as a % of a $10,000 Investment |
|---|
Class H | $159 | 1.63% |
|---|
Table Summary* | Excludes expenses of the underlying funds in which the fund invests, if any. |
|---|
|
| Expenses Paid, Amount |
$ 159
|
| Factors Affecting Performance [Text Block] |
What factors materially affected the Fund's performance over the last year? The industries that contributed the most to performance were agricultural products & services, tobacco, and soft drinks & non-alcoholic beverages. Those that detracted the most were packaged foods & meats, household products, and personal care products. The holdings that contributed the most to performance were Casey’s General Stores, Inc., Archer-Daniels-Midland Co., and Bunge Global, SA. Those that detracted the most were BellRing Brands, Inc., Procter & Gamble Co., and Kimberly-Clark Corp. |
| Line Graph [Table Text Block] |
Table Summary | Consumer Products Fund (Class H) | S&P 500 Index | S&P 500 Consumer Staples Index |
|---|
3/31/16 | $10,000 | $10,000 | $10,000 |
|---|
3/31/17 | $10,635 | $11,717 | $10,616 |
|---|
3/31/18 | $10,601 | $13,357 | $10,522 |
|---|
3/31/19 | $11,008 | $14,625 | $11,625 |
|---|
3/31/20 | $10,012 | $13,605 | $11,557 |
|---|
3/31/21 | $13,660 | $21,271 | $14,836 |
|---|
3/31/22 | $14,295 | $24,599 | $17,225 |
|---|
3/31/23 | $14,458 | $22,698 | $17,436 |
|---|
3/31/24 | $14,813 | $29,480 | $18,689 |
|---|
3/31/25 | $15,149 | $31,913 | $21,012 |
|---|
3/31/26 | $14,382 | $37,594 | $22,338 |
|---|
|
| Average Annual Return [Table Text Block] |
Table SummaryAverage Annual Total Returns | One Year | Five Years | Ten Years |
|---|
Class H | -5.07% | 1.04% | 3.70% |
|---|
S&P 500 Index | 17.80% | 12.06% | 14.16% |
|---|
S&P 500 Consumer Staples Index | 6.31% | 8.53% | 8.37% |
|---|
|
| AssetsNet |
$ 30,453,679
|
| Holdings Count | Holding |
70
|
| Advisory Fees Paid, Amount |
$ 283,491
|
| InvestmentCompanyPortfolioTurnover |
45.00%
|
| Additional Fund Statistics [Text Block] |
Fund Statistics as of March 31, 2026 - Net Assets$30,453,679
- Total Number of Portfolio Holdings70
- Portfolio Turnover Rate45%
- Total Advisory Fees Paid$283,491
|
| Holdings [Text Block] |
Holdings DiversificationFootnote Reference1 (% of Net Assets) as of March 31, 2026 Table SummaryValue | Value |
|---|
Other | 0.5% | Internet | 0.9% | Retail | 2.5% | Household Products & Housewares | 5.7% | Agriculture | 15.1% | Cosmetics & Personal Care | 15.8% | Beverages | 27.7% | Food | 31.3% | |
| Largest Holdings [Text Block] |
10 Largest HoldingsFootnote Reference2 (% of Net Assets) as of March 31, 2026 Table SummaryProcter & Gamble Co. | 5.6% |
|---|
Coca-Cola Co. | 5.0% |
|---|
Philip Morris International, Inc. | 4.8% |
|---|
PepsiCo, Inc. | 4.5% |
|---|
Altria Group, Inc. | 3.7% |
|---|
Mondelez International, Inc. — Class A | 3.3% |
|---|
Colgate-Palmolive Co. | 3.0% |
|---|
Monster Beverage Corp. | 2.5% |
|---|
Hershey Co. | 2.3% |
|---|
Kroger Co. | 2.2% |
|---|
Total | 36.9% |
|---|
|
| Material Fund Change [Text Block] |
|
| C000010598 |
|
| Shareholder Report [Line Items] |
|
| Fund Name |
Electronics Fund
|
| Class Name |
Investor Class
|
| Trading Symbol |
RYSIX
|
| Annual or Semi-Annual Statement [Text Block] |
This annual shareholder report contains important information about the Electronics Fund for the period from April 1, 2025 to March 31, 2026.
|
| Shareholder Report Annual or Semi-Annual |
Annual Shareholder Report
|
| Additional Information [Text Block] |
You can find additional information about the fund at GuggenheimInvestments.com/mutual-funds/literature. You can also request this information by contacting 800 820 0888 or services@guggenheiminvestments.com.
|
| Additional Information Phone Number |
800 820 0888
|
| Additional Information Email |
<span style="box-sizing: border-box; color: rgb(67, 67, 67); display: inline; flex-wrap: nowrap; font-size: 10.6667px; font-weight: 400; grid-area: auto; line-height: 12.8px; margin: 0px; overflow: visible; text-align: left; text-align-last: auto; white-space-collapse: preserve-breaks;">services@guggenheiminvestments.com</span>
|
| Additional Information Website |
<span style="box-sizing: border-box; color: rgb(67, 67, 67); display: inline; flex-wrap: nowrap; font-size: 10.6667px; font-weight: 400; grid-area: auto; line-height: 12.8px; margin: 0px; overflow: visible; text-align: left; text-align-last: auto; white-space-collapse: preserve-breaks;">GuggenheimInvestments.com/mutual-funds/literature</span>
|
| Expenses [Text Block] |
What were the Fund's costs for the last year? * Based on a hypothetical $10,000 investment Table SummaryClass | Costs of a $10,000 Investment | Costs Paid as a % of a $10,000 Investment |
|---|
Investor Class | $194 | 1.38% |
|---|
Table Summary* | Excludes expenses of the underlying funds in which the fund invests, if any. |
|---|
|
| Expenses Paid, Amount |
$ 194
|
| Factors Affecting Performance [Text Block] |
What factors materially affected the Fund's performance over the last year? The industries that contributed the most to performance were semiconductors and semiconductor materials & equipment. No industry contributed to negative performance. The holdings that contributed the most to performance were NVIDIA Corp., Broadcom, Inc. and Micron Technology, Inc. Those that detracted the most were Enphase Energy, Inc., QUALCOMM, Inc., and Wolfspeed, Inc. |
| Line Graph [Table Text Block] |
Table Summary | Electronics Fund (Investor Class) | S&P 500 Index | S&P 500 Information Technology Index |
|---|
3/31/16 | $10,000 | $10,000 | $10,000 |
|---|
3/31/17 | $13,541 | $11,717 | $12,491 |
|---|
3/31/18 | $16,870 | $13,357 | $15,948 |
|---|
3/31/19 | $17,098 | $14,625 | $18,411 |
|---|
3/31/20 | $18,635 | $13,605 | $20,331 |
|---|
3/31/21 | $38,956 | $21,271 | $33,874 |
|---|
3/31/22 | $43,485 | $24,599 | $40,953 |
|---|
3/31/23 | $41,951 | $22,698 | $39,090 |
|---|
3/31/24 | $60,326 | $29,480 | $57,075 |
|---|
3/31/25 | $51,058 | $31,913 | $60,436 |
|---|
3/31/26 | $92,519 | $37,594 | $77,992 |
|---|
|
| Average Annual Return [Table Text Block] |
Table SummaryAverage Annual Total Returns | One Year | Five Years | Ten Years |
|---|
Investor Class | 81.20% | 18.89% | 24.92% |
|---|
S&P 500 Index | 17.80% | 12.06% | 14.16% |
|---|
S&P 500 Information Technology Index | 28.83% | 18.13% | 22.80% |
|---|
|
| AssetsNet |
$ 161,773,643
|
| Holdings Count | Holding |
67
|
| Advisory Fees Paid, Amount |
$ 946,918
|
| InvestmentCompanyPortfolioTurnover |
69.00%
|
| Additional Fund Statistics [Text Block] |
Fund Statistics as of March 31, 2026 - Net Assets$161,773,643
- Total Number of Portfolio Holdings67
- Portfolio Turnover Rate69%
- Total Advisory Fees Paid$946,918
|
| Holdings [Text Block] |
Holdings DiversificationFootnote Reference1 (% of Net Assets) as of March 31, 2026 Table SummaryValue | Value |
|---|
Electrical Components & Equipment | 0.5% | Computers | 0.5% | Telecommunications | 0.8% | Chemicals | 1.2% | Energy-Alternate Sources | 3.3% | Semiconductors | 93.0% | |
| Largest Holdings [Text Block] |
10 Largest HoldingsFootnote Reference2 (% of Net Assets) as of March 31, 2026 Table SummaryNVIDIA Corp. | 14.7% |
|---|
Broadcom, Inc. | 8.6% |
|---|
Advanced Micro Devices, Inc. | 4.4% |
|---|
Micron Technology, Inc. | 4.2% |
|---|
Applied Materials, Inc. | 4.0% |
|---|
Lam Research Corp. | 3.9% |
|---|
KLA Corp. | 3.4% |
|---|
Texas Instruments, Inc. | 3.2% |
|---|
Intel Corp. | 3.2% |
|---|
Analog Devices, Inc. | 3.0% |
|---|
Total | 52.6% |
|---|
|
| Material Fund Change [Text Block] |
|
| C000010600 |
|
| Shareholder Report [Line Items] |
|
| Fund Name |
Electronics Fund
|
| Class Name |
Class A
|
| Trading Symbol |
RYELX
|
| Annual or Semi-Annual Statement [Text Block] |
This annual shareholder report contains important information about the Electronics Fund for the period from April 1, 2025 to March 31, 2026.
|
| Shareholder Report Annual or Semi-Annual |
Annual Shareholder Report
|
| Additional Information [Text Block] |
You can find additional information about the fund at GuggenheimInvestments.com/mutual-funds/literature. You can also request this information by contacting 800 820 0888 or services@guggenheiminvestments.com.
|
| Additional Information Phone Number |
800 820 0888
|
| Additional Information Email |
<span style="box-sizing: border-box; color: rgb(67, 67, 67); display: inline; flex-wrap: nowrap; font-size: 10.6667px; font-weight: 400; grid-area: auto; line-height: 12.8px; margin: 0px; overflow: visible; text-align: left; text-align-last: auto; white-space-collapse: preserve-breaks;">services@guggenheiminvestments.com</span>
|
| Additional Information Website |
<span style="box-sizing: border-box; color: rgb(67, 67, 67); display: inline; flex-wrap: nowrap; font-size: 10.6667px; font-weight: 400; grid-area: auto; line-height: 12.8px; margin: 0px; overflow: visible; text-align: left; text-align-last: auto; white-space-collapse: preserve-breaks;">GuggenheimInvestments.com/mutual-funds/literature</span>
|
| Expenses [Text Block] |
What were the Fund's costs for the last year? * Based on a hypothetical $10,000 investment Table SummaryClass | Costs of a $10,000 Investment | Costs Paid as a % of a $10,000 Investment |
|---|
Class A | $229 | 1.63% |
|---|
Table Summary* | Excludes expenses of the underlying funds in which the fund invests, if any. |
|---|
|
| Expenses Paid, Amount |
$ 229
|
| Factors Affecting Performance [Text Block] |
What factors materially affected the Fund's performance over the last year? The industries that contributed the most to performance were semiconductors and semiconductor materials & equipment. No industry contributed to negative performance. The holdings that contributed the most to performance were NVIDIA Corp., Broadcom, Inc. and Micron Technology, Inc. Those that detracted the most were Enphase Energy, Inc., QUALCOMM, Inc., and Wolfspeed, Inc. |
| Line Graph [Table Text Block] |
Table Summary | Electronics Fund (Class A)‡ | S&P 500 Index | S&P 500 Information Technology Index |
|---|
3/31/16 | $9,525 | $10,000 | $10,000 |
|---|
3/31/17 | $12,869 | $11,717 | $12,491 |
|---|
3/31/18 | $15,996 | $13,357 | $15,948 |
|---|
3/31/19 | $16,171 | $14,625 | $18,411 |
|---|
3/31/20 | $17,581 | $13,605 | $20,331 |
|---|
3/31/21 | $36,662 | $21,271 | $33,874 |
|---|
3/31/22 | $40,823 | $24,599 | $40,953 |
|---|
3/31/23 | $39,283 | $22,698 | $39,090 |
|---|
3/31/24 | $56,351 | $29,480 | $57,075 |
|---|
3/31/25 | $47,575 | $31,913 | $60,436 |
|---|
3/31/26 | $85,993 | $37,594 | $77,992 |
|---|
|
| Average Annual Return [Table Text Block] |
Table SummaryAverage Annual Total Returns | One Year | Five Years | Ten Years |
|---|
Class A (without sales charge) | 80.75% | 18.59% | 24.61% |
|---|
Class A (with sales charge) ‡ | 72.17% | 17.44% | 24.01% |
|---|
S&P 500 Index | 17.80% | 12.06% | 14.16% |
|---|
S&P 500 Information Technology Index | 28.83% | 18.13% | 22.80% |
|---|
|
| AssetsNet |
$ 161,773,643
|
| Holdings Count | Holding |
67
|
| Advisory Fees Paid, Amount |
$ 946,918
|
| InvestmentCompanyPortfolioTurnover |
69.00%
|
| Additional Fund Statistics [Text Block] |
Fund Statistics as of March 31, 2026 - Net Assets$161,773,643
- Total Number of Portfolio Holdings67
- Portfolio Turnover Rate69%
- Total Advisory Fees Paid$946,918
|
| Holdings [Text Block] |
Holdings DiversificationFootnote Reference1 (% of Net Assets) as of March 31, 2026 Table SummaryValue | Value |
|---|
Electrical Components & Equipment | 0.5% | Computers | 0.5% | Telecommunications | 0.8% | Chemicals | 1.2% | Energy-Alternate Sources | 3.3% | Semiconductors | 93.0% | |
| Largest Holdings [Text Block] |
10 Largest HoldingsFootnote Reference2 (% of Net Assets) as of March 31, 2026 Table SummaryNVIDIA Corp. | 14.7% |
|---|
Broadcom, Inc. | 8.6% |
|---|
Advanced Micro Devices, Inc. | 4.4% |
|---|
Micron Technology, Inc. | 4.2% |
|---|
Applied Materials, Inc. | 4.0% |
|---|
Lam Research Corp. | 3.9% |
|---|
KLA Corp. | 3.4% |
|---|
Texas Instruments, Inc. | 3.2% |
|---|
Intel Corp. | 3.2% |
|---|
Analog Devices, Inc. | 3.0% |
|---|
Total | 52.6% |
|---|
|
| Material Fund Change [Text Block] |
|
| C000010601 |
|
| Shareholder Report [Line Items] |
|
| Fund Name |
Electronics Fund
|
| Class Name |
Class C
|
| Trading Symbol |
RYSCX
|
| Annual or Semi-Annual Statement [Text Block] |
This annual shareholder report contains important information about the Electronics Fund for the period from April 1, 2025 to March 31, 2026.
|
| Shareholder Report Annual or Semi-Annual |
Annual Shareholder Report
|
| Additional Information [Text Block] |
You can find additional information about the fund at GuggenheimInvestments.com/mutual-funds/literature. You can also request this information by contacting 800 820 0888 or services@guggenheiminvestments.com.
|
| Additional Information Phone Number |
800 820 0888
|
| Additional Information Email |
<span style="box-sizing: border-box; color: rgb(67, 67, 67); display: inline; flex-wrap: nowrap; font-size: 10.6667px; font-weight: 400; grid-area: auto; line-height: 12.8px; margin: 0px; overflow: visible; text-align: left; text-align-last: auto; white-space-collapse: preserve-breaks;">services@guggenheiminvestments.com</span>
|
| Additional Information Website |
<span style="box-sizing: border-box; color: rgb(67, 67, 67); display: inline; flex-wrap: nowrap; font-size: 10.6667px; font-weight: 400; grid-area: auto; line-height: 12.8px; margin: 0px; overflow: visible; text-align: left; text-align-last: auto; white-space-collapse: preserve-breaks;">GuggenheimInvestments.com/mutual-funds/literature</span>
|
| Expenses [Text Block] |
What were the Fund's costs for the last year? * Based on a hypothetical $10,000 investment Table SummaryClass | Costs of a $10,000 Investment | Costs Paid as a % of a $10,000 Investment |
|---|
Class C | $332 | 2.38% |
|---|
Table Summary* | Excludes expenses of the underlying funds in which the fund invests, if any. |
|---|
|
| Expenses Paid, Amount |
$ 332
|
| Factors Affecting Performance [Text Block] |
What factors materially affected the Fund's performance over the last year? The industries that contributed the most to performance were semiconductors and semiconductor materials & equipment. No industry contributed to negative performance. The holdings that contributed the most to performance were NVIDIA Corp., Broadcom, Inc. and Micron Technology, Inc. Those that detracted the most were Enphase Energy, Inc., QUALCOMM, Inc., and Wolfspeed, Inc. |
| Line Graph [Table Text Block] |
Table Summary | Electronics Fund (Class C) | S&P 500 Index | S&P 500 Information Technology Index |
|---|
3/31/16 | $10,000 | $10,000 | $10,000 |
|---|
3/31/17 | $13,409 | $11,717 | $12,491 |
|---|
3/31/18 | $16,542 | $13,357 | $15,948 |
|---|
3/31/19 | $16,598 | $14,625 | $18,411 |
|---|
3/31/20 | $17,911 | $13,605 | $20,331 |
|---|
3/31/21 | $37,072 | $21,271 | $33,874 |
|---|
3/31/22 | $40,970 | $24,599 | $40,953 |
|---|
3/31/23 | $39,130 | $22,698 | $39,090 |
|---|
3/31/24 | $55,713 | $29,480 | $57,075 |
|---|
3/31/25 | $46,684 | $31,913 | $60,436 |
|---|
3/31/26 | $83,751 | $37,594 | $77,992 |
|---|
|
| Average Annual Return [Table Text Block] |
Table SummaryAverage Annual Total Returns | One Year | Five Years | Ten Years |
|---|
Class C (without CDSC) | 79.40% | 17.70% | 23.68% |
|---|
Class C (with CDSC) ‡ | 78.40% | 17.70% | 23.68% |
|---|
S&P 500 Index | 17.80% | 12.06% | 14.16% |
|---|
S&P 500 Information Technology Index | 28.83% | 18.13% | 22.80% |
|---|
|
| AssetsNet |
$ 161,773,643
|
| Holdings Count | Holding |
67
|
| Advisory Fees Paid, Amount |
$ 946,918
|
| InvestmentCompanyPortfolioTurnover |
69.00%
|
| Additional Fund Statistics [Text Block] |
Fund Statistics as of March 31, 2026 - Net Assets$161,773,643
- Total Number of Portfolio Holdings67
- Portfolio Turnover Rate69%
- Total Advisory Fees Paid$946,918
|
| Holdings [Text Block] |
Holdings DiversificationFootnote Reference1 (% of Net Assets) as of March 31, 2026 Table SummaryValue | Value |
|---|
Electrical Components & Equipment | 0.5% | Computers | 0.5% | Telecommunications | 0.8% | Chemicals | 1.2% | Energy-Alternate Sources | 3.3% | Semiconductors | 93.0% | |
| Largest Holdings [Text Block] |
10 Largest HoldingsFootnote Reference2 (% of Net Assets) as of March 31, 2026 Table SummaryNVIDIA Corp. | 14.7% |
|---|
Broadcom, Inc. | 8.6% |
|---|
Advanced Micro Devices, Inc. | 4.4% |
|---|
Micron Technology, Inc. | 4.2% |
|---|
Applied Materials, Inc. | 4.0% |
|---|
Lam Research Corp. | 3.9% |
|---|
KLA Corp. | 3.4% |
|---|
Texas Instruments, Inc. | 3.2% |
|---|
Intel Corp. | 3.2% |
|---|
Analog Devices, Inc. | 3.0% |
|---|
Total | 52.6% |
|---|
|
| Material Fund Change [Text Block] |
|
| C000010599 |
|
| Shareholder Report [Line Items] |
|
| Fund Name |
Electronics Fund
|
| Class Name |
Class H
|
| Trading Symbol |
RYSAX
|
| Annual or Semi-Annual Statement [Text Block] |
This annual shareholder report contains important information about the Electronics Fund for the period from April 1, 2025 to March 31, 2026.
|
| Shareholder Report Annual or Semi-Annual |
Annual Shareholder Report
|
| Additional Information [Text Block] |
You can find additional information about the fund at GuggenheimInvestments.com/mutual-funds/literature. You can also request this information by contacting 800 820 0888 or services@guggenheiminvestments.com.
|
| Additional Information Phone Number |
800 820 0888
|
| Additional Information Email |
<span style="box-sizing: border-box; color: rgb(67, 67, 67); display: inline; flex-wrap: nowrap; font-size: 10.6667px; font-weight: 400; grid-area: auto; line-height: 12.8px; margin: 0px; overflow: visible; text-align: left; text-align-last: auto; white-space-collapse: preserve-breaks;">services@guggenheiminvestments.com</span>
|
| Additional Information Website |
<span style="box-sizing: border-box; color: rgb(67, 67, 67); display: inline; flex-wrap: nowrap; font-size: 10.6667px; font-weight: 400; grid-area: auto; line-height: 12.8px; margin: 0px; overflow: visible; text-align: left; text-align-last: auto; white-space-collapse: preserve-breaks;">GuggenheimInvestments.com/mutual-funds/literature</span>
|
| Expenses [Text Block] |
What were the Fund's costs for the last year? * Based on a hypothetical $10,000 investment Table SummaryClass | Costs of a $10,000 Investment | Costs Paid as a % of a $10,000 Investment |
|---|
Class H | $229 | 1.63% |
|---|
Table Summary* | Excludes expenses of the underlying funds in which the fund invests, if any. |
|---|
|
| Expenses Paid, Amount |
$ 229
|
| Factors Affecting Performance [Text Block] |
What factors materially affected the Fund's performance over the last year? The industries that contributed the most to performance were semiconductors and semiconductor materials & equipment. No industry contributed to negative performance. The holdings that contributed the most to performance were NVIDIA Corp., Broadcom, Inc. and Micron Technology, Inc. Those that detracted the most were Enphase Energy, Inc., QUALCOMM, Inc., and Wolfspeed, Inc. |
| Line Graph [Table Text Block] |
Table Summary | Electronics Fund (Class H) | S&P 500 Index | S&P 500 Information Technology Index |
|---|
3/31/16 | $10,000 | $10,000 | $10,000 |
|---|
3/31/17 | $13,498 | $11,717 | $12,491 |
|---|
3/31/18 | $16,777 | $13,357 | $15,948 |
|---|
3/31/19 | $16,957 | $14,625 | $18,411 |
|---|
3/31/20 | $18,436 | $13,605 | $20,331 |
|---|
3/31/21 | $38,443 | $21,271 | $33,874 |
|---|
3/31/22 | $42,806 | $24,599 | $40,953 |
|---|
3/31/23 | $41,192 | $22,698 | $39,090 |
|---|
3/31/24 | $59,089 | $29,480 | $57,075 |
|---|
3/31/25 | $49,885 | $31,913 | $60,436 |
|---|
3/31/26 | $90,167 | $37,594 | $77,992 |
|---|
|
| Average Annual Return [Table Text Block] |
Table SummaryAverage Annual Total Returns | One Year | Five Years | Ten Years |
|---|
Class H | 80.75% | 18.59% | 24.60% |
|---|
S&P 500 Index | 17.80% | 12.06% | 14.16% |
|---|
S&P 500 Information Technology Index | 28.83% | 18.13% | 22.80% |
|---|
|
| AssetsNet |
$ 161,773,643
|
| Holdings Count | Holding |
67
|
| Advisory Fees Paid, Amount |
$ 946,918
|
| InvestmentCompanyPortfolioTurnover |
69.00%
|
| Additional Fund Statistics [Text Block] |
Fund Statistics as of March 31, 2026 - Net Assets$161,773,643
- Total Number of Portfolio Holdings67
- Portfolio Turnover Rate69%
- Total Advisory Fees Paid$946,918
|
| Holdings [Text Block] |
Holdings DiversificationFootnote Reference1 (% of Net Assets) as of March 31, 2026 Table SummaryValue | Value |
|---|
Electrical Components & Equipment | 0.5% | Computers | 0.5% | Telecommunications | 0.8% | Chemicals | 1.2% | Energy-Alternate Sources | 3.3% | Semiconductors | 93.0% | |
| Largest Holdings [Text Block] |
10 Largest HoldingsFootnote Reference2 (% of Net Assets) as of March 31, 2026 Table SummaryNVIDIA Corp. | 14.7% |
|---|
Broadcom, Inc. | 8.6% |
|---|
Advanced Micro Devices, Inc. | 4.4% |
|---|
Micron Technology, Inc. | 4.2% |
|---|
Applied Materials, Inc. | 4.0% |
|---|
Lam Research Corp. | 3.9% |
|---|
KLA Corp. | 3.4% |
|---|
Texas Instruments, Inc. | 3.2% |
|---|
Intel Corp. | 3.2% |
|---|
Analog Devices, Inc. | 3.0% |
|---|
Total | 52.6% |
|---|
|
| Material Fund Change [Text Block] |
|
| C000010610 |
|
| Shareholder Report [Line Items] |
|
| Fund Name |
Energy Fund
|
| Class Name |
Investor Class
|
| Trading Symbol |
RYEIX
|
| Annual or Semi-Annual Statement [Text Block] |
This annual shareholder report contains important information about the Energy Fund for the period from April 1, 2025 to March 31, 2026.
|
| Shareholder Report Annual or Semi-Annual |
Annual Shareholder Report
|
| Additional Information [Text Block] |
You can find additional information about the fund at GuggenheimInvestments.com/mutual-funds/literature. You can also request this information by contacting 800 820 0888 or services@guggenheiminvestments.com.
|
| Additional Information Phone Number |
800 820 0888
|
| Additional Information Email |
<span style="box-sizing: border-box; color: rgb(67, 67, 67); display: inline; flex-wrap: nowrap; font-size: 10.6667px; font-weight: 400; grid-area: auto; line-height: 12.8px; margin: 0px; overflow: visible; text-align: left; text-align-last: auto; white-space-collapse: preserve-breaks;">services@guggenheiminvestments.com</span>
|
| Additional Information Website |
<span style="box-sizing: border-box; color: rgb(67, 67, 67); display: inline; flex-wrap: nowrap; font-size: 10.6667px; font-weight: 400; grid-area: auto; line-height: 12.8px; margin: 0px; overflow: visible; text-align: left; text-align-last: auto; white-space-collapse: preserve-breaks;">GuggenheimInvestments.com/mutual-funds/literature</span>
|
| Expenses [Text Block] |
What were the Fund's costs for the last year? * Based on a hypothetical $10,000 investment Table SummaryClass | Costs of a $10,000 Investment | Costs Paid as a % of a $10,000 Investment |
|---|
Investor Class | $168 | 1.38% |
|---|
Table Summary* | Excludes expenses of the underlying funds in which the fund invests, if any. |
|---|
|
| Expenses Paid, Amount |
$ 168
|
| Factors Affecting Performance [Text Block] |
What factors materially affected the Fund's performance over the last year? The industries that contributed the most to performance were integrated oil & gas, oil & gas exploration & production, and oil & gas refining and marketing. The industry that detracted the most was automotive retail. The holdings that contributed the most to performance were Exxon Mobil Corp., Cameco Corp., and Valero Energy Corp. Those that detracted the most were Enphase Energy, Inc., New Fortress Energy, Inc.—Class A, and ONEOK, Inc. |
| Line Graph [Table Text Block] |
Table Summary | Energy Fund (Investor Class) | S&P 500 Index | S&P 500 Energy Index |
|---|
3/31/16 | $10,000 | $10,000 | $10,000 |
|---|
3/31/17 | $11,899 | $11,717 | $11,426 |
|---|
3/31/18 | $11,330 | $13,357 | $11,407 |
|---|
3/31/19 | $10,430 | $14,625 | $11,558 |
|---|
3/31/20 | $4,213 | $13,605 | $5,499 |
|---|
3/31/21 | $8,065 | $21,271 | $9,633 |
|---|
3/31/22 | $12,715 | $24,599 | $15,827 |
|---|
3/31/23 | $13,394 | $22,698 | $17,984 |
|---|
3/31/24 | $15,846 | $29,480 | $21,162 |
|---|
3/31/25 | $14,771 | $31,913 | $21,690 |
|---|
3/31/26 | $21,207 | $37,594 | $29,568 |
|---|
|
| Average Annual Return [Table Text Block] |
Table SummaryAverage Annual Total Returns | One Year | Five Years | Ten Years |
|---|
Investor Class | 43.58% | 21.33% | 7.81% |
|---|
S&P 500 Index | 17.80% | 12.06% | 14.16% |
|---|
S&P 500 Energy Index | 36.21% | 25.14% | 11.45% |
|---|
|
| AssetsNet |
$ 46,081,734
|
| Holdings Count | Holding |
87
|
| Advisory Fees Paid, Amount |
$ 156,593
|
| InvestmentCompanyPortfolioTurnover |
551.00%
|
| Additional Fund Statistics [Text Block] |
Fund Statistics as of March 31, 2026 - Net Assets$46,081,734
- Total Number of Portfolio Holdings87
- Portfolio Turnover Rate551%
- Total Advisory Fees Paid$156,593
|
| Holdings [Text Block] |
Holdings DiversificationFootnote Reference1 (% of Net Assets) as of March 31, 2026 Table SummaryValue | Value |
|---|
Other | 2.2% | Transportation | 0.8% | Coal | 0.9% | Energy-Alternate Sources | 3.8% | Mining | 4.7% | Oil & Gas Services | 9.4% | Pipelines | 17.4% | Oil & Gas | 60.4% | |
| Largest Holdings [Text Block] |
10 Largest HoldingsFootnote Reference2 (% of Net Assets) as of March 31, 2026 Table SummaryExxon Mobil Corp. | 6.9% |
|---|
Chevron Corp. | 5.0% |
|---|
ConocoPhillips | 3.3% |
|---|
SLB Ltd. | 2.4% |
|---|
Williams Companies, Inc. | 2.4% |
|---|
EOG Resources, Inc. | 2.3% |
|---|
Valero Energy Corp. | 2.2% |
|---|
Marathon Petroleum Corp. | 2.2% |
|---|
Phillips 66 | 2.2% |
|---|
Baker Hughes Co. | 2.1% |
|---|
Total | 31.0% |
|---|
|
| Material Fund Change [Text Block] |
|
| C000010612 |
|
| Shareholder Report [Line Items] |
|
| Fund Name |
Energy Fund
|
| Class Name |
Class A
|
| Trading Symbol |
RYENX
|
| Annual or Semi-Annual Statement [Text Block] |
This annual shareholder report contains important information about the Energy Fund for the period from April 1, 2025 to March 31, 2026.
|
| Shareholder Report Annual or Semi-Annual |
Annual Shareholder Report
|
| Additional Information [Text Block] |
You can find additional information about the fund at GuggenheimInvestments.com/mutual-funds/literature. You can also request this information by contacting 800 820 0888 or services@guggenheiminvestments.com.
|
| Additional Information Phone Number |
800 820 0888
|
| Additional Information Email |
<span style="box-sizing: border-box; color: rgb(67, 67, 67); display: inline; flex-wrap: nowrap; font-size: 10.6667px; font-weight: 400; grid-area: auto; line-height: 12.8px; margin: 0px; overflow: visible; text-align: left; text-align-last: auto; white-space-collapse: preserve-breaks;">services@guggenheiminvestments.com</span>
|
| Additional Information Website |
<span style="box-sizing: border-box; color: rgb(67, 67, 67); display: inline; flex-wrap: nowrap; font-size: 10.6667px; font-weight: 400; grid-area: auto; line-height: 12.8px; margin: 0px; overflow: visible; text-align: left; text-align-last: auto; white-space-collapse: preserve-breaks;">GuggenheimInvestments.com/mutual-funds/literature</span>
|
| Expenses [Text Block] |
What were the Fund's costs for the last year? * Based on a hypothetical $10,000 investment Table SummaryClass | Costs of a $10,000 Investment | Costs Paid as a % of a $10,000 Investment |
|---|
Class A | $198 | 1.63% |
|---|
Table Summary* | Excludes expenses of the underlying funds in which the fund invests, if any. |
|---|
|
| Expenses Paid, Amount |
$ 198
|
| Factors Affecting Performance [Text Block] |
What factors materially affected the Fund's performance over the last year? The industries that contributed the most to performance were integrated oil & gas, oil & gas exploration & production, and oil & gas refining and marketing. The industry that detracted the most was automotive retail. The holdings that contributed the most to performance were Exxon Mobil Corp., Cameco Corp., and Valero Energy Corp. Those that detracted the most were Enphase Energy, Inc., New Fortress Energy, Inc.—Class A, and ONEOK, Inc. |
| Line Graph [Table Text Block] |
Table Summary | Energy Fund (Class A)‡ | S&P 500 Index | S&P 500 Energy Index |
|---|
3/31/16 | $9,525 | $10,000 | $10,000 |
|---|
3/31/17 | $11,302 | $11,717 | $11,426 |
|---|
3/31/18 | $10,738 | $13,357 | $11,407 |
|---|
3/31/19 | $9,862 | $14,625 | $11,558 |
|---|
3/31/20 | $3,975 | $13,605 | $5,499 |
|---|
3/31/21 | $7,588 | $21,271 | $9,633 |
|---|
3/31/22 | $11,933 | $24,599 | $15,827 |
|---|
3/31/23 | $12,539 | $22,698 | $17,984 |
|---|
3/31/24 | $14,798 | $29,480 | $21,162 |
|---|
3/31/25 | $13,760 | $31,913 | $21,690 |
|---|
3/31/26 | $19,706 | $37,594 | $29,568 |
|---|
|
| Average Annual Return [Table Text Block] |
Table SummaryAverage Annual Total Returns | One Year | Five Years | Ten Years |
|---|
Class A (without sales charge) | 43.23% | 21.03% | 7.54% |
|---|
Class A (with sales charge) ‡ | 36.43% | 19.86% | 7.02% |
|---|
S&P 500 Index | 17.80% | 12.06% | 14.16% |
|---|
S&P 500 Energy Index | 36.21% | 25.14% | 11.45% |
|---|
|
| AssetsNet |
$ 46,081,734
|
| Holdings Count | Holding |
87
|
| Advisory Fees Paid, Amount |
$ 156,593
|
| InvestmentCompanyPortfolioTurnover |
551.00%
|
| Additional Fund Statistics [Text Block] |
Fund Statistics as of March 31, 2026 - Net Assets$46,081,734
- Total Number of Portfolio Holdings87
- Portfolio Turnover Rate551%
- Total Advisory Fees Paid$156,593
|
| Holdings [Text Block] |
Holdings DiversificationFootnote Reference1 (% of Net Assets) as of March 31, 2026 Table SummaryValue | Value |
|---|
Other | 2.2% | Transportation | 0.8% | Coal | 0.9% | Energy-Alternate Sources | 3.8% | Mining | 4.7% | Oil & Gas Services | 9.4% | Pipelines | 17.4% | Oil & Gas | 60.4% | |
| Largest Holdings [Text Block] |
10 Largest HoldingsFootnote Reference2 (% of Net Assets) as of March 31, 2026 Table SummaryExxon Mobil Corp. | 6.9% |
|---|
Chevron Corp. | 5.0% |
|---|
ConocoPhillips | 3.3% |
|---|
SLB Ltd. | 2.4% |
|---|
Williams Companies, Inc. | 2.4% |
|---|
EOG Resources, Inc. | 2.3% |
|---|
Valero Energy Corp. | 2.2% |
|---|
Marathon Petroleum Corp. | 2.2% |
|---|
Phillips 66 | 2.2% |
|---|
Baker Hughes Co. | 2.1% |
|---|
Total | 31.0% |
|---|
|
| Material Fund Change [Text Block] |
|
| C000010613 |
|
| Shareholder Report [Line Items] |
|
| Fund Name |
Energy Fund
|
| Class Name |
Class C
|
| Trading Symbol |
RYECX
|
| Annual or Semi-Annual Statement [Text Block] |
This annual shareholder report contains important information about the Energy Fund for the period from April 1, 2025 to March 31, 2026.
|
| Shareholder Report Annual or Semi-Annual |
Annual Shareholder Report
|
| Additional Information [Text Block] |
You can find additional information about the fund at GuggenheimInvestments.com/mutual-funds/literature. You can also request this information by contacting 800 820 0888 or services@guggenheiminvestments.com.
|
| Additional Information Phone Number |
800 820 0888
|
| Additional Information Email |
<span style="box-sizing: border-box; color: rgb(67, 67, 67); display: inline; flex-wrap: nowrap; font-size: 10.6667px; font-weight: 400; grid-area: auto; line-height: 12.8px; margin: 0px; overflow: visible; text-align: left; text-align-last: auto; white-space-collapse: preserve-breaks;">services@guggenheiminvestments.com</span>
|
| Additional Information Website |
<span style="box-sizing: border-box; color: rgb(67, 67, 67); display: inline; flex-wrap: nowrap; font-size: 10.6667px; font-weight: 400; grid-area: auto; line-height: 12.8px; margin: 0px; overflow: visible; text-align: left; text-align-last: auto; white-space-collapse: preserve-breaks;">GuggenheimInvestments.com/mutual-funds/literature</span>
|
| Expenses [Text Block] |
What were the Fund's costs for the last year? * Based on a hypothetical $10,000 investment Table SummaryClass | Costs of a $10,000 Investment | Costs Paid as a % of a $10,000 Investment |
|---|
Class C | $289 | 2.39% |
|---|
Table Summary* | Excludes expenses of the underlying funds in which the fund invests, if any. |
|---|
|
| Expenses Paid, Amount |
$ 289
|
| Factors Affecting Performance [Text Block] |
What factors materially affected the Fund's performance over the last year? The industries that contributed the most to performance were integrated oil & gas, oil & gas exploration & production, and oil & gas refining and marketing. The industry that detracted the most was automotive retail. The holdings that contributed the most to performance were Exxon Mobil Corp., Cameco Corp., and Valero Energy Corp. Those that detracted the most were Enphase Energy, Inc., New Fortress Energy, Inc.—Class A, and ONEOK, Inc. |
| Line Graph [Table Text Block] |
Table Summary | Energy Fund (Class C) | S&P 500 Index | S&P 500 Energy Index |
|---|
3/31/16 | $10,000 | $10,000 | $10,000 |
|---|
3/31/17 | $11,776 | $11,717 | $11,426 |
|---|
3/31/18 | $11,102 | $13,357 | $11,407 |
|---|
3/31/19 | $10,122 | $14,625 | $11,558 |
|---|
3/31/20 | $4,048 | $13,605 | $5,499 |
|---|
3/31/21 | $7,670 | $21,271 | $9,633 |
|---|
3/31/22 | $11,971 | $24,599 | $15,827 |
|---|
3/31/23 | $12,485 | $22,698 | $17,984 |
|---|
3/31/24 | $14,625 | $29,480 | $21,162 |
|---|
3/31/25 | $13,497 | $31,913 | $21,690 |
|---|
3/31/26 | $19,185 | $37,594 | $29,568 |
|---|
|
| Average Annual Return [Table Text Block] |
Table SummaryAverage Annual Total Returns | One Year | Five Years | Ten Years |
|---|
Class C (without CDSC) | 42.16% | 20.12% | 6.73% |
|---|
Class C (with CDSC) ‡ | 41.16% | 20.12% | 6.73% |
|---|
S&P 500 Index | 17.80% | 12.06% | 14.16% |
|---|
S&P 500 Energy Index | 36.21% | 25.14% | 11.45% |
|---|
|
| AssetsNet |
$ 46,081,734
|
| Holdings Count | Holding |
87
|
| Advisory Fees Paid, Amount |
$ 156,593
|
| InvestmentCompanyPortfolioTurnover |
551.00%
|
| Additional Fund Statistics [Text Block] |
Fund Statistics as of March 31, 2026 - Net Assets$46,081,734
- Total Number of Portfolio Holdings87
- Portfolio Turnover Rate551%
- Total Advisory Fees Paid$156,593
|
| Holdings [Text Block] |
Holdings DiversificationFootnote Reference1 (% of Net Assets) as of March 31, 2026 Table SummaryValue | Value |
|---|
Other | 2.2% | Transportation | 0.8% | Coal | 0.9% | Energy-Alternate Sources | 3.8% | Mining | 4.7% | Oil & Gas Services | 9.4% | Pipelines | 17.4% | Oil & Gas | 60.4% | |
| Largest Holdings [Text Block] |
10 Largest HoldingsFootnote Reference2 (% of Net Assets) as of March 31, 2026 Table SummaryExxon Mobil Corp. | 6.9% |
|---|
Chevron Corp. | 5.0% |
|---|
ConocoPhillips | 3.3% |
|---|
SLB Ltd. | 2.4% |
|---|
Williams Companies, Inc. | 2.4% |
|---|
EOG Resources, Inc. | 2.3% |
|---|
Valero Energy Corp. | 2.2% |
|---|
Marathon Petroleum Corp. | 2.2% |
|---|
Phillips 66 | 2.2% |
|---|
Baker Hughes Co. | 2.1% |
|---|
Total | 31.0% |
|---|
|
| Material Fund Change [Text Block] |
|
| C000010611 |
|
| Shareholder Report [Line Items] |
|
| Fund Name |
Energy Fund
|
| Class Name |
Class H
|
| Trading Symbol |
RYEAX
|
| Annual or Semi-Annual Statement [Text Block] |
This annual shareholder report contains important information about the Energy Fund for the period from April 1, 2025 to March 31, 2026.
|
| Shareholder Report Annual or Semi-Annual |
Annual Shareholder Report
|
| Additional Information [Text Block] |
You can find additional information about the fund at GuggenheimInvestments.com/mutual-funds/literature. You can also request this information by contacting 800 820 0888 or services@guggenheiminvestments.com.
|
| Additional Information Phone Number |
800 820 0888
|
| Additional Information Email |
<span style="box-sizing: border-box; color: rgb(67, 67, 67); display: inline; flex-wrap: nowrap; font-size: 10.6667px; font-weight: 400; grid-area: auto; line-height: 12.8px; margin: 0px; overflow: visible; text-align: left; text-align-last: auto; white-space-collapse: preserve-breaks;">services@guggenheiminvestments.com</span>
|
| Additional Information Website |
<span style="box-sizing: border-box; color: rgb(67, 67, 67); display: inline; flex-wrap: nowrap; font-size: 10.6667px; font-weight: 400; grid-area: auto; line-height: 12.8px; margin: 0px; overflow: visible; text-align: left; text-align-last: auto; white-space-collapse: preserve-breaks;">GuggenheimInvestments.com/mutual-funds/literature</span>
|
| Expenses [Text Block] |
What were the Fund's costs for the last year? * Based on a hypothetical $10,000 investment Table SummaryClass | Costs of a $10,000 Investment | Costs Paid as a % of a $10,000 Investment |
|---|
Class H | $197 | 1.62% |
|---|
Table Summary* | Excludes expenses of the underlying funds in which the fund invests, if any. |
|---|
|
| Expenses Paid, Amount |
$ 197
|
| Factors Affecting Performance [Text Block] |
What factors materially affected the Fund's performance over the last year? The industries that contributed the most to performance were integrated oil & gas, oil & gas exploration & production, and oil & gas refining and marketing. The industry that detracted the most was automotive retail. The holdings that contributed the most to performance were Exxon Mobil Corp., Cameco Corp., and Valero Energy Corp. Those that detracted the most were Enphase Energy, Inc., New Fortress Energy, Inc.—Class A, and ONEOK, Inc. |
| Line Graph [Table Text Block] |
Table Summary | Energy Fund (Class H) | S&P 500 Index | S&P 500 Energy Index |
|---|
3/31/16 | $10,000 | $10,000 | $10,000 |
|---|
3/31/17 | $11,857 | $11,717 | $11,426 |
|---|
3/31/18 | $11,261 | $13,357 | $11,407 |
|---|
3/31/19 | $10,342 | $14,625 | $11,558 |
|---|
3/31/20 | $4,165 | $13,605 | $5,499 |
|---|
3/31/21 | $7,949 | $21,271 | $9,633 |
|---|
3/31/22 | $12,500 | $24,599 | $15,827 |
|---|
3/31/23 | $13,135 | $22,698 | $17,984 |
|---|
3/31/24 | $15,502 | $29,480 | $21,162 |
|---|
3/31/25 | $14,415 | $31,913 | $21,690 |
|---|
3/31/26 | $20,644 | $37,594 | $29,568 |
|---|
|
| Average Annual Return [Table Text Block] |
Table SummaryAverage Annual Total Returns | One Year | Five Years | Ten Years |
|---|
Class H | 43.21% | 21.03% | 7.51% |
|---|
S&P 500 Index | 17.80% | 12.06% | 14.16% |
|---|
S&P 500 Energy Index | 36.21% | 25.14% | 11.45% |
|---|
|
| AssetsNet |
$ 46,081,734
|
| Holdings Count | Holding |
87
|
| Advisory Fees Paid, Amount |
$ 156,593
|
| InvestmentCompanyPortfolioTurnover |
551.00%
|
| Additional Fund Statistics [Text Block] |
Fund Statistics as of March 31, 2026 - Net Assets$46,081,734
- Total Number of Portfolio Holdings87
- Portfolio Turnover Rate551%
- Total Advisory Fees Paid$156,593
|
| Holdings [Text Block] |
Holdings DiversificationFootnote Reference1 (% of Net Assets) as of March 31, 2026 Table SummaryValue | Value |
|---|
Other | 2.2% | Transportation | 0.8% | Coal | 0.9% | Energy-Alternate Sources | 3.8% | Mining | 4.7% | Oil & Gas Services | 9.4% | Pipelines | 17.4% | Oil & Gas | 60.4% | |
| Largest Holdings [Text Block] |
10 Largest HoldingsFootnote Reference2 (% of Net Assets) as of March 31, 2026 Table SummaryExxon Mobil Corp. | 6.9% |
|---|
Chevron Corp. | 5.0% |
|---|
ConocoPhillips | 3.3% |
|---|
SLB Ltd. | 2.4% |
|---|
Williams Companies, Inc. | 2.4% |
|---|
EOG Resources, Inc. | 2.3% |
|---|
Valero Energy Corp. | 2.2% |
|---|
Marathon Petroleum Corp. | 2.2% |
|---|
Phillips 66 | 2.2% |
|---|
Baker Hughes Co. | 2.1% |
|---|
Total | 31.0% |
|---|
|
| Material Fund Change [Text Block] |
|
| C000010590 |
|
| Shareholder Report [Line Items] |
|
| Fund Name |
Energy Services Fund
|
| Class Name |
Investor Class
|
| Trading Symbol |
RYVIX
|
| Annual or Semi-Annual Statement [Text Block] |
This annual shareholder report contains important information about the Energy Services Fund for the period from April 1, 2025 to March 31, 2026.
|
| Shareholder Report Annual or Semi-Annual |
Annual Shareholder Report
|
| Additional Information [Text Block] |
You can find additional information about the fund at GuggenheimInvestments.com/mutual-funds/literature. You can also request this information by contacting 800 820 0888 or services@guggenheiminvestments.com.
|
| Additional Information Phone Number |
800 820 0888
|
| Additional Information Email |
<span style="box-sizing: border-box; color: rgb(67, 67, 67); display: inline; flex-wrap: nowrap; font-size: 10.6667px; font-weight: 400; grid-area: auto; line-height: 12.8px; margin: 0px; overflow: visible; text-align: left; text-align-last: auto; white-space-collapse: preserve-breaks;">services@guggenheiminvestments.com</span>
|
| Additional Information Website |
<span style="box-sizing: border-box; color: rgb(67, 67, 67); display: inline; flex-wrap: nowrap; font-size: 10.6667px; font-weight: 400; grid-area: auto; line-height: 12.8px; margin: 0px; overflow: visible; text-align: left; text-align-last: auto; white-space-collapse: preserve-breaks;">GuggenheimInvestments.com/mutual-funds/literature</span>
|
| Expenses [Text Block] |
What were the Fund's costs for the last year? * Based on a hypothetical $10,000 investment Table SummaryClass | Costs of a $10,000 Investment | Costs Paid as a % of a $10,000 Investment |
|---|
Investor Class | $175 | 1.37% |
|---|
Table Summary* | Excludes expenses of the underlying funds in which the fund invests, if any. |
|---|
|
| Expenses Paid, Amount |
$ 175
|
| Factors Affecting Performance [Text Block] |
What factors materially affected the Fund's performance over the last year? The industries that contributed the most to positive performance were oil & gas equipment, oil & gas drilling and oil & gas storage & transportation. No industries detracted from performance. The holdings that contributed the most to performance were Baker Hughes Co., TechnipFMC plc., and Solaris Energy Infrastructure, Inc.—Class A. Those that detracted the most were Atlas Energy Solutions, Inc., ChampionX Corp., and Aris Water Solutions, Inc—Class A. |
| Line Graph [Table Text Block] |
Table Summary | Energy Services Fund (Investor Class) | S&P 500 Index | S&P 500 Energy Index |
|---|
3/31/16 | $10,000 | $10,000 | $10,000 |
|---|
3/31/17 | $11,438 | $11,717 | $11,426 |
|---|
3/31/18 | $9,024 | $13,357 | $11,407 |
|---|
3/31/19 | $6,819 | $14,625 | $11,558 |
|---|
3/31/20 | $1,827 | $13,605 | $5,499 |
|---|
3/31/21 | $4,148 | $21,271 | $9,633 |
|---|
3/31/22 | $5,700 | $24,599 | $15,827 |
|---|
3/31/23 | $5,258 | $22,698 | $17,984 |
|---|
3/31/24 | $6,592 | $29,480 | $21,162 |
|---|
3/31/25 | $5,167 | $31,913 | $21,690 |
|---|
3/31/26 | $8,043 | $37,594 | $29,568 |
|---|
|
| Average Annual Return [Table Text Block] |
Table SummaryAverage Annual Total Returns | One Year | Five Years | Ten Years |
|---|
Investor Class | 55.65% | 14.16% | -2.15% |
|---|
S&P 500 Index | 17.80% | 12.06% | 14.16% |
|---|
S&P 500 Energy Index | 36.21% | 25.14% | 11.45% |
|---|
|
| AssetsNet |
$ 15,701,656
|
| Holdings Count | Holding |
30
|
| Advisory Fees Paid, Amount |
$ 52,294
|
| InvestmentCompanyPortfolioTurnover |
420.00%
|
| Additional Fund Statistics [Text Block] |
Fund Statistics as of March 31, 2026 - Net Assets$15,701,656
- Total Number of Portfolio Holdings30
- Portfolio Turnover Rate420%
- Total Advisory Fees Paid$52,294
|
| Holdings [Text Block] |
Holdings DiversificationFootnote Reference1 (% of Net Assets) as of March 31, 2026 Table SummaryValue | Value |
|---|
Machinery-Diversified | 2.7% | Metal Fabricate & Hardware | 3.1% | Oil & Gas | 25.2% | Oil & Gas Services | 68.2% | |
| Largest Holdings [Text Block] |
10 Largest HoldingsFootnote Reference2 (% of Net Assets) as of March 31, 2026 Table SummarySLB Ltd. | 13.0% |
|---|
Baker Hughes Co. | 11.2% |
|---|
Halliburton Co. | 7.8% |
|---|
TechnipFMC plc | 4.1% |
|---|
Weatherford International plc | 3.8% |
|---|
NOV, Inc. | 3.5% |
|---|
Noble Corporation plc | 3.4% |
|---|
Archrock, Inc. | 3.3% |
|---|
Transocean Ltd. | 3.3% |
|---|
Kodiak Gas Services, Inc. | 3.2% |
|---|
Total | 56.6% |
|---|
|
| Material Fund Change [Text Block] |
|
| C000010592 |
|
| Shareholder Report [Line Items] |
|
| Fund Name |
Energy Services Fund
|
| Class Name |
Class A
|
| Trading Symbol |
RYESX
|
| Annual or Semi-Annual Statement [Text Block] |
This annual shareholder report contains important information about the Energy Services Fund for the period from April 1, 2025 to March 31, 2026.
|
| Shareholder Report Annual or Semi-Annual |
Annual Shareholder Report
|
| Additional Information [Text Block] |
You can find additional information about the fund at GuggenheimInvestments.com/mutual-funds/literature. You can also request this information by contacting 800 820 0888 or services@guggenheiminvestments.com.
|
| Additional Information Phone Number |
800 820 0888
|
| Additional Information Email |
<span style="box-sizing: border-box; color: rgb(67, 67, 67); display: inline; flex-wrap: nowrap; font-size: 10.6667px; font-weight: 400; grid-area: auto; line-height: 12.8px; margin: 0px; overflow: visible; text-align: left; text-align-last: auto; white-space-collapse: preserve-breaks;">services@guggenheiminvestments.com</span>
|
| Additional Information Website |
<span style="box-sizing: border-box; color: rgb(67, 67, 67); display: inline; flex-wrap: nowrap; font-size: 10.6667px; font-weight: 400; grid-area: auto; line-height: 12.8px; margin: 0px; overflow: visible; text-align: left; text-align-last: auto; white-space-collapse: preserve-breaks;">GuggenheimInvestments.com/mutual-funds/literature</span>
|
| Expenses [Text Block] |
What were the Fund's costs for the last year? * Based on a hypothetical $10,000 investment Table SummaryClass | Costs of a $10,000 Investment | Costs Paid as a % of a $10,000 Investment |
|---|
Class A | $208 | 1.63% |
|---|
Table Summary* | Excludes expenses of the underlying funds in which the fund invests, if any. |
|---|
|
| Expenses Paid, Amount |
$ 208
|
| Factors Affecting Performance [Text Block] |
What factors materially affected the Fund's performance over the last year? The industries that contributed the most to positive performance were oil & gas equipment, oil & gas drilling and oil & gas storage & transportation. No industries detracted from performance. The holdings that contributed the most to performance were Baker Hughes Co., TechnipFMC plc., and Solaris Energy Infrastructure, Inc.—Class A. Those that detracted the most were Atlas Energy Solutions, Inc., ChampionX Corp., and Aris Water Solutions, Inc—Class A. |
| Line Graph [Table Text Block] |
Table Summary | Energy Services Fund (Class A)‡ | S&P 500 Index | S&P 500 Energy Index |
|---|
3/31/16 | $9,525 | $10,000 | $10,000 |
|---|
3/31/17 | $10,867 | $11,717 | $11,426 |
|---|
3/31/18 | $8,552 | $13,357 | $11,407 |
|---|
3/31/19 | $6,444 | $14,625 | $11,558 |
|---|
3/31/20 | $1,723 | $13,605 | $5,499 |
|---|
3/31/21 | $3,901 | $21,271 | $9,633 |
|---|
3/31/22 | $5,347 | $24,599 | $15,827 |
|---|
3/31/23 | $4,920 | $22,698 | $17,984 |
|---|
3/31/24 | $6,153 | $29,480 | $21,162 |
|---|
3/31/25 | $4,811 | $31,913 | $21,690 |
|---|
3/31/26 | $7,470 | $37,594 | $29,568 |
|---|
|
| Average Annual Return [Table Text Block] |
Table SummaryAverage Annual Total Returns | One Year | Five Years | Ten Years |
|---|
Class A (without sales charge) | 55.26% | 13.88% | -2.40% |
|---|
Class A (with sales charge) ‡ | 47.91% | 12.78% | -2.87% |
|---|
S&P 500 Index | 17.80% | 12.06% | 14.16% |
|---|
S&P 500 Energy Index | 36.21% | 25.14% | 11.45% |
|---|
|
| AssetsNet |
$ 15,701,656
|
| Holdings Count | Holding |
30
|
| Advisory Fees Paid, Amount |
$ 52,294
|
| InvestmentCompanyPortfolioTurnover |
420.00%
|
| Additional Fund Statistics [Text Block] |
Fund Statistics as of March 31, 2026 - Net Assets$15,701,656
- Total Number of Portfolio Holdings30
- Portfolio Turnover Rate420%
- Total Advisory Fees Paid$52,294
|
| Holdings [Text Block] |
Holdings DiversificationFootnote Reference1 (% of Net Assets) as of March 31, 2026 Table SummaryValue | Value |
|---|
Machinery-Diversified | 2.7% | Metal Fabricate & Hardware | 3.1% | Oil & Gas | 25.2% | Oil & Gas Services | 68.2% | |
| Largest Holdings [Text Block] |
10 Largest HoldingsFootnote Reference2 (% of Net Assets) as of March 31, 2026 Table SummarySLB Ltd. | 13.0% |
|---|
Baker Hughes Co. | 11.2% |
|---|
Halliburton Co. | 7.8% |
|---|
TechnipFMC plc | 4.1% |
|---|
Weatherford International plc | 3.8% |
|---|
NOV, Inc. | 3.5% |
|---|
Noble Corporation plc | 3.4% |
|---|
Archrock, Inc. | 3.3% |
|---|
Transocean Ltd. | 3.3% |
|---|
Kodiak Gas Services, Inc. | 3.2% |
|---|
Total | 56.6% |
|---|
|
| Material Fund Change [Text Block] |
|
| C000010593 |
|
| Shareholder Report [Line Items] |
|
| Fund Name |
Energy Services Fund
|
| Class Name |
Class C
|
| Trading Symbol |
RYVCX
|
| Annual or Semi-Annual Statement [Text Block] |
This annual shareholder report contains important information about the Energy Services Fund for the period from April 1, 2025 to March 31, 2026.
|
| Shareholder Report Annual or Semi-Annual |
Annual Shareholder Report
|
| Additional Information [Text Block] |
You can find additional information about the fund at GuggenheimInvestments.com/mutual-funds/literature. You can also request this information by contacting 800 820 0888 or services@guggenheiminvestments.com.
|
| Additional Information Phone Number |
800 820 0888
|
| Additional Information Email |
<span style="box-sizing: border-box; color: rgb(67, 67, 67); display: inline; flex-wrap: nowrap; font-size: 10.6667px; font-weight: 400; grid-area: auto; line-height: 12.8px; margin: 0px; overflow: visible; text-align: left; text-align-last: auto; white-space-collapse: preserve-breaks;">services@guggenheiminvestments.com</span>
|
| Additional Information Website |
<span style="box-sizing: border-box; color: rgb(67, 67, 67); display: inline; flex-wrap: nowrap; font-size: 10.6667px; font-weight: 400; grid-area: auto; line-height: 12.8px; margin: 0px; overflow: visible; text-align: left; text-align-last: auto; white-space-collapse: preserve-breaks;">GuggenheimInvestments.com/mutual-funds/literature</span>
|
| Expenses [Text Block] |
What were the Fund's costs for the last year? * Based on a hypothetical $10,000 investment Table SummaryClass | Costs of a $10,000 Investment | Costs Paid as a % of a $10,000 Investment |
|---|
Class C | $302 | 2.38% |
|---|
Table Summary* | Excludes expenses of the underlying funds in which the fund invests, if any. |
|---|
|
| Expenses Paid, Amount |
$ 302
|
| Factors Affecting Performance [Text Block] |
What factors materially affected the Fund's performance over the last year? The industries that contributed the most to positive performance were oil & gas equipment, oil & gas drilling and oil & gas storage & transportation. No industries detracted from performance. The holdings that contributed the most to performance were Baker Hughes Co., TechnipFMC plc., and Solaris Energy Infrastructure, Inc.—Class A. Those that detracted the most were Atlas Energy Solutions, Inc., ChampionX Corp., and Aris Water Solutions, Inc—Class A. |
| Line Graph [Table Text Block] |
Table Summary | Energy Services Fund (Class C) | S&P 500 Index | S&P 500 Energy Index |
|---|
3/31/16 | $10,000 | $10,000 | $10,000 |
|---|
3/31/17 | $11,322 | $11,717 | $11,426 |
|---|
3/31/18 | $8,844 | $13,357 | $11,407 |
|---|
3/31/19 | $6,618 | $14,625 | $11,558 |
|---|
3/31/20 | $1,757 | $13,605 | $5,499 |
|---|
3/31/21 | $3,946 | $21,271 | $9,633 |
|---|
3/31/22 | $5,369 | $24,599 | $15,827 |
|---|
3/31/23 | $4,903 | $22,698 | $17,984 |
|---|
3/31/24 | $6,086 | $29,480 | $21,162 |
|---|
3/31/25 | $4,723 | $31,913 | $21,690 |
|---|
3/31/26 | $7,278 | $37,594 | $29,568 |
|---|
|
| Average Annual Return [Table Text Block] |
Table SummaryAverage Annual Total Returns | One Year | Five Years | Ten Years |
|---|
Class C (without CDSC) | 54.09% | 13.03% | -3.13% |
|---|
Class C (with CDSC) ‡ | 53.09% | 13.03% | -3.13% |
|---|
S&P 500 Index | 17.80% | 12.06% | 14.16% |
|---|
S&P 500 Energy Index | 36.21% | 25.14% | 11.45% |
|---|
|
| AssetsNet |
$ 15,701,656
|
| Holdings Count | Holding |
30
|
| Advisory Fees Paid, Amount |
$ 52,294
|
| InvestmentCompanyPortfolioTurnover |
420.00%
|
| Additional Fund Statistics [Text Block] |
Fund Statistics as of March 31, 2026 - Net Assets$15,701,656
- Total Number of Portfolio Holdings30
- Portfolio Turnover Rate420%
- Total Advisory Fees Paid$52,294
|
| Holdings [Text Block] |
Holdings DiversificationFootnote Reference1 (% of Net Assets) as of March 31, 2026 Table SummaryValue | Value |
|---|
Machinery-Diversified | 2.7% | Metal Fabricate & Hardware | 3.1% | Oil & Gas | 25.2% | Oil & Gas Services | 68.2% | |
| Largest Holdings [Text Block] |
10 Largest HoldingsFootnote Reference2 (% of Net Assets) as of March 31, 2026 Table SummarySLB Ltd. | 13.0% |
|---|
Baker Hughes Co. | 11.2% |
|---|
Halliburton Co. | 7.8% |
|---|
TechnipFMC plc | 4.1% |
|---|
Weatherford International plc | 3.8% |
|---|
NOV, Inc. | 3.5% |
|---|
Noble Corporation plc | 3.4% |
|---|
Archrock, Inc. | 3.3% |
|---|
Transocean Ltd. | 3.3% |
|---|
Kodiak Gas Services, Inc. | 3.2% |
|---|
Total | 56.6% |
|---|
|
| Material Fund Change [Text Block] |
|
| C000010591 |
|
| Shareholder Report [Line Items] |
|
| Fund Name |
Energy Services Fund
|
| Class Name |
Class H
|
| Trading Symbol |
RYVAX
|
| Annual or Semi-Annual Statement [Text Block] |
This annual shareholder report contains important information about the Energy Services Fund for the period from April 1, 2025 to March 31, 2026.
|
| Shareholder Report Annual or Semi-Annual |
Annual Shareholder Report
|
| Additional Information [Text Block] |
You can find additional information about the fund at GuggenheimInvestments.com/mutual-funds/literature. You can also request this information by contacting 800 820 0888 or services@guggenheiminvestments.com.
|
| Additional Information Phone Number |
800 820 0888
|
| Additional Information Email |
<span style="box-sizing: border-box; color: rgb(67, 67, 67); display: inline; flex-wrap: nowrap; font-size: 10.6667px; font-weight: 400; grid-area: auto; line-height: 12.8px; margin: 0px; overflow: visible; text-align: left; text-align-last: auto; white-space-collapse: preserve-breaks;">services@guggenheiminvestments.com</span>
|
| Additional Information Website |
<span style="box-sizing: border-box; color: rgb(67, 67, 67); display: inline; flex-wrap: nowrap; font-size: 10.6667px; font-weight: 400; grid-area: auto; line-height: 12.8px; margin: 0px; overflow: visible; text-align: left; text-align-last: auto; white-space-collapse: preserve-breaks;">GuggenheimInvestments.com/mutual-funds/literature</span>
|
| Expenses [Text Block] |
What were the Fund's costs for the last year? * Based on a hypothetical $10,000 investment Table SummaryClass | Costs of a $10,000 Investment | Costs Paid as a % of a $10,000 Investment |
|---|
Class H | $210 | 1.62% |
|---|
Table Summary* | Excludes expenses of the underlying funds in which the fund invests, if any. |
|---|
|
| Expenses Paid, Amount |
$ 210
|
| Factors Affecting Performance [Text Block] |
What factors materially affected the Fund's performance over the last year? The industries that contributed the most to positive performance were oil & gas equipment, oil & gas drilling and oil & gas storage & transportation. No industries detracted from performance. The holdings that contributed the most to performance were Baker Hughes Co., TechnipFMC plc., and Solaris Energy Infrastructure, Inc.—Class A. Those that detracted the most were Atlas Energy Solutions, Inc., ChampionX Corp., and Aris Water Solutions, Inc—Class A. |
| Line Graph [Table Text Block] |
Table Summary | Energy Services Fund (Class H) | S&P 500 Index | S&P 500 Energy Index |
|---|
3/31/16 | $10,000 | $10,000 | $10,000 |
|---|
3/31/17 | $11,402 | $11,717 | $11,426 |
|---|
3/31/18 | $8,962 | $13,357 | $11,407 |
|---|
3/31/19 | $6,751 | $14,625 | $11,558 |
|---|
3/31/20 | $1,810 | $13,605 | $5,499 |
|---|
3/31/21 | $4,095 | $21,271 | $9,633 |
|---|
3/31/22 | $5,614 | $24,599 | $15,827 |
|---|
3/31/23 | $5,165 | $22,698 | $17,984 |
|---|
3/31/24 | $6,461 | $29,480 | $21,162 |
|---|
3/31/25 | $5,051 | $31,913 | $21,690 |
|---|
3/31/26 | $8,038 | $37,594 | $29,568 |
|---|
|
| Average Annual Return [Table Text Block] |
Table SummaryAverage Annual Total Returns | One Year | Five Years | Ten Years |
|---|
Class H | 59.14% | 14.44% | -2.16% |
|---|
S&P 500 Index | 17.80% | 12.06% | 14.16% |
|---|
S&P 500 Energy Index | 36.21% | 25.14% | 11.45% |
|---|
|
| AssetsNet |
$ 15,701,656
|
| Holdings Count | Holding |
30
|
| Advisory Fees Paid, Amount |
$ 52,294
|
| InvestmentCompanyPortfolioTurnover |
420.00%
|
| Additional Fund Statistics [Text Block] |
Fund Statistics as of March 31, 2026 - Net Assets$15,701,656
- Total Number of Portfolio Holdings30
- Portfolio Turnover Rate420%
- Total Advisory Fees Paid$52,294
|
| Holdings [Text Block] |
Holdings DiversificationFootnote Reference1 (% of Net Assets) as of March 31, 2026 Table SummaryValue | Value |
|---|
Machinery-Diversified | 2.7% | Metal Fabricate & Hardware | 3.1% | Oil & Gas | 25.2% | Oil & Gas Services | 68.2% | |
| Largest Holdings [Text Block] |
10 Largest HoldingsFootnote Reference2 (% of Net Assets) as of March 31, 2026 Table SummarySLB Ltd. | 13.0% |
|---|
Baker Hughes Co. | 11.2% |
|---|
Halliburton Co. | 7.8% |
|---|
TechnipFMC plc | 4.1% |
|---|
Weatherford International plc | 3.8% |
|---|
NOV, Inc. | 3.5% |
|---|
Noble Corporation plc | 3.4% |
|---|
Archrock, Inc. | 3.3% |
|---|
Transocean Ltd. | 3.3% |
|---|
Kodiak Gas Services, Inc. | 3.2% |
|---|
Total | 56.6% |
|---|
|
| Material Fund Change [Text Block] |
|
| C000010614 |
|
| Shareholder Report [Line Items] |
|
| Fund Name |
Financial Services Fund
|
| Class Name |
Investor Class
|
| Trading Symbol |
RYFIX
|
| Annual or Semi-Annual Statement [Text Block] |
This annual shareholder report contains important information about the Financial Services Fund for the period from April 1, 2025 to March 31, 2026.
|
| Shareholder Report Annual or Semi-Annual |
Annual Shareholder Report
|
| Additional Information [Text Block] |
You can find additional information about the fund at GuggenheimInvestments.com/mutual-funds/literature. You can also request this information by contacting 800 820 0888 or services@guggenheiminvestments.com.
|
| Additional Information Phone Number |
800 820 0888
|
| Additional Information Email |
<span style="box-sizing: border-box; color: rgb(67, 67, 67); display: inline; flex-wrap: nowrap; font-size: 10.6667px; font-weight: 400; grid-area: auto; line-height: 12.8px; margin: 0px; overflow: visible; text-align: left; text-align-last: auto; white-space-collapse: preserve-breaks;">services@guggenheiminvestments.com</span>
|
| Additional Information Website |
<span style="box-sizing: border-box; color: rgb(67, 67, 67); display: inline; flex-wrap: nowrap; font-size: 10.6667px; font-weight: 400; grid-area: auto; line-height: 12.8px; margin: 0px; overflow: visible; text-align: left; text-align-last: auto; white-space-collapse: preserve-breaks;">GuggenheimInvestments.com/mutual-funds/literature</span>
|
| Expenses [Text Block] |
What were the Fund's costs for the last year? * Based on a hypothetical $10,000 investment Table SummaryClass | Costs of a $10,000 Investment | Costs Paid as a % of a $10,000 Investment |
|---|
Investor Class | $142 | 1.41% |
|---|
Table Summary* | Excludes expenses of the underlying funds in which the fund invests, if any. |
|---|
|
| Expenses Paid, Amount |
$ 142
|
| Factors Affecting Performance [Text Block] |
What factors materially affected the Fund's performance over the last year? The industries that contributed the most to performance were diversified banks, investment banking & brokerage, and regional banks. Those that detracted the most were transaction & payment processing services, insurance brokers, and multi-family residential REITs. The holdings that contributed the most to performance were Goldman Sachs Group, Inc., Citigroup, Inc., and JPMorgan Chase & Co. Those that detracted the most were Fiserv, Inc., Arthur J. Gallagher & Co., and Berkshire Hathaway, Inc.—Class B. |
| Line Graph [Table Text Block] |
Table Summary | Financial Services Fund (Investor Class) | S&P 500 Index | S&P 500 Financials Index |
|---|
3/31/16 | $10,000 | $10,000 | $10,000 |
|---|
3/31/17 | $12,172 | $11,717 | $13,261 |
|---|
3/31/18 | $13,556 | $13,357 | $15,652 |
|---|
3/31/19 | $13,537 | $14,625 | $14,920 |
|---|
3/31/20 | $10,850 | $13,605 | $12,362 |
|---|
3/31/21 | $17,583 | $21,271 | $20,706 |
|---|
3/31/22 | $20,348 | $24,599 | $23,749 |
|---|
3/31/23 | $16,613 | $22,698 | $20,368 |
|---|
3/31/24 | $21,393 | $29,480 | $27,200 |
|---|
3/31/25 | $24,438 | $31,913 | $32,691 |
|---|
3/31/26 | $24,938 | $37,594 | $32,927 |
|---|
|
| Average Annual Return [Table Text Block] |
Table SummaryAverage Annual Total Returns | One Year | Five Years | Ten Years |
|---|
Investor Class | 2.04% | 7.24% | 9.57% |
|---|
S&P 500 Index | 17.80% | 12.06% | 14.16% |
|---|
S&P 500 Financials Index | 0.72% | 9.72% | 12.66% |
|---|
|
| AssetsNet |
$ 7,395,026
|
| Holdings Count | Holding |
158
|
| Advisory Fees Paid, Amount |
$ 130,641
|
| InvestmentCompanyPortfolioTurnover |
446.00%
|
| Additional Fund Statistics [Text Block] |
Fund Statistics as of March 31, 2026 - Net Assets$7,395,026
- Total Number of Portfolio Holdings158
- Portfolio Turnover Rate446%
- Total Advisory Fees Paid$130,641
|
| Holdings [Text Block] |
Holdings DiversificationFootnote Reference1 (% of Net Assets) as of March 31, 2026 Table SummaryValue | Value |
|---|
Other | 1.7% | Software | 2.0% | Private Equity | 3.3% | Commercial Services | 6.4% | REITS | 16.1% | Insurance | 17.1% | Diversified Financial Services | 24.5% | Banks | 28.4% | |
| Largest Holdings [Text Block] |
10 Largest HoldingsFootnote Reference2 (% of Net Assets) as of March 31, 2026 Table SummaryBerkshire Hathaway, Inc. — Class B | 3.2% |
|---|
JPMorgan Chase & Co. | 2.9% |
|---|
Visa, Inc. — Class A | 2.5% |
|---|
Mastercard, Inc. — Class A | 2.1% |
|---|
Bank of America Corp. | 1.9% |
|---|
Goldman Sachs Group, Inc. | 1.7% |
|---|
Wells Fargo & Co. | 1.7% |
|---|
Citigroup, Inc. | 1.5% |
|---|
Morgan Stanley | 1.5% |
|---|
Charles Schwab Corp. | 1.3% |
|---|
Total | 20.3% |
|---|
|
| Material Fund Change [Text Block] |
|
| C000010616 |
|
| Shareholder Report [Line Items] |
|
| Fund Name |
Financial Services Fund
|
| Class Name |
Class A
|
| Trading Symbol |
RYFNX
|
| Annual or Semi-Annual Statement [Text Block] |
This annual shareholder report contains important information about the Financial Services Fund for the period from April 1, 2025 to March 31, 2026.
|
| Shareholder Report Annual or Semi-Annual |
Annual Shareholder Report
|
| Additional Information [Text Block] |
You can find additional information about the fund at GuggenheimInvestments.com/mutual-funds/literature. You can also request this information by contacting 800 820 0888 or services@guggenheiminvestments.com.
|
| Additional Information Phone Number |
800 820 0888
|
| Additional Information Email |
<span style="box-sizing: border-box; color: rgb(67, 67, 67); display: inline; flex-wrap: nowrap; font-size: 10.6667px; font-weight: 400; grid-area: auto; line-height: 12.8px; margin: 0px; overflow: visible; text-align: left; text-align-last: auto; white-space-collapse: preserve-breaks;">services@guggenheiminvestments.com</span>
|
| Additional Information Website |
<span style="box-sizing: border-box; color: rgb(67, 67, 67); display: inline; flex-wrap: nowrap; font-size: 10.6667px; font-weight: 400; grid-area: auto; line-height: 12.8px; margin: 0px; overflow: visible; text-align: left; text-align-last: auto; white-space-collapse: preserve-breaks;">GuggenheimInvestments.com/mutual-funds/literature</span>
|
| Expenses [Text Block] |
What were the Fund's costs for the last year? * Based on a hypothetical $10,000 investment Table SummaryClass | Costs of a $10,000 Investment | Costs Paid as a % of a $10,000 Investment |
|---|
Class A | $165 | 1.64% |
|---|
Table Summary* | Excludes expenses of the underlying funds in which the fund invests, if any. |
|---|
|
| Expenses Paid, Amount |
$ 165
|
| Factors Affecting Performance [Text Block] |
What factors materially affected the Fund's performance over the last year? The industries that contributed the most to performance were diversified banks, investment banking & brokerage, and regional banks. Those that detracted the most were transaction & payment processing services, insurance brokers, and multi-family residential REITs. The holdings that contributed the most to performance were Goldman Sachs Group, Inc., Citigroup, Inc., and JPMorgan Chase & Co. Those that detracted the most were Fiserv, Inc., Arthur J. Gallagher & Co., and Berkshire Hathaway, Inc.—Class B. |
| Line Graph [Table Text Block] |
Table Summary | Financial Services Fund (Class A)‡ | S&P 500 Index | S&P 500 Financials Index |
|---|
3/31/16 | $9,525 | $10,000 | $10,000 |
|---|
3/31/17 | $11,565 | $11,717 | $13,261 |
|---|
3/31/18 | $12,846 | $13,357 | $15,652 |
|---|
3/31/19 | $12,793 | $14,625 | $14,920 |
|---|
3/31/20 | $10,229 | $13,605 | $12,362 |
|---|
3/31/21 | $16,538 | $21,271 | $20,706 |
|---|
3/31/22 | $19,089 | $24,599 | $23,749 |
|---|
3/31/23 | $15,547 | $22,698 | $20,368 |
|---|
3/31/24 | $19,971 | $29,480 | $27,200 |
|---|
3/31/25 | $22,758 | $31,913 | $32,691 |
|---|
3/31/26 | $23,162 | $37,594 | $32,927 |
|---|
|
| Average Annual Return [Table Text Block] |
Table SummaryAverage Annual Total Returns | One Year | Five Years | Ten Years |
|---|
Class A (without sales charge) | 1.78% | 6.97% | 9.29% |
|---|
Class A (with sales charge) ‡ | -3.07% | 5.93% | 8.76% |
|---|
S&P 500 Index | 17.80% | 12.06% | 14.16% |
|---|
S&P 500 Financials Index | 0.72% | 9.72% | 12.66% |
|---|
|
| AssetsNet |
$ 7,395,026
|
| Holdings Count | Holding |
158
|
| Advisory Fees Paid, Amount |
$ 130,641
|
| InvestmentCompanyPortfolioTurnover |
446.00%
|
| Additional Fund Statistics [Text Block] |
Fund Statistics as of March 31, 2026 - Net Assets$7,395,026
- Total Number of Portfolio Holdings158
- Portfolio Turnover Rate446%
- Total Advisory Fees Paid$130,641
|
| Holdings [Text Block] |
Holdings DiversificationFootnote Reference1 (% of Net Assets) as of March 31, 2026 Table SummaryValue | Value |
|---|
Other | 1.7% | Software | 2.0% | Private Equity | 3.3% | Commercial Services | 6.4% | REITS | 16.1% | Insurance | 17.1% | Diversified Financial Services | 24.5% | Banks | 28.4% | |
| Largest Holdings [Text Block] |
10 Largest HoldingsFootnote Reference2 (% of Net Assets) as of March 31, 2026 Table SummaryBerkshire Hathaway, Inc. — Class B | 3.2% |
|---|
JPMorgan Chase & Co. | 2.9% |
|---|
Visa, Inc. — Class A | 2.5% |
|---|
Mastercard, Inc. — Class A | 2.1% |
|---|
Bank of America Corp. | 1.9% |
|---|
Goldman Sachs Group, Inc. | 1.7% |
|---|
Wells Fargo & Co. | 1.7% |
|---|
Citigroup, Inc. | 1.5% |
|---|
Morgan Stanley | 1.5% |
|---|
Charles Schwab Corp. | 1.3% |
|---|
Total | 20.3% |
|---|
|
| Material Fund Change [Text Block] |
|
| C000010617 |
|
| Shareholder Report [Line Items] |
|
| Fund Name |
Financial Services Fund
|
| Class Name |
Class C
|
| Trading Symbol |
RYFCX
|
| Annual or Semi-Annual Statement [Text Block] |
This annual shareholder report contains important information about the Financial Services Fund for the period from April 1, 2025 to March 31, 2026.
|
| Shareholder Report Annual or Semi-Annual |
Annual Shareholder Report
|
| Additional Information [Text Block] |
You can find additional information about the fund at GuggenheimInvestments.com/mutual-funds/literature. You can also request this information by contacting 800 820 0888 or services@guggenheiminvestments.com.
|
| Additional Information Phone Number |
800 820 0888
|
| Additional Information Email |
<span style="box-sizing: border-box; color: rgb(67, 67, 67); display: inline; flex-wrap: nowrap; font-size: 10.6667px; font-weight: 400; grid-area: auto; line-height: 12.8px; margin: 0px; overflow: visible; text-align: left; text-align-last: auto; white-space-collapse: preserve-breaks;">services@guggenheiminvestments.com</span>
|
| Additional Information Website |
<span style="box-sizing: border-box; color: rgb(67, 67, 67); display: inline; flex-wrap: nowrap; font-size: 10.6667px; font-weight: 400; grid-area: auto; line-height: 12.8px; margin: 0px; overflow: visible; text-align: left; text-align-last: auto; white-space-collapse: preserve-breaks;">GuggenheimInvestments.com/mutual-funds/literature</span>
|
| Expenses [Text Block] |
What were the Fund's costs for the last year? * Based on a hypothetical $10,000 investment Table SummaryClass | Costs of a $10,000 Investment | Costs Paid as a % of a $10,000 Investment |
|---|
Class C | $240 | 2.39% |
|---|
Table Summary* | Excludes expenses of the underlying funds in which the fund invests, if any. |
|---|
|
| Expenses Paid, Amount |
$ 240
|
| Factors Affecting Performance [Text Block] |
What factors materially affected the Fund's performance over the last year? The industries that contributed the most to performance were diversified banks, investment banking & brokerage, and regional banks. Those that detracted the most were transaction & payment processing services, insurance brokers, and multi-family residential REITs. The holdings that contributed the most to performance were Goldman Sachs Group, Inc., Citigroup, Inc., and JPMorgan Chase & Co. Those that detracted the most were Fiserv, Inc., Arthur J. Gallagher & Co., and Berkshire Hathaway, Inc.—Class B. |
| Line Graph [Table Text Block] |
Table Summary | Financial Services Fund (Class C) | S&P 500 Index | S&P 500 Financials Index |
|---|
3/31/16 | $10,000 | $10,000 | $10,000 |
|---|
3/31/17 | $12,051 | $11,717 | $13,261 |
|---|
3/31/18 | $13,289 | $13,357 | $15,652 |
|---|
3/31/19 | $13,137 | $14,625 | $14,920 |
|---|
3/31/20 | $10,425 | $13,605 | $12,362 |
|---|
3/31/21 | $16,729 | $21,271 | $20,706 |
|---|
3/31/22 | $19,164 | $24,599 | $23,749 |
|---|
3/31/23 | $15,490 | $22,698 | $20,368 |
|---|
3/31/24 | $19,751 | $29,480 | $27,200 |
|---|
3/31/25 | $22,339 | $31,913 | $32,691 |
|---|
3/31/26 | $22,566 | $37,594 | $32,927 |
|---|
|
| Average Annual Return [Table Text Block] |
Table SummaryAverage Annual Total Returns | One Year | Five Years | Ten Years |
|---|
Class C (without CDSC) | 1.02% | 6.17% | 8.48% |
|---|
Class C (with CDSC) ‡ | 0.02% | 6.17% | 8.48% |
|---|
S&P 500 Index | 17.80% | 12.06% | 14.16% |
|---|
S&P 500 Financials Index | 0.72% | 9.72% | 12.66% |
|---|
|
| AssetsNet |
$ 7,395,026
|
| Holdings Count | Holding |
158
|
| Advisory Fees Paid, Amount |
$ 130,641
|
| InvestmentCompanyPortfolioTurnover |
446.00%
|
| Additional Fund Statistics [Text Block] |
Fund Statistics as of March 31, 2026 - Net Assets$7,395,026
- Total Number of Portfolio Holdings158
- Portfolio Turnover Rate446%
- Total Advisory Fees Paid$130,641
|
| Holdings [Text Block] |
Holdings DiversificationFootnote Reference1 (% of Net Assets) as of March 31, 2026 Table SummaryValue | Value |
|---|
Other | 1.7% | Software | 2.0% | Private Equity | 3.3% | Commercial Services | 6.4% | REITS | 16.1% | Insurance | 17.1% | Diversified Financial Services | 24.5% | Banks | 28.4% | |
| Largest Holdings [Text Block] |
10 Largest HoldingsFootnote Reference2 (% of Net Assets) as of March 31, 2026 Table SummaryBerkshire Hathaway, Inc. — Class B | 3.2% |
|---|
JPMorgan Chase & Co. | 2.9% |
|---|
Visa, Inc. — Class A | 2.5% |
|---|
Mastercard, Inc. — Class A | 2.1% |
|---|
Bank of America Corp. | 1.9% |
|---|
Goldman Sachs Group, Inc. | 1.7% |
|---|
Wells Fargo & Co. | 1.7% |
|---|
Citigroup, Inc. | 1.5% |
|---|
Morgan Stanley | 1.5% |
|---|
Charles Schwab Corp. | 1.3% |
|---|
Total | 20.3% |
|---|
|
| Material Fund Change [Text Block] |
|
| C000010615 |
|
| Shareholder Report [Line Items] |
|
| Fund Name |
Financial Services Fund
|
| Class Name |
Class H
|
| Trading Symbol |
RYFAX
|
| Annual or Semi-Annual Statement [Text Block] |
This annual shareholder report contains important information about the Financial Services Fund for the period from April 1, 2025 to March 31, 2026.
|
| Shareholder Report Annual or Semi-Annual |
Annual Shareholder Report
|
| Additional Information [Text Block] |
You can find additional information about the fund at GuggenheimInvestments.com/mutual-funds/literature. You can also request this information by contacting 800 820 0888 or services@guggenheiminvestments.com.
|
| Additional Information Phone Number |
800 820 0888
|
| Additional Information Email |
<span style="box-sizing: border-box; color: rgb(67, 67, 67); display: inline; flex-wrap: nowrap; font-size: 10.6667px; font-weight: 400; grid-area: auto; line-height: 12.8px; margin: 0px; overflow: visible; text-align: left; text-align-last: auto; white-space-collapse: preserve-breaks;">services@guggenheiminvestments.com</span>
|
| Additional Information Website |
<span style="box-sizing: border-box; color: rgb(67, 67, 67); display: inline; flex-wrap: nowrap; font-size: 10.6667px; font-weight: 400; grid-area: auto; line-height: 12.8px; margin: 0px; overflow: visible; text-align: left; text-align-last: auto; white-space-collapse: preserve-breaks;">GuggenheimInvestments.com/mutual-funds/literature</span>
|
| Expenses [Text Block] |
What were the Fund's costs for the last year? * Based on a hypothetical $10,000 investment Table SummaryClass | Costs of a $10,000 Investment | Costs Paid as a % of a $10,000 Investment |
|---|
Class H | $165 | 1.64% |
|---|
Table Summary* | Excludes expenses of the underlying funds in which the fund invests, if any. |
|---|
|
| Expenses Paid, Amount |
$ 165
|
| Factors Affecting Performance [Text Block] |
What factors materially affected the Fund's performance over the last year? The industries that contributed the most to performance were diversified banks, investment banking & brokerage, and regional banks. Those that detracted the most were transaction & payment processing services, insurance brokers, and multi-family residential REITs. The holdings that contributed the most to performance were Goldman Sachs Group, Inc., Citigroup, Inc., and JPMorgan Chase & Co. Those that detracted the most were Fiserv, Inc., Arthur J. Gallagher & Co., and Berkshire Hathaway, Inc.—Class B. |
| Line Graph [Table Text Block] |
Table Summary | Financial Services Fund (Class H) | S&P 500 Index | S&P 500 Financials Index |
|---|
3/31/16 | $10,000 | $10,000 | $10,000 |
|---|
3/31/17 | $12,143 | $11,717 | $13,261 |
|---|
3/31/18 | $13,491 | $13,357 | $15,652 |
|---|
3/31/19 | $13,435 | $14,625 | $14,920 |
|---|
3/31/20 | $10,741 | $13,605 | $12,362 |
|---|
3/31/21 | $17,364 | $21,271 | $20,706 |
|---|
3/31/22 | $20,049 | $24,599 | $23,749 |
|---|
3/31/23 | $16,329 | $22,698 | $20,368 |
|---|
3/31/24 | $20,974 | $29,480 | $27,200 |
|---|
3/31/25 | $23,900 | $31,913 | $32,691 |
|---|
3/31/26 | $24,325 | $37,594 | $32,927 |
|---|
|
| Average Annual Return [Table Text Block] |
Table SummaryAverage Annual Total Returns | One Year | Five Years | Ten Years |
|---|
Class H | 1.78% | 6.97% | 9.30% |
|---|
S&P 500 Index | 17.80% | 12.06% | 14.16% |
|---|
S&P 500 Financials Index | 0.72% | 9.72% | 12.66% |
|---|
|
| AssetsNet |
$ 7,395,026
|
| Holdings Count | Holding |
158
|
| Advisory Fees Paid, Amount |
$ 130,641
|
| InvestmentCompanyPortfolioTurnover |
446.00%
|
| Additional Fund Statistics [Text Block] |
Fund Statistics as of March 31, 2026 - Net Assets$7,395,026
- Total Number of Portfolio Holdings158
- Portfolio Turnover Rate446%
- Total Advisory Fees Paid$130,641
|
| Holdings [Text Block] |
Holdings DiversificationFootnote Reference1 (% of Net Assets) as of March 31, 2026 Table SummaryValue | Value |
|---|
Other | 1.7% | Software | 2.0% | Private Equity | 3.3% | Commercial Services | 6.4% | REITS | 16.1% | Insurance | 17.1% | Diversified Financial Services | 24.5% | Banks | 28.4% | |
| Largest Holdings [Text Block] |
10 Largest HoldingsFootnote Reference2 (% of Net Assets) as of March 31, 2026 Table SummaryBerkshire Hathaway, Inc. — Class B | 3.2% |
|---|
JPMorgan Chase & Co. | 2.9% |
|---|
Visa, Inc. — Class A | 2.5% |
|---|
Mastercard, Inc. — Class A | 2.1% |
|---|
Bank of America Corp. | 1.9% |
|---|
Goldman Sachs Group, Inc. | 1.7% |
|---|
Wells Fargo & Co. | 1.7% |
|---|
Citigroup, Inc. | 1.5% |
|---|
Morgan Stanley | 1.5% |
|---|
Charles Schwab Corp. | 1.3% |
|---|
Total | 20.3% |
|---|
|
| Material Fund Change [Text Block] |
|
| C000010618 |
|
| Shareholder Report [Line Items] |
|
| Fund Name |
Health Care Fund
|
| Class Name |
Investor Class
|
| Trading Symbol |
RYHIX
|
| Annual or Semi-Annual Statement [Text Block] |
This annual shareholder report contains important information about the Health Care Fund for the period from April 1, 2025 to March 31, 2026.
|
| Shareholder Report Annual or Semi-Annual |
Annual Shareholder Report
|
| Additional Information [Text Block] |
You can find additional information about the fund at GuggenheimInvestments.com/mutual-funds/literature. You can also request this information by contacting 800 820 0888 or services@guggenheiminvestments.com.
|
| Additional Information Phone Number |
800 820 0888
|
| Additional Information Email |
<span style="box-sizing: border-box; color: rgb(67, 67, 67); display: inline; flex-wrap: nowrap; font-size: 10.6667px; font-weight: 400; grid-area: auto; line-height: 12.8px; margin: 0px; overflow: visible; text-align: left; text-align-last: auto; white-space-collapse: preserve-breaks;">services@guggenheiminvestments.com</span>
|
| Additional Information Website |
<span style="box-sizing: border-box; color: rgb(67, 67, 67); display: inline; flex-wrap: nowrap; font-size: 10.6667px; font-weight: 400; grid-area: auto; line-height: 12.8px; margin: 0px; overflow: visible; text-align: left; text-align-last: auto; white-space-collapse: preserve-breaks;">GuggenheimInvestments.com/mutual-funds/literature</span>
|
| Expenses [Text Block] |
What were the Fund's costs for the last year? * Based on a hypothetical $10,000 investment Table SummaryClass | Costs of a $10,000 Investment | Costs Paid as a % of a $10,000 Investment |
|---|
Investor Class | $143 | 1.38% |
|---|
Table Summary* | Excludes expenses of the underlying funds in which the fund invests, if any. |
|---|
|
| Expenses Paid, Amount |
$ 143
|
| Factors Affecting Performance [Text Block] |
What factors materially affected the Fund's performance over the last year? The industries that contributed the most to performance were biotechnology, pharmaceuticals, and health care distributors. Those that detracted the most were managed health care, health care equipment, and health care supplies. The holdings that contributed the most to performance were Johnson & Johnson, Merck & Company, Inc., and Insmed, Inc. Those that detracted the most were UnitedHealth Group, Inc., Boston Scientific Corp., and Elevance Health, Inc. |
| Line Graph [Table Text Block] |
Table Summary | Health Care Fund (Investor Class) | S&P 500 Index | S&P 500 Health Care Index |
|---|
3/31/16 | $10,000 | $10,000 | $10,000 |
|---|
3/31/17 | $11,020 | $11,717 | $11,159 |
|---|
3/31/18 | $12,494 | $13,357 | $12,417 |
|---|
3/31/19 | $14,087 | $14,625 | $14,266 |
|---|
3/31/20 | $13,313 | $13,605 | $14,121 |
|---|
3/31/21 | $18,803 | $21,271 | $18,928 |
|---|
3/31/22 | $20,571 | $24,599 | $22,542 |
|---|
3/31/23 | $19,304 | $22,698 | $21,709 |
|---|
3/31/24 | $21,987 | $29,480 | $25,202 |
|---|
3/31/25 | $21,118 | $31,913 | $25,303 |
|---|
3/31/26 | $22,528 | $37,594 | $25,888 |
|---|
|
| Average Annual Return [Table Text Block] |
Table SummaryAverage Annual Total Returns | One Year | Five Years | Ten Years |
|---|
Investor Class | 6.67% | 3.68% | 8.46% |
|---|
S&P 500 Index | 17.80% | 12.06% | 14.16% |
|---|
S&P 500 Health Care Index | 2.31% | 6.46% | 9.98% |
|---|
|
| AssetsNet |
$ 18,233,272
|
| Holdings Count | Holding |
136
|
| Advisory Fees Paid, Amount |
$ 166,674
|
| InvestmentCompanyPortfolioTurnover |
244.00%
|
| Additional Fund Statistics [Text Block] |
Fund Statistics as of March 31, 2026 - Net Assets$18,233,272
- Total Number of Portfolio Holdings136
- Portfolio Turnover Rate244%
- Total Advisory Fees Paid$166,674
|
| Holdings [Text Block] |
Holdings DiversificationFootnote Reference1 (% of Net Assets) as of March 31, 2026 Table SummaryValue | Value |
|---|
Internet | 0.3% | Electronics | 0.7% | Software | 0.9% | Healthcare-Services | 14.1% | Biotechnology | 23.8% | Healthcare-Products | 26.2% | Pharmaceuticals | 33.6% | |
| Largest Holdings [Text Block] |
10 Largest HoldingsFootnote Reference2 (% of Net Assets) as of March 31, 2026 Table SummaryEli Lilly & Co. | 3.9% |
|---|
Johnson & Johnson | 3.4% |
|---|
AbbVie, Inc. | 2.7% |
|---|
Merck & Company, Inc. | 2.5% |
|---|
UnitedHealth Group, Inc. | 2.2% |
|---|
Thermo Fisher Scientific, Inc. | 2.0% |
|---|
Amgen, Inc. | 1.9% |
|---|
Abbott Laboratories | 1.8% |
|---|
Pfizer, Inc. | 1.8% |
|---|
Gilead Sciences, Inc. | 1.8% |
|---|
Total | 24.0% |
|---|
|
| Material Fund Change [Text Block] |
|
| C000010620 |
|
| Shareholder Report [Line Items] |
|
| Fund Name |
Health Care Fund
|
| Class Name |
Class A
|
| Trading Symbol |
RYHEX
|
| Annual or Semi-Annual Statement [Text Block] |
This annual shareholder report contains important information about the Health Care Fund for the period from April 1, 2025 to March 31, 2026.
|
| Shareholder Report Annual or Semi-Annual |
Annual Shareholder Report
|
| Additional Information [Text Block] |
You can find additional information about the fund at GuggenheimInvestments.com/mutual-funds/literature. You can also request this information by contacting 800 820 0888 or services@guggenheiminvestments.com.
|
| Additional Information Phone Number |
800 820 0888
|
| Additional Information Email |
<span style="box-sizing: border-box; color: rgb(67, 67, 67); display: inline; flex-wrap: nowrap; font-size: 10.6667px; font-weight: 400; grid-area: auto; line-height: 12.8px; margin: 0px; overflow: visible; text-align: left; text-align-last: auto; white-space-collapse: preserve-breaks;">services@guggenheiminvestments.com</span>
|
| Additional Information Website |
<span style="box-sizing: border-box; color: rgb(67, 67, 67); display: inline; flex-wrap: nowrap; font-size: 10.6667px; font-weight: 400; grid-area: auto; line-height: 12.8px; margin: 0px; overflow: visible; text-align: left; text-align-last: auto; white-space-collapse: preserve-breaks;">GuggenheimInvestments.com/mutual-funds/literature</span>
|
| Expenses [Text Block] |
What were the Fund's costs for the last year? * Based on a hypothetical $10,000 investment Table SummaryClass | Costs of a $10,000 Investment | Costs Paid as a % of a $10,000 Investment |
|---|
Class A | $169 | 1.64% |
|---|
Table Summary* | Excludes expenses of the underlying funds in which the fund invests, if any. |
|---|
|
| Expenses Paid, Amount |
$ 169
|
| Factors Affecting Performance [Text Block] |
What factors materially affected the Fund's performance over the last year? The industries that contributed the most to performance were biotechnology, pharmaceuticals, and health care distributors. Those that detracted the most were managed health care, health care equipment, and health care supplies. The holdings that contributed the most to performance were Johnson & Johnson, Merck & Company, Inc., and Insmed, Inc. Those that detracted the most were UnitedHealth Group, Inc., Boston Scientific Corp., and Elevance Health, Inc. |
| Line Graph [Table Text Block] |
Table Summary | Health Care Fund (Class A)‡ | S&P 500 Index | S&P 500 Health Care Index |
|---|
3/31/16 | $9,525 | $10,000 | $10,000 |
|---|
3/31/17 | $10,463 | $11,717 | $11,159 |
|---|
3/31/18 | $11,838 | $13,357 | $12,417 |
|---|
3/31/19 | $13,313 | $14,625 | $14,266 |
|---|
3/31/20 | $12,546 | $13,605 | $14,121 |
|---|
3/31/21 | $17,674 | $21,271 | $18,928 |
|---|
3/31/22 | $19,290 | $24,599 | $22,542 |
|---|
3/31/23 | $18,060 | $22,698 | $21,709 |
|---|
3/31/24 | $20,515 | $29,480 | $25,202 |
|---|
3/31/25 | $19,654 | $31,913 | $25,303 |
|---|
3/31/26 | $20,913 | $37,594 | $25,888 |
|---|
|
| Average Annual Return [Table Text Block] |
Table SummaryAverage Annual Total Returns | One Year | Five Years | Ten Years |
|---|
Class A (without sales charge) | 6.40% | 3.42% | 8.18% |
|---|
Class A (with sales charge) ‡ | 1.35% | 2.42% | 7.66% |
|---|
S&P 500 Index | 17.80% | 12.06% | 14.16% |
|---|
S&P 500 Health Care Index | 2.31% | 6.46% | 9.98% |
|---|
|
| AssetsNet |
$ 18,233,272
|
| Holdings Count | Holding |
136
|
| Advisory Fees Paid, Amount |
$ 166,674
|
| InvestmentCompanyPortfolioTurnover |
244.00%
|
| Additional Fund Statistics [Text Block] |
Fund Statistics as of March 31, 2026 - Net Assets$18,233,272
- Total Number of Portfolio Holdings136
- Portfolio Turnover Rate244%
- Total Advisory Fees Paid$166,674
|
| Holdings [Text Block] |
Holdings DiversificationFootnote Reference1 (% of Net Assets) as of March 31, 2026 Table SummaryValue | Value |
|---|
Internet | 0.3% | Electronics | 0.7% | Software | 0.9% | Healthcare-Services | 14.1% | Biotechnology | 23.8% | Healthcare-Products | 26.2% | Pharmaceuticals | 33.6% | |
| Largest Holdings [Text Block] |
10 Largest HoldingsFootnote Reference2 (% of Net Assets) as of March 31, 2026 Table SummaryEli Lilly & Co. | 3.9% |
|---|
Johnson & Johnson | 3.4% |
|---|
AbbVie, Inc. | 2.7% |
|---|
Merck & Company, Inc. | 2.5% |
|---|
UnitedHealth Group, Inc. | 2.2% |
|---|
Thermo Fisher Scientific, Inc. | 2.0% |
|---|
Amgen, Inc. | 1.9% |
|---|
Abbott Laboratories | 1.8% |
|---|
Pfizer, Inc. | 1.8% |
|---|
Gilead Sciences, Inc. | 1.8% |
|---|
Total | 24.0% |
|---|
|
| Material Fund Change [Text Block] |
|
| C000010621 |
|
| Shareholder Report [Line Items] |
|
| Fund Name |
Health Care Fund
|
| Class Name |
Class C
|
| Trading Symbol |
RYHCX
|
| Annual or Semi-Annual Statement [Text Block] |
This annual shareholder report contains important information about the Health Care Fund for the period from April 1, 2025 to March 31, 2026.
|
| Shareholder Report Annual or Semi-Annual |
Annual Shareholder Report
|
| Additional Information [Text Block] |
You can find additional information about the fund at GuggenheimInvestments.com/mutual-funds/literature. You can also request this information by contacting 800 820 0888 or services@guggenheiminvestments.com.
|
| Additional Information Phone Number |
800 820 0888
|
| Additional Information Email |
<span style="box-sizing: border-box; color: rgb(67, 67, 67); display: inline; flex-wrap: nowrap; font-size: 10.6667px; font-weight: 400; grid-area: auto; line-height: 12.8px; margin: 0px; overflow: visible; text-align: left; text-align-last: auto; white-space-collapse: preserve-breaks;">services@guggenheiminvestments.com</span>
|
| Additional Information Website |
<span style="box-sizing: border-box; color: rgb(67, 67, 67); display: inline; flex-wrap: nowrap; font-size: 10.6667px; font-weight: 400; grid-area: auto; line-height: 12.8px; margin: 0px; overflow: visible; text-align: left; text-align-last: auto; white-space-collapse: preserve-breaks;">GuggenheimInvestments.com/mutual-funds/literature</span>
|
| Expenses [Text Block] |
What were the Fund's costs for the last year? * Based on a hypothetical $10,000 investment Table SummaryClass | Costs of a $10,000 Investment | Costs Paid as a % of a $10,000 Investment |
|---|
Class C | $247 | 2.40% |
|---|
Table Summary* | Excludes expenses of the underlying funds in which the fund invests, if any. |
|---|
|
| Expenses Paid, Amount |
$ 247
|
| Factors Affecting Performance [Text Block] |
What factors materially affected the Fund's performance over the last year? The industries that contributed the most to performance were biotechnology, pharmaceuticals, and health care distributors. Those that detracted the most were managed health care, health care equipment, and health care supplies. The holdings that contributed the most to performance were Johnson & Johnson, Merck & Company, Inc., and Insmed, Inc. Those that detracted the most were UnitedHealth Group, Inc., Boston Scientific Corp., and Elevance Health, Inc. |
| Line Graph [Table Text Block] |
Table Summary | Health Care Fund (Class C) | S&P 500 Index | S&P 500 Health Care Index |
|---|
3/31/16 | $10,000 | $10,000 | $10,000 |
|---|
3/31/17 | $10,907 | $11,717 | $11,159 |
|---|
3/31/18 | $12,241 | $13,357 | $12,417 |
|---|
3/31/19 | $13,671 | $14,625 | $14,266 |
|---|
3/31/20 | $12,790 | $13,605 | $14,121 |
|---|
3/31/21 | $17,882 | $21,271 | $18,928 |
|---|
3/31/22 | $19,374 | $24,599 | $22,542 |
|---|
3/31/23 | $18,005 | $22,698 | $21,709 |
|---|
3/31/24 | $20,306 | $29,480 | $25,202 |
|---|
3/31/25 | $19,305 | $31,913 | $25,303 |
|---|
3/31/26 | $20,388 | $37,594 | $25,888 |
|---|
|
| Average Annual Return [Table Text Block] |
Table SummaryAverage Annual Total Returns | One Year | Five Years | Ten Years |
|---|
Class C (without CDSC) | 5.62% | 2.66% | 7.38% |
|---|
Class C (with CDSC) ‡ | 4.62% | 2.66% | 7.38% |
|---|
S&P 500 Index | 17.80% | 12.06% | 14.16% |
|---|
S&P 500 Health Care Index | 2.31% | 6.46% | 9.98% |
|---|
|
| AssetsNet |
$ 18,233,272
|
| Holdings Count | Holding |
136
|
| Advisory Fees Paid, Amount |
$ 166,674
|
| InvestmentCompanyPortfolioTurnover |
244.00%
|
| Additional Fund Statistics [Text Block] |
Fund Statistics as of March 31, 2026 - Net Assets$18,233,272
- Total Number of Portfolio Holdings136
- Portfolio Turnover Rate244%
- Total Advisory Fees Paid$166,674
|
| Holdings [Text Block] |
Holdings DiversificationFootnote Reference1 (% of Net Assets) as of March 31, 2026 Table SummaryValue | Value |
|---|
Internet | 0.3% | Electronics | 0.7% | Software | 0.9% | Healthcare-Services | 14.1% | Biotechnology | 23.8% | Healthcare-Products | 26.2% | Pharmaceuticals | 33.6% | |
| Largest Holdings [Text Block] |
10 Largest HoldingsFootnote Reference2 (% of Net Assets) as of March 31, 2026 Table SummaryEli Lilly & Co. | 3.9% |
|---|
Johnson & Johnson | 3.4% |
|---|
AbbVie, Inc. | 2.7% |
|---|
Merck & Company, Inc. | 2.5% |
|---|
UnitedHealth Group, Inc. | 2.2% |
|---|
Thermo Fisher Scientific, Inc. | 2.0% |
|---|
Amgen, Inc. | 1.9% |
|---|
Abbott Laboratories | 1.8% |
|---|
Pfizer, Inc. | 1.8% |
|---|
Gilead Sciences, Inc. | 1.8% |
|---|
Total | 24.0% |
|---|
|
| Material Fund Change [Text Block] |
|
| C000010619 |
|
| Shareholder Report [Line Items] |
|
| Fund Name |
Health Care Fund
|
| Class Name |
Class H
|
| Trading Symbol |
RYHAX
|
| Annual or Semi-Annual Statement [Text Block] |
This annual shareholder report contains important information about the Health Care Fund for the period from April 1, 2025 to March 31, 2026.
|
| Shareholder Report Annual or Semi-Annual |
Annual Shareholder Report
|
| Additional Information [Text Block] |
You can find additional information about the fund at GuggenheimInvestments.com/mutual-funds/literature. You can also request this information by contacting 800 820 0888 or services@guggenheiminvestments.com.
|
| Additional Information Phone Number |
800 820 0888
|
| Additional Information Email |
<span style="box-sizing: border-box; color: rgb(67, 67, 67); display: inline; flex-wrap: nowrap; font-size: 10.6667px; font-weight: 400; grid-area: auto; line-height: 12.8px; margin: 0px; overflow: visible; text-align: left; text-align-last: auto; white-space-collapse: preserve-breaks;">services@guggenheiminvestments.com</span>
|
| Additional Information Website |
<span style="box-sizing: border-box; color: rgb(67, 67, 67); display: inline; flex-wrap: nowrap; font-size: 10.6667px; font-weight: 400; grid-area: auto; line-height: 12.8px; margin: 0px; overflow: visible; text-align: left; text-align-last: auto; white-space-collapse: preserve-breaks;">GuggenheimInvestments.com/mutual-funds/literature</span>
|
| Expenses [Text Block] |
What were the Fund's costs for the last year? * Based on a hypothetical $10,000 investment Table SummaryClass | Costs of a $10,000 Investment | Costs Paid as a % of a $10,000 Investment |
|---|
Class H | $169 | 1.64% |
|---|
Table Summary* | Excludes expenses of the underlying funds in which the fund invests, if any. |
|---|
|
| Expenses Paid, Amount |
$ 169
|
| Factors Affecting Performance [Text Block] |
What factors materially affected the Fund's performance over the last year? The industries that contributed the most to performance were biotechnology, pharmaceuticals, and health care distributors. Those that detracted the most were managed health care, health care equipment, and health care supplies. The holdings that contributed the most to performance were Johnson & Johnson, Merck & Company, Inc., and Insmed, Inc. Those that detracted the most were UnitedHealth Group, Inc., Boston Scientific Corp., and Elevance Health, Inc. |
| Line Graph [Table Text Block] |
Table Summary | Health Care Fund (Class H) | S&P 500 Index | S&P 500 Health Care Index |
|---|
3/31/16 | $10,000 | $10,000 | $10,000 |
|---|
3/31/17 | $10,987 | $11,717 | $11,159 |
|---|
3/31/18 | $12,422 | $13,357 | $12,417 |
|---|
3/31/19 | $13,970 | $14,625 | $14,266 |
|---|
3/31/20 | $13,169 | $13,605 | $14,121 |
|---|
3/31/21 | $18,560 | $21,271 | $18,928 |
|---|
3/31/22 | $20,257 | $24,599 | $22,542 |
|---|
3/31/23 | $18,965 | $22,698 | $21,709 |
|---|
3/31/24 | $21,548 | $29,480 | $25,202 |
|---|
3/31/25 | $20,642 | $31,913 | $25,303 |
|---|
3/31/26 | $21,965 | $37,594 | $25,888 |
|---|
|
| Average Annual Return [Table Text Block] |
Table SummaryAverage Annual Total Returns | One Year | Five Years | Ten Years |
|---|
Class H | 6.41% | 3.43% | 8.19% |
|---|
S&P 500 Index | 17.80% | 12.06% | 14.16% |
|---|
S&P 500 Health Care Index | 2.31% | 6.46% | 9.98% |
|---|
|
| AssetsNet |
$ 18,233,272
|
| Holdings Count | Holding |
136
|
| Advisory Fees Paid, Amount |
$ 166,674
|
| InvestmentCompanyPortfolioTurnover |
244.00%
|
| Additional Fund Statistics [Text Block] |
Fund Statistics as of March 31, 2026 - Net Assets$18,233,272
- Total Number of Portfolio Holdings136
- Portfolio Turnover Rate244%
- Total Advisory Fees Paid$166,674
|
| Holdings [Text Block] |
Holdings DiversificationFootnote Reference1 (% of Net Assets) as of March 31, 2026 Table SummaryValue | Value |
|---|
Internet | 0.3% | Electronics | 0.7% | Software | 0.9% | Healthcare-Services | 14.1% | Biotechnology | 23.8% | Healthcare-Products | 26.2% | Pharmaceuticals | 33.6% | |
| Largest Holdings [Text Block] |
10 Largest HoldingsFootnote Reference2 (% of Net Assets) as of March 31, 2026 Table SummaryEli Lilly & Co. | 3.9% |
|---|
Johnson & Johnson | 3.4% |
|---|
AbbVie, Inc. | 2.7% |
|---|
Merck & Company, Inc. | 2.5% |
|---|
UnitedHealth Group, Inc. | 2.2% |
|---|
Thermo Fisher Scientific, Inc. | 2.0% |
|---|
Amgen, Inc. | 1.9% |
|---|
Abbott Laboratories | 1.8% |
|---|
Pfizer, Inc. | 1.8% |
|---|
Gilead Sciences, Inc. | 1.8% |
|---|
Total | 24.0% |
|---|
|
| Material Fund Change [Text Block] |
|
| C000010602 |
|
| Shareholder Report [Line Items] |
|
| Fund Name |
Internet Fund
|
| Class Name |
Investor Class
|
| Trading Symbol |
RYIIX
|
| Annual or Semi-Annual Statement [Text Block] |
This annual shareholder report contains important information about the Internet Fund for the period from April 1, 2025 to March 31, 2026.
|
| Shareholder Report Annual or Semi-Annual |
Annual Shareholder Report
|
| Additional Information [Text Block] |
You can find additional information about the fund at GuggenheimInvestments.com/mutual-funds/literature. You can also request this information by contacting 800 820 0888 or services@guggenheiminvestments.com.
|
| Additional Information Phone Number |
800 820 0888
|
| Additional Information Email |
<span style="box-sizing: border-box; color: rgb(67, 67, 67); display: inline; flex-wrap: nowrap; font-size: 10.6667px; font-weight: 400; grid-area: auto; line-height: 12.8px; margin: 0px; overflow: visible; text-align: left; text-align-last: auto; white-space-collapse: preserve-breaks;">services@guggenheiminvestments.com</span>
|
| Additional Information Website |
<span style="box-sizing: border-box; color: rgb(67, 67, 67); display: inline; flex-wrap: nowrap; font-size: 10.6667px; font-weight: 400; grid-area: auto; line-height: 12.8px; margin: 0px; overflow: visible; text-align: left; text-align-last: auto; white-space-collapse: preserve-breaks;">GuggenheimInvestments.com/mutual-funds/literature</span>
|
| Expenses [Text Block] |
What were the Fund's costs for the last year? * Based on a hypothetical $10,000 investment Table SummaryClass | Costs of a $10,000 Investment | Costs Paid as a % of a $10,000 Investment |
|---|
Investor Class | $145 | 1.37% |
|---|
Table Summary* | Excludes expenses of the underlying funds in which the fund invests, if any. |
|---|
|
| Expenses Paid, Amount |
$ 145
|
| Factors Affecting Performance [Text Block] |
What factors materially affected the Fund's performance over the last year? The industries that contributed the most to performance were communications equipment, interactive media & services, and internet services & infrastructure. Those that detracted the most were application software, real estate services and transaction & payment processing services. The holdings that contributed the most to performance were Alphabet, Inc.—Class A, Lumentum Holdings, Inc., and Ciena Corp. Those that detracted the most were Adobe, Inc., Salesforce, Inc., and Workday, Inc.—Class A. |
| Line Graph [Table Text Block] |
Table Summary | Internet Fund (Investor Class) | S&P 500 Index | S&P 500 Information Technology Index |
|---|
3/31/16 | $10,000 | $10,000 | $10,000 |
|---|
3/31/17 | $12,236 | $11,717 | $12,491 |
|---|
3/31/18 | $16,018 | $13,357 | $15,948 |
|---|
3/31/19 | $17,523 | $14,625 | $18,411 |
|---|
3/31/20 | $16,078 | $13,605 | $20,331 |
|---|
3/31/21 | $29,885 | $21,271 | $33,874 |
|---|
3/31/22 | $22,867 | $24,599 | $40,953 |
|---|
3/31/23 | $18,753 | $22,698 | $39,090 |
|---|
3/31/24 | $24,460 | $29,480 | $57,075 |
|---|
3/31/25 | $27,057 | $31,913 | $60,436 |
|---|
3/31/26 | $30,191 | $37,594 | $77,992 |
|---|
|
| Average Annual Return [Table Text Block] |
Table SummaryAverage Annual Total Returns | One Year | Five Years | Ten Years |
|---|
Investor Class | 11.60% | 0.20% | 11.68% |
|---|
S&P 500 Index | 17.80% | 12.06% | 14.16% |
|---|
S&P 500 Information Technology Index | 28.83% | 18.13% | 22.80% |
|---|
|
| AssetsNet |
$ 12,790,914
|
| Holdings Count | Holding |
85
|
| Advisory Fees Paid, Amount |
$ 170,719
|
| InvestmentCompanyPortfolioTurnover |
151.00%
|
| Additional Fund Statistics [Text Block] |
Fund Statistics as of March 31, 2026 - Net Assets$12,790,914
- Total Number of Portfolio Holdings85
- Portfolio Turnover Rate151%
- Total Advisory Fees Paid$170,719
|
| Holdings [Text Block] |
Holdings DiversificationFootnote Reference1 (% of Net Assets) as of March 31, 2026 Table SummaryValue | Value |
|---|
Other | 1.1% | Entertainment | 0.6% | Real Estate | 0.9% | Commercial Services | 1.8% | Computers | 2.8% | Telecommunications | 12.7% | Software | 24.2% | Internet | 55.8% | |
| Largest Holdings [Text Block] |
10 Largest HoldingsFootnote Reference2 (% of Net Assets) as of March 31, 2026 Table SummaryAlphabet, Inc. — Class A | 7.9% |
|---|
Amazon.com, Inc. | 6.2% |
|---|
Meta Platforms, Inc. — Class A | 5.0% |
|---|
Netflix, Inc. | 4.3% |
|---|
Cisco Systems, Inc. | 3.5% |
|---|
Salesforce, Inc. | 2.6% |
|---|
Uber Technologies, Inc. | 2.6% |
|---|
Booking Holdings, Inc. | 2.4% |
|---|
Arista Networks, Inc. | 2.3% |
|---|
Adobe, Inc. | 2.0% |
|---|
Total | 38.8% |
|---|
|
| Material Fund Change [Text Block] |
|
| C000010604 |
|
| Shareholder Report [Line Items] |
|
| Fund Name |
Internet Fund
|
| Class Name |
Class A
|
| Trading Symbol |
RYINX
|
| Annual or Semi-Annual Statement [Text Block] |
This annual shareholder report contains important information about the Internet Fund for the period from April 1, 2025 to March 31, 2026.
|
| Shareholder Report Annual or Semi-Annual |
Annual Shareholder Report
|
| Additional Information [Text Block] |
You can find additional information about the fund at GuggenheimInvestments.com/mutual-funds/literature. You can also request this information by contacting 800 820 0888 or services@guggenheiminvestments.com.
|
| Additional Information Phone Number |
800 820 0888
|
| Additional Information Email |
<span style="box-sizing: border-box; color: rgb(67, 67, 67); display: inline; flex-wrap: nowrap; font-size: 10.6667px; font-weight: 400; grid-area: auto; line-height: 12.8px; margin: 0px; overflow: visible; text-align: left; text-align-last: auto; white-space-collapse: preserve-breaks;">services@guggenheiminvestments.com</span>
|
| Additional Information Website |
<span style="box-sizing: border-box; color: rgb(67, 67, 67); display: inline; flex-wrap: nowrap; font-size: 10.6667px; font-weight: 400; grid-area: auto; line-height: 12.8px; margin: 0px; overflow: visible; text-align: left; text-align-last: auto; white-space-collapse: preserve-breaks;">GuggenheimInvestments.com/mutual-funds/literature</span>
|
| Expenses [Text Block] |
What were the Fund's costs for the last year? * Based on a hypothetical $10,000 investment Table SummaryClass | Costs of a $10,000 Investment | Costs Paid as a % of a $10,000 Investment |
|---|
Class A | $172 | 1.63% |
|---|
Table Summary* | Excludes expenses of the underlying funds in which the fund invests, if any. |
|---|
|
| Expenses Paid, Amount |
$ 172
|
| Factors Affecting Performance [Text Block] |
What factors materially affected the Fund's performance over the last year? The industries that contributed the most to performance were communications equipment, interactive media & services, and internet services & infrastructure. Those that detracted the most were application software, real estate services and transaction & payment processing services. The holdings that contributed the most to performance were Alphabet, Inc.—Class A, Lumentum Holdings, Inc., and Ciena Corp. Those that detracted the most were Adobe, Inc., Salesforce, Inc., and Workday, Inc.—Class A. |
| Line Graph [Table Text Block] |
Table Summary | Internet Fund (Class A)‡ | S&P 500 Index | S&P 500 Information Technology Index |
|---|
3/31/16 | $9,525 | $10,000 | $10,000 |
|---|
3/31/17 | $11,624 | $11,717 | $12,491 |
|---|
3/31/18 | $15,178 | $13,357 | $15,948 |
|---|
3/31/19 | $16,564 | $14,625 | $18,411 |
|---|
3/31/20 | $15,160 | $13,605 | $20,331 |
|---|
3/31/21 | $28,108 | $21,271 | $33,874 |
|---|
3/31/22 | $21,455 | $24,599 | $40,953 |
|---|
3/31/23 | $17,551 | $22,698 | $39,090 |
|---|
3/31/24 | $22,834 | $29,480 | $57,075 |
|---|
3/31/25 | $25,196 | $31,913 | $60,436 |
|---|
3/31/26 | $28,041 | $37,594 | $77,992 |
|---|
|
| Average Annual Return [Table Text Block] |
Table SummaryAverage Annual Total Returns | One Year | Five Years | Ten Years |
|---|
Class A (without sales charge) | 11.29% | -0.05% | 11.40% |
|---|
Class A (with sales charge) ‡ | 6.01% | -1.02% | 10.86% |
|---|
S&P 500 Index | 17.80% | 12.06% | 14.16% |
|---|
S&P 500 Information Technology Index | 28.83% | 18.13% | 22.80% |
|---|
|
| AssetsNet |
$ 12,790,914
|
| Holdings Count | Holding |
85
|
| Advisory Fees Paid, Amount |
$ 170,719
|
| InvestmentCompanyPortfolioTurnover |
151.00%
|
| Additional Fund Statistics [Text Block] |
Fund Statistics as of March 31, 2026 - Net Assets$12,790,914
- Total Number of Portfolio Holdings85
- Portfolio Turnover Rate151%
- Total Advisory Fees Paid$170,719
|
| Holdings [Text Block] |
Holdings DiversificationFootnote Reference1 (% of Net Assets) as of March 31, 2026 Table SummaryValue | Value |
|---|
Other | 1.1% | Entertainment | 0.6% | Real Estate | 0.9% | Commercial Services | 1.8% | Computers | 2.8% | Telecommunications | 12.7% | Software | 24.2% | Internet | 55.8% | |
| Largest Holdings [Text Block] |
10 Largest HoldingsFootnote Reference2 (% of Net Assets) as of March 31, 2026 Table SummaryAlphabet, Inc. — Class A | 7.9% |
|---|
Amazon.com, Inc. | 6.2% |
|---|
Meta Platforms, Inc. — Class A | 5.0% |
|---|
Netflix, Inc. | 4.3% |
|---|
Cisco Systems, Inc. | 3.5% |
|---|
Salesforce, Inc. | 2.6% |
|---|
Uber Technologies, Inc. | 2.6% |
|---|
Booking Holdings, Inc. | 2.4% |
|---|
Arista Networks, Inc. | 2.3% |
|---|
Adobe, Inc. | 2.0% |
|---|
Total | 38.8% |
|---|
|
| Material Fund Change [Text Block] |
|
| C000010605 |
|
| Shareholder Report [Line Items] |
|
| Fund Name |
Internet Fund
|
| Class Name |
Class C
|
| Trading Symbol |
RYICX
|
| Annual or Semi-Annual Statement [Text Block] |
This annual shareholder report contains important information about the Internet Fund for the period from April 1, 2025 to March 31, 2026.
|
| Shareholder Report Annual or Semi-Annual |
Annual Shareholder Report
|
| Additional Information [Text Block] |
You can find additional information about the fund at GuggenheimInvestments.com/mutual-funds/literature. You can also request this information by contacting 800 820 0888 or services@guggenheiminvestments.com.
|
| Additional Information Phone Number |
800 820 0888
|
| Additional Information Email |
<span style="box-sizing: border-box; color: rgb(67, 67, 67); display: inline; flex-wrap: nowrap; font-size: 10.6667px; font-weight: 400; grid-area: auto; line-height: 12.8px; margin: 0px; overflow: visible; text-align: left; text-align-last: auto; white-space-collapse: preserve-breaks;">services@guggenheiminvestments.com</span>
|
| Additional Information Website |
<span style="box-sizing: border-box; color: rgb(67, 67, 67); display: inline; flex-wrap: nowrap; font-size: 10.6667px; font-weight: 400; grid-area: auto; line-height: 12.8px; margin: 0px; overflow: visible; text-align: left; text-align-last: auto; white-space-collapse: preserve-breaks;">GuggenheimInvestments.com/mutual-funds/literature</span>
|
| Expenses [Text Block] |
What were the Fund's costs for the last year? * Based on a hypothetical $10,000 investment Table SummaryClass | Costs of a $10,000 Investment | Costs Paid as a % of a $10,000 Investment |
|---|
Class C | $250 | 2.38% |
|---|
Table Summary* | Excludes expenses of the underlying funds in which the fund invests, if any. |
|---|
|
| Expenses Paid, Amount |
$ 250
|
| Factors Affecting Performance [Text Block] |
What factors materially affected the Fund's performance over the last year? The industries that contributed the most to performance were communications equipment, interactive media & services, and internet services & infrastructure. Those that detracted the most were application software, real estate services and transaction & payment processing services. The holdings that contributed the most to performance were Alphabet, Inc.—Class A, Lumentum Holdings, Inc., and Ciena Corp. Those that detracted the most were Adobe, Inc., Salesforce, Inc., and Workday, Inc.—Class A. |
| Line Graph [Table Text Block] |
Table Summary | Internet Fund (Class C) | S&P 500 Index | S&P 500 Information Technology Index |
|---|
3/31/16 | $10,000 | $10,000 | $10,000 |
|---|
3/31/17 | $12,113 | $11,717 | $12,491 |
|---|
3/31/18 | $15,702 | $13,357 | $15,948 |
|---|
3/31/19 | $17,006 | $14,625 | $18,411 |
|---|
3/31/20 | $15,448 | $13,605 | $20,331 |
|---|
3/31/21 | $28,429 | $21,271 | $33,874 |
|---|
3/31/22 | $21,538 | $24,599 | $40,953 |
|---|
3/31/23 | $17,484 | $22,698 | $39,090 |
|---|
3/31/24 | $22,580 | $29,480 | $57,075 |
|---|
3/31/25 | $24,731 | $31,913 | $60,436 |
|---|
3/31/26 | $27,319 | $37,594 | $77,992 |
|---|
|
| Average Annual Return [Table Text Block] |
Table SummaryAverage Annual Total Returns | One Year | Five Years | Ten Years |
|---|
Class C (without CDSC) | 10.46% | -0.79% | 10.57% |
|---|
Class C (with CDSC) ‡ | 9.46% | -0.79% | 10.57% |
|---|
S&P 500 Index | 17.80% | 12.06% | 14.16% |
|---|
S&P 500 Information Technology Index | 28.83% | 18.13% | 22.80% |
|---|
|
| AssetsNet |
$ 12,790,914
|
| Holdings Count | Holding |
85
|
| Advisory Fees Paid, Amount |
$ 170,719
|
| InvestmentCompanyPortfolioTurnover |
151.00%
|
| Additional Fund Statistics [Text Block] |
Fund Statistics as of March 31, 2026 - Net Assets$12,790,914
- Total Number of Portfolio Holdings85
- Portfolio Turnover Rate151%
- Total Advisory Fees Paid$170,719
|
| Holdings [Text Block] |
Holdings DiversificationFootnote Reference1 (% of Net Assets) as of March 31, 2026 Table SummaryValue | Value |
|---|
Other | 1.1% | Entertainment | 0.6% | Real Estate | 0.9% | Commercial Services | 1.8% | Computers | 2.8% | Telecommunications | 12.7% | Software | 24.2% | Internet | 55.8% | |
| Largest Holdings [Text Block] |
10 Largest HoldingsFootnote Reference2 (% of Net Assets) as of March 31, 2026 Table SummaryAlphabet, Inc. — Class A | 7.9% |
|---|
Amazon.com, Inc. | 6.2% |
|---|
Meta Platforms, Inc. — Class A | 5.0% |
|---|
Netflix, Inc. | 4.3% |
|---|
Cisco Systems, Inc. | 3.5% |
|---|
Salesforce, Inc. | 2.6% |
|---|
Uber Technologies, Inc. | 2.6% |
|---|
Booking Holdings, Inc. | 2.4% |
|---|
Arista Networks, Inc. | 2.3% |
|---|
Adobe, Inc. | 2.0% |
|---|
Total | 38.8% |
|---|
|
| Material Fund Change [Text Block] |
|
| C000010603 |
|
| Shareholder Report [Line Items] |
|
| Fund Name |
Internet Fund
|
| Class Name |
Class H
|
| Trading Symbol |
RYIAX
|
| Annual or Semi-Annual Statement [Text Block] |
This annual shareholder report contains important information about the Internet Fund for the period from April 1, 2025 to March 31, 2026.
|
| Shareholder Report Annual or Semi-Annual |
Annual Shareholder Report
|
| Additional Information [Text Block] |
You can find additional information about the fund at GuggenheimInvestments.com/mutual-funds/literature. You can also request this information by contacting 800 820 0888 or services@guggenheiminvestments.com.
|
| Additional Information Phone Number |
800 820 0888
|
| Additional Information Email |
<span style="box-sizing: border-box; color: rgb(67, 67, 67); display: inline; flex-wrap: nowrap; font-size: 10.6667px; font-weight: 400; grid-area: auto; line-height: 12.8px; margin: 0px; overflow: visible; text-align: left; text-align-last: auto; white-space-collapse: preserve-breaks;">services@guggenheiminvestments.com</span>
|
| Additional Information Website |
<span style="box-sizing: border-box; color: rgb(67, 67, 67); display: inline; flex-wrap: nowrap; font-size: 10.6667px; font-weight: 400; grid-area: auto; line-height: 12.8px; margin: 0px; overflow: visible; text-align: left; text-align-last: auto; white-space-collapse: preserve-breaks;">GuggenheimInvestments.com/mutual-funds/literature</span>
|
| Expenses [Text Block] |
What were the Fund's costs for the last year? * Based on a hypothetical $10,000 investment Table SummaryClass | Costs of a $10,000 Investment | Costs Paid as a % of a $10,000 Investment |
|---|
Class H | $172 | 1.63% |
|---|
Table Summary* | Excludes expenses of the underlying funds in which the fund invests, if any. |
|---|
|
| Expenses Paid, Amount |
$ 172
|
| Factors Affecting Performance [Text Block] |
What factors materially affected the Fund's performance over the last year? The industries that contributed the most to performance were communications equipment, interactive media & services, and internet services & infrastructure. Those that detracted the most were application software, real estate services and transaction & payment processing services. The holdings that contributed the most to performance were Alphabet, Inc.—Class A, Lumentum Holdings, Inc., and Ciena Corp. Those that detracted the most were Adobe, Inc., Salesforce, Inc., and Workday, Inc.—Class A. |
| Line Graph [Table Text Block] |
Table Summary | Internet Fund (Class H) | S&P 500 Index | S&P 500 Information Technology Index |
|---|
3/31/16 | $10,000 | $10,000 | $10,000 |
|---|
3/31/17 | $12,209 | $11,717 | $12,491 |
|---|
3/31/18 | $15,944 | $13,357 | $15,948 |
|---|
3/31/19 | $17,398 | $14,625 | $18,411 |
|---|
3/31/20 | $15,921 | $13,605 | $20,331 |
|---|
3/31/21 | $29,518 | $21,271 | $33,874 |
|---|
3/31/22 | $22,533 | $24,599 | $40,953 |
|---|
3/31/23 | $18,429 | $22,698 | $39,090 |
|---|
3/31/24 | $23,978 | $29,480 | $57,075 |
|---|
3/31/25 | $26,458 | $31,913 | $60,436 |
|---|
3/31/26 | $29,446 | $37,594 | $77,992 |
|---|
|
| Average Annual Return [Table Text Block] |
Table SummaryAverage Annual Total Returns | One Year | Five Years | Ten Years |
|---|
Class H | 11.30% | -0.05% | 11.40% |
|---|
S&P 500 Index | 17.80% | 12.06% | 14.16% |
|---|
S&P 500 Information Technology Index | 28.83% | 18.13% | 22.80% |
|---|
|
| AssetsNet |
$ 12,790,914
|
| Holdings Count | Holding |
85
|
| Advisory Fees Paid, Amount |
$ 170,719
|
| InvestmentCompanyPortfolioTurnover |
151.00%
|
| Additional Fund Statistics [Text Block] |
Fund Statistics as of March 31, 2026 - Net Assets$12,790,914
- Total Number of Portfolio Holdings85
- Portfolio Turnover Rate151%
- Total Advisory Fees Paid$170,719
|
| Holdings [Text Block] |
Holdings DiversificationFootnote Reference1 (% of Net Assets) as of March 31, 2026 Table SummaryValue | Value |
|---|
Other | 1.1% | Entertainment | 0.6% | Real Estate | 0.9% | Commercial Services | 1.8% | Computers | 2.8% | Telecommunications | 12.7% | Software | 24.2% | Internet | 55.8% | |
| Largest Holdings [Text Block] |
10 Largest HoldingsFootnote Reference2 (% of Net Assets) as of March 31, 2026 Table SummaryAlphabet, Inc. — Class A | 7.9% |
|---|
Amazon.com, Inc. | 6.2% |
|---|
Meta Platforms, Inc. — Class A | 5.0% |
|---|
Netflix, Inc. | 4.3% |
|---|
Cisco Systems, Inc. | 3.5% |
|---|
Salesforce, Inc. | 2.6% |
|---|
Uber Technologies, Inc. | 2.6% |
|---|
Booking Holdings, Inc. | 2.4% |
|---|
Arista Networks, Inc. | 2.3% |
|---|
Adobe, Inc. | 2.0% |
|---|
Total | 38.8% |
|---|
|
| Material Fund Change [Text Block] |
|
| C000010634 |
|
| Shareholder Report [Line Items] |
|
| Fund Name |
Leisure Fund
|
| Class Name |
Investor Class
|
| Trading Symbol |
RYLIX
|
| Annual or Semi-Annual Statement [Text Block] |
This annual shareholder report contains important information about the Leisure Fund for the period from April 1, 2025 to March 31, 2026.
|
| Shareholder Report Annual or Semi-Annual |
Annual Shareholder Report
|
| Additional Information [Text Block] |
You can find additional information about the fund at GuggenheimInvestments.com/mutual-funds/literature. You can also request this information by contacting 800 820 0888 or services@guggenheiminvestments.com.
|
| Additional Information Phone Number |
800 820 0888
|
| Additional Information Email |
<span style="box-sizing: border-box; color: rgb(67, 67, 67); display: inline; flex-wrap: nowrap; font-size: 10.6667px; font-weight: 400; grid-area: auto; line-height: 12.8px; margin: 0px; overflow: visible; text-align: left; text-align-last: auto; white-space-collapse: preserve-breaks;">services@guggenheiminvestments.com</span>
|
| Additional Information Website |
<span style="box-sizing: border-box; color: rgb(67, 67, 67); display: inline; flex-wrap: nowrap; font-size: 10.6667px; font-weight: 400; grid-area: auto; line-height: 12.8px; margin: 0px; overflow: visible; text-align: left; text-align-last: auto; white-space-collapse: preserve-breaks;">GuggenheimInvestments.com/mutual-funds/literature</span>
|
| Expenses [Text Block] |
What were the Fund's costs for the last year? * Based on a hypothetical $10,000 investment Table SummaryClass | Costs of a $10,000 Investment | Costs Paid as a % of a $10,000 Investment |
|---|
Investor Class | $140 | 1.38% |
|---|
Table Summary* | Excludes expenses of the underlying funds in which the fund invests, if any. |
|---|
|
| Expenses Paid, Amount |
$ 140
|
| Factors Affecting Performance [Text Block] |
What factors materially affected the Fund's performance over the last year? The industries that contributed the most to performance were movies & entertainment, hotels resorts & cruise lines, and tobacco. Those that detracted the most were restaurants, casinos & gambling, and leisure facilities. The holdings that contributed the most to performance were EchoStar Corp—Class A, Warner Bros Discovery, Inc.— Series A, and Marriott International, Inc.—Class A. Those that detracted the most were Chipotle Mexican Grill, Inc., Flutter Entertainment Plc, and MakeMyTrip, Ltd. |
| Line Graph [Table Text Block] |
Table Summary | Leisure Fund (Investor Class) | S&P 500 Index | S&P 500 Consumer Discretionary Index |
|---|
3/31/16 | $10,000 | $10,000 | $10,000 |
|---|
3/31/17 | $11,620 | $11,717 | $11,317 |
|---|
3/31/18 | $12,400 | $13,357 | $13,231 |
|---|
3/31/19 | $12,904 | $14,625 | $14,975 |
|---|
3/31/20 | $9,942 | $13,605 | $13,362 |
|---|
3/31/21 | $18,930 | $21,271 | $22,754 |
|---|
3/31/22 | $15,993 | $24,599 | $24,981 |
|---|
3/31/23 | $14,528 | $22,698 | $20,081 |
|---|
3/31/24 | $16,646 | $29,480 | $25,850 |
|---|
3/31/25 | $18,170 | $31,913 | $27,623 |
|---|
3/31/26 | $18,632 | $37,594 | $30,861 |
|---|
|
| Average Annual Return [Table Text Block] |
Table SummaryAverage Annual Total Returns | One Year | Five Years | Ten Years |
|---|
Investor Class | 2.55% | -0.32% | 6.42% |
|---|
S&P 500 Index | 17.80% | 12.06% | 14.16% |
|---|
S&P 500 Consumer Discretionary Index | 11.72% | 6.28% | 11.93% |
|---|
|
| AssetsNet |
$ 4,939,500
|
| Holdings Count | Holding |
96
|
| Advisory Fees Paid, Amount |
$ 71,346
|
| InvestmentCompanyPortfolioTurnover |
173.00%
|
| Additional Fund Statistics [Text Block] |
Fund Statistics as of March 31, 2026 - Net Assets$4,939,500
- Total Number of Portfolio Holdings96
- Portfolio Turnover Rate173%
- Total Advisory Fees Paid$71,346
|
| Holdings [Text Block] |
Holdings DiversificationFootnote Reference1 (% of Net Assets) as of March 31, 2026 Table SummaryValue | Value |
|---|
Other | 15.1% | Agriculture | 7.3% | Leisure Time | 8.2% | Lodging | 9.0% | Entertainment | 9.2% | Media | 14.3% | Internet | 17.3% | Retail | 19.3% | |
| Largest Holdings [Text Block] |
10 Largest HoldingsFootnote Reference2 (% of Net Assets) as of March 31, 2026 Table SummaryNetflix, Inc. | 5.0% |
|---|
Philip Morris International, Inc. | 3.8% |
|---|
McDonald's Corp. | 3.6% |
|---|
Walt Disney Co. | 3.2% |
|---|
Booking Holdings, Inc. | 2.8% |
|---|
Altria Group, Inc. | 2.5% |
|---|
Comcast Corp. — Class A | 2.4% |
|---|
Starbucks Corp. | 2.4% |
|---|
Royal Caribbean Cruises Ltd. | 2.1% |
|---|
Marriott International, Inc. — Class A | 2.1% |
|---|
Total | 29.9% |
|---|
|
| Material Fund Change [Text Block] |
|
| C000010636 |
|
| Shareholder Report [Line Items] |
|
| Fund Name |
Leisure Fund
|
| Class Name |
Class A
|
| Trading Symbol |
RYLSX
|
| Annual or Semi-Annual Statement [Text Block] |
This annual shareholder report contains important information about the Leisure Fund for the period from April 1, 2025 to March 31, 2026.
|
| Shareholder Report Annual or Semi-Annual |
Annual Shareholder Report
|
| Additional Information [Text Block] |
You can find additional information about the fund at GuggenheimInvestments.com/mutual-funds/literature. You can also request this information by contacting 800 820 0888 or services@guggenheiminvestments.com.
|
| Additional Information Phone Number |
800 820 0888
|
| Additional Information Email |
<span style="box-sizing: border-box; color: rgb(67, 67, 67); display: inline; flex-wrap: nowrap; font-size: 10.6667px; font-weight: 400; grid-area: auto; line-height: 12.8px; margin: 0px; overflow: visible; text-align: left; text-align-last: auto; white-space-collapse: preserve-breaks;">services@guggenheiminvestments.com</span>
|
| Additional Information Website |
<span style="box-sizing: border-box; color: rgb(67, 67, 67); display: inline; flex-wrap: nowrap; font-size: 10.6667px; font-weight: 400; grid-area: auto; line-height: 12.8px; margin: 0px; overflow: visible; text-align: left; text-align-last: auto; white-space-collapse: preserve-breaks;">GuggenheimInvestments.com/mutual-funds/literature</span>
|
| Expenses [Text Block] |
What were the Fund's costs for the last year? * Based on a hypothetical $10,000 investment Table SummaryClass | Costs of a $10,000 Investment | Costs Paid as a % of a $10,000 Investment |
|---|
Class A | $166 | 1.64% |
|---|
Table Summary* | Excludes expenses of the underlying funds in which the fund invests, if any. |
|---|
|
| Expenses Paid, Amount |
$ 166
|
| Factors Affecting Performance [Text Block] |
What factors materially affected the Fund's performance over the last year? The industries that contributed the most to performance were movies & entertainment, hotels resorts & cruise lines, and tobacco. Those that detracted the most were restaurants, casinos & gambling, and leisure facilities. The holdings that contributed the most to performance were EchoStar Corp—Class A, Warner Bros Discovery, Inc.— Series A, and Marriott International, Inc.—Class A. Those that detracted the most were Chipotle Mexican Grill, Inc., Flutter Entertainment Plc, and MakeMyTrip, Ltd. |
| Line Graph [Table Text Block] |
Table Summary | Leisure Fund (Class A)‡ | S&P 500 Index | S&P 500 Consumer Discretionary Index |
|---|
3/31/16 | $9,525 | $10,000 | $10,000 |
|---|
3/31/17 | $11,040 | $11,717 | $11,317 |
|---|
3/31/18 | $11,753 | $13,357 | $13,231 |
|---|
3/31/19 | $12,198 | $14,625 | $14,975 |
|---|
3/31/20 | $9,374 | $13,605 | $13,362 |
|---|
3/31/21 | $17,807 | $21,271 | $22,754 |
|---|
3/31/22 | $15,007 | $24,599 | $24,981 |
|---|
3/31/23 | $13,597 | $22,698 | $20,081 |
|---|
3/31/24 | $15,539 | $29,480 | $25,850 |
|---|
3/31/25 | $16,921 | $31,913 | $27,623 |
|---|
3/31/26 | $17,306 | $37,594 | $30,861 |
|---|
|
| Average Annual Return [Table Text Block] |
Table SummaryAverage Annual Total Returns | One Year | Five Years | Ten Years |
|---|
Class A (without sales charge) | 2.28% | -0.57% | 6.15% |
|---|
Class A (with sales charge) ‡ | -2.59% | -1.53% | 5.64% |
|---|
S&P 500 Index | 17.80% | 12.06% | 14.16% |
|---|
S&P 500 Consumer Discretionary Index | 11.72% | 6.28% | 11.93% |
|---|
|
| AssetsNet |
$ 4,939,500
|
| Holdings Count | Holding |
96
|
| Advisory Fees Paid, Amount |
$ 71,346
|
| InvestmentCompanyPortfolioTurnover |
173.00%
|
| Additional Fund Statistics [Text Block] |
Fund Statistics as of March 31, 2026 - Net Assets$4,939,500
- Total Number of Portfolio Holdings96
- Portfolio Turnover Rate173%
- Total Advisory Fees Paid$71,346
|
| Holdings [Text Block] |
Holdings DiversificationFootnote Reference1 (% of Net Assets) as of March 31, 2026 Table SummaryValue | Value |
|---|
Other | 15.1% | Agriculture | 7.3% | Leisure Time | 8.2% | Lodging | 9.0% | Entertainment | 9.2% | Media | 14.3% | Internet | 17.3% | Retail | 19.3% | |
| Largest Holdings [Text Block] |
10 Largest HoldingsFootnote Reference2 (% of Net Assets) as of March 31, 2026 Table SummaryNetflix, Inc. | 5.0% |
|---|
Philip Morris International, Inc. | 3.8% |
|---|
McDonald's Corp. | 3.6% |
|---|
Walt Disney Co. | 3.2% |
|---|
Booking Holdings, Inc. | 2.8% |
|---|
Altria Group, Inc. | 2.5% |
|---|
Comcast Corp. — Class A | 2.4% |
|---|
Starbucks Corp. | 2.4% |
|---|
Royal Caribbean Cruises Ltd. | 2.1% |
|---|
Marriott International, Inc. — Class A | 2.1% |
|---|
Total | 29.9% |
|---|
|
| Material Fund Change [Text Block] |
|
| C000010637 |
|
| Shareholder Report [Line Items] |
|
| Fund Name |
Leisure Fund
|
| Class Name |
Class C
|
| Trading Symbol |
RYLCX
|
| Annual or Semi-Annual Statement [Text Block] |
This annual shareholder report contains important information about the Leisure Fund for the period from April 1, 2025 to March 31, 2026.
|
| Shareholder Report Annual or Semi-Annual |
Annual Shareholder Report
|
| Additional Information [Text Block] |
You can find additional information about the fund at GuggenheimInvestments.com/mutual-funds/literature. You can also request this information by contacting 800 820 0888 or services@guggenheiminvestments.com.
|
| Additional Information Phone Number |
800 820 0888
|
| Additional Information Email |
<span style="box-sizing: border-box; color: rgb(67, 67, 67); display: inline; flex-wrap: nowrap; font-size: 10.6667px; font-weight: 400; grid-area: auto; line-height: 12.8px; margin: 0px; overflow: visible; text-align: left; text-align-last: auto; white-space-collapse: preserve-breaks;">services@guggenheiminvestments.com</span>
|
| Additional Information Website |
<span style="box-sizing: border-box; color: rgb(67, 67, 67); display: inline; flex-wrap: nowrap; font-size: 10.6667px; font-weight: 400; grid-area: auto; line-height: 12.8px; margin: 0px; overflow: visible; text-align: left; text-align-last: auto; white-space-collapse: preserve-breaks;">GuggenheimInvestments.com/mutual-funds/literature</span>
|
| Expenses [Text Block] |
What were the Fund's costs for the last year? * Based on a hypothetical $10,000 investment Table SummaryClass | Costs of a $10,000 Investment | Costs Paid as a % of a $10,000 Investment |
|---|
Class C | $240 | 2.38% |
|---|
Table Summary* | Excludes expenses of the underlying funds in which the fund invests, if any. |
|---|
|
| Expenses Paid, Amount |
$ 240
|
| Factors Affecting Performance [Text Block] |
What factors materially affected the Fund's performance over the last year? The industries that contributed the most to performance were movies & entertainment, hotels resorts & cruise lines, and tobacco. Those that detracted the most were restaurants, casinos & gambling, and leisure facilities. The holdings that contributed the most to performance were EchoStar Corp—Class A, Warner Bros Discovery, Inc.— Series A, and Marriott International, Inc.—Class A. Those that detracted the most were Chipotle Mexican Grill, Inc., Flutter Entertainment Plc, and MakeMyTrip, Ltd. |
| Line Graph [Table Text Block] |
Table Summary | Leisure Fund (Class C) | S&P 500 Index | S&P 500 Consumer Discretionary Index |
|---|
3/31/16 | $10,000 | $10,000 | $10,000 |
|---|
3/31/17 | $11,505 | $11,717 | $11,317 |
|---|
3/31/18 | $12,155 | $13,357 | $13,231 |
|---|
3/31/19 | $12,523 | $14,625 | $14,975 |
|---|
3/31/20 | $9,551 | $13,605 | $13,362 |
|---|
3/31/21 | $18,007 | $21,271 | $22,754 |
|---|
3/31/22 | $15,063 | $24,599 | $24,981 |
|---|
3/31/23 | $13,545 | $22,698 | $20,081 |
|---|
3/31/24 | $15,364 | $29,480 | $25,850 |
|---|
3/31/25 | $16,606 | $31,913 | $27,623 |
|---|
3/31/26 | $16,856 | $37,594 | $30,861 |
|---|
|
| Average Annual Return [Table Text Block] |
Table SummaryAverage Annual Total Returns | One Year | Five Years | Ten Years |
|---|
Class C (without CDSC) | 1.50% | -1.31% | 5.36% |
|---|
Class C (with CDSC) ‡ | 0.50% | -1.31% | 5.36% |
|---|
S&P 500 Index | 17.80% | 12.06% | 14.16% |
|---|
S&P 500 Consumer Discretionary Index | 11.72% | 6.28% | 11.93% |
|---|
|
| AssetsNet |
$ 4,939,500
|
| Holdings Count | Holding |
96
|
| Advisory Fees Paid, Amount |
$ 71,346
|
| InvestmentCompanyPortfolioTurnover |
173.00%
|
| Additional Fund Statistics [Text Block] |
Fund Statistics as of March 31, 2026 - Net Assets$4,939,500
- Total Number of Portfolio Holdings96
- Portfolio Turnover Rate173%
- Total Advisory Fees Paid$71,346
|
| Holdings [Text Block] |
Holdings DiversificationFootnote Reference1 (% of Net Assets) as of March 31, 2026 Table SummaryValue | Value |
|---|
Other | 15.1% | Agriculture | 7.3% | Leisure Time | 8.2% | Lodging | 9.0% | Entertainment | 9.2% | Media | 14.3% | Internet | 17.3% | Retail | 19.3% | |
| Largest Holdings [Text Block] |
10 Largest HoldingsFootnote Reference2 (% of Net Assets) as of March 31, 2026 Table SummaryNetflix, Inc. | 5.0% |
|---|
Philip Morris International, Inc. | 3.8% |
|---|
McDonald's Corp. | 3.6% |
|---|
Walt Disney Co. | 3.2% |
|---|
Booking Holdings, Inc. | 2.8% |
|---|
Altria Group, Inc. | 2.5% |
|---|
Comcast Corp. — Class A | 2.4% |
|---|
Starbucks Corp. | 2.4% |
|---|
Royal Caribbean Cruises Ltd. | 2.1% |
|---|
Marriott International, Inc. — Class A | 2.1% |
|---|
Total | 29.9% |
|---|
|
| Material Fund Change [Text Block] |
|
| C000010635 |
|
| Shareholder Report [Line Items] |
|
| Fund Name |
Leisure Fund
|
| Class Name |
Class H
|
| Trading Symbol |
RYLAX
|
| Annual or Semi-Annual Statement [Text Block] |
This annual shareholder report contains important information about the Leisure Fund for the period from April 1, 2025 to March 31, 2026.
|
| Shareholder Report Annual or Semi-Annual |
Annual Shareholder Report
|
| Additional Information [Text Block] |
You can find additional information about the fund at GuggenheimInvestments.com/mutual-funds/literature. You can also request this information by contacting 800 820 0888 or services@guggenheiminvestments.com.
|
| Additional Information Phone Number |
800 820 0888
|
| Additional Information Email |
<span style="box-sizing: border-box; color: rgb(67, 67, 67); display: inline; flex-wrap: nowrap; font-size: 10.6667px; font-weight: 400; grid-area: auto; line-height: 12.8px; margin: 0px; overflow: visible; text-align: left; text-align-last: auto; white-space-collapse: preserve-breaks;">services@guggenheiminvestments.com</span>
|
| Additional Information Website |
<span style="box-sizing: border-box; color: rgb(67, 67, 67); display: inline; flex-wrap: nowrap; font-size: 10.6667px; font-weight: 400; grid-area: auto; line-height: 12.8px; margin: 0px; overflow: visible; text-align: left; text-align-last: auto; white-space-collapse: preserve-breaks;">GuggenheimInvestments.com/mutual-funds/literature</span>
|
| Expenses [Text Block] |
What were the Fund's costs for the last year? * Based on a hypothetical $10,000 investment Table SummaryClass | Costs of a $10,000 Investment | Costs Paid as a % of a $10,000 Investment |
|---|
Class H | $166 | 1.64% |
|---|
Table Summary* | Excludes expenses of the underlying funds in which the fund invests, if any. |
|---|
|
| Expenses Paid, Amount |
$ 166
|
| Factors Affecting Performance [Text Block] |
What factors materially affected the Fund's performance over the last year? The industries that contributed the most to performance were movies & entertainment, hotels resorts & cruise lines, and tobacco. Those that detracted the most were restaurants, casinos & gambling, and leisure facilities. The holdings that contributed the most to performance were EchoStar Corp—Class A, Warner Bros Discovery, Inc.— Series A, and Marriott International, Inc.—Class A. Those that detracted the most were Chipotle Mexican Grill, Inc., Flutter Entertainment Plc, and MakeMyTrip, Ltd. |
| Line Graph [Table Text Block] |
Table Summary | Leisure Fund (Class H) | S&P 500 Index | S&P 500 Consumer Discretionary Index |
|---|
3/31/16 | $10,000 | $10,000 | $10,000 |
|---|
3/31/17 | $11,590 | $11,717 | $11,317 |
|---|
3/31/18 | $12,339 | $13,357 | $13,231 |
|---|
3/31/19 | $12,809 | $14,625 | $14,975 |
|---|
3/31/20 | $9,841 | $13,605 | $13,362 |
|---|
3/31/21 | $18,694 | $21,271 | $22,754 |
|---|
3/31/22 | $15,756 | $24,599 | $24,981 |
|---|
3/31/23 | $14,278 | $22,698 | $20,081 |
|---|
3/31/24 | $16,314 | $29,480 | $25,850 |
|---|
3/31/25 | $17,764 | $31,913 | $27,623 |
|---|
3/31/26 | $18,170 | $37,594 | $30,861 |
|---|
|
| Average Annual Return [Table Text Block] |
Table SummaryAverage Annual Total Returns | One Year | Five Years | Ten Years |
|---|
Class H | 2.29% | -0.57% | 6.15% |
|---|
S&P 500 Index | 17.80% | 12.06% | 14.16% |
|---|
S&P 500 Consumer Discretionary Index | 11.72% | 6.28% | 11.93% |
|---|
|
| AssetsNet |
$ 4,939,500
|
| Holdings Count | Holding |
96
|
| Advisory Fees Paid, Amount |
$ 71,346
|
| InvestmentCompanyPortfolioTurnover |
173.00%
|
| Additional Fund Statistics [Text Block] |
Fund Statistics as of March 31, 2026 - Net Assets$4,939,500
- Total Number of Portfolio Holdings96
- Portfolio Turnover Rate173%
- Total Advisory Fees Paid$71,346
|
| Holdings [Text Block] |
Holdings DiversificationFootnote Reference1 (% of Net Assets) as of March 31, 2026 Table SummaryValue | Value |
|---|
Other | 15.1% | Agriculture | 7.3% | Leisure Time | 8.2% | Lodging | 9.0% | Entertainment | 9.2% | Media | 14.3% | Internet | 17.3% | Retail | 19.3% | |
| Largest Holdings [Text Block] |
10 Largest HoldingsFootnote Reference2 (% of Net Assets) as of March 31, 2026 Table SummaryNetflix, Inc. | 5.0% |
|---|
Philip Morris International, Inc. | 3.8% |
|---|
McDonald's Corp. | 3.6% |
|---|
Walt Disney Co. | 3.2% |
|---|
Booking Holdings, Inc. | 2.8% |
|---|
Altria Group, Inc. | 2.5% |
|---|
Comcast Corp. — Class A | 2.4% |
|---|
Starbucks Corp. | 2.4% |
|---|
Royal Caribbean Cruises Ltd. | 2.1% |
|---|
Marriott International, Inc. — Class A | 2.1% |
|---|
Total | 29.9% |
|---|
|
| Material Fund Change [Text Block] |
|
| C000010578 |
|
| Shareholder Report [Line Items] |
|
| Fund Name |
Precious Metals Fund
|
| Class Name |
Investor Class
|
| Trading Symbol |
RYPMX
|
| Annual or Semi-Annual Statement [Text Block] |
This annual shareholder report contains important information about the Precious Metals Fund for the period from April 1, 2025 to March 31, 2026.
|
| Shareholder Report Annual or Semi-Annual |
Annual Shareholder Report
|
| Additional Information [Text Block] |
You can find additional information about the fund at GuggenheimInvestments.com/mutual-funds/literature. You can also request this information by contacting 800 820 0888 or services@guggenheiminvestments.com.
|
| Additional Information Phone Number |
800 820 0888
|
| Additional Information Email |
<span style="box-sizing: border-box; color: rgb(67, 67, 67); display: inline; flex-wrap: nowrap; font-size: 10.6667px; font-weight: 400; grid-area: auto; line-height: 12.8px; margin: 0px; overflow: visible; text-align: left; text-align-last: auto; white-space-collapse: preserve-breaks;">services@guggenheiminvestments.com</span>
|
| Additional Information Website |
<span style="box-sizing: border-box; color: rgb(67, 67, 67); display: inline; flex-wrap: nowrap; font-size: 10.6667px; font-weight: 400; grid-area: auto; line-height: 12.8px; margin: 0px; overflow: visible; text-align: left; text-align-last: auto; white-space-collapse: preserve-breaks;">GuggenheimInvestments.com/mutual-funds/literature</span>
|
| Expenses [Text Block] |
What were the Fund's costs for the last year? * Based on a hypothetical $10,000 investment Table SummaryClass | Costs of a $10,000 Investment | Costs Paid as a % of a $10,000 Investment |
|---|
Investor Class | $199 | 1.28% |
|---|
Table Summary* | Excludes expenses of the underlying funds in which the fund invests, if any. |
|---|
|
| Expenses Paid, Amount |
$ 199
|
| Factors Affecting Performance [Text Block] |
What factors materially affected the Fund's performance over the last year? The industries that contributed the most to performance were gold, silver, and copper. No industries detracted from performance. The holdings that contributed the most to performance were Newmont Corporation, Barrick Mining Corp., and Agnico Eagle Mines Ltd. The one that detracted the most was Hycroft Mining Holding Corp—Class A. |
| Line Graph [Table Text Block] |
Table Summary | Precious Metals Fund (Investor Class) | S&P 500 Index | S&P 500 Materials Index |
|---|
3/31/16 | $10,000 | $10,000 | $10,000 |
|---|
3/31/17 | $11,782 | $11,717 | $11,922 |
|---|
3/31/18 | $10,875 | $13,357 | $13,178 |
|---|
3/31/19 | $10,649 | $14,625 | $13,121 |
|---|
3/31/20 | $11,037 | $13,605 | $10,947 |
|---|
3/31/21 | $18,620 | $21,271 | $19,517 |
|---|
3/31/22 | $21,570 | $24,599 | $22,234 |
|---|
3/31/23 | $18,046 | $22,698 | $20,837 |
|---|
3/31/24 | $17,422 | $29,480 | $24,499 |
|---|
3/31/25 | $24,251 | $31,913 | $23,111 |
|---|
3/31/26 | $51,010 | $37,594 | $27,265 |
|---|
|
| Average Annual Return [Table Text Block] |
Table SummaryAverage Annual Total Returns | One Year | Five Years | Ten Years |
|---|
Investor Class | 110.33% | 22.33% | 17.70% |
|---|
S&P 500 Index | 17.80% | 12.06% | 14.16% |
|---|
S&P 500 Materials Index | 17.97% | 6.91% | 10.55% |
|---|
|
| AssetsNet |
$ 154,071,313
|
| Holdings Count | Holding |
39
|
| Advisory Fees Paid, Amount |
$ 1,002,450
|
| InvestmentCompanyPortfolioTurnover |
328.00%
|
| Additional Fund Statistics [Text Block] |
Fund Statistics as of March 31, 2026 - Net Assets$154,071,313
- Total Number of Portfolio Holdings39
- Portfolio Turnover Rate328%
- Total Advisory Fees Paid$1,002,450
|
| Holdings [Text Block] |
Holdings DiversificationFootnote Reference1 (% of Net Assets) as of March 31, 2026 Table SummaryValue | Value |
|---|
Mining | 99.8% | |
| Largest Holdings [Text Block] |
10 Largest HoldingsFootnote Reference2 (% of Net Assets) as of March 31, 2026 Table SummaryNewmont Corp. | 8.0% |
|---|
Agnico Eagle Mines Ltd. | 7.4% |
|---|
Freeport-McMoRan, Inc. | 7.1% |
|---|
Barrick Mining Corp. | 6.0% |
|---|
Wheaton Precious Metals Corp. | 5.6% |
|---|
Anglogold Ashanti plc | 4.6% |
|---|
Kinross Gold Corp. | 4.2% |
|---|
Franco-Nevada Corp. | 4.1% |
|---|
Gold Fields Ltd., ADR | 4.1% |
|---|
Coeur Mining, Inc. | 3.8% |
|---|
Total | 54.9% |
|---|
|
| Material Fund Change [Text Block] |
|
| C000010580 |
|
| Shareholder Report [Line Items] |
|
| Fund Name |
Precious Metals Fund
|
| Class Name |
Class A
|
| Trading Symbol |
RYMNX
|
| Annual or Semi-Annual Statement [Text Block] |
This annual shareholder report contains important information about the Precious Metals Fund for the period from April 1, 2025 to March 31, 2026.
|
| Shareholder Report Annual or Semi-Annual |
Annual Shareholder Report
|
| Additional Information [Text Block] |
You can find additional information about the fund at GuggenheimInvestments.com/mutual-funds/literature. You can also request this information by contacting 800 820 0888 or services@guggenheiminvestments.com.
|
| Additional Information Phone Number |
800 820 0888
|
| Additional Information Email |
<span style="box-sizing: border-box; color: rgb(67, 67, 67); display: inline; flex-wrap: nowrap; font-size: 10.6667px; font-weight: 400; grid-area: auto; line-height: 12.8px; margin: 0px; overflow: visible; text-align: left; text-align-last: auto; white-space-collapse: preserve-breaks;">services@guggenheiminvestments.com</span>
|
| Additional Information Website |
<span style="box-sizing: border-box; color: rgb(67, 67, 67); display: inline; flex-wrap: nowrap; font-size: 10.6667px; font-weight: 400; grid-area: auto; line-height: 12.8px; margin: 0px; overflow: visible; text-align: left; text-align-last: auto; white-space-collapse: preserve-breaks;">GuggenheimInvestments.com/mutual-funds/literature</span>
|
| Expenses [Text Block] |
What were the Fund's costs for the last year? * Based on a hypothetical $10,000 investment Table SummaryClass | Costs of a $10,000 Investment | Costs Paid as a % of a $10,000 Investment |
|---|
Class A | $237 | 1.53% |
|---|
Table Summary* | Excludes expenses of the underlying funds in which the fund invests, if any. |
|---|
|
| Expenses Paid, Amount |
$ 237
|
| Factors Affecting Performance [Text Block] |
What factors materially affected the Fund's performance over the last year? The industries that contributed the most to performance were gold, silver, and copper. No industries detracted from performance. The holdings that contributed the most to performance were Newmont Corporation, Barrick Mining Corp., and Agnico Eagle Mines Ltd. The one that detracted the most was Hycroft Mining Holding Corp—Class A. |
| Line Graph [Table Text Block] |
Table Summary | Precious Metals Fund (Class A)‡ | S&P 500 Index | S&P 500 Materials Index |
|---|
3/31/16 | $9,525 | $10,000 | $10,000 |
|---|
3/31/17 | $11,190 | $11,717 | $11,922 |
|---|
3/31/18 | $10,299 | $13,357 | $13,178 |
|---|
3/31/19 | $10,063 | $14,625 | $13,121 |
|---|
3/31/20 | $10,404 | $13,605 | $10,947 |
|---|
3/31/21 | $17,508 | $21,271 | $19,517 |
|---|
3/31/22 | $20,234 | $24,599 | $22,234 |
|---|
3/31/23 | $16,886 | $22,698 | $20,837 |
|---|
3/31/24 | $16,265 | $29,480 | $24,499 |
|---|
3/31/25 | $22,582 | $31,913 | $23,111 |
|---|
3/31/26 | $47,372 | $37,594 | $27,265 |
|---|
|
| Average Annual Return [Table Text Block] |
Table SummaryAverage Annual Total Returns | One Year | Five Years | Ten Years |
|---|
Class A (without sales charge) | 109.77% | 22.03% | 17.40% |
|---|
Class A (with sales charge) ‡ | 99.82% | 20.84% | 16.83% |
|---|
S&P 500 Index | 17.80% | 12.06% | 14.16% |
|---|
S&P 500 Materials Index | 17.97% | 6.91% | 10.55% |
|---|
|
| AssetsNet |
$ 154,071,313
|
| Holdings Count | Holding |
39
|
| Advisory Fees Paid, Amount |
$ 1,002,450
|
| InvestmentCompanyPortfolioTurnover |
328.00%
|
| Additional Fund Statistics [Text Block] |
Fund Statistics as of March 31, 2026 - Net Assets$154,071,313
- Total Number of Portfolio Holdings39
- Portfolio Turnover Rate328%
- Total Advisory Fees Paid$1,002,450
|
| Holdings [Text Block] |
Holdings DiversificationFootnote Reference1 (% of Net Assets) as of March 31, 2026 Table SummaryValue | Value |
|---|
Mining | 99.8% | |
| Largest Holdings [Text Block] |
10 Largest HoldingsFootnote Reference2 (% of Net Assets) as of March 31, 2026 Table SummaryNewmont Corp. | 8.0% |
|---|
Agnico Eagle Mines Ltd. | 7.4% |
|---|
Freeport-McMoRan, Inc. | 7.1% |
|---|
Barrick Mining Corp. | 6.0% |
|---|
Wheaton Precious Metals Corp. | 5.6% |
|---|
Anglogold Ashanti plc | 4.6% |
|---|
Kinross Gold Corp. | 4.2% |
|---|
Franco-Nevada Corp. | 4.1% |
|---|
Gold Fields Ltd., ADR | 4.1% |
|---|
Coeur Mining, Inc. | 3.8% |
|---|
Total | 54.9% |
|---|
|
| Material Fund Change [Text Block] |
|
| C000010581 |
|
| Shareholder Report [Line Items] |
|
| Fund Name |
Precious Metals Fund
|
| Class Name |
Class C
|
| Trading Symbol |
RYZCX
|
| Annual or Semi-Annual Statement [Text Block] |
This annual shareholder report contains important information about the Precious Metals Fund for the period from April 1, 2025 to March 31, 2026.
|
| Shareholder Report Annual or Semi-Annual |
Annual Shareholder Report
|
| Additional Information [Text Block] |
You can find additional information about the fund at GuggenheimInvestments.com/mutual-funds/literature. You can also request this information by contacting 800 820 0888 or services@guggenheiminvestments.com.
|
| Additional Information Phone Number |
800 820 0888
|
| Additional Information Email |
<span style="box-sizing: border-box; color: rgb(67, 67, 67); display: inline; flex-wrap: nowrap; font-size: 10.6667px; font-weight: 400; grid-area: auto; line-height: 12.8px; margin: 0px; overflow: visible; text-align: left; text-align-last: auto; white-space-collapse: preserve-breaks;">services@guggenheiminvestments.com</span>
|
| Additional Information Website |
<span style="box-sizing: border-box; color: rgb(67, 67, 67); display: inline; flex-wrap: nowrap; font-size: 10.6667px; font-weight: 400; grid-area: auto; line-height: 12.8px; margin: 0px; overflow: visible; text-align: left; text-align-last: auto; white-space-collapse: preserve-breaks;">GuggenheimInvestments.com/mutual-funds/literature</span>
|
| Expenses [Text Block] |
What were the Fund's costs for the last year? * Based on a hypothetical $10,000 investment Table SummaryClass | Costs of a $10,000 Investment | Costs Paid as a % of a $10,000 Investment |
|---|
Class C | $351 | 2.28% |
|---|
Table Summary* | Excludes expenses of the underlying funds in which the fund invests, if any. |
|---|
|
| Expenses Paid, Amount |
$ 351
|
| Factors Affecting Performance [Text Block] |
What factors materially affected the Fund's performance over the last year? The industries that contributed the most to performance were gold, silver, and copper. No industries detracted from performance. The holdings that contributed the most to performance were Newmont Corporation, Barrick Mining Corp., and Agnico Eagle Mines Ltd. The one that detracted the most was Hycroft Mining Holding Corp—Class A. |
| Line Graph [Table Text Block] |
Table Summary | Precious Metals Fund (Class C) | S&P 500 Index | S&P 500 Materials Index |
|---|
3/31/16 | $10,000 | $10,000 | $10,000 |
|---|
3/31/17 | $11,666 | $11,717 | $11,922 |
|---|
3/31/18 | $10,656 | $13,357 | $13,178 |
|---|
3/31/19 | $10,328 | $14,625 | $13,121 |
|---|
3/31/20 | $10,602 | $13,605 | $10,947 |
|---|
3/31/21 | $17,710 | $21,271 | $19,517 |
|---|
3/31/22 | $20,313 | $24,599 | $22,234 |
|---|
3/31/23 | $16,828 | $22,698 | $20,837 |
|---|
3/31/24 | $16,083 | $29,480 | $24,499 |
|---|
3/31/25 | $22,169 | $31,913 | $23,111 |
|---|
3/31/26 | $46,159 | $37,594 | $27,265 |
|---|
|
| Average Annual Return [Table Text Block] |
Table SummaryAverage Annual Total Returns | One Year | Five Years | Ten Years |
|---|
Class C (without CDSC) | 108.22% | 21.12% | 16.53% |
|---|
Class C (with CDSC) ‡ | 107.22% | 21.12% | 16.53% |
|---|
S&P 500 Index | 17.80% | 12.06% | 14.16% |
|---|
S&P 500 Materials Index | 17.97% | 6.91% | 10.55% |
|---|
|
| AssetsNet |
$ 154,071,313
|
| Holdings Count | Holding |
39
|
| Advisory Fees Paid, Amount |
$ 1,002,450
|
| InvestmentCompanyPortfolioTurnover |
328.00%
|
| Additional Fund Statistics [Text Block] |
Fund Statistics as of March 31, 2026 - Net Assets$154,071,313
- Total Number of Portfolio Holdings39
- Portfolio Turnover Rate328%
- Total Advisory Fees Paid$1,002,450
|
| Holdings [Text Block] |
Holdings DiversificationFootnote Reference1 (% of Net Assets) as of March 31, 2026 Table SummaryValue | Value |
|---|
Mining | 99.8% | |
| Largest Holdings [Text Block] |
10 Largest HoldingsFootnote Reference2 (% of Net Assets) as of March 31, 2026 Table SummaryNewmont Corp. | 8.0% |
|---|
Agnico Eagle Mines Ltd. | 7.4% |
|---|
Freeport-McMoRan, Inc. | 7.1% |
|---|
Barrick Mining Corp. | 6.0% |
|---|
Wheaton Precious Metals Corp. | 5.6% |
|---|
Anglogold Ashanti plc | 4.6% |
|---|
Kinross Gold Corp. | 4.2% |
|---|
Franco-Nevada Corp. | 4.1% |
|---|
Gold Fields Ltd., ADR | 4.1% |
|---|
Coeur Mining, Inc. | 3.8% |
|---|
Total | 54.9% |
|---|
|
| Material Fund Change [Text Block] |
|
| C000010579 |
|
| Shareholder Report [Line Items] |
|
| Fund Name |
Precious Metals Fund
|
| Class Name |
Class H
|
| Trading Symbol |
RYMPX
|
| Annual or Semi-Annual Statement [Text Block] |
This annual shareholder report contains important information about the Precious Metals Fund for the period from April 1, 2025 to March 31, 2026.
|
| Shareholder Report Annual or Semi-Annual |
Annual Shareholder Report
|
| Additional Information [Text Block] |
You can find additional information about the fund at GuggenheimInvestments.com/mutual-funds/literature. You can also request this information by contacting 800 820 0888 or services@guggenheiminvestments.com.
|
| Additional Information Phone Number |
800 820 0888
|
| Additional Information Email |
<span style="box-sizing: border-box; color: rgb(67, 67, 67); display: inline; flex-wrap: nowrap; font-size: 10.6667px; font-weight: 400; grid-area: auto; line-height: 12.8px; margin: 0px; overflow: visible; text-align: left; text-align-last: auto; white-space-collapse: preserve-breaks;">services@guggenheiminvestments.com</span>
|
| Additional Information Website |
<span style="box-sizing: border-box; color: rgb(67, 67, 67); display: inline; flex-wrap: nowrap; font-size: 10.6667px; font-weight: 400; grid-area: auto; line-height: 12.8px; margin: 0px; overflow: visible; text-align: left; text-align-last: auto; white-space-collapse: preserve-breaks;">GuggenheimInvestments.com/mutual-funds/literature</span>
|
| Expenses [Text Block] |
What were the Fund's costs for the last year? * Based on a hypothetical $10,000 investment Table SummaryClass | Costs of a $10,000 Investment | Costs Paid as a % of a $10,000 Investment |
|---|
Class H | $237 | 1.53% |
|---|
Table Summary* | Excludes expenses of the underlying funds in which the fund invests, if any. |
|---|
|
| Expenses Paid, Amount |
$ 237
|
| Factors Affecting Performance [Text Block] |
What factors materially affected the Fund's performance over the last year? The industries that contributed the most to performance were gold, silver, and copper. No industries detracted from performance. The holdings that contributed the most to performance were Newmont Corporation, Barrick Mining Corp., and Agnico Eagle Mines Ltd. The one that detracted the most was Hycroft Mining Holding Corp—Class A. |
| Line Graph [Table Text Block] |
Table Summary | Precious Metals Fund (Class H) | S&P 500 Index | S&P 500 Materials Index |
|---|
3/31/16 | $10,000 | $10,000 | $10,000 |
|---|
3/31/17 | $11,754 | $11,717 | $11,922 |
|---|
3/31/18 | $10,802 | $13,357 | $13,178 |
|---|
3/31/19 | $10,550 | $14,625 | $13,121 |
|---|
3/31/20 | $10,915 | $13,605 | $10,947 |
|---|
3/31/21 | $18,370 | $21,271 | $19,517 |
|---|
3/31/22 | $21,230 | $24,599 | $22,234 |
|---|
3/31/23 | $17,718 | $22,698 | $20,837 |
|---|
3/31/24 | $17,061 | $29,480 | $24,499 |
|---|
3/31/25 | $23,694 | $31,913 | $23,111 |
|---|
3/31/26 | $49,705 | $37,594 | $27,265 |
|---|
|
| Average Annual Return [Table Text Block] |
Table SummaryAverage Annual Total Returns | One Year | Five Years | Ten Years |
|---|
Class H | 109.78% | 22.03% | 17.39% |
|---|
S&P 500 Index | 17.80% | 12.06% | 14.16% |
|---|
S&P 500 Materials Index | 17.97% | 6.91% | 10.55% |
|---|
|
| AssetsNet |
$ 154,071,313
|
| Holdings Count | Holding |
39
|
| Advisory Fees Paid, Amount |
$ 1,002,450
|
| InvestmentCompanyPortfolioTurnover |
328.00%
|
| Additional Fund Statistics [Text Block] |
Fund Statistics as of March 31, 2026 - Net Assets$154,071,313
- Total Number of Portfolio Holdings39
- Portfolio Turnover Rate328%
- Total Advisory Fees Paid$1,002,450
|
| Holdings [Text Block] |
Holdings DiversificationFootnote Reference1 (% of Net Assets) as of March 31, 2026 Table SummaryValue | Value |
|---|
Mining | 99.8% | |
| Largest Holdings [Text Block] |
10 Largest HoldingsFootnote Reference2 (% of Net Assets) as of March 31, 2026 Table SummaryNewmont Corp. | 8.0% |
|---|
Agnico Eagle Mines Ltd. | 7.4% |
|---|
Freeport-McMoRan, Inc. | 7.1% |
|---|
Barrick Mining Corp. | 6.0% |
|---|
Wheaton Precious Metals Corp. | 5.6% |
|---|
Anglogold Ashanti plc | 4.6% |
|---|
Kinross Gold Corp. | 4.2% |
|---|
Franco-Nevada Corp. | 4.1% |
|---|
Gold Fields Ltd., ADR | 4.1% |
|---|
Coeur Mining, Inc. | 3.8% |
|---|
Total | 54.9% |
|---|
|
| Material Fund Change [Text Block] |
|
| C000010461 |
|
| Shareholder Report [Line Items] |
|
| Fund Name |
Real Estate Fund
|
| Class Name |
Class A
|
| Trading Symbol |
RYREX
|
| Annual or Semi-Annual Statement [Text Block] |
This annual shareholder report contains important information about the Real Estate Fund for the period from April 1, 2025 to March 31, 2026.
|
| Shareholder Report Annual or Semi-Annual |
Annual Shareholder Report
|
| Additional Information [Text Block] |
You can find additional information about the fund at GuggenheimInvestments.com/mutual-funds/literature. You can also request this information by contacting 800 820 0888 or services@guggenheiminvestments.com.
|
| Additional Information Phone Number |
800 820 0888
|
| Additional Information Email |
<span style="box-sizing: border-box; color: rgb(67, 67, 67); display: inline; flex-wrap: nowrap; font-size: 10.6667px; font-weight: 400; grid-area: auto; line-height: 12.8px; margin: 0px; overflow: visible; text-align: left; text-align-last: auto; white-space-collapse: preserve-breaks;">services@guggenheiminvestments.com</span>
|
| Additional Information Website |
<span style="box-sizing: border-box; color: rgb(67, 67, 67); display: inline; flex-wrap: nowrap; font-size: 10.6667px; font-weight: 400; grid-area: auto; line-height: 12.8px; margin: 0px; overflow: visible; text-align: left; text-align-last: auto; white-space-collapse: preserve-breaks;">GuggenheimInvestments.com/mutual-funds/literature</span>
|
| Expenses [Text Block] |
What were the Fund's costs for the last year? * Based on a hypothetical $10,000 investment Table SummaryClass | Costs of a $10,000 Investment | Costs Paid as a % of a $10,000 Investment |
|---|
Class A | $163 | 1.63% |
|---|
Table Summary* | Excludes expenses of the underlying funds in which the fund invests, if any. |
|---|
|
| Expenses Paid, Amount |
$ 163
|
| Factors Affecting Performance [Text Block] |
What factors materially affected the Fund's performance over the last year? The industries that contributed the most to performance were health care REITs, retail REITs, and real estate services. Those that detracted the most were multi-family residential REITs, telecom tower REITs, and office REITs. The holdings that contributed the most to performance were Opendoor Technologies, Inc., Welltower, Inc., and Equinix, Inc. Those that detracted the most were CoStar Group, Inc., American Tower Corp, and Alexandria Real Estate Equities, Inc. |
| Line Graph [Table Text Block] |
Table Summary | Real Estate Fund (Class A)‡ | S&P 500 Index | MSCI U.S. REIT Index |
|---|
3/31/16 | $9,525 | $10,000 | $10,000 |
|---|
3/31/17 | $10,208 | $11,717 | $10,316 |
|---|
3/31/18 | $9,814 | $13,357 | $9,864 |
|---|
3/31/19 | $11,344 | $14,625 | $11,909 |
|---|
3/31/20 | $8,589 | $13,605 | $9,409 |
|---|
3/31/21 | $12,522 | $21,271 | $12,955 |
|---|
3/31/22 | $14,571 | $24,599 | $16,350 |
|---|
3/31/23 | $11,212 | $22,698 | $13,216 |
|---|
3/31/24 | $12,260 | $29,480 | $14,587 |
|---|
3/31/25 | $13,262 | $31,913 | $16,084 |
|---|
3/31/26 | $13,312 | $37,594 | $17,175 |
|---|
|
| Average Annual Return [Table Text Block] |
Table SummaryAverage Annual Total Returns | One Year | Five Years | Ten Years |
|---|
Class A (without sales charge) | 0.37% | 1.23% | 3.40% |
|---|
Class A (with sales charge) ‡ | -4.38% | 0.25% | 2.90% |
|---|
S&P 500 Index | 17.80% | 12.06% | 14.16% |
|---|
MSCI U.S. REIT Index | 6.92% | 5.80% | 5.57% |
|---|
|
| AssetsNet |
$ 1,928,140
|
| Holdings Count | Holding |
94
|
| Advisory Fees Paid, Amount |
$ 17,473
|
| InvestmentCompanyPortfolioTurnover |
1408.00%
|
| Additional Fund Statistics [Text Block] |
Fund Statistics as of March 31, 2026 - Net Assets$1,928,140
- Total Number of Portfolio Holdings94
- Portfolio Turnover Rate1,408%
- Total Advisory Fees Paid$17,473
|
| Holdings [Text Block] |
Holdings DiversificationFootnote Reference1 (% of Net Assets) as of March 31, 2026 Table SummaryValue | Value |
|---|
Other | 21.8% | REITs-Shopping Centers | 7.0% | REITs-Storage | 7.3% | Real Estate Management/Services | 7.4% | REITs-Warehouse/Industries | 9.6% | REITs-Apartments | 10.6% | REITs-Health Care | 12.9% | REITs-Diversified | 22.5% | |
| Largest Holdings [Text Block] |
10 Largest HoldingsFootnote Reference2 (% of Net Assets) as of March 31, 2026 Table SummaryWelltower, Inc. | 3.9% |
|---|
Prologis, Inc. | 3.8% |
|---|
Equinix, Inc. | 3.3% |
|---|
American Tower Corp. | 3.0% |
|---|
Digital Realty Trust, Inc. | 2.7% |
|---|
Simon Property Group, Inc. | 2.6% |
|---|
Realty Income Corp. | 2.4% |
|---|
CBRE Group, Inc. — Class A | 2.1% |
|---|
Public Storage | 2.1% |
|---|
Ventas, Inc. | 2.0% |
|---|
Total | 27.9% |
|---|
|
| Material Fund Change [Text Block] |
|
| C000010462 |
|
| Shareholder Report [Line Items] |
|
| Fund Name |
Real Estate Fund
|
| Class Name |
Class C
|
| Trading Symbol |
RYCRX
|
| Annual or Semi-Annual Statement [Text Block] |
This annual shareholder report contains important information about the Real Estate Fund for the period from April 1, 2025 to March 31, 2026.
|
| Shareholder Report Annual or Semi-Annual |
Annual Shareholder Report
|
| Additional Information [Text Block] |
You can find additional information about the fund at GuggenheimInvestments.com/mutual-funds/literature. You can also request this information by contacting 800 820 0888 or services@guggenheiminvestments.com.
|
| Additional Information Phone Number |
800 820 0888
|
| Additional Information Email |
<span style="box-sizing: border-box; color: rgb(67, 67, 67); display: inline; flex-wrap: nowrap; font-size: 10.6667px; font-weight: 400; grid-area: auto; line-height: 12.8px; margin: 0px; overflow: visible; text-align: left; text-align-last: auto; white-space-collapse: preserve-breaks;">services@guggenheiminvestments.com</span>
|
| Additional Information Website |
<span style="box-sizing: border-box; color: rgb(67, 67, 67); display: inline; flex-wrap: nowrap; font-size: 10.6667px; font-weight: 400; grid-area: auto; line-height: 12.8px; margin: 0px; overflow: visible; text-align: left; text-align-last: auto; white-space-collapse: preserve-breaks;">GuggenheimInvestments.com/mutual-funds/literature</span>
|
| Expenses [Text Block] |
What were the Fund's costs for the last year? * Based on a hypothetical $10,000 investment Table SummaryClass | Costs of a $10,000 Investment | Costs Paid as a % of a $10,000 Investment |
|---|
Class C | $240 | 2.40% |
|---|
Table Summary* | Excludes expenses of the underlying funds in which the fund invests, if any. |
|---|
|
| Expenses Paid, Amount |
$ 240
|
| Factors Affecting Performance [Text Block] |
What factors materially affected the Fund's performance over the last year? The industries that contributed the most to performance were health care REITs, retail REITs, and real estate services. Those that detracted the most were multi-family residential REITs, telecom tower REITs, and office REITs. The holdings that contributed the most to performance were Opendoor Technologies, Inc., Welltower, Inc., and Equinix, Inc. Those that detracted the most were CoStar Group, Inc., American Tower Corp, and Alexandria Real Estate Equities, Inc. |
| Line Graph [Table Text Block] |
Table Summary | Real Estate Fund (Class C) | S&P 500 Index | MSCI U.S. REIT Index |
|---|
3/31/16 | $10,000 | $10,000 | $10,000 |
|---|
3/31/17 | $10,637 | $11,717 | $10,316 |
|---|
3/31/18 | $10,151 | $13,357 | $9,864 |
|---|
3/31/19 | $11,646 | $14,625 | $11,909 |
|---|
3/31/20 | $8,750 | $13,605 | $9,409 |
|---|
3/31/21 | $12,663 | $21,271 | $12,955 |
|---|
3/31/22 | $14,735 | $24,599 | $16,350 |
|---|
3/31/23 | $11,251 | $22,698 | $13,216 |
|---|
3/31/24 | $12,213 | $29,480 | $14,587 |
|---|
3/31/25 | $13,114 | $31,913 | $16,084 |
|---|
3/31/26 | $13,061 | $37,594 | $17,175 |
|---|
|
| Average Annual Return [Table Text Block] |
Table SummaryAverage Annual Total Returns | One Year | Five Years | Ten Years |
|---|
Class C (without CDSC) | -0.40% | 0.62% | 2.71% |
|---|
Class C (with CDSC) ‡ | -1.36% | 0.62% | 2.71% |
|---|
S&P 500 Index | 17.80% | 12.06% | 14.16% |
|---|
MSCI U.S. REIT Index | 6.92% | 5.80% | 5.57% |
|---|
|
| AssetsNet |
$ 1,928,140
|
| Holdings Count | Holding |
94
|
| Advisory Fees Paid, Amount |
$ 17,473
|
| InvestmentCompanyPortfolioTurnover |
1408.00%
|
| Additional Fund Statistics [Text Block] |
Fund Statistics as of March 31, 2026 - Net Assets$1,928,140
- Total Number of Portfolio Holdings94
- Portfolio Turnover Rate1,408%
- Total Advisory Fees Paid$17,473
|
| Holdings [Text Block] |
Holdings DiversificationFootnote Reference1 (% of Net Assets) as of March 31, 2026 Table SummaryValue | Value |
|---|
Other | 21.8% | REITs-Shopping Centers | 7.0% | REITs-Storage | 7.3% | Real Estate Management/Services | 7.4% | REITs-Warehouse/Industries | 9.6% | REITs-Apartments | 10.6% | REITs-Health Care | 12.9% | REITs-Diversified | 22.5% | |
| Largest Holdings [Text Block] |
10 Largest HoldingsFootnote Reference2 (% of Net Assets) as of March 31, 2026 Table SummaryWelltower, Inc. | 3.9% |
|---|
Prologis, Inc. | 3.8% |
|---|
Equinix, Inc. | 3.3% |
|---|
American Tower Corp. | 3.0% |
|---|
Digital Realty Trust, Inc. | 2.7% |
|---|
Simon Property Group, Inc. | 2.6% |
|---|
Realty Income Corp. | 2.4% |
|---|
CBRE Group, Inc. — Class A | 2.1% |
|---|
Public Storage | 2.1% |
|---|
Ventas, Inc. | 2.0% |
|---|
Total | 27.9% |
|---|
|
| Material Fund Change [Text Block] |
|
| C000010460 |
|
| Shareholder Report [Line Items] |
|
| Fund Name |
Real Estate Fund
|
| Class Name |
Class H
|
| Trading Symbol |
RYHRX
|
| Annual or Semi-Annual Statement [Text Block] |
This annual shareholder report contains important information about the Real Estate Fund for the period from April 1, 2025 to March 31, 2026.
|
| Shareholder Report Annual or Semi-Annual |
Annual Shareholder Report
|
| Additional Information [Text Block] |
You can find additional information about the fund at GuggenheimInvestments.com/mutual-funds/literature. You can also request this information by contacting 800 820 0888 or services@guggenheiminvestments.com.
|
| Additional Information Phone Number |
800 820 0888
|
| Additional Information Email |
<span style="box-sizing: border-box; color: rgb(67, 67, 67); display: inline; flex-wrap: nowrap; font-size: 10.6667px; font-weight: 400; grid-area: auto; line-height: 12.8px; margin: 0px; overflow: visible; text-align: left; text-align-last: auto; white-space-collapse: preserve-breaks;">services@guggenheiminvestments.com</span>
|
| Additional Information Website |
<span style="box-sizing: border-box; color: rgb(67, 67, 67); display: inline; flex-wrap: nowrap; font-size: 10.6667px; font-weight: 400; grid-area: auto; line-height: 12.8px; margin: 0px; overflow: visible; text-align: left; text-align-last: auto; white-space-collapse: preserve-breaks;">GuggenheimInvestments.com/mutual-funds/literature</span>
|
| Expenses [Text Block] |
What were the Fund's costs for the last year? * Based on a hypothetical $10,000 investment Table SummaryClass | Costs of a $10,000 Investment | Costs Paid as a % of a $10,000 Investment |
|---|
Class H | $163 | 1.63% |
|---|
Table Summary* | Excludes expenses of the underlying funds in which the fund invests, if any. |
|---|
|
| Expenses Paid, Amount |
$ 163
|
| Factors Affecting Performance [Text Block] |
What factors materially affected the Fund's performance over the last year? The industries that contributed the most to performance were health care REITs, retail REITs, and real estate services. Those that detracted the most were multi-family residential REITs, telecom tower REITs, and office REITs. The holdings that contributed the most to performance were Opendoor Technologies, Inc., Welltower, Inc., and Equinix, Inc. Those that detracted the most were CoStar Group, Inc., American Tower Corp, and Alexandria Real Estate Equities, Inc. |
| Line Graph [Table Text Block] |
Table Summary | Real Estate Fund (Class H) | S&P 500 Index | MSCI U.S. REIT Index |
|---|
3/31/16 | $10,000 | $10,000 | $10,000 |
|---|
3/31/17 | $10,718 | $11,717 | $10,316 |
|---|
3/31/18 | $10,304 | $13,357 | $9,864 |
|---|
3/31/19 | $11,915 | $14,625 | $11,909 |
|---|
3/31/20 | $9,023 | $13,605 | $9,409 |
|---|
3/31/21 | $13,158 | $21,271 | $12,955 |
|---|
3/31/22 | $15,313 | $24,599 | $16,350 |
|---|
3/31/23 | $11,785 | $22,698 | $13,216 |
|---|
3/31/24 | $12,885 | $29,480 | $14,587 |
|---|
3/31/25 | $13,941 | $31,913 | $16,084 |
|---|
3/31/26 | $13,997 | $37,594 | $17,175 |
|---|
|
| Average Annual Return [Table Text Block] |
Table SummaryAverage Annual Total Returns | One Year | Five Years | Ten Years |
|---|
Class H | 0.40% | 1.24% | 3.42% |
|---|
S&P 500 Index | 17.80% | 12.06% | 14.16% |
|---|
MSCI U.S. REIT Index | 6.92% | 5.80% | 5.57% |
|---|
|
| AssetsNet |
$ 1,928,140
|
| Holdings Count | Holding |
94
|
| Advisory Fees Paid, Amount |
$ 17,473
|
| InvestmentCompanyPortfolioTurnover |
1408.00%
|
| Additional Fund Statistics [Text Block] |
Fund Statistics as of March 31, 2026 - Net Assets$1,928,140
- Total Number of Portfolio Holdings94
- Portfolio Turnover Rate1,408%
- Total Advisory Fees Paid$17,473
|
| Holdings [Text Block] |
Holdings DiversificationFootnote Reference1 (% of Net Assets) as of March 31, 2026 Table SummaryValue | Value |
|---|
Other | 21.8% | REITs-Shopping Centers | 7.0% | REITs-Storage | 7.3% | Real Estate Management/Services | 7.4% | REITs-Warehouse/Industries | 9.6% | REITs-Apartments | 10.6% | REITs-Health Care | 12.9% | REITs-Diversified | 22.5% | |
| Largest Holdings [Text Block] |
10 Largest HoldingsFootnote Reference2 (% of Net Assets) as of March 31, 2026 Table SummaryWelltower, Inc. | 3.9% |
|---|
Prologis, Inc. | 3.8% |
|---|
Equinix, Inc. | 3.3% |
|---|
American Tower Corp. | 3.0% |
|---|
Digital Realty Trust, Inc. | 2.7% |
|---|
Simon Property Group, Inc. | 2.6% |
|---|
Realty Income Corp. | 2.4% |
|---|
CBRE Group, Inc. — Class A | 2.1% |
|---|
Public Storage | 2.1% |
|---|
Ventas, Inc. | 2.0% |
|---|
Total | 27.9% |
|---|
|
| Material Fund Change [Text Block] |
|
| C000010638 |
|
| Shareholder Report [Line Items] |
|
| Fund Name |
Retailing Fund
|
| Class Name |
Investor Class
|
| Trading Symbol |
RYRIX
|
| Annual or Semi-Annual Statement [Text Block] |
This annual shareholder report contains important information about the Retailing Fund for the period from April 1, 2025 to March 31, 2026.
|
| Shareholder Report Annual or Semi-Annual |
Annual Shareholder Report
|
| Additional Information [Text Block] |
You can find additional information about the fund at GuggenheimInvestments.com/mutual-funds/literature. You can also request this information by contacting 800 820 0888 or services@guggenheiminvestments.com.
|
| Additional Information Phone Number |
800 820 0888
|
| Additional Information Email |
<span style="box-sizing: border-box; color: rgb(67, 67, 67); display: inline; flex-wrap: nowrap; font-size: 10.6667px; font-weight: 400; grid-area: auto; line-height: 12.8px; margin: 0px; overflow: visible; text-align: left; text-align-last: auto; white-space-collapse: preserve-breaks;">services@guggenheiminvestments.com</span>
|
| Additional Information Website |
<span style="box-sizing: border-box; color: rgb(67, 67, 67); display: inline; flex-wrap: nowrap; font-size: 10.6667px; font-weight: 400; grid-area: auto; line-height: 12.8px; margin: 0px; overflow: visible; text-align: left; text-align-last: auto; white-space-collapse: preserve-breaks;">GuggenheimInvestments.com/mutual-funds/literature</span>
|
| Expenses [Text Block] |
What were the Fund's costs for the last year? * Based on a hypothetical $10,000 investment Table SummaryClass | Costs of a $10,000 Investment | Costs Paid as a % of a $10,000 Investment |
|---|
Investor Class | $146 | 1.39% |
|---|
Table Summary* | Excludes expenses of the underlying funds in which the fund invests, if any. |
|---|
|
| Expenses Paid, Amount |
$ 146
|
| Factors Affecting Performance [Text Block] |
What factors materially affected the Fund's performance over the last year? The industries that contributed the most to performance were apparel retail, consumer staples merchandise retail, and other specialty retail. Those that detracted the most were other interactive home entertainment, distributors, and home improvement retail. The holdings that contributed the most to performance were Walmart, Inc., Carvana Co.—Class A, and Ross Stores, Inc. Those that detracted the most were Sea Limited Sponsored ADR—Class A, CarMax, Inc., and JD.com, Inc. Sponsored ADR—Class A. |
| Line Graph [Table Text Block] |
Table Summary | Retailing Fund (Investor Class) | S&P 500 Index | S&P 500 Consumer Discretionary Index |
|---|
3/31/16 | $10,000 | $10,000 | $10,000 |
|---|
3/31/17 | $9,926 | $11,717 | $11,317 |
|---|
3/31/18 | $11,182 | $13,357 | $13,231 |
|---|
3/31/19 | $12,420 | $14,625 | $14,975 |
|---|
3/31/20 | $10,623 | $13,605 | $13,362 |
|---|
3/31/21 | $21,198 | $21,271 | $22,754 |
|---|
3/31/22 | $18,878 | $24,599 | $24,981 |
|---|
3/31/23 | $17,113 | $22,698 | $20,081 |
|---|
3/31/24 | $20,768 | $29,480 | $25,850 |
|---|
3/31/25 | $20,925 | $31,913 | $27,623 |
|---|
3/31/26 | $22,927 | $37,594 | $30,861 |
|---|
|
| Average Annual Return [Table Text Block] |
Table SummaryAverage Annual Total Returns | One Year | Five Years | Ten Years |
|---|
Investor Class | 9.57% | 1.58% | 8.65% |
|---|
S&P 500 Index | 17.80% | 12.06% | 14.16% |
|---|
S&P 500 Consumer Discretionary Index | 11.72% | 6.28% | 11.93% |
|---|
|
| AssetsNet |
$ 5,459,645
|
| Holdings Count | Holding |
63
|
| Advisory Fees Paid, Amount |
$ 54,099
|
| InvestmentCompanyPortfolioTurnover |
252.00%
|
| Additional Fund Statistics [Text Block] |
Fund Statistics as of March 31, 2026 - Net Assets$5,459,645
- Total Number of Portfolio Holdings63
- Portfolio Turnover Rate252%
- Total Advisory Fees Paid$54,099
|
| Holdings [Text Block] |
Holdings DiversificationFootnote Reference1 (% of Net Assets) as of March 31, 2026 Table SummaryValue | Value |
|---|
Commercial Services | 0.7% | Software | 1.1% | Distribution & Wholesale | 1.9% | Internet | 28.0% | Retail | 67.8% | |
| Largest Holdings [Text Block] |
10 Largest HoldingsFootnote Reference2 (% of Net Assets) as of March 31, 2026 Table SummaryAmazon.com, Inc. | 10.0% |
|---|
Walmart, Inc. | 5.5% |
|---|
Costco Wholesale Corp. | 4.3% |
|---|
TJX Companies, Inc. | 4.3% |
|---|
Home Depot, Inc. | 4.0% |
|---|
Lowe's Companies, Inc. | 4.0% |
|---|
O'Reilly Automotive, Inc. | 3.0% |
|---|
Ross Stores, Inc. | 2.9% |
|---|
Carvana Co. | 2.9% |
|---|
MercadoLibre, Inc. | 2.7% |
|---|
Total | 43.6% |
|---|
|
| Material Fund Change [Text Block] |
|
| C000010640 |
|
| Shareholder Report [Line Items] |
|
| Fund Name |
Retailing Fund
|
| Class Name |
Class A
|
| Trading Symbol |
RYRTX
|
| Annual or Semi-Annual Statement [Text Block] |
This annual shareholder report contains important information about the Retailing Fund for the period from April 1, 2025 to March 31, 2026.
|
| Shareholder Report Annual or Semi-Annual |
Annual Shareholder Report
|
| Additional Information [Text Block] |
You can find additional information about the fund at GuggenheimInvestments.com/mutual-funds/literature. You can also request this information by contacting 800 820 0888 or services@guggenheiminvestments.com.
|
| Additional Information Phone Number |
800 820 0888
|
| Additional Information Email |
<span style="box-sizing: border-box; color: rgb(67, 67, 67); display: inline; flex-wrap: nowrap; font-size: 10.6667px; font-weight: 400; grid-area: auto; line-height: 12.8px; margin: 0px; overflow: visible; text-align: left; text-align-last: auto; white-space-collapse: preserve-breaks;">services@guggenheiminvestments.com</span>
|
| Additional Information Website |
<span style="box-sizing: border-box; color: rgb(67, 67, 67); display: inline; flex-wrap: nowrap; font-size: 10.6667px; font-weight: 400; grid-area: auto; line-height: 12.8px; margin: 0px; overflow: visible; text-align: left; text-align-last: auto; white-space-collapse: preserve-breaks;">GuggenheimInvestments.com/mutual-funds/literature</span>
|
| Expenses [Text Block] |
What were the Fund's costs for the last year? * Based on a hypothetical $10,000 investment Table SummaryClass | Costs of a $10,000 Investment | Costs Paid as a % of a $10,000 Investment |
|---|
Class A | $171 | 1.63% |
|---|
Table Summary* | Excludes expenses of the underlying funds in which the fund invests, if any. |
|---|
|
| Expenses Paid, Amount |
$ 171
|
| Factors Affecting Performance [Text Block] |
What factors materially affected the Fund's performance over the last year? The industries that contributed the most to performance were apparel retail, consumer staples merchandise retail, and other specialty retail. Those that detracted the most were other interactive home entertainment, distributors, and home improvement retail. The holdings that contributed the most to performance were Walmart, Inc., Carvana Co.—Class A, and Ross Stores, Inc. Those that detracted the most were Sea Limited Sponsored ADR—Class A, CarMax, Inc., and JD.com, Inc. Sponsored ADR—Class A. |
| Line Graph [Table Text Block] |
Table Summary | Retailing Fund (Class A)‡ | S&P 500 Index | S&P 500 Consumer Discretionary Index |
|---|
3/31/16 | $9,525 | $10,000 | $10,000 |
|---|
3/31/17 | $9,433 | $11,717 | $11,317 |
|---|
3/31/18 | $10,604 | $13,357 | $13,231 |
|---|
3/31/19 | $11,749 | $14,625 | $14,975 |
|---|
3/31/20 | $10,026 | $13,605 | $13,362 |
|---|
3/31/21 | $19,960 | $21,271 | $22,754 |
|---|
3/31/22 | $17,730 | $24,599 | $24,981 |
|---|
3/31/23 | $16,032 | $22,698 | $20,081 |
|---|
3/31/24 | $19,404 | $29,480 | $25,850 |
|---|
3/31/25 | $19,502 | $31,913 | $27,623 |
|---|
3/31/26 | $21,316 | $37,594 | $30,861 |
|---|
|
| Average Annual Return [Table Text Block] |
Table SummaryAverage Annual Total Returns | One Year | Five Years | Ten Years |
|---|
Class A (without sales charge) | 9.31% | 1.32% | 8.39% |
|---|
Class A (with sales charge) ‡ | 4.12% | 0.34% | 7.86% |
|---|
S&P 500 Index | 17.80% | 12.06% | 14.16% |
|---|
S&P 500 Consumer Discretionary Index | 11.72% | 6.28% | 11.93% |
|---|
|
| AssetsNet |
$ 5,459,645
|
| Holdings Count | Holding |
63
|
| Advisory Fees Paid, Amount |
$ 54,099
|
| InvestmentCompanyPortfolioTurnover |
252.00%
|
| Additional Fund Statistics [Text Block] |
Fund Statistics as of March 31, 2026 - Net Assets$5,459,645
- Total Number of Portfolio Holdings63
- Portfolio Turnover Rate252%
- Total Advisory Fees Paid$54,099
|
| Holdings [Text Block] |
Holdings DiversificationFootnote Reference1 (% of Net Assets) as of March 31, 2026 Table SummaryValue | Value |
|---|
Commercial Services | 0.7% | Software | 1.1% | Distribution & Wholesale | 1.9% | Internet | 28.0% | Retail | 67.8% | |
| Largest Holdings [Text Block] |
10 Largest HoldingsFootnote Reference2 (% of Net Assets) as of March 31, 2026 Table SummaryAmazon.com, Inc. | 10.0% |
|---|
Walmart, Inc. | 5.5% |
|---|
Costco Wholesale Corp. | 4.3% |
|---|
TJX Companies, Inc. | 4.3% |
|---|
Home Depot, Inc. | 4.0% |
|---|
Lowe's Companies, Inc. | 4.0% |
|---|
O'Reilly Automotive, Inc. | 3.0% |
|---|
Ross Stores, Inc. | 2.9% |
|---|
Carvana Co. | 2.9% |
|---|
MercadoLibre, Inc. | 2.7% |
|---|
Total | 43.6% |
|---|
|
| Material Fund Change [Text Block] |
|
| C000010641 |
|
| Shareholder Report [Line Items] |
|
| Fund Name |
Retailing Fund
|
| Class Name |
Class C
|
| Trading Symbol |
RYRCX
|
| Annual or Semi-Annual Statement [Text Block] |
This annual shareholder report contains important information about the Retailing Fund for the period from April 1, 2025 to March 31, 2026.
|
| Shareholder Report Annual or Semi-Annual |
Annual Shareholder Report
|
| Additional Information [Text Block] |
You can find additional information about the fund at GuggenheimInvestments.com/mutual-funds/literature. You can also request this information by contacting 800 820 0888 or services@guggenheiminvestments.com.
|
| Additional Information Phone Number |
800 820 0888
|
| Additional Information Email |
<span style="box-sizing: border-box; color: rgb(67, 67, 67); display: inline; flex-wrap: nowrap; font-size: 10.6667px; font-weight: 400; grid-area: auto; line-height: 12.8px; margin: 0px; overflow: visible; text-align: left; text-align-last: auto; white-space-collapse: preserve-breaks;">services@guggenheiminvestments.com</span>
|
| Additional Information Website |
<span style="box-sizing: border-box; color: rgb(67, 67, 67); display: inline; flex-wrap: nowrap; font-size: 10.6667px; font-weight: 400; grid-area: auto; line-height: 12.8px; margin: 0px; overflow: visible; text-align: left; text-align-last: auto; white-space-collapse: preserve-breaks;">GuggenheimInvestments.com/mutual-funds/literature</span>
|
| Expenses [Text Block] |
What were the Fund's costs for the last year? * Based on a hypothetical $10,000 investment Table SummaryClass | Costs of a $10,000 Investment | Costs Paid as a % of a $10,000 Investment |
|---|
Class C | $248 | 2.38% |
|---|
Table Summary* | Excludes expenses of the underlying funds in which the fund invests, if any. |
|---|
|
| Expenses Paid, Amount |
$ 248
|
| Factors Affecting Performance [Text Block] |
What factors materially affected the Fund's performance over the last year? The industries that contributed the most to performance were apparel retail, consumer staples merchandise retail, and other specialty retail. Those that detracted the most were other interactive home entertainment, distributors, and home improvement retail. The holdings that contributed the most to performance were Walmart, Inc., Carvana Co.—Class A, and Ross Stores, Inc. Those that detracted the most were Sea Limited Sponsored ADR—Class A, CarMax, Inc., and JD.com, Inc. Sponsored ADR—Class A. |
| Line Graph [Table Text Block] |
Table Summary | Retailing Fund (Class C) | S&P 500 Index | S&P 500 Consumer Discretionary Index |
|---|
3/31/16 | $10,000 | $10,000 | $10,000 |
|---|
3/31/17 | $9,824 | $11,717 | $11,317 |
|---|
3/31/18 | $10,960 | $13,357 | $13,231 |
|---|
3/31/19 | $12,052 | $14,625 | $14,975 |
|---|
3/31/20 | $10,207 | $13,605 | $13,362 |
|---|
3/31/21 | $20,159 | $21,271 | $22,754 |
|---|
3/31/22 | $17,773 | $24,599 | $24,981 |
|---|
3/31/23 | $15,949 | $22,698 | $20,081 |
|---|
3/31/24 | $19,157 | $29,480 | $25,850 |
|---|
3/31/25 | $19,109 | $31,913 | $27,623 |
|---|
3/31/26 | $20,730 | $37,594 | $30,861 |
|---|
|
| Average Annual Return [Table Text Block] |
Table SummaryAverage Annual Total Returns | One Year | Five Years | Ten Years |
|---|
Class C (without CDSC) | 8.48% | 0.56% | 7.56% |
|---|
Class C (with CDSC) ‡ | 7.48% | 0.56% | 7.56% |
|---|
S&P 500 Index | 17.80% | 12.06% | 14.16% |
|---|
S&P 500 Consumer Discretionary Index | 11.72% | 6.28% | 11.93% |
|---|
|
| AssetsNet |
$ 5,459,645
|
| Holdings Count | Holding |
63
|
| Advisory Fees Paid, Amount |
$ 54,099
|
| InvestmentCompanyPortfolioTurnover |
252.00%
|
| Additional Fund Statistics [Text Block] |
Fund Statistics as of March 31, 2026 - Net Assets$5,459,645
- Total Number of Portfolio Holdings63
- Portfolio Turnover Rate252%
- Total Advisory Fees Paid$54,099
|
| Holdings [Text Block] |
Holdings DiversificationFootnote Reference1 (% of Net Assets) as of March 31, 2026 Table SummaryValue | Value |
|---|
Commercial Services | 0.7% | Software | 1.1% | Distribution & Wholesale | 1.9% | Internet | 28.0% | Retail | 67.8% | |
| Largest Holdings [Text Block] |
10 Largest HoldingsFootnote Reference2 (% of Net Assets) as of March 31, 2026 Table SummaryAmazon.com, Inc. | 10.0% |
|---|
Walmart, Inc. | 5.5% |
|---|
Costco Wholesale Corp. | 4.3% |
|---|
TJX Companies, Inc. | 4.3% |
|---|
Home Depot, Inc. | 4.0% |
|---|
Lowe's Companies, Inc. | 4.0% |
|---|
O'Reilly Automotive, Inc. | 3.0% |
|---|
Ross Stores, Inc. | 2.9% |
|---|
Carvana Co. | 2.9% |
|---|
MercadoLibre, Inc. | 2.7% |
|---|
Total | 43.6% |
|---|
|
| Material Fund Change [Text Block] |
|
| C000010639 |
|
| Shareholder Report [Line Items] |
|
| Fund Name |
Retailing Fund
|
| Class Name |
Class H
|
| Trading Symbol |
RYRAX
|
| Annual or Semi-Annual Statement [Text Block] |
This annual shareholder report contains important information about the Retailing Fund for the period from April 1, 2025 to March 31, 2026.
|
| Shareholder Report Annual or Semi-Annual |
Annual Shareholder Report
|
| Additional Information [Text Block] |
You can find additional information about the fund at GuggenheimInvestments.com/mutual-funds/literature. You can also request this information by contacting 800 820 0888 or services@guggenheiminvestments.com.
|
| Additional Information Phone Number |
800 820 0888
|
| Additional Information Email |
<span style="box-sizing: border-box; color: rgb(67, 67, 67); display: inline; flex-wrap: nowrap; font-size: 10.6667px; font-weight: 400; grid-area: auto; line-height: 12.8px; margin: 0px; overflow: visible; text-align: left; text-align-last: auto; white-space-collapse: preserve-breaks;">services@guggenheiminvestments.com</span>
|
| Additional Information Website |
<span style="box-sizing: border-box; color: rgb(67, 67, 67); display: inline; flex-wrap: nowrap; font-size: 10.6667px; font-weight: 400; grid-area: auto; line-height: 12.8px; margin: 0px; overflow: visible; text-align: left; text-align-last: auto; white-space-collapse: preserve-breaks;">GuggenheimInvestments.com/mutual-funds/literature</span>
|
| Expenses [Text Block] |
What were the Fund's costs for the last year? * Based on a hypothetical $10,000 investment Table SummaryClass | Costs of a $10,000 Investment | Costs Paid as a % of a $10,000 Investment |
|---|
Class H | $172 | 1.64% |
|---|
Table Summary* | Excludes expenses of the underlying funds in which the fund invests, if any. |
|---|
|
| Expenses Paid, Amount |
$ 172
|
| Factors Affecting Performance [Text Block] |
What factors materially affected the Fund's performance over the last year? The industries that contributed the most to performance were apparel retail, consumer staples merchandise retail, and other specialty retail. Those that detracted the most were other interactive home entertainment, distributors, and home improvement retail. The holdings that contributed the most to performance were Walmart, Inc., Carvana Co.—Class A, and Ross Stores, Inc. Those that detracted the most were Sea Limited Sponsored ADR—Class A, CarMax, Inc., and JD.com, Inc. Sponsored ADR—Class A. |
| Line Graph [Table Text Block] |
Table Summary | Retailing Fund (Class H) | S&P 500 Index | S&P 500 Consumer Discretionary Index |
|---|
3/31/16 | $10,000 | $10,000 | $10,000 |
|---|
3/31/17 | $9,904 | $11,717 | $11,317 |
|---|
3/31/18 | $11,133 | $13,357 | $13,231 |
|---|
3/31/19 | $12,337 | $14,625 | $14,975 |
|---|
3/31/20 | $10,527 | $13,605 | $13,362 |
|---|
3/31/21 | $20,950 | $21,271 | $22,754 |
|---|
3/31/22 | $18,607 | $24,599 | $24,981 |
|---|
3/31/23 | $16,820 | $22,698 | $20,081 |
|---|
3/31/24 | $20,360 | $29,480 | $25,850 |
|---|
3/31/25 | $20,461 | $31,913 | $27,623 |
|---|
3/31/26 | $22,365 | $37,594 | $30,861 |
|---|
|
| Average Annual Return [Table Text Block] |
Table SummaryAverage Annual Total Returns | One Year | Five Years | Ten Years |
|---|
Class H | 9.31% | 1.32% | 8.38% |
|---|
S&P 500 Index | 17.80% | 12.06% | 14.16% |
|---|
S&P 500 Consumer Discretionary Index | 11.72% | 6.28% | 11.93% |
|---|
|
| AssetsNet |
$ 5,459,645
|
| Holdings Count | Holding |
63
|
| Advisory Fees Paid, Amount |
$ 54,099
|
| InvestmentCompanyPortfolioTurnover |
252.00%
|
| Additional Fund Statistics [Text Block] |
Fund Statistics as of March 31, 2026 - Net Assets$5,459,645
- Total Number of Portfolio Holdings63
- Portfolio Turnover Rate252%
- Total Advisory Fees Paid$54,099
|
| Holdings [Text Block] |
Holdings DiversificationFootnote Reference1 (% of Net Assets) as of March 31, 2026 Table SummaryValue | Value |
|---|
Commercial Services | 0.7% | Software | 1.1% | Distribution & Wholesale | 1.9% | Internet | 28.0% | Retail | 67.8% | |
| Largest Holdings [Text Block] |
10 Largest HoldingsFootnote Reference2 (% of Net Assets) as of March 31, 2026 Table SummaryAmazon.com, Inc. | 10.0% |
|---|
Walmart, Inc. | 5.5% |
|---|
Costco Wholesale Corp. | 4.3% |
|---|
TJX Companies, Inc. | 4.3% |
|---|
Home Depot, Inc. | 4.0% |
|---|
Lowe's Companies, Inc. | 4.0% |
|---|
O'Reilly Automotive, Inc. | 3.0% |
|---|
Ross Stores, Inc. | 2.9% |
|---|
Carvana Co. | 2.9% |
|---|
MercadoLibre, Inc. | 2.7% |
|---|
Total | 43.6% |
|---|
|
| Material Fund Change [Text Block] |
|
| C000010622 |
|
| Shareholder Report [Line Items] |
|
| Fund Name |
Technology Fund
|
| Class Name |
Investor Class
|
| Trading Symbol |
RYTIX
|
| Annual or Semi-Annual Statement [Text Block] |
This annual shareholder report contains important information about the Technology Fund for the period from April 1, 2025 to March 31, 2026.
|
| Shareholder Report Annual or Semi-Annual |
Annual Shareholder Report
|
| Additional Information [Text Block] |
You can find additional information about the fund at GuggenheimInvestments.com/mutual-funds/literature. You can also request this information by contacting 800 820 0888 or services@guggenheiminvestments.com.
|
| Additional Information Phone Number |
800 820 0888
|
| Additional Information Email |
<span style="box-sizing: border-box; color: rgb(67, 67, 67); display: inline; flex-wrap: nowrap; font-size: 10.6667px; font-weight: 400; grid-area: auto; line-height: 12.8px; margin: 0px; overflow: visible; text-align: left; text-align-last: auto; white-space-collapse: preserve-breaks;">services@guggenheiminvestments.com</span>
|
| Additional Information Website |
<span style="box-sizing: border-box; color: rgb(67, 67, 67); display: inline; flex-wrap: nowrap; font-size: 10.6667px; font-weight: 400; grid-area: auto; line-height: 12.8px; margin: 0px; overflow: visible; text-align: left; text-align-last: auto; white-space-collapse: preserve-breaks;">GuggenheimInvestments.com/mutual-funds/literature</span>
|
| Expenses [Text Block] |
What were the Fund's costs for the last year? * Based on a hypothetical $10,000 investment Table SummaryClass | Costs of a $10,000 Investment | Costs Paid as a % of a $10,000 Investment |
|---|
Investor Class | $160 | 1.38% |
|---|
Table Summary* | Excludes expenses of the underlying funds in which the fund invests, if any. |
|---|
|
| Expenses Paid, Amount |
$ 160
|
| Factors Affecting Performance [Text Block] |
What factors materially affected the Fund's performance over the last year? The industries that contributed the most to performance were semiconductors, technology hardware storage & peripherals, and semiconductor materials & equipment. Those that detracted the most were IT consulting & other services and technology distributors. The holdings that contributed the most to performance were Alphabet, Inc.—Class A, NVIDIA Corp., and Broadcom, Inc. Those that detracted the most were Atlassian Corp.—Class A, Adobe, Inc., and Salesforce, Inc. |
| Line Graph [Table Text Block] |
Table Summary | Technology Fund (Investor Class) | S&P 500 Index | S&P 500 Information Technology Index |
|---|
3/31/16 | $10,000 | $10,000 | $10,000 |
|---|
3/31/17 | $12,463 | $11,717 | $12,491 |
|---|
3/31/18 | $15,842 | $13,357 | $15,948 |
|---|
3/31/19 | $17,909 | $14,625 | $18,411 |
|---|
3/31/20 | $17,719 | $13,605 | $20,331 |
|---|
3/31/21 | $31,948 | $21,271 | $33,874 |
|---|
3/31/22 | $32,567 | $24,599 | $40,953 |
|---|
3/31/23 | $28,678 | $22,698 | $39,090 |
|---|
3/31/24 | $39,881 | $29,480 | $57,075 |
|---|
3/31/25 | $40,008 | $31,913 | $60,436 |
|---|
3/31/26 | $52,723 | $37,594 | $77,992 |
|---|
|
| Average Annual Return [Table Text Block] |
Table SummaryAverage Annual Total Returns | One Year | Five Years | Ten Years |
|---|
Investor Class | 31.77% | 10.54% | 18.09% |
|---|
S&P 500 Index | 17.80% | 12.06% | 14.16% |
|---|
S&P 500 Information Technology Index | 28.83% | 18.13% | 22.80% |
|---|
|
| AssetsNet |
$ 44,595,646
|
| Holdings Count | Holding |
142
|
| Advisory Fees Paid, Amount |
$ 529,837
|
| InvestmentCompanyPortfolioTurnover |
120.00%
|
| Additional Fund Statistics [Text Block] |
Fund Statistics as of March 31, 2026 - Net Assets$44,595,646
- Total Number of Portfolio Holdings142
- Portfolio Turnover Rate120%
- Total Advisory Fees Paid$529,837
|
| Holdings [Text Block] |
Holdings DiversificationFootnote Reference1 (% of Net Assets) as of March 31, 2026 Table SummaryValue | Value |
|---|
Other | 2.3% | Investment Companies | 1.5% | Electronics | 4.1% | Telecommunications | 5.3% | Internet | 14.6% | Computers | 17.0% | Software | 25.6% | Semiconductors | 29.5% | |
| Largest Holdings [Text Block] |
10 Largest HoldingsFootnote Reference2 (% of Net Assets) as of March 31, 2026 Table SummaryNVIDIA Corp. | 5.5% |
|---|
Apple, Inc. | 5.3% |
|---|
Alphabet, Inc. — Class A | 5.1% |
|---|
Microsoft Corp. | 4.4% |
|---|
Broadcom, Inc. | 3.2% |
|---|
Meta Platforms, Inc. — Class A | 3.2% |
|---|
Advanced Micro Devices, Inc. | 1.6% |
|---|
Micron Technology, Inc. | 1.6% |
|---|
Palantir Technologies, Inc. — Class A | 1.6% |
|---|
Applied Materials, Inc. | 1.5% |
|---|
Total | 33.0% |
|---|
|
| Material Fund Change [Text Block] |
|
| C000010624 |
|
| Shareholder Report [Line Items] |
|
| Fund Name |
Technology Fund
|
| Class Name |
Class A
|
| Trading Symbol |
RYTHX
|
| Annual or Semi-Annual Statement [Text Block] |
This annual shareholder report contains important information about the Technology Fund for the period from April 1, 2025 to March 31, 2026.
|
| Shareholder Report Annual or Semi-Annual |
Annual Shareholder Report
|
| Additional Information [Text Block] |
You can find additional information about the fund at GuggenheimInvestments.com/mutual-funds/literature. You can also request this information by contacting 800 820 0888 or services@guggenheiminvestments.com.
|
| Additional Information Phone Number |
800 820 0888
|
| Additional Information Email |
<span style="box-sizing: border-box; color: rgb(67, 67, 67); display: inline; flex-wrap: nowrap; font-size: 10.6667px; font-weight: 400; grid-area: auto; line-height: 12.8px; margin: 0px; overflow: visible; text-align: left; text-align-last: auto; white-space-collapse: preserve-breaks;">services@guggenheiminvestments.com</span>
|
| Additional Information Website |
<span style="box-sizing: border-box; color: rgb(67, 67, 67); display: inline; flex-wrap: nowrap; font-size: 10.6667px; font-weight: 400; grid-area: auto; line-height: 12.8px; margin: 0px; overflow: visible; text-align: left; text-align-last: auto; white-space-collapse: preserve-breaks;">GuggenheimInvestments.com/mutual-funds/literature</span>
|
| Expenses [Text Block] |
What were the Fund's costs for the last year? * Based on a hypothetical $10,000 investment Table SummaryClass | Costs of a $10,000 Investment | Costs Paid as a % of a $10,000 Investment |
|---|
Class A | $189 | 1.63% |
|---|
Table Summary* | Excludes expenses of the underlying funds in which the fund invests, if any. |
|---|
|
| Expenses Paid, Amount |
$ 189
|
| Factors Affecting Performance [Text Block] |
What factors materially affected the Fund's performance over the last year? The industries that contributed the most to performance were semiconductors, technology hardware storage & peripherals, and semiconductor materials & equipment. Those that detracted the most were IT consulting & other services and technology distributors. The holdings that contributed the most to performance were Alphabet, Inc.—Class A, NVIDIA Corp., and Broadcom, Inc. Those that detracted the most were Atlassian Corp.—Class A, Adobe, Inc., and Salesforce, Inc. |
| Line Graph [Table Text Block] |
Table Summary | Technology Fund (Class A)‡ | S&P 500 Index | S&P 500 Information Technology Index |
|---|
3/31/16 | $9,525 | $10,000 | $10,000 |
|---|
3/31/17 | $11,845 | $11,717 | $12,491 |
|---|
3/31/18 | $15,017 | $13,357 | $15,948 |
|---|
3/31/19 | $16,935 | $14,625 | $18,411 |
|---|
3/31/20 | $16,712 | $13,605 | $20,331 |
|---|
3/31/21 | $30,059 | $21,271 | $33,874 |
|---|
3/31/22 | $30,565 | $24,599 | $40,953 |
|---|
3/31/23 | $26,848 | $22,698 | $39,090 |
|---|
3/31/24 | $37,244 | $29,480 | $57,075 |
|---|
3/31/25 | $37,269 | $31,913 | $60,436 |
|---|
3/31/26 | $48,991 | $37,594 | $77,992 |
|---|
|
| Average Annual Return [Table Text Block] |
Table SummaryAverage Annual Total Returns | One Year | Five Years | Ten Years |
|---|
Class A (without sales charge) | 31.44% | 10.27% | 17.80% |
|---|
Class A (with sales charge) ‡ | 25.22% | 9.20% | 17.22% |
|---|
S&P 500 Index | 17.80% | 12.06% | 14.16% |
|---|
S&P 500 Information Technology Index | 28.83% | 18.13% | 22.80% |
|---|
|
| AssetsNet |
$ 44,595,646
|
| Holdings Count | Holding |
142
|
| Advisory Fees Paid, Amount |
$ 529,837
|
| InvestmentCompanyPortfolioTurnover |
120.00%
|
| Additional Fund Statistics [Text Block] |
Fund Statistics as of March 31, 2026 - Net Assets$44,595,646
- Total Number of Portfolio Holdings142
- Portfolio Turnover Rate120%
- Total Advisory Fees Paid$529,837
|
| Holdings [Text Block] |
Holdings DiversificationFootnote Reference1 (% of Net Assets) as of March 31, 2026 Table SummaryValue | Value |
|---|
Other | 2.3% | Investment Companies | 1.5% | Electronics | 4.1% | Telecommunications | 5.3% | Internet | 14.6% | Computers | 17.0% | Software | 25.6% | Semiconductors | 29.5% | |
| Largest Holdings [Text Block] |
10 Largest HoldingsFootnote Reference2 (% of Net Assets) as of March 31, 2026 Table SummaryNVIDIA Corp. | 5.5% |
|---|
Apple, Inc. | 5.3% |
|---|
Alphabet, Inc. — Class A | 5.1% |
|---|
Microsoft Corp. | 4.4% |
|---|
Broadcom, Inc. | 3.2% |
|---|
Meta Platforms, Inc. — Class A | 3.2% |
|---|
Advanced Micro Devices, Inc. | 1.6% |
|---|
Micron Technology, Inc. | 1.6% |
|---|
Palantir Technologies, Inc. — Class A | 1.6% |
|---|
Applied Materials, Inc. | 1.5% |
|---|
Total | 33.0% |
|---|
|
| Material Fund Change [Text Block] |
|
| C000010625 |
|
| Shareholder Report [Line Items] |
|
| Fund Name |
Technology Fund
|
| Class Name |
Class C
|
| Trading Symbol |
RYCHX
|
| Annual or Semi-Annual Statement [Text Block] |
This annual shareholder report contains important information about the Technology Fund for the period from April 1, 2025 to March 31, 2026.
|
| Shareholder Report Annual or Semi-Annual |
Annual Shareholder Report
|
| Additional Information [Text Block] |
You can find additional information about the fund at GuggenheimInvestments.com/mutual-funds/literature. You can also request this information by contacting 800 820 0888 or services@guggenheiminvestments.com.
|
| Additional Information Phone Number |
800 820 0888
|
| Additional Information Email |
<span style="box-sizing: border-box; color: rgb(67, 67, 67); display: inline; flex-wrap: nowrap; font-size: 10.6667px; font-weight: 400; grid-area: auto; line-height: 12.8px; margin: 0px; overflow: visible; text-align: left; text-align-last: auto; white-space-collapse: preserve-breaks;">services@guggenheiminvestments.com</span>
|
| Additional Information Website |
<span style="box-sizing: border-box; color: rgb(67, 67, 67); display: inline; flex-wrap: nowrap; font-size: 10.6667px; font-weight: 400; grid-area: auto; line-height: 12.8px; margin: 0px; overflow: visible; text-align: left; text-align-last: auto; white-space-collapse: preserve-breaks;">GuggenheimInvestments.com/mutual-funds/literature</span>
|
| Expenses [Text Block] |
What were the Fund's costs for the last year? * Based on a hypothetical $10,000 investment Table SummaryClass | Costs of a $10,000 Investment | Costs Paid as a % of a $10,000 Investment |
|---|
Class C | $274 | 2.38% |
|---|
Table Summary* | Excludes expenses of the underlying funds in which the fund invests, if any. |
|---|
|
| Expenses Paid, Amount |
$ 274
|
| Factors Affecting Performance [Text Block] |
What factors materially affected the Fund's performance over the last year? The industries that contributed the most to performance were semiconductors, technology hardware storage & peripherals, and semiconductor materials & equipment. Those that detracted the most were IT consulting & other services and technology distributors. The holdings that contributed the most to performance were Alphabet, Inc.—Class A, NVIDIA Corp., and Broadcom, Inc. Those that detracted the most were Atlassian Corp.—Class A, Adobe, Inc., and Salesforce, Inc. |
| Line Graph [Table Text Block] |
Table Summary | Technology Fund (Class C) | S&P 500 Index | S&P 500 Information Technology Index |
|---|
3/31/16 | $10,000 | $10,000 | $10,000 |
|---|
3/31/17 | $12,341 | $11,717 | $12,491 |
|---|
3/31/18 | $15,531 | $13,357 | $15,948 |
|---|
3/31/19 | $17,384 | $14,625 | $18,411 |
|---|
3/31/20 | $17,027 | $13,605 | $20,331 |
|---|
3/31/21 | $30,397 | $21,271 | $33,874 |
|---|
3/31/22 | $30,676 | $24,599 | $40,953 |
|---|
3/31/23 | $26,742 | $22,698 | $39,090 |
|---|
3/31/24 | $36,823 | $29,480 | $57,075 |
|---|
3/31/25 | $36,573 | $31,913 | $60,436 |
|---|
3/31/26 | $47,717 | $37,594 | $77,992 |
|---|
|
| Average Annual Return [Table Text Block] |
Table SummaryAverage Annual Total Returns | One Year | Five Years | Ten Years |
|---|
Class C (without CDSC) | 30.48% | 9.44% | 16.91% |
|---|
Class C (with CDSC) ‡ | 29.48% | 9.44% | 16.91% |
|---|
S&P 500 Index | 17.80% | 12.06% | 14.16% |
|---|
S&P 500 Information Technology Index | 28.83% | 18.13% | 22.80% |
|---|
|
| AssetsNet |
$ 44,595,646
|
| Holdings Count | Holding |
142
|
| Advisory Fees Paid, Amount |
$ 529,837
|
| InvestmentCompanyPortfolioTurnover |
120.00%
|
| Additional Fund Statistics [Text Block] |
Fund Statistics as of March 31, 2026 - Net Assets$44,595,646
- Total Number of Portfolio Holdings142
- Portfolio Turnover Rate120%
- Total Advisory Fees Paid$529,837
|
| Holdings [Text Block] |
Holdings DiversificationFootnote Reference1 (% of Net Assets) as of March 31, 2026 Table SummaryValue | Value |
|---|
Other | 2.3% | Investment Companies | 1.5% | Electronics | 4.1% | Telecommunications | 5.3% | Internet | 14.6% | Computers | 17.0% | Software | 25.6% | Semiconductors | 29.5% | |
| Largest Holdings [Text Block] |
10 Largest HoldingsFootnote Reference2 (% of Net Assets) as of March 31, 2026 Table SummaryNVIDIA Corp. | 5.5% |
|---|
Apple, Inc. | 5.3% |
|---|
Alphabet, Inc. — Class A | 5.1% |
|---|
Microsoft Corp. | 4.4% |
|---|
Broadcom, Inc. | 3.2% |
|---|
Meta Platforms, Inc. — Class A | 3.2% |
|---|
Advanced Micro Devices, Inc. | 1.6% |
|---|
Micron Technology, Inc. | 1.6% |
|---|
Palantir Technologies, Inc. — Class A | 1.6% |
|---|
Applied Materials, Inc. | 1.5% |
|---|
Total | 33.0% |
|---|
|
| Material Fund Change [Text Block] |
|
| C000010623 |
|
| Shareholder Report [Line Items] |
|
| Fund Name |
Technology Fund
|
| Class Name |
Class H
|
| Trading Symbol |
RYTAX
|
| Annual or Semi-Annual Statement [Text Block] |
This annual shareholder report contains important information about the Technology Fund for the period from April 1, 2025 to March 31, 2026.
|
| Shareholder Report Annual or Semi-Annual |
Annual Shareholder Report
|
| Additional Information [Text Block] |
You can find additional information about the fund at GuggenheimInvestments.com/mutual-funds/literature. You can also request this information by contacting 800 820 0888 or services@guggenheiminvestments.com.
|
| Additional Information Phone Number |
800 820 0888
|
| Additional Information Email |
<span style="box-sizing: border-box; color: rgb(67, 67, 67); display: inline; flex-wrap: nowrap; font-size: 10.6667px; font-weight: 400; grid-area: auto; line-height: 12.8px; margin: 0px; overflow: visible; text-align: left; text-align-last: auto; white-space-collapse: preserve-breaks;">services@guggenheiminvestments.com</span>
|
| Additional Information Website |
<span style="box-sizing: border-box; color: rgb(67, 67, 67); display: inline; flex-wrap: nowrap; font-size: 10.6667px; font-weight: 400; grid-area: auto; line-height: 12.8px; margin: 0px; overflow: visible; text-align: left; text-align-last: auto; white-space-collapse: preserve-breaks;">GuggenheimInvestments.com/mutual-funds/literature</span>
|
| Expenses [Text Block] |
What were the Fund's costs for the last year? * Based on a hypothetical $10,000 investment Table SummaryClass | Costs of a $10,000 Investment | Costs Paid as a % of a $10,000 Investment |
|---|
Class H | $189 | 1.63% |
|---|
Table Summary* | Excludes expenses of the underlying funds in which the fund invests, if any. |
|---|
|
| Expenses Paid, Amount |
$ 189
|
| Factors Affecting Performance [Text Block] |
What factors materially affected the Fund's performance over the last year? The industries that contributed the most to performance were semiconductors, technology hardware storage & peripherals, and semiconductor materials & equipment. Those that detracted the most were IT consulting & other services and technology distributors. The holdings that contributed the most to performance were Alphabet, Inc.—Class A, NVIDIA Corp., and Broadcom, Inc. Those that detracted the most were Atlassian Corp.—Class A, Adobe, Inc., and Salesforce, Inc. |
| Line Graph [Table Text Block] |
Table Summary | Technology Fund (Class H) | S&P 500 Index | S&P 500 Information Technology Index |
|---|
3/31/16 | $10,000 | $10,000 | $10,000 |
|---|
3/31/17 | $12,432 | $11,717 | $12,491 |
|---|
3/31/18 | $15,761 | $13,357 | $15,948 |
|---|
3/31/19 | $17,772 | $14,625 | $18,411 |
|---|
3/31/20 | $17,541 | $13,605 | $20,331 |
|---|
3/31/21 | $31,548 | $21,271 | $33,874 |
|---|
3/31/22 | $32,077 | $24,599 | $40,953 |
|---|
3/31/23 | $28,174 | $22,698 | $39,090 |
|---|
3/31/24 | $39,082 | $29,480 | $57,075 |
|---|
3/31/25 | $39,107 | $31,913 | $60,436 |
|---|
3/31/26 | $51,408 | $37,594 | $77,992 |
|---|
|
| Average Annual Return [Table Text Block] |
Table SummaryAverage Annual Total Returns | One Year | Five Years | Ten Years |
|---|
Class H | 31.45% | 10.26% | 17.79% |
|---|
S&P 500 Index | 17.80% | 12.06% | 14.16% |
|---|
S&P 500 Information Technology Index | 28.83% | 18.13% | 22.80% |
|---|
|
| AssetsNet |
$ 44,595,646
|
| Holdings Count | Holding |
142
|
| Advisory Fees Paid, Amount |
$ 529,837
|
| InvestmentCompanyPortfolioTurnover |
120.00%
|
| Additional Fund Statistics [Text Block] |
Fund Statistics as of March 31, 2026 - Net Assets$44,595,646
- Total Number of Portfolio Holdings142
- Portfolio Turnover Rate120%
- Total Advisory Fees Paid$529,837
|
| Holdings [Text Block] |
Holdings DiversificationFootnote Reference1 (% of Net Assets) as of March 31, 2026 Table SummaryValue | Value |
|---|
Other | 2.3% | Investment Companies | 1.5% | Electronics | 4.1% | Telecommunications | 5.3% | Internet | 14.6% | Computers | 17.0% | Software | 25.6% | Semiconductors | 29.5% | |
| Largest Holdings [Text Block] |
10 Largest HoldingsFootnote Reference2 (% of Net Assets) as of March 31, 2026 Table SummaryNVIDIA Corp. | 5.5% |
|---|
Apple, Inc. | 5.3% |
|---|
Alphabet, Inc. — Class A | 5.1% |
|---|
Microsoft Corp. | 4.4% |
|---|
Broadcom, Inc. | 3.2% |
|---|
Meta Platforms, Inc. — Class A | 3.2% |
|---|
Advanced Micro Devices, Inc. | 1.6% |
|---|
Micron Technology, Inc. | 1.6% |
|---|
Palantir Technologies, Inc. — Class A | 1.6% |
|---|
Applied Materials, Inc. | 1.5% |
|---|
Total | 33.0% |
|---|
|
| Material Fund Change [Text Block] |
|
| C000010582 |
|
| Shareholder Report [Line Items] |
|
| Fund Name |
Telecommunications Fund
|
| Class Name |
Investor Class
|
| Trading Symbol |
RYMIX
|
| Annual or Semi-Annual Statement [Text Block] |
This annual shareholder report contains important information about the Telecommunications Fund for the period from April 1, 2025 to March 31, 2026.
|
| Shareholder Report Annual or Semi-Annual |
Annual Shareholder Report
|
| Additional Information [Text Block] |
You can find additional information about the fund at GuggenheimInvestments.com/mutual-funds/literature. You can also request this information by contacting 800 820 0888 or services@guggenheiminvestments.com.
|
| Additional Information Phone Number |
800 820 0888
|
| Additional Information Email |
<span style="box-sizing: border-box; color: rgb(67, 67, 67); display: inline; flex-wrap: nowrap; font-size: 10.6667px; font-weight: 400; grid-area: auto; line-height: 12.8px; margin: 0px; overflow: visible; text-align: left; text-align-last: auto; white-space-collapse: preserve-breaks;">services@guggenheiminvestments.com</span>
|
| Additional Information Website |
<span style="box-sizing: border-box; color: rgb(67, 67, 67); display: inline; flex-wrap: nowrap; font-size: 10.6667px; font-weight: 400; grid-area: auto; line-height: 12.8px; margin: 0px; overflow: visible; text-align: left; text-align-last: auto; white-space-collapse: preserve-breaks;">GuggenheimInvestments.com/mutual-funds/literature</span>
|
| Expenses [Text Block] |
What were the Fund's costs for the last year? * Based on a hypothetical $10,000 investment Table SummaryClass | Costs of a $10,000 Investment | Costs Paid as a % of a $10,000 Investment |
|---|
Investor Class | $173 | 1.38% |
|---|
Table Summary* | Excludes expenses of the underlying funds in which the fund invests, if any. |
|---|
|
| Expenses Paid, Amount |
$ 173
|
| Factors Affecting Performance [Text Block] |
What factors materially affected the Fund's performance over the last year? The industries that contributed the most to performance were communications equipment, alternative carriers, and cable & satellite. There were no industries that detracted from performance. The holdings that contributed the most to performance were Lumentum Holdings, Inc., Ciena Corp., and EchoStar Corp.—Class A. Those that detracted the most were Charter Communication, Inc.,—Class A, T-Mobile US, Inc., and Cogent Communications Holdings, Inc. |
| Line Graph [Table Text Block] |
Table Summary | Telecommunications Fund (Investor Class) | S&P 500 Index | S&P 500 Telecommunications Services Index |
|---|
3/31/16 | $10,000 | $10,000 | $10,000 |
|---|
3/31/17 | $11,421 | $11,717 | $9,718 |
|---|
3/31/18 | $11,802 | $13,357 | $8,789 |
|---|
3/31/19 | $12,453 | $14,625 | $9,047 |
|---|
3/31/20 | $11,116 | $13,605 | $8,354 |
|---|
3/31/21 | $14,734 | $21,271 | $9,196 |
|---|
3/31/22 | $14,091 | $24,599 | $7,885 |
|---|
3/31/23 | $11,995 | $22,698 | $7,150 |
|---|
3/31/24 | $11,886 | $29,480 | $7,374 |
|---|
3/31/25 | $14,191 | $31,913 | $10,111 |
|---|
3/31/26 | $21,446 | $37,594 | $9,830 |
|---|
|
| Average Annual Return [Table Text Block] |
Table SummaryAverage Annual Total Returns | One Year | Five Years | Ten Years |
|---|
Investor Class | 51.13% | 7.80% | 7.93% |
|---|
S&P 500 Index | 17.80% | 12.06% | 14.16% |
|---|
S&P 500 Telecommunications Services Index | -2.79% | 1.34% | -0.17% |
|---|
|
| AssetsNet |
$ 5,315,350
|
| Holdings Count | Holding |
49
|
| Advisory Fees Paid, Amount |
$ 62,795
|
| InvestmentCompanyPortfolioTurnover |
333.00%
|
| Additional Fund Statistics [Text Block] |
Fund Statistics as of March 31, 2026 - Net Assets$5,315,350
- Total Number of Portfolio Holdings49
- Portfolio Turnover Rate333%
- Total Advisory Fees Paid$62,795
|
| Holdings [Text Block] |
Holdings DiversificationFootnote Reference1 (% of Net Assets) as of March 31, 2026 Table SummaryValue | Value |
|---|
Aerospace & Defense | 1.1% | Electronics | 1.5% | Computers | 5.2% | Internet | 5.4% | Media | 11.0% | Telecommunications | 75.3% | |
| Largest Holdings [Text Block] |
10 Largest HoldingsFootnote Reference2 (% of Net Assets) as of March 31, 2026 Table SummaryCisco Systems, Inc. | 7.7% |
|---|
AT&T, Inc. | 6.8% |
|---|
Verizon Communications, Inc. | 6.4% |
|---|
Arista Networks, Inc. | 5.1% |
|---|
Comcast Corp. — Class A | 4.6% |
|---|
T-Mobile US, Inc. | 4.5% |
|---|
Ciena Corp. | 4.4% |
|---|
Lumentum Holdings, Inc. | 4.3% |
|---|
Motorola Solutions, Inc. | 4.0% |
|---|
EchoStar Corp. — Class A | 3.5% |
|---|
Total | 51.3% |
|---|
|
| Material Fund Change [Text Block] |
|
| C000010584 |
|
| Shareholder Report [Line Items] |
|
| Fund Name |
Telecommunications Fund
|
| Class Name |
Class A
|
| Trading Symbol |
RYTLX
|
| Annual or Semi-Annual Statement [Text Block] |
This annual shareholder report contains important information about the Telecommunications Fund for the period from April 1, 2025 to March 31, 2026.
|
| Shareholder Report Annual or Semi-Annual |
Annual Shareholder Report
|
| Additional Information [Text Block] |
You can find additional information about the fund at GuggenheimInvestments.com/mutual-funds/literature. You can also request this information by contacting 800 820 0888 or services@guggenheiminvestments.com.
|
| Additional Information Phone Number |
800 820 0888
|
| Additional Information Email |
<span style="box-sizing: border-box; color: rgb(67, 67, 67); display: inline; flex-wrap: nowrap; font-size: 10.6667px; font-weight: 400; grid-area: auto; line-height: 12.8px; margin: 0px; overflow: visible; text-align: left; text-align-last: auto; white-space-collapse: preserve-breaks;">services@guggenheiminvestments.com</span>
|
| Additional Information Website |
<span style="box-sizing: border-box; color: rgb(67, 67, 67); display: inline; flex-wrap: nowrap; font-size: 10.6667px; font-weight: 400; grid-area: auto; line-height: 12.8px; margin: 0px; overflow: visible; text-align: left; text-align-last: auto; white-space-collapse: preserve-breaks;">GuggenheimInvestments.com/mutual-funds/literature</span>
|
| Expenses [Text Block] |
What were the Fund's costs for the last year? * Based on a hypothetical $10,000 investment Table SummaryClass | Costs of a $10,000 Investment | Costs Paid as a % of a $10,000 Investment |
|---|
Class A | $204 | 1.63% |
|---|
Table Summary* | Excludes expenses of the underlying funds in which the fund invests, if any. |
|---|
|
| Expenses Paid, Amount |
$ 204
|
| Factors Affecting Performance [Text Block] |
What factors materially affected the Fund's performance over the last year? The industries that contributed the most to performance were communications equipment, alternative carriers, and cable & satellite. There were no industries that detracted from performance. The holdings that contributed the most to performance were Lumentum Holdings, Inc., Ciena Corp., and EchoStar Corp.—Class A. Those that detracted the most were Charter Communication, Inc.,—Class A, T-Mobile US, Inc., and Cogent Communications Holdings, Inc. |
| Line Graph [Table Text Block] |
Table Summary | Telecommunications Fund (Class A)‡ | S&P 500 Index | S&P 500 Telecommunications Services Index |
|---|
3/31/16 | $9,525 | $10,000 | $10,000 |
|---|
3/31/17 | $10,847 | $11,717 | $9,718 |
|---|
3/31/18 | $11,181 | $13,357 | $8,789 |
|---|
3/31/19 | $11,771 | $14,625 | $9,047 |
|---|
3/31/20 | $10,482 | $13,605 | $8,354 |
|---|
3/31/21 | $13,857 | $21,271 | $9,196 |
|---|
3/31/22 | $13,221 | $24,599 | $7,885 |
|---|
3/31/23 | $11,222 | $22,698 | $7,150 |
|---|
3/31/24 | $11,100 | $29,480 | $7,374 |
|---|
3/31/25 | $13,222 | $31,913 | $10,111 |
|---|
3/31/26 | $19,925 | $37,594 | $9,830 |
|---|
|
| Average Annual Return [Table Text Block] |
Table SummaryAverage Annual Total Returns | One Year | Five Years | Ten Years |
|---|
Class A (without sales charge) | 50.70% | 7.53% | 7.66% |
|---|
Class A (with sales charge) ‡ | 43.55% | 6.49% | 7.14% |
|---|
S&P 500 Index | 17.80% | 12.06% | 14.16% |
|---|
S&P 500 Telecommunications Services Index | -2.79% | 1.34% | -0.17% |
|---|
|
| AssetsNet |
$ 5,315,350
|
| Holdings Count | Holding |
49
|
| Advisory Fees Paid, Amount |
$ 62,795
|
| InvestmentCompanyPortfolioTurnover |
333.00%
|
| Additional Fund Statistics [Text Block] |
Fund Statistics as of March 31, 2026 - Net Assets$5,315,350
- Total Number of Portfolio Holdings49
- Portfolio Turnover Rate333%
- Total Advisory Fees Paid$62,795
|
| Holdings [Text Block] |
Holdings DiversificationFootnote Reference1 (% of Net Assets) as of March 31, 2026 Table SummaryValue | Value |
|---|
Aerospace & Defense | 1.1% | Electronics | 1.5% | Computers | 5.2% | Internet | 5.4% | Media | 11.0% | Telecommunications | 75.3% | |
| Largest Holdings [Text Block] |
10 Largest HoldingsFootnote Reference2 (% of Net Assets) as of March 31, 2026 Table SummaryCisco Systems, Inc. | 7.7% |
|---|
AT&T, Inc. | 6.8% |
|---|
Verizon Communications, Inc. | 6.4% |
|---|
Arista Networks, Inc. | 5.1% |
|---|
Comcast Corp. — Class A | 4.6% |
|---|
T-Mobile US, Inc. | 4.5% |
|---|
Ciena Corp. | 4.4% |
|---|
Lumentum Holdings, Inc. | 4.3% |
|---|
Motorola Solutions, Inc. | 4.0% |
|---|
EchoStar Corp. — Class A | 3.5% |
|---|
Total | 51.3% |
|---|
|
| Material Fund Change [Text Block] |
|
| C000010585 |
|
| Shareholder Report [Line Items] |
|
| Fund Name |
Telecommunications Fund
|
| Class Name |
Class C
|
| Trading Symbol |
RYCSX
|
| Annual or Semi-Annual Statement [Text Block] |
This annual shareholder report contains important information about the Telecommunications Fund for the period from April 1, 2025 to March 31, 2026.
|
| Shareholder Report Annual or Semi-Annual |
Annual Shareholder Report
|
| Additional Information [Text Block] |
You can find additional information about the fund at GuggenheimInvestments.com/mutual-funds/literature. You can also request this information by contacting 800 820 0888 or services@guggenheiminvestments.com.
|
| Additional Information Phone Number |
800 820 0888
|
| Additional Information Email |
<span style="box-sizing: border-box; color: rgb(67, 67, 67); display: inline; flex-wrap: nowrap; font-size: 10.6667px; font-weight: 400; grid-area: auto; line-height: 12.8px; margin: 0px; overflow: visible; text-align: left; text-align-last: auto; white-space-collapse: preserve-breaks;">services@guggenheiminvestments.com</span>
|
| Additional Information Website |
<span style="box-sizing: border-box; color: rgb(67, 67, 67); display: inline; flex-wrap: nowrap; font-size: 10.6667px; font-weight: 400; grid-area: auto; line-height: 12.8px; margin: 0px; overflow: visible; text-align: left; text-align-last: auto; white-space-collapse: preserve-breaks;">GuggenheimInvestments.com/mutual-funds/literature</span>
|
| Expenses [Text Block] |
What were the Fund's costs for the last year? * Based on a hypothetical $10,000 investment Table SummaryClass | Costs of a $10,000 Investment | Costs Paid as a % of a $10,000 Investment |
|---|
Class C | $298 | 2.39% |
|---|
Table Summary* | Excludes expenses of the underlying funds in which the fund invests, if any. |
|---|
|
| Expenses Paid, Amount |
$ 298
|
| Factors Affecting Performance [Text Block] |
What factors materially affected the Fund's performance over the last year? The industries that contributed the most to performance were communications equipment, alternative carriers, and cable & satellite. There were no industries that detracted from performance. The holdings that contributed the most to performance were Lumentum Holdings, Inc., Ciena Corp., and EchoStar Corp.—Class A. Those that detracted the most were Charter Communication, Inc.,—Class A, T-Mobile US, Inc., and Cogent Communications Holdings, Inc. |
| Line Graph [Table Text Block] |
Table Summary | Telecommunications Fund (Class C) | S&P 500 Index | S&P 500 Telecommunications Services Index |
|---|
3/31/16 | $10,000 | $10,000 | $10,000 |
|---|
3/31/17 | $11,305 | $11,717 | $9,718 |
|---|
3/31/18 | $11,565 | $13,357 | $8,789 |
|---|
3/31/19 | $12,084 | $14,625 | $9,047 |
|---|
3/31/20 | $10,680 | $13,605 | $8,354 |
|---|
3/31/21 | $14,014 | $21,271 | $9,196 |
|---|
3/31/22 | $13,271 | $24,599 | $7,885 |
|---|
3/31/23 | $11,179 | $22,698 | $7,150 |
|---|
3/31/24 | $10,974 | $29,480 | $7,374 |
|---|
3/31/25 | $12,971 | $31,913 | $10,111 |
|---|
3/31/26 | $19,400 | $37,594 | $9,830 |
|---|
|
| Average Annual Return [Table Text Block] |
Table SummaryAverage Annual Total Returns | One Year | Five Years | Ten Years |
|---|
Class C (without CDSC) | 49.57% | 6.72% | 6.85% |
|---|
Class C (with CDSC) ‡ | 48.57% | 6.72% | 6.85% |
|---|
S&P 500 Index | 17.80% | 12.06% | 14.16% |
|---|
S&P 500 Telecommunications Services Index | -2.79% | 1.34% | -0.17% |
|---|
|
| AssetsNet |
$ 5,315,350
|
| Holdings Count | Holding |
49
|
| Advisory Fees Paid, Amount |
$ 62,795
|
| InvestmentCompanyPortfolioTurnover |
333.00%
|
| Additional Fund Statistics [Text Block] |
Fund Statistics as of March 31, 2026 - Net Assets$5,315,350
- Total Number of Portfolio Holdings49
- Portfolio Turnover Rate333%
- Total Advisory Fees Paid$62,795
|
| Holdings [Text Block] |
Holdings DiversificationFootnote Reference1 (% of Net Assets) as of March 31, 2026 Table SummaryValue | Value |
|---|
Aerospace & Defense | 1.1% | Electronics | 1.5% | Computers | 5.2% | Internet | 5.4% | Media | 11.0% | Telecommunications | 75.3% | |
| Largest Holdings [Text Block] |
10 Largest HoldingsFootnote Reference2 (% of Net Assets) as of March 31, 2026 Table SummaryCisco Systems, Inc. | 7.7% |
|---|
AT&T, Inc. | 6.8% |
|---|
Verizon Communications, Inc. | 6.4% |
|---|
Arista Networks, Inc. | 5.1% |
|---|
Comcast Corp. — Class A | 4.6% |
|---|
T-Mobile US, Inc. | 4.5% |
|---|
Ciena Corp. | 4.4% |
|---|
Lumentum Holdings, Inc. | 4.3% |
|---|
Motorola Solutions, Inc. | 4.0% |
|---|
EchoStar Corp. — Class A | 3.5% |
|---|
Total | 51.3% |
|---|
|
| Material Fund Change [Text Block] |
|
| C000010583 |
|
| Shareholder Report [Line Items] |
|
| Fund Name |
Telecommunications Fund
|
| Class Name |
Class H
|
| Trading Symbol |
RYMAX
|
| Annual or Semi-Annual Statement [Text Block] |
This annual shareholder report contains important information about the Telecommunications Fund for the period from April 1, 2025 to March 31, 2026.
|
| Shareholder Report Annual or Semi-Annual |
Annual Shareholder Report
|
| Additional Information [Text Block] |
You can find additional information about the fund at GuggenheimInvestments.com/mutual-funds/literature. You can also request this information by contacting 800 820 0888 or services@guggenheiminvestments.com.
|
| Additional Information Phone Number |
800 820 0888
|
| Additional Information Email |
<span style="box-sizing: border-box; color: rgb(67, 67, 67); display: inline; flex-wrap: nowrap; font-size: 10.6667px; font-weight: 400; grid-area: auto; line-height: 12.8px; margin: 0px; overflow: visible; text-align: left; text-align-last: auto; white-space-collapse: preserve-breaks;">services@guggenheiminvestments.com</span>
|
| Additional Information Website |
<span style="box-sizing: border-box; color: rgb(67, 67, 67); display: inline; flex-wrap: nowrap; font-size: 10.6667px; font-weight: 400; grid-area: auto; line-height: 12.8px; margin: 0px; overflow: visible; text-align: left; text-align-last: auto; white-space-collapse: preserve-breaks;">GuggenheimInvestments.com/mutual-funds/literature</span>
|
| Expenses [Text Block] |
What were the Fund's costs for the last year? * Based on a hypothetical $10,000 investment Table SummaryClass | Costs of a $10,000 Investment | Costs Paid as a % of a $10,000 Investment |
|---|
Class H | $204 | 1.63% |
|---|
Table Summary* | Excludes expenses of the underlying funds in which the fund invests, if any. |
|---|
|
| Expenses Paid, Amount |
$ 204
|
| Factors Affecting Performance [Text Block] |
What factors materially affected the Fund's performance over the last year? The industries that contributed the most to performance were communications equipment, alternative carriers, and cable & satellite. There were no industries that detracted from performance. The holdings that contributed the most to performance were Lumentum Holdings, Inc., Ciena Corp., and EchoStar Corp.—Class A. Those that detracted the most were Charter Communication, Inc.,—Class A, T-Mobile US, Inc., and Cogent Communications Holdings, Inc. |
| Line Graph [Table Text Block] |
Table Summary | Telecommunications Fund (Class H) | S&P 500 Index | S&P 500 Telecommunications Services Index |
|---|
3/31/16 | $10,000 | $10,000 | $10,000 |
|---|
3/31/17 | $11,394 | $11,717 | $9,718 |
|---|
3/31/18 | $11,744 | $13,357 | $8,789 |
|---|
3/31/19 | $12,392 | $14,625 | $9,047 |
|---|
3/31/20 | $11,031 | $13,605 | $8,354 |
|---|
3/31/21 | $14,587 | $21,271 | $9,196 |
|---|
3/31/22 | $13,916 | $24,599 | $7,885 |
|---|
3/31/23 | $11,810 | $22,698 | $7,150 |
|---|
3/31/24 | $11,678 | $29,480 | $7,374 |
|---|
3/31/25 | $13,911 | $31,913 | $10,111 |
|---|
3/31/26 | $20,964 | $37,594 | $9,830 |
|---|
|
| Average Annual Return [Table Text Block] |
Table SummaryAverage Annual Total Returns | One Year | Five Years | Ten Years |
|---|
Class H | 50.70% | 7.52% | 7.68% |
|---|
S&P 500 Index | 17.80% | 12.06% | 14.16% |
|---|
S&P 500 Telecommunications Services Index | -2.79% | 1.34% | -0.17% |
|---|
|
| AssetsNet |
$ 5,315,350
|
| Holdings Count | Holding |
49
|
| Advisory Fees Paid, Amount |
$ 62,795
|
| InvestmentCompanyPortfolioTurnover |
333.00%
|
| Additional Fund Statistics [Text Block] |
Fund Statistics as of March 31, 2026 - Net Assets$5,315,350
- Total Number of Portfolio Holdings49
- Portfolio Turnover Rate333%
- Total Advisory Fees Paid$62,795
|
| Holdings [Text Block] |
Holdings DiversificationFootnote Reference1 (% of Net Assets) as of March 31, 2026 Table SummaryValue | Value |
|---|
Aerospace & Defense | 1.1% | Electronics | 1.5% | Computers | 5.2% | Internet | 5.4% | Media | 11.0% | Telecommunications | 75.3% | |
| Largest Holdings [Text Block] |
10 Largest HoldingsFootnote Reference2 (% of Net Assets) as of March 31, 2026 Table SummaryCisco Systems, Inc. | 7.7% |
|---|
AT&T, Inc. | 6.8% |
|---|
Verizon Communications, Inc. | 6.4% |
|---|
Arista Networks, Inc. | 5.1% |
|---|
Comcast Corp. — Class A | 4.6% |
|---|
T-Mobile US, Inc. | 4.5% |
|---|
Ciena Corp. | 4.4% |
|---|
Lumentum Holdings, Inc. | 4.3% |
|---|
Motorola Solutions, Inc. | 4.0% |
|---|
EchoStar Corp. — Class A | 3.5% |
|---|
Total | 51.3% |
|---|
|
| Material Fund Change [Text Block] |
|
| C000010586 |
|
| Shareholder Report [Line Items] |
|
| Fund Name |
Transportation Fund
|
| Class Name |
Investor Class
|
| Trading Symbol |
RYPIX
|
| Annual or Semi-Annual Statement [Text Block] |
This annual shareholder report contains important information about the Transportation Fund for the period from April 1, 2025 to March 31, 2026.
|
| Shareholder Report Annual or Semi-Annual |
Annual Shareholder Report
|
| Additional Information [Text Block] |
You can find additional information about the fund at GuggenheimInvestments.com/mutual-funds/literature. You can also request this information by contacting 800 820 0888 or services@guggenheiminvestments.com.
|
| Additional Information Phone Number |
800 820 0888
|
| Additional Information Email |
<span style="box-sizing: border-box; color: rgb(67, 67, 67); display: inline; flex-wrap: nowrap; font-size: 10.6667px; font-weight: 400; grid-area: auto; line-height: 12.8px; margin: 0px; overflow: visible; text-align: left; text-align-last: auto; white-space-collapse: preserve-breaks;">services@guggenheiminvestments.com</span>
|
| Additional Information Website |
<span style="box-sizing: border-box; color: rgb(67, 67, 67); display: inline; flex-wrap: nowrap; font-size: 10.6667px; font-weight: 400; grid-area: auto; line-height: 12.8px; margin: 0px; overflow: visible; text-align: left; text-align-last: auto; white-space-collapse: preserve-breaks;">GuggenheimInvestments.com/mutual-funds/literature</span>
|
| Expenses [Text Block] |
What were the Fund's costs for the last year? * Based on a hypothetical $10,000 investment Table SummaryClass | Costs of a $10,000 Investment | Costs Paid as a % of a $10,000 Investment |
|---|
Investor Class | $154 | 1.38% |
|---|
Table Summary* | Excludes expenses of the underlying funds in which the fund invests, if any. |
|---|
|
| Expenses Paid, Amount |
$ 154
|
| Factors Affecting Performance [Text Block] |
What factors materially affected the Fund's performance over the last year? The industries that contributed the most to performance were automobile manufacturers, passenger airlines, and automotive parts & equipment. Those that detracted the most were tires & rubber and motorcycle manufacturers. The holdings that contributed the most to performance were Tesla, Inc., General Motors Co., and Delta Air Lines, Inc. Those that detracted the most were Mobileye Global, Inc.—Class A, Luci Group, Inc., and Li Auto, Inc. Sponsored ADR—Class A. |
| Line Graph [Table Text Block] |
Table Summary | Transportation Fund (Investor Class) | S&P 500 Index | S&P 500 Industrials Index |
|---|
3/31/16 | $10,000 | $10,000 | $10,000 |
|---|
3/31/17 | $11,614 | $11,717 | $11,838 |
|---|
3/31/18 | $13,086 | $13,357 | $13,489 |
|---|
3/31/19 | $12,258 | $14,625 | $13,925 |
|---|
3/31/20 | $9,489 | $13,605 | $11,214 |
|---|
3/31/21 | $21,389 | $21,271 | $19,020 |
|---|
3/31/22 | $21,237 | $24,599 | $20,188 |
|---|
3/31/23 | $17,330 | $22,698 | $20,222 |
|---|
3/31/24 | $18,975 | $29,480 | $25,622 |
|---|
3/31/25 | $17,009 | $31,913 | $27,069 |
|---|
3/31/26 | $21,048 | $37,594 | $33,882 |
|---|
|
| Average Annual Return [Table Text Block] |
Table SummaryAverage Annual Total Returns | One Year | Five Years | Ten Years |
|---|
Investor Class | 23.74% | -0.32% | 7.73% |
|---|
S&P 500 Index | 17.80% | 12.06% | 14.16% |
|---|
S&P 500 Industrials Index | 25.17% | 12.24% | 12.98% |
|---|
|
| AssetsNet |
$ 5,346,556
|
| Holdings Count | Holding |
78
|
| Advisory Fees Paid, Amount |
$ 52,062
|
| InvestmentCompanyPortfolioTurnover |
372.00%
|
| Additional Fund Statistics [Text Block] |
Fund Statistics as of March 31, 2026 - Net Assets$5,346,556
- Total Number of Portfolio Holdings78
- Portfolio Turnover Rate372%
- Total Advisory Fees Paid$52,062
|
| Holdings [Text Block] |
Holdings DiversificationFootnote Reference1 (% of Net Assets) as of March 31, 2026 Table SummaryValue | Value |
|---|
Other | 1.4% | Commercial Services | 0.9% | Leisure Time | 1.2% | Internet | 6.2% | Airlines | 11.5% | Auto Parts & Equipment | 12.3% | Auto Manufacturers | 25.7% | Transportation | 40.0% | |
| Largest Holdings [Text Block] |
10 Largest HoldingsFootnote Reference2 (% of Net Assets) as of March 31, 2026 Table SummaryTesla, Inc. | 11.8% |
|---|
Uber Technologies, Inc. | 4.1% |
|---|
Union Pacific Corp. | 4.1% |
|---|
United Parcel Service, Inc. — Class B | 3.2% |
|---|
CSX Corp. | 3.1% |
|---|
FedEx Corp. | 3.0% |
|---|
General Motors Co. | 2.8% |
|---|
Norfolk Southern Corp. | 2.7% |
|---|
Delta Air Lines, Inc. | 2.4% |
|---|
Old Dominion Freight Line, Inc. | 2.3% |
|---|
Total | 39.5% |
|---|
|
| Material Fund Change [Text Block] |
|
| C000010588 |
|
| Shareholder Report [Line Items] |
|
| Fund Name |
Transportation Fund
|
| Class Name |
Class A
|
| Trading Symbol |
RYTSX
|
| Annual or Semi-Annual Statement [Text Block] |
This annual shareholder report contains important information about the Transportation Fund for the period from April 1, 2025 to March 31, 2026.
|
| Shareholder Report Annual or Semi-Annual |
Annual Shareholder Report
|
| Additional Information [Text Block] |
You can find additional information about the fund at GuggenheimInvestments.com/mutual-funds/literature. You can also request this information by contacting 800 820 0888 or services@guggenheiminvestments.com.
|
| Additional Information Phone Number |
800 820 0888
|
| Additional Information Email |
<span style="box-sizing: border-box; color: rgb(67, 67, 67); display: inline; flex-wrap: nowrap; font-size: 10.6667px; font-weight: 400; grid-area: auto; line-height: 12.8px; margin: 0px; overflow: visible; text-align: left; text-align-last: auto; white-space-collapse: preserve-breaks;">services@guggenheiminvestments.com</span>
|
| Additional Information Website |
<span style="box-sizing: border-box; color: rgb(67, 67, 67); display: inline; flex-wrap: nowrap; font-size: 10.6667px; font-weight: 400; grid-area: auto; line-height: 12.8px; margin: 0px; overflow: visible; text-align: left; text-align-last: auto; white-space-collapse: preserve-breaks;">GuggenheimInvestments.com/mutual-funds/literature</span>
|
| Expenses [Text Block] |
What were the Fund's costs for the last year? * Based on a hypothetical $10,000 investment Table SummaryClass | Costs of a $10,000 Investment | Costs Paid as a % of a $10,000 Investment |
|---|
Class A | $183 | 1.64% |
|---|
Table Summary* | Excludes expenses of the underlying funds in which the fund invests, if any. |
|---|
|
| Expenses Paid, Amount |
$ 183
|
| Factors Affecting Performance [Text Block] |
What factors materially affected the Fund's performance over the last year? The industries that contributed the most to performance were automobile manufacturers, passenger airlines, and automotive parts & equipment. Those that detracted the most were tires & rubber and motorcycle manufacturers. The holdings that contributed the most to performance were Tesla, Inc., General Motors Co., and Delta Air Lines, Inc. Those that detracted the most were Mobileye Global, Inc.—Class A, Luci Group, Inc., and Li Auto, Inc. Sponsored ADR—Class A. |
| Line Graph [Table Text Block] |
Table Summary | Transportation Fund (Class A)‡ | S&P 500 Index | S&P 500 Industrials Index |
|---|
3/31/16 | $9,525 | $10,000 | $10,000 |
|---|
3/31/17 | $11,036 | $11,717 | $11,838 |
|---|
3/31/18 | $12,403 | $13,357 | $13,489 |
|---|
3/31/19 | $11,588 | $14,625 | $13,925 |
|---|
3/31/20 | $8,948 | $13,605 | $11,214 |
|---|
3/31/21 | $20,116 | $21,271 | $19,020 |
|---|
3/31/22 | $19,925 | $24,599 | $20,188 |
|---|
3/31/23 | $16,219 | $22,698 | $20,222 |
|---|
3/31/24 | $17,716 | $29,480 | $25,622 |
|---|
3/31/25 | $15,839 | $31,913 | $27,069 |
|---|
3/31/26 | $19,551 | $37,594 | $33,882 |
|---|
|
| Average Annual Return [Table Text Block] |
Table SummaryAverage Annual Total Returns | One Year | Five Years | Ten Years |
|---|
Class A (without sales charge) | 23.43% | -0.57% | 7.46% |
|---|
Class A (with sales charge) ‡ | 17.57% | -1.53% | 6.93% |
|---|
S&P 500 Index | 17.80% | 12.06% | 14.16% |
|---|
S&P 500 Industrials Index | 25.17% | 12.24% | 12.98% |
|---|
|
| AssetsNet |
$ 5,346,556
|
| Holdings Count | Holding |
78
|
| Advisory Fees Paid, Amount |
$ 52,062
|
| InvestmentCompanyPortfolioTurnover |
372.00%
|
| Additional Fund Statistics [Text Block] |
Fund Statistics as of March 31, 2026 - Net Assets$5,346,556
- Total Number of Portfolio Holdings78
- Portfolio Turnover Rate372%
- Total Advisory Fees Paid$52,062
|
| Holdings [Text Block] |
Holdings DiversificationFootnote Reference1 (% of Net Assets) as of March 31, 2026 Table SummaryValue | Value |
|---|
Other | 1.4% | Commercial Services | 0.9% | Leisure Time | 1.2% | Internet | 6.2% | Airlines | 11.5% | Auto Parts & Equipment | 12.3% | Auto Manufacturers | 25.7% | Transportation | 40.0% | |
| Largest Holdings [Text Block] |
10 Largest HoldingsFootnote Reference2 (% of Net Assets) as of March 31, 2026 Table SummaryTesla, Inc. | 11.8% |
|---|
Uber Technologies, Inc. | 4.1% |
|---|
Union Pacific Corp. | 4.1% |
|---|
United Parcel Service, Inc. — Class B | 3.2% |
|---|
CSX Corp. | 3.1% |
|---|
FedEx Corp. | 3.0% |
|---|
General Motors Co. | 2.8% |
|---|
Norfolk Southern Corp. | 2.7% |
|---|
Delta Air Lines, Inc. | 2.4% |
|---|
Old Dominion Freight Line, Inc. | 2.3% |
|---|
Total | 39.5% |
|---|
|
| Material Fund Change [Text Block] |
|
| C000010589 |
|
| Shareholder Report [Line Items] |
|
| Fund Name |
Transportation Fund
|
| Class Name |
Class C
|
| Trading Symbol |
RYCNX
|
| Annual or Semi-Annual Statement [Text Block] |
This annual shareholder report contains important information about the Transportation Fund for the period from April 1, 2025 to March 31, 2026.
|
| Shareholder Report Annual or Semi-Annual |
Annual Shareholder Report
|
| Additional Information [Text Block] |
You can find additional information about the fund at GuggenheimInvestments.com/mutual-funds/literature. You can also request this information by contacting 800 820 0888 or services@guggenheiminvestments.com.
|
| Additional Information Phone Number |
800 820 0888
|
| Additional Information Email |
<span style="box-sizing: border-box; color: rgb(67, 67, 67); display: inline; flex-wrap: nowrap; font-size: 10.6667px; font-weight: 400; grid-area: auto; line-height: 12.8px; margin: 0px; overflow: visible; text-align: left; text-align-last: auto; white-space-collapse: preserve-breaks;">services@guggenheiminvestments.com</span>
|
| Additional Information Website |
<span style="box-sizing: border-box; color: rgb(67, 67, 67); display: inline; flex-wrap: nowrap; font-size: 10.6667px; font-weight: 400; grid-area: auto; line-height: 12.8px; margin: 0px; overflow: visible; text-align: left; text-align-last: auto; white-space-collapse: preserve-breaks;">GuggenheimInvestments.com/mutual-funds/literature</span>
|
| Expenses [Text Block] |
What were the Fund's costs for the last year? * Based on a hypothetical $10,000 investment Table SummaryClass | Costs of a $10,000 Investment | Costs Paid as a % of a $10,000 Investment |
|---|
Class C | $266 | 2.39% |
|---|
Table Summary* | Excludes expenses of the underlying funds in which the fund invests, if any. |
|---|
|
| Expenses Paid, Amount |
$ 266
|
| Factors Affecting Performance [Text Block] |
What factors materially affected the Fund's performance over the last year? The industries that contributed the most to performance were automobile manufacturers, passenger airlines, and automotive parts & equipment. Those that detracted the most were tires & rubber and motorcycle manufacturers. The holdings that contributed the most to performance were Tesla, Inc., General Motors Co., and Delta Air Lines, Inc. Those that detracted the most were Mobileye Global, Inc.—Class A, Luci Group, Inc., and Li Auto, Inc. Sponsored ADR—Class A. |
| Line Graph [Table Text Block] |
Table Summary | Transportation Fund (Class C) | S&P 500 Index | S&P 500 Industrials Index |
|---|
3/31/16 | $10,000 | $10,000 | $10,000 |
|---|
3/31/17 | $11,500 | $11,717 | $11,838 |
|---|
3/31/18 | $12,829 | $13,357 | $13,489 |
|---|
3/31/19 | $11,896 | $14,625 | $13,925 |
|---|
3/31/20 | $9,115 | $13,605 | $11,214 |
|---|
3/31/21 | $20,344 | $21,271 | $19,020 |
|---|
3/31/22 | $20,002 | $24,599 | $20,188 |
|---|
3/31/23 | $16,159 | $22,698 | $20,222 |
|---|
3/31/24 | $17,515 | $29,480 | $25,622 |
|---|
3/31/25 | $15,546 | $31,913 | $27,069 |
|---|
3/31/26 | $19,046 | $37,594 | $33,882 |
|---|
|
| Average Annual Return [Table Text Block] |
Table SummaryAverage Annual Total Returns | One Year | Five Years | Ten Years |
|---|
Class C (without CDSC) | 22.51% | -1.31% | 6.66% |
|---|
Class C (with CDSC) ‡ | 21.51% | -1.31% | 6.66% |
|---|
S&P 500 Index | 17.80% | 12.06% | 14.16% |
|---|
S&P 500 Industrials Index | 25.17% | 12.24% | 12.98% |
|---|
|
| AssetsNet |
$ 5,346,556
|
| Holdings Count | Holding |
78
|
| Advisory Fees Paid, Amount |
$ 52,062
|
| InvestmentCompanyPortfolioTurnover |
372.00%
|
| Additional Fund Statistics [Text Block] |
Fund Statistics as of March 31, 2026 - Net Assets$5,346,556
- Total Number of Portfolio Holdings78
- Portfolio Turnover Rate372%
- Total Advisory Fees Paid$52,062
|
| Holdings [Text Block] |
Holdings DiversificationFootnote Reference1 (% of Net Assets) as of March 31, 2026 Table SummaryValue | Value |
|---|
Other | 1.4% | Commercial Services | 0.9% | Leisure Time | 1.2% | Internet | 6.2% | Airlines | 11.5% | Auto Parts & Equipment | 12.3% | Auto Manufacturers | 25.7% | Transportation | 40.0% | |
| Largest Holdings [Text Block] |
10 Largest HoldingsFootnote Reference2 (% of Net Assets) as of March 31, 2026 Table SummaryTesla, Inc. | 11.8% |
|---|
Uber Technologies, Inc. | 4.1% |
|---|
Union Pacific Corp. | 4.1% |
|---|
United Parcel Service, Inc. — Class B | 3.2% |
|---|
CSX Corp. | 3.1% |
|---|
FedEx Corp. | 3.0% |
|---|
General Motors Co. | 2.8% |
|---|
Norfolk Southern Corp. | 2.7% |
|---|
Delta Air Lines, Inc. | 2.4% |
|---|
Old Dominion Freight Line, Inc. | 2.3% |
|---|
Total | 39.5% |
|---|
|
| Material Fund Change [Text Block] |
|
| C000010587 |
|
| Shareholder Report [Line Items] |
|
| Fund Name |
Transportation Fund
|
| Class Name |
Class H
|
| Trading Symbol |
RYPAX
|
| Annual or Semi-Annual Statement [Text Block] |
This annual shareholder report contains important information about the Transportation Fund for the period from April 1, 2025 to March 31, 2026.
|
| Shareholder Report Annual or Semi-Annual |
Annual Shareholder Report
|
| Additional Information [Text Block] |
You can find additional information about the fund at GuggenheimInvestments.com/mutual-funds/literature. You can also request this information by contacting 800 820 0888 or services@guggenheiminvestments.com.
|
| Additional Information Phone Number |
800 820 0888
|
| Additional Information Email |
<span style="box-sizing: border-box; color: rgb(67, 67, 67); display: inline; flex-wrap: nowrap; font-size: 10.6667px; font-weight: 400; grid-area: auto; line-height: 12.8px; margin: 0px; overflow: visible; text-align: left; text-align-last: auto; white-space-collapse: preserve-breaks;">services@guggenheiminvestments.com</span>
|
| Additional Information Website |
<span style="box-sizing: border-box; color: rgb(67, 67, 67); display: inline; flex-wrap: nowrap; font-size: 10.6667px; font-weight: 400; grid-area: auto; line-height: 12.8px; margin: 0px; overflow: visible; text-align: left; text-align-last: auto; white-space-collapse: preserve-breaks;">GuggenheimInvestments.com/mutual-funds/literature</span>
|
| Expenses [Text Block] |
What were the Fund's costs for the last year? * Based on a hypothetical $10,000 investment Table SummaryClass | Costs of a $10,000 Investment | Costs Paid as a % of a $10,000 Investment |
|---|
Class H | $182 | 1.63% |
|---|
Table Summary* | Excludes expenses of the underlying funds in which the fund invests, if any. |
|---|
|
| Expenses Paid, Amount |
$ 182
|
| Factors Affecting Performance [Text Block] |
What factors materially affected the Fund's performance over the last year? The industries that contributed the most to performance were automobile manufacturers, passenger airlines, and automotive parts & equipment. Those that detracted the most were tires & rubber and motorcycle manufacturers. The holdings that contributed the most to performance were Tesla, Inc., General Motors Co., and Delta Air Lines, Inc. Those that detracted the most were Mobileye Global, Inc.—Class A, Luci Group, Inc., and Li Auto, Inc. Sponsored ADR—Class A. |
| Line Graph [Table Text Block] |
Table Summary | Transportation Fund (Class H) | S&P 500 Index | S&P 500 Industrials Index |
|---|
3/31/16 | $10,000 | $10,000 | $10,000 |
|---|
3/31/17 | $11,588 | $11,717 | $11,838 |
|---|
3/31/18 | $13,017 | $13,357 | $13,489 |
|---|
3/31/19 | $12,157 | $14,625 | $13,925 |
|---|
3/31/20 | $9,387 | $13,605 | $11,214 |
|---|
3/31/21 | $21,109 | $21,271 | $19,020 |
|---|
3/31/22 | $20,910 | $24,599 | $20,188 |
|---|
3/31/23 | $17,020 | $22,698 | $20,222 |
|---|
3/31/24 | $18,593 | $29,480 | $25,622 |
|---|
3/31/25 | $16,623 | $31,913 | $27,069 |
|---|
3/31/26 | $20,519 | $37,594 | $33,882 |
|---|
|
| Average Annual Return [Table Text Block] |
Table SummaryAverage Annual Total Returns | One Year | Five Years | Ten Years |
|---|
Class H | 23.44% | -0.57% | 7.45% |
|---|
S&P 500 Index | 17.80% | 12.06% | 14.16% |
|---|
S&P 500 Industrials Index | 25.17% | 12.24% | 12.98% |
|---|
|
| AssetsNet |
$ 5,346,556
|
| Holdings Count | Holding |
78
|
| Advisory Fees Paid, Amount |
$ 52,062
|
| InvestmentCompanyPortfolioTurnover |
372.00%
|
| Additional Fund Statistics [Text Block] |
Fund Statistics as of March 31, 2026 - Net Assets$5,346,556
- Total Number of Portfolio Holdings78
- Portfolio Turnover Rate372%
- Total Advisory Fees Paid$52,062
|
| Holdings [Text Block] |
Holdings DiversificationFootnote Reference1 (% of Net Assets) as of March 31, 2026 Table SummaryValue | Value |
|---|
Other | 1.4% | Commercial Services | 0.9% | Leisure Time | 1.2% | Internet | 6.2% | Airlines | 11.5% | Auto Parts & Equipment | 12.3% | Auto Manufacturers | 25.7% | Transportation | 40.0% | |
| Largest Holdings [Text Block] |
10 Largest HoldingsFootnote Reference2 (% of Net Assets) as of March 31, 2026 Table SummaryTesla, Inc. | 11.8% |
|---|
Uber Technologies, Inc. | 4.1% |
|---|
Union Pacific Corp. | 4.1% |
|---|
United Parcel Service, Inc. — Class B | 3.2% |
|---|
CSX Corp. | 3.1% |
|---|
FedEx Corp. | 3.0% |
|---|
General Motors Co. | 2.8% |
|---|
Norfolk Southern Corp. | 2.7% |
|---|
Delta Air Lines, Inc. | 2.4% |
|---|
Old Dominion Freight Line, Inc. | 2.3% |
|---|
Total | 39.5% |
|---|
|
| Material Fund Change [Text Block] |
|
| C000010606 |
|
| Shareholder Report [Line Items] |
|
| Fund Name |
Utilities Fund
|
| Class Name |
Investor Class
|
| Trading Symbol |
RYUIX
|
| Annual or Semi-Annual Statement [Text Block] |
This annual shareholder report contains important information about the Utilities Fund for the period from April 1, 2025 to March 31, 2026.
|
| Shareholder Report Annual or Semi-Annual |
Annual Shareholder Report
|
| Additional Information [Text Block] |
You can find additional information about the fund at GuggenheimInvestments.com/mutual-funds/literature. You can also request this information by contacting 800 820 0888 or services@guggenheiminvestments.com.
|
| Additional Information Phone Number |
800 820 0888
|
| Additional Information Email |
<span style="box-sizing: border-box; color: rgb(67, 67, 67); display: inline; flex-wrap: nowrap; font-size: 10.6667px; font-weight: 400; grid-area: auto; line-height: 12.8px; margin: 0px; overflow: visible; text-align: left; text-align-last: auto; white-space-collapse: preserve-breaks;">services@guggenheiminvestments.com</span>
|
| Additional Information Website |
<span style="box-sizing: border-box; color: rgb(67, 67, 67); display: inline; flex-wrap: nowrap; font-size: 10.6667px; font-weight: 400; grid-area: auto; line-height: 12.8px; margin: 0px; overflow: visible; text-align: left; text-align-last: auto; white-space-collapse: preserve-breaks;">GuggenheimInvestments.com/mutual-funds/literature</span>
|
| Expenses [Text Block] |
What were the Fund's costs for the last year? * Based on a hypothetical $10,000 investment Table SummaryClass | Costs of a $10,000 Investment | Costs Paid as a % of a $10,000 Investment |
|---|
Investor Class | $151 | 1.37% |
|---|
Table Summary* | Excludes expenses of the underlying funds in which the fund invests, if any. |
|---|
|
| Expenses Paid, Amount |
$ 151
|
| Factors Affecting Performance [Text Block] |
What factors materially affected the Fund's performance over the last year? The industries that contributed the most to performance were electric utilities, multi-utilities, and independent power producers & energy traders. The industry that detracted the most was water utilities. The holdings that contributed the most to performance were Constellation Energy Corp., NextEra Energy, Inc. and NRG Energy, Inc. Those that detracted the most were American Water Works Co., Inc., Sunnova Energy International, Inc., and MGE Energy, Inc. |
| Line Graph [Table Text Block] |
Table Summary | Utilities Fund (Investor Class) | S&P 500 Index | S&P 500 Utilities Index |
|---|
3/31/16 | $10,000 | $10,000 | $10,000 |
|---|
3/31/17 | $10,804 | $11,717 | $10,706 |
|---|
3/31/18 | $10,990 | $13,357 | $10,909 |
|---|
3/31/19 | $13,017 | $14,625 | $13,018 |
|---|
3/31/20 | $11,880 | $13,605 | $12,835 |
|---|
3/31/21 | $13,920 | $21,271 | $15,328 |
|---|
3/31/22 | $16,221 | $24,599 | $18,383 |
|---|
3/31/23 | $15,273 | $22,698 | $17,242 |
|---|
3/31/24 | $15,252 | $29,480 | $17,314 |
|---|
3/31/25 | $18,568 | $31,913 | $21,447 |
|---|
3/31/26 | $22,306 | $37,594 | $25,676 |
|---|
|
| Average Annual Return [Table Text Block] |
Table SummaryAverage Annual Total Returns | One Year | Five Years | Ten Years |
|---|
Investor Class | 20.13% | 9.89% | 8.35% |
|---|
S&P 500 Index | 17.80% | 12.06% | 14.16% |
|---|
S&P 500 Utilities Index | 19.78% | 10.88% | 9.89% |
|---|
|
| AssetsNet |
$ 30,117,173
|
| Holdings Count | Holding |
53
|
| Advisory Fees Paid, Amount |
$ 189,351
|
| InvestmentCompanyPortfolioTurnover |
346.00%
|
| Additional Fund Statistics [Text Block] |
Fund Statistics as of March 31, 2026 - Net Assets$30,117,173
- Total Number of Portfolio Holdings53
- Portfolio Turnover Rate346%
- Total Advisory Fees Paid$189,351
|
| Holdings [Text Block] |
Holdings DiversificationFootnote Reference1 (% of Net Assets) as of March 31, 2026 Table SummaryValue | Value |
|---|
Water | 4.0% | Gas | 7.1% | Electric | 88.3% | |
| Largest Holdings [Text Block] |
10 Largest HoldingsFootnote Reference2 (% of Net Assets) as of March 31, 2026 Table SummaryNextEra Energy, Inc. | 5.6% |
|---|
Southern Co. | 4.1% |
|---|
Duke Energy Corp. | 4.0% |
|---|
Constellation Energy Corp. | 3.6% |
|---|
American Electric Power Company, Inc. | 3.3% |
|---|
Sempra | 3.2% |
|---|
Entergy Corp. | 2.9% |
|---|
Dominion Energy, Inc. | 2.9% |
|---|
Exelon Corp. | 2.8% |
|---|
Xcel Energy, Inc. | 2.8% |
|---|
Total | 35.2% |
|---|
|
| Material Fund Change [Text Block] |
|
| C000010608 |
|
| Shareholder Report [Line Items] |
|
| Fund Name |
Utilities Fund
|
| Class Name |
Class A
|
| Trading Symbol |
RYUTX
|
| Annual or Semi-Annual Statement [Text Block] |
This annual shareholder report contains important information about the Utilities Fund for the period from April 1, 2025 to March 31, 2026.
|
| Shareholder Report Annual or Semi-Annual |
Annual Shareholder Report
|
| Additional Information [Text Block] |
You can find additional information about the fund at GuggenheimInvestments.com/mutual-funds/literature. You can also request this information by contacting 800 820 0888 or services@guggenheiminvestments.com.
|
| Additional Information Phone Number |
800 820 0888
|
| Additional Information Email |
<span style="box-sizing: border-box; color: rgb(67, 67, 67); display: inline; flex-wrap: nowrap; font-size: 10.6667px; font-weight: 400; grid-area: auto; line-height: 12.8px; margin: 0px; overflow: visible; text-align: left; text-align-last: auto; white-space-collapse: preserve-breaks;">services@guggenheiminvestments.com</span>
|
| Additional Information Website |
<span style="box-sizing: border-box; color: rgb(67, 67, 67); display: inline; flex-wrap: nowrap; font-size: 10.6667px; font-weight: 400; grid-area: auto; line-height: 12.8px; margin: 0px; overflow: visible; text-align: left; text-align-last: auto; white-space-collapse: preserve-breaks;">GuggenheimInvestments.com/mutual-funds/literature</span>
|
| Expenses [Text Block] |
What were the Fund's costs for the last year? * Based on a hypothetical $10,000 investment Table SummaryClass | Costs of a $10,000 Investment | Costs Paid as a % of a $10,000 Investment |
|---|
Class A | $179 | 1.63% |
|---|
Table Summary* | Excludes expenses of the underlying funds in which the fund invests, if any. |
|---|
|
| Expenses Paid, Amount |
$ 179
|
| Factors Affecting Performance [Text Block] |
What factors materially affected the Fund's performance over the last year? The industries that contributed the most to performance were electric utilities, multi-utilities, and independent power producers & energy traders. The industry that detracted the most was water utilities. The holdings that contributed the most to performance were Constellation Energy Corp., NextEra Energy, Inc. and NRG Energy, Inc. Those that detracted the most were American Water Works Co., Inc., Sunnova Energy International, Inc., and MGE Energy, Inc. |
| Line Graph [Table Text Block] |
Table Summary | Utilities Fund (Class A)‡ | S&P 500 Index | S&P 500 Utilities Index |
|---|
3/31/16 | $9,525 | $10,000 | $10,000 |
|---|
3/31/17 | $10,263 | $11,717 | $10,706 |
|---|
3/31/18 | $10,411 | $13,357 | $10,909 |
|---|
3/31/19 | $12,302 | $14,625 | $13,018 |
|---|
3/31/20 | $11,199 | $13,605 | $12,835 |
|---|
3/31/21 | $13,093 | $21,271 | $15,328 |
|---|
3/31/22 | $15,219 | $24,599 | $18,383 |
|---|
3/31/23 | $14,292 | $22,698 | $17,242 |
|---|
3/31/24 | $14,235 | $29,480 | $17,314 |
|---|
3/31/25 | $17,288 | $31,913 | $21,447 |
|---|
3/31/26 | $20,712 | $37,594 | $25,676 |
|---|
|
| Average Annual Return [Table Text Block] |
Table SummaryAverage Annual Total Returns | One Year | Five Years | Ten Years |
|---|
Class A (without sales charge) | 19.81% | 9.61% | 8.08% |
|---|
Class A (with sales charge) ‡ | 14.11% | 8.54% | 7.55% |
|---|
S&P 500 Index | 17.80% | 12.06% | 14.16% |
|---|
S&P 500 Utilities Index | 19.78% | 10.88% | 9.89% |
|---|
|
| AssetsNet |
$ 30,117,173
|
| Holdings Count | Holding |
53
|
| Advisory Fees Paid, Amount |
$ 189,351
|
| InvestmentCompanyPortfolioTurnover |
346.00%
|
| Additional Fund Statistics [Text Block] |
Fund Statistics as of March 31, 2026 - Net Assets$30,117,173
- Total Number of Portfolio Holdings53
- Portfolio Turnover Rate346%
- Total Advisory Fees Paid$189,351
|
| Holdings [Text Block] |
Holdings DiversificationFootnote Reference1 (% of Net Assets) as of March 31, 2026 Table SummaryValue | Value |
|---|
Water | 4.0% | Gas | 7.1% | Electric | 88.3% | |
| Largest Holdings [Text Block] |
10 Largest HoldingsFootnote Reference2 (% of Net Assets) as of March 31, 2026 Table SummaryNextEra Energy, Inc. | 5.6% |
|---|
Southern Co. | 4.1% |
|---|
Duke Energy Corp. | 4.0% |
|---|
Constellation Energy Corp. | 3.6% |
|---|
American Electric Power Company, Inc. | 3.3% |
|---|
Sempra | 3.2% |
|---|
Entergy Corp. | 2.9% |
|---|
Dominion Energy, Inc. | 2.9% |
|---|
Exelon Corp. | 2.8% |
|---|
Xcel Energy, Inc. | 2.8% |
|---|
Total | 35.2% |
|---|
|
| Material Fund Change [Text Block] |
|
| C000010609 |
|
| Shareholder Report [Line Items] |
|
| Fund Name |
Utilities Fund
|
| Class Name |
Class C
|
| Trading Symbol |
RYCUX
|
| Annual or Semi-Annual Statement [Text Block] |
This annual shareholder report contains important information about the Utilities Fund for the period from April 1, 2025 to March 31, 2026.
|
| Shareholder Report Annual or Semi-Annual |
Annual Shareholder Report
|
| Additional Information [Text Block] |
You can find additional information about the fund at GuggenheimInvestments.com/mutual-funds/literature. You can also request this information by contacting 800 820 0888 or services@guggenheiminvestments.com.
|
| Additional Information Phone Number |
800 820 0888
|
| Additional Information Email |
<span style="box-sizing: border-box; color: rgb(67, 67, 67); display: inline; flex-wrap: nowrap; font-size: 10.6667px; font-weight: 400; grid-area: auto; line-height: 12.8px; margin: 0px; overflow: visible; text-align: left; text-align-last: auto; white-space-collapse: preserve-breaks;">services@guggenheiminvestments.com</span>
|
| Additional Information Website |
<span style="box-sizing: border-box; color: rgb(67, 67, 67); display: inline; flex-wrap: nowrap; font-size: 10.6667px; font-weight: 400; grid-area: auto; line-height: 12.8px; margin: 0px; overflow: visible; text-align: left; text-align-last: auto; white-space-collapse: preserve-breaks;">GuggenheimInvestments.com/mutual-funds/literature</span>
|
| Expenses [Text Block] |
What were the Fund's costs for the last year? * Based on a hypothetical $10,000 investment Table SummaryClass | Costs of a $10,000 Investment | Costs Paid as a % of a $10,000 Investment |
|---|
Class C | $261 | 2.38% |
|---|
Table Summary* | Excludes expenses of the underlying funds in which the fund invests, if any. |
|---|
|
| Expenses Paid, Amount |
$ 261
|
| Factors Affecting Performance [Text Block] |
What factors materially affected the Fund's performance over the last year? The industries that contributed the most to performance were electric utilities, multi-utilities, and independent power producers & energy traders. The industry that detracted the most was water utilities. The holdings that contributed the most to performance were Constellation Energy Corp., NextEra Energy, Inc. and NRG Energy, Inc. Those that detracted the most were American Water Works Co., Inc., Sunnova Energy International, Inc., and MGE Energy, Inc. |
| Line Graph [Table Text Block] |
Table Summary | Utilities Fund (Class C) | S&P 500 Index | S&P 500 Utilities Index |
|---|
3/31/16 | $10,000 | $10,000 | $10,000 |
|---|
3/31/17 | $10,697 | $11,717 | $10,706 |
|---|
3/31/18 | $10,771 | $13,357 | $10,909 |
|---|
3/31/19 | $12,633 | $14,625 | $13,018 |
|---|
3/31/20 | $11,413 | $13,605 | $12,835 |
|---|
3/31/21 | $13,241 | $21,271 | $15,328 |
|---|
3/31/22 | $15,276 | $24,599 | $18,383 |
|---|
3/31/23 | $14,239 | $22,698 | $17,242 |
|---|
3/31/24 | $14,078 | $29,480 | $17,314 |
|---|
3/31/25 | $16,965 | $31,913 | $21,447 |
|---|
3/31/26 | $20,180 | $37,594 | $25,676 |
|---|
|
| Average Annual Return [Table Text Block] |
Table SummaryAverage Annual Total Returns | One Year | Five Years | Ten Years |
|---|
Class C (without CDSC) | 18.95% | 8.79% | 7.27% |
|---|
Class C (with CDSC) ‡ | 17.95% | 8.79% | 7.27% |
|---|
S&P 500 Index | 17.80% | 12.06% | 14.16% |
|---|
S&P 500 Utilities Index | 19.78% | 10.88% | 9.89% |
|---|
|
| AssetsNet |
$ 30,117,173
|
| Holdings Count | Holding |
53
|
| Advisory Fees Paid, Amount |
$ 189,351
|
| InvestmentCompanyPortfolioTurnover |
346.00%
|
| Additional Fund Statistics [Text Block] |
Fund Statistics as of March 31, 2026 - Net Assets$30,117,173
- Total Number of Portfolio Holdings53
- Portfolio Turnover Rate346%
- Total Advisory Fees Paid$189,351
|
| Holdings [Text Block] |
Holdings DiversificationFootnote Reference1 (% of Net Assets) as of March 31, 2026 Table SummaryValue | Value |
|---|
Water | 4.0% | Gas | 7.1% | Electric | 88.3% | |
| Largest Holdings [Text Block] |
10 Largest HoldingsFootnote Reference2 (% of Net Assets) as of March 31, 2026 Table SummaryNextEra Energy, Inc. | 5.6% |
|---|
Southern Co. | 4.1% |
|---|
Duke Energy Corp. | 4.0% |
|---|
Constellation Energy Corp. | 3.6% |
|---|
American Electric Power Company, Inc. | 3.3% |
|---|
Sempra | 3.2% |
|---|
Entergy Corp. | 2.9% |
|---|
Dominion Energy, Inc. | 2.9% |
|---|
Exelon Corp. | 2.8% |
|---|
Xcel Energy, Inc. | 2.8% |
|---|
Total | 35.2% |
|---|
|
| Material Fund Change [Text Block] |
|
| C000010607 |
|
| Shareholder Report [Line Items] |
|
| Fund Name |
Utilities Fund
|
| Class Name |
Class H
|
| Trading Symbol |
RYAUX
|
| Annual or Semi-Annual Statement [Text Block] |
This annual shareholder report contains important information about the Utilities Fund for the period from April 1, 2025 to March 31, 2026.
|
| Shareholder Report Annual or Semi-Annual |
Annual Shareholder Report
|
| Additional Information [Text Block] |
You can find additional information about the fund at GuggenheimInvestments.com/mutual-funds/literature. You can also request this information by contacting 800 820 0888 or services@guggenheiminvestments.com.
|
| Additional Information Phone Number |
800 820 0888
|
| Additional Information Email |
<span style="box-sizing: border-box; color: rgb(67, 67, 67); display: inline; flex-wrap: nowrap; font-size: 10.6667px; font-weight: 400; grid-area: auto; line-height: 12.8px; margin: 0px; overflow: visible; text-align: left; text-align-last: auto; white-space-collapse: preserve-breaks;">services@guggenheiminvestments.com</span>
|
| Additional Information Website |
<span style="box-sizing: border-box; color: rgb(67, 67, 67); display: inline; flex-wrap: nowrap; font-size: 10.6667px; font-weight: 400; grid-area: auto; line-height: 12.8px; margin: 0px; overflow: visible; text-align: left; text-align-last: auto; white-space-collapse: preserve-breaks;">GuggenheimInvestments.com/mutual-funds/literature</span>
|
| Expenses [Text Block] |
What were the Fund's costs for the last year? * Based on a hypothetical $10,000 investment Table SummaryClass | Costs of a $10,000 Investment | Costs Paid as a % of a $10,000 Investment |
|---|
Class H | $179 | 1.63% |
|---|
Table Summary* | Excludes expenses of the underlying funds in which the fund invests, if any. |
|---|
|
| Expenses Paid, Amount |
$ 179
|
| Factors Affecting Performance [Text Block] |
What factors materially affected the Fund's performance over the last year? The industries that contributed the most to performance were electric utilities, multi-utilities, and independent power producers & energy traders. The industry that detracted the most was water utilities. The holdings that contributed the most to performance were Constellation Energy Corp., NextEra Energy, Inc. and NRG Energy, Inc. Those that detracted the most were American Water Works Co., Inc., Sunnova Energy International, Inc., and MGE Energy, Inc. |
| Line Graph [Table Text Block] |
Table Summary | Utilities Fund (Class H) | S&P 500 Index | S&P 500 Utilities Index |
|---|
3/31/16 | $10,000 | $10,000 | $10,000 |
|---|
3/31/17 | $10,780 | $11,717 | $10,706 |
|---|
3/31/18 | $10,936 | $13,357 | $10,909 |
|---|
3/31/19 | $12,919 | $14,625 | $13,018 |
|---|
3/31/20 | $11,760 | $13,605 | $12,835 |
|---|
3/31/21 | $13,750 | $21,271 | $15,328 |
|---|
3/31/22 | $15,981 | $24,599 | $18,383 |
|---|
3/31/23 | $15,007 | $22,698 | $17,242 |
|---|
3/31/24 | $14,949 | $29,480 | $17,314 |
|---|
3/31/25 | $18,151 | $31,913 | $21,447 |
|---|
3/31/26 | $21,752 | $37,594 | $25,676 |
|---|
|
| Average Annual Return [Table Text Block] |
Table SummaryAverage Annual Total Returns | One Year | Five Years | Ten Years |
|---|
Class H | 19.84% | 9.61% | 8.08% |
|---|
S&P 500 Index | 17.80% | 12.06% | 14.16% |
|---|
S&P 500 Utilities Index | 19.78% | 10.88% | 9.89% |
|---|
|
| AssetsNet |
$ 30,117,173
|
| Holdings Count | Holding |
53
|
| Advisory Fees Paid, Amount |
$ 189,351
|
| InvestmentCompanyPortfolioTurnover |
346.00%
|
| Additional Fund Statistics [Text Block] |
Fund Statistics as of March 31, 2026 - Net Assets$30,117,173
- Total Number of Portfolio Holdings53
- Portfolio Turnover Rate346%
- Total Advisory Fees Paid$189,351
|
| Holdings [Text Block] |
Holdings DiversificationFootnote Reference1 (% of Net Assets) as of March 31, 2026 Table SummaryValue | Value |
|---|
Water | 4.0% | Gas | 7.1% | Electric | 88.3% | |
| Largest Holdings [Text Block] |
10 Largest HoldingsFootnote Reference2 (% of Net Assets) as of March 31, 2026 Table SummaryNextEra Energy, Inc. | 5.6% |
|---|
Southern Co. | 4.1% |
|---|
Duke Energy Corp. | 4.0% |
|---|
Constellation Energy Corp. | 3.6% |
|---|
American Electric Power Company, Inc. | 3.3% |
|---|
Sempra | 3.2% |
|---|
Entergy Corp. | 2.9% |
|---|
Dominion Energy, Inc. | 2.9% |
|---|
Exelon Corp. | 2.8% |
|---|
Xcel Energy, Inc. | 2.8% |
|---|
Total | 35.2% |
|---|
|
| Material Fund Change [Text Block] |
|
| C000162317 |
|
| Shareholder Report [Line Items] |
|
| Fund Name |
Dow Jones Industrial Average<sup style="inset: 1.5px 0px 4px; box-sizing: border-box; color: rgb(83, 40, 79); display: inline; flex-wrap: nowrap; font-size: 20px; font-weight: 700; grid-area: auto; line-height: 0px; margin: 0px; overflow: visible; position: relative; text-align: left; text-align-last: auto; white-space-collapse: preserve-breaks;">®</sup> Fund
|
| Class Name |
Class A
|
| Trading Symbol |
RYDAX
|
| Annual or Semi-Annual Statement [Text Block] |
This annual shareholder report contains important information about the Dow Jones Industrial Average® Fund for the period from April 1, 2025 to March 31, 2026.
|
| Shareholder Report Annual or Semi-Annual |
Annual Shareholder Report
|
| Additional Information [Text Block] |
You can find additional information about the fund at GuggenheimInvestments.com/mutual-funds/literature. You can also request this information by contacting 800 820 0888 or services@guggenheiminvestments.com.
|
| Additional Information Phone Number |
800 820 0888
|
| Additional Information Email |
<span style="box-sizing: border-box; color: rgb(67, 67, 67); display: inline; flex-wrap: nowrap; font-size: 10.6667px; font-weight: 400; grid-area: auto; line-height: 12.8px; margin: 0px; overflow: visible; text-align: left; text-align-last: auto; white-space-collapse: preserve-breaks;">services@guggenheiminvestments.com</span>
|
| Additional Information Website |
<span style="box-sizing: border-box; color: rgb(67, 67, 67); display: inline; flex-wrap: nowrap; font-size: 10.6667px; font-weight: 400; grid-area: auto; line-height: 12.8px; margin: 0px; overflow: visible; text-align: left; text-align-last: auto; white-space-collapse: preserve-breaks;">GuggenheimInvestments.com/mutual-funds/literature</span>
|
| Expenses [Text Block] |
What were the Fund's costs for the last year? * Based on a hypothetical $10,000 investment Table SummaryClass | Costs of a $10,000 Investment | Costs Paid as a % of a $10,000 Investment |
|---|
Class A | $166 | 1.58% |
|---|
Table Summary* | Excludes expenses of the underlying funds in which the fund invests, if any. |
|---|
|
| Expenses Paid, Amount |
$ 166
|
| Factors Affecting Performance [Text Block] |
What factors materially affected the Fund's performance over the last year? The sectors that contributed the most to the return of the underlying index were financials, industrials, and information technology. Those that detracted the most were health care, materials, and consumer discretionary. The holdings that contributed the most to return of the underlying index were Caterpillar, Inc., Goldman Sachs Group, Inc., and Nvidia Corp. Those that detracted the most were UnitedHealth Group, Inc., Salesforce, Inc., and Visa, Inc.—Class A. The fund maintained a daily correlation of over 99% to its benchmark of 100% of the daily price movement of the Dow Jones Industrial Average. |
| Line Graph [Table Text Block] |
Table Summary | Dow Jones Industrial Average® Fund (Class A)‡ | S&P 500 Index | Dow Jones Industrial Average |
|---|
3/31/16 | $9,525 | $10,000 | $10,000 |
|---|
3/31/17 | $11,249 | $11,717 | $11,991 |
|---|
3/31/18 | $13,224 | $13,357 | $14,316 |
|---|
3/31/19 | $14,302 | $14,625 | $15,760 |
|---|
3/31/20 | $12,102 | $13,605 | $13,651 |
|---|
3/31/21 | $18,348 | $21,271 | $20,992 |
|---|
3/31/22 | $19,308 | $24,599 | $22,484 |
|---|
3/31/23 | $18,555 | $22,698 | $22,039 |
|---|
3/31/24 | $22,306 | $29,480 | $26,927 |
|---|
3/31/25 | $23,561 | $31,913 | $28,919 |
|---|
3/31/26 | $25,999 | $37,594 | $32,455 |
|---|
|
| Average Annual Return [Table Text Block] |
Table SummaryAverage Annual Total Returns | One Year | Five Years | Ten Years |
|---|
Class A (without sales charge) | 10.35% | 7.22% | 10.56% |
|---|
Class A (with sales charge) ‡ | 5.12% | 6.18% | 10.03% |
|---|
S&P 500 Index | 17.80% | 12.06% | 14.16% |
|---|
Dow Jones Industrial Average | 12.23% | 9.11% | 12.49% |
|---|
|
| AssetsNet |
$ 19,647,863
|
| Holdings Count | Holding |
38
|
| Advisory Fees Paid, Amount |
$ 146,638
|
| InvestmentCompanyPortfolioTurnover |
145.00%
|
| Additional Fund Statistics [Text Block] |
Fund Statistics as of March 31, 2026 - Net Assets$19,647,863
- Total Number of Portfolio Holdings38
- Portfolio Turnover Rate145%
- Total Advisory Fees Paid$146,638
|
| Holdings [Text Block] |
Holdings DiversificationFootnote Reference1 (% of Net Assets) as of March 31, 2026 Table SummaryValue | Value |
|---|
Other | 7.5% | Communications | 5.2% | OTC Equity Index Swap Agreements | 9.0% | Consumer, Cyclical | 9.7% | Consumer, Non-cyclical | 14.4% | Technology | 14.6% | Industrial | 15.3% | Financial | 24.3% | |
| Largest Holdings [Text Block] |
10 Largest HoldingsFootnote Reference2 (% of Net Assets) as of March 31, 2026 Table SummaryGoldman Sachs Group, Inc. | 10.1% |
|---|
Caterpillar, Inc. | 8.5% |
|---|
Microsoft Corp. | 4.4% |
|---|
Amgen, Inc. | 4.2% |
|---|
Home Depot, Inc. | 3.9% |
|---|
Sherwin-Williams Co. | 3.8% |
|---|
McDonald's Corp. | 3.7% |
|---|
American Express Co. | 3.6% |
|---|
Visa, Inc. — Class A | 3.6% |
|---|
JPMorgan Chase & Co. | 3.5% |
|---|
Total | 49.3% |
|---|
|
| Material Fund Change [Text Block] |
|
| C000162318 |
|
| Shareholder Report [Line Items] |
|
| Fund Name |
Dow Jones Industrial Average<sup style="inset: 1.5px 0px 4px; box-sizing: border-box; color: rgb(83, 40, 79); display: inline; flex-wrap: nowrap; font-size: 20px; font-weight: 700; grid-area: auto; line-height: 0px; margin: 0px; overflow: visible; position: relative; text-align: left; text-align-last: auto; white-space-collapse: preserve-breaks;">®</sup> Fund
|
| Class Name |
Class C
|
| Trading Symbol |
RYDKX
|
| Annual or Semi-Annual Statement [Text Block] |
This annual shareholder report contains important information about the Dow Jones Industrial Average® Fund for the period from April 1, 2025 to March 31, 2026.
|
| Shareholder Report Annual or Semi-Annual |
Annual Shareholder Report
|
| Additional Information [Text Block] |
You can find additional information about the fund at GuggenheimInvestments.com/mutual-funds/literature. You can also request this information by contacting 800 820 0888 or services@guggenheiminvestments.com.
|
| Additional Information Phone Number |
800 820 0888
|
| Additional Information Email |
<span style="box-sizing: border-box; color: rgb(67, 67, 67); display: inline; flex-wrap: nowrap; font-size: 10.6667px; font-weight: 400; grid-area: auto; line-height: 12.8px; margin: 0px; overflow: visible; text-align: left; text-align-last: auto; white-space-collapse: preserve-breaks;">services@guggenheiminvestments.com</span>
|
| Additional Information Website |
<span style="box-sizing: border-box; color: rgb(67, 67, 67); display: inline; flex-wrap: nowrap; font-size: 10.6667px; font-weight: 400; grid-area: auto; line-height: 12.8px; margin: 0px; overflow: visible; text-align: left; text-align-last: auto; white-space-collapse: preserve-breaks;">GuggenheimInvestments.com/mutual-funds/literature</span>
|
| Expenses [Text Block] |
What were the Fund's costs for the last year? * Based on a hypothetical $10,000 investment Table SummaryClass | Costs of a $10,000 Investment | Costs Paid as a % of a $10,000 Investment |
|---|
Class C | $244 | 2.33% |
|---|
Table Summary* | Excludes expenses of the underlying funds in which the fund invests, if any. |
|---|
|
| Expenses Paid, Amount |
$ 244
|
| Factors Affecting Performance [Text Block] |
What factors materially affected the Fund's performance over the last year? The sectors that contributed the most to the return of the underlying index were financials, industrials, and information technology. Those that detracted the most were health care, materials, and consumer discretionary. The holdings that contributed the most to return of the underlying index were Caterpillar, Inc., Goldman Sachs Group, Inc., and Nvidia Corp. Those that detracted the most were UnitedHealth Group, Inc., Salesforce, Inc., and Visa, Inc.—Class A. The fund maintained a daily correlation of over 99% to its benchmark of 100% of the daily price movement of the Dow Jones Industrial Average. |
| Line Graph [Table Text Block] |
Table Summary | Dow Jones Industrial Average® Fund (Class C) | S&P 500 Index | Dow Jones Industrial Average |
|---|
3/31/16 | $10,000 | $10,000 | $10,000 |
|---|
3/31/17 | $11,721 | $11,717 | $11,991 |
|---|
3/31/18 | $13,674 | $13,357 | $14,316 |
|---|
3/31/19 | $14,683 | $14,625 | $15,760 |
|---|
3/31/20 | $12,329 | $13,605 | $13,651 |
|---|
3/31/21 | $18,558 | $21,271 | $20,992 |
|---|
3/31/22 | $19,380 | $24,599 | $22,484 |
|---|
3/31/23 | $18,487 | $22,698 | $22,039 |
|---|
3/31/24 | $22,060 | $29,480 | $26,927 |
|---|
3/31/25 | $23,126 | $31,913 | $28,919 |
|---|
3/31/26 | $25,330 | $37,594 | $32,455 |
|---|
|
| Average Annual Return [Table Text Block] |
Table SummaryAverage Annual Total Returns | One Year | Five Years | Ten Years |
|---|
Class C (without CDSC) | 9.52% | 6.42% | 9.74% |
|---|
Class C (with CDSC) ‡ | 8.52% | 6.42% | 9.74% |
|---|
S&P 500 Index | 17.80% | 12.06% | 14.16% |
|---|
Dow Jones Industrial Average | 12.23% | 9.11% | 12.49% |
|---|
|
| AssetsNet |
$ 19,647,863
|
| Holdings Count | Holding |
38
|
| Advisory Fees Paid, Amount |
$ 146,638
|
| InvestmentCompanyPortfolioTurnover |
145.00%
|
| Additional Fund Statistics [Text Block] |
Fund Statistics as of March 31, 2026 - Net Assets$19,647,863
- Total Number of Portfolio Holdings38
- Portfolio Turnover Rate145%
- Total Advisory Fees Paid$146,638
|
| Holdings [Text Block] |
Holdings DiversificationFootnote Reference1 (% of Net Assets) as of March 31, 2026 Table SummaryValue | Value |
|---|
Other | 7.5% | Communications | 5.2% | OTC Equity Index Swap Agreements | 9.0% | Consumer, Cyclical | 9.7% | Consumer, Non-cyclical | 14.4% | Technology | 14.6% | Industrial | 15.3% | Financial | 24.3% | |
| Largest Holdings [Text Block] |
10 Largest HoldingsFootnote Reference2 (% of Net Assets) as of March 31, 2026 Table SummaryGoldman Sachs Group, Inc. | 10.1% |
|---|
Caterpillar, Inc. | 8.5% |
|---|
Microsoft Corp. | 4.4% |
|---|
Amgen, Inc. | 4.2% |
|---|
Home Depot, Inc. | 3.9% |
|---|
Sherwin-Williams Co. | 3.8% |
|---|
McDonald's Corp. | 3.7% |
|---|
American Express Co. | 3.6% |
|---|
Visa, Inc. — Class A | 3.6% |
|---|
JPMorgan Chase & Co. | 3.5% |
|---|
Total | 49.3% |
|---|
|
| Material Fund Change [Text Block] |
|
| C000162316 |
|
| Shareholder Report [Line Items] |
|
| Fund Name |
Dow Jones Industrial Average<sup style="inset: 1.5px 0px 4px; box-sizing: border-box; color: rgb(83, 40, 79); display: inline; flex-wrap: nowrap; font-size: 20px; font-weight: 700; grid-area: auto; line-height: 0px; margin: 0px; overflow: visible; position: relative; text-align: left; text-align-last: auto; white-space-collapse: preserve-breaks;">®</sup> Fund
|
| Class Name |
Class H
|
| Trading Symbol |
RYDHX
|
| Annual or Semi-Annual Statement [Text Block] |
This annual shareholder report contains important information about the Dow Jones Industrial Average® Fund for the period from April 1, 2025 to March 31, 2026.
|
| Shareholder Report Annual or Semi-Annual |
Annual Shareholder Report
|
| Additional Information [Text Block] |
You can find additional information about the fund at GuggenheimInvestments.com/mutual-funds/literature. You can also request this information by contacting 800 820 0888 or services@guggenheiminvestments.com.
|
| Additional Information Phone Number |
800 820 0888
|
| Additional Information Email |
<span style="box-sizing: border-box; color: rgb(67, 67, 67); display: inline; flex-wrap: nowrap; font-size: 10.6667px; font-weight: 400; grid-area: auto; line-height: 12.8px; margin: 0px; overflow: visible; text-align: left; text-align-last: auto; white-space-collapse: preserve-breaks;">services@guggenheiminvestments.com</span>
|
| Additional Information Website |
<span style="box-sizing: border-box; color: rgb(67, 67, 67); display: inline; flex-wrap: nowrap; font-size: 10.6667px; font-weight: 400; grid-area: auto; line-height: 12.8px; margin: 0px; overflow: visible; text-align: left; text-align-last: auto; white-space-collapse: preserve-breaks;">GuggenheimInvestments.com/mutual-funds/literature</span>
|
| Expenses [Text Block] |
What were the Fund's costs for the last year? * Based on a hypothetical $10,000 investment Table SummaryClass | Costs of a $10,000 Investment | Costs Paid as a % of a $10,000 Investment |
|---|
Class H | $166 | 1.58% |
|---|
Table Summary* | Excludes expenses of the underlying funds in which the fund invests, if any. |
|---|
|
| Expenses Paid, Amount |
$ 166
|
| Factors Affecting Performance [Text Block] |
What factors materially affected the Fund's performance over the last year? The sectors that contributed the most to the return of the underlying index were financials, industrials, and information technology. Those that detracted the most were health care, materials, and consumer discretionary. The holdings that contributed the most to return of the underlying index were Caterpillar, Inc., Goldman Sachs Group, Inc., and Nvidia Corp. Those that detracted the most were UnitedHealth Group, Inc., Salesforce, Inc., and Visa, Inc.—Class A. The fund maintained a daily correlation of over 99% to its benchmark of 100% of the daily price movement of the Dow Jones Industrial Average. |
| Line Graph [Table Text Block] |
Table Summary | Dow Jones Industrial Average® Fund (Class H) | S&P 500 Index | Dow Jones Industrial Average |
|---|
3/31/16 | $10,000 | $10,000 | $10,000 |
|---|
3/31/17 | $11,820 | $11,717 | $11,991 |
|---|
3/31/18 | $13,893 | $13,357 | $14,316 |
|---|
3/31/19 | $15,027 | $14,625 | $15,760 |
|---|
3/31/20 | $12,713 | $13,605 | $13,651 |
|---|
3/31/21 | $19,278 | $21,271 | $20,992 |
|---|
3/31/22 | $20,286 | $24,599 | $22,484 |
|---|
3/31/23 | $19,499 | $22,698 | $22,039 |
|---|
3/31/24 | $23,440 | $29,480 | $26,927 |
|---|
3/31/25 | $24,755 | $31,913 | $28,919 |
|---|
3/31/26 | $27,317 | $37,594 | $32,455 |
|---|
|
| Average Annual Return [Table Text Block] |
Table SummaryAverage Annual Total Returns | One Year | Five Years | Ten Years |
|---|
Class H | 10.35% | 7.22% | 10.57% |
|---|
S&P 500 Index | 17.80% | 12.06% | 14.16% |
|---|
Dow Jones Industrial Average | 12.23% | 9.11% | 12.49% |
|---|
|
| AssetsNet |
$ 19,647,863
|
| Holdings Count | Holding |
38
|
| Advisory Fees Paid, Amount |
$ 146,638
|
| InvestmentCompanyPortfolioTurnover |
145.00%
|
| Additional Fund Statistics [Text Block] |
Fund Statistics as of March 31, 2026 - Net Assets$19,647,863
- Total Number of Portfolio Holdings38
- Portfolio Turnover Rate145%
- Total Advisory Fees Paid$146,638
|
| Holdings [Text Block] |
Holdings DiversificationFootnote Reference1 (% of Net Assets) as of March 31, 2026 Table SummaryValue | Value |
|---|
Other | 7.5% | Communications | 5.2% | OTC Equity Index Swap Agreements | 9.0% | Consumer, Cyclical | 9.7% | Consumer, Non-cyclical | 14.4% | Technology | 14.6% | Industrial | 15.3% | Financial | 24.3% | |
| Largest Holdings [Text Block] |
10 Largest HoldingsFootnote Reference2 (% of Net Assets) as of March 31, 2026 Table SummaryGoldman Sachs Group, Inc. | 10.1% |
|---|
Caterpillar, Inc. | 8.5% |
|---|
Microsoft Corp. | 4.4% |
|---|
Amgen, Inc. | 4.2% |
|---|
Home Depot, Inc. | 3.9% |
|---|
Sherwin-Williams Co. | 3.8% |
|---|
McDonald's Corp. | 3.7% |
|---|
American Express Co. | 3.6% |
|---|
Visa, Inc. — Class A | 3.6% |
|---|
JPMorgan Chase & Co. | 3.5% |
|---|
Total | 49.3% |
|---|
|
| Material Fund Change [Text Block] |
|
| C000010312 |
|
| Shareholder Report [Line Items] |
|
| Fund Name |
Mid-Cap 1.5x Strategy Fund
|
| Class Name |
Class A
|
| Trading Symbol |
RYAHX
|
| Annual or Semi-Annual Statement [Text Block] |
This annual shareholder report contains important information about the Mid-Cap 1.5x Strategy Fund for the period from April 1, 2025 to March 31, 2026.
|
| Shareholder Report Annual or Semi-Annual |
Annual Shareholder Report
|
| Additional Information [Text Block] |
You can find additional information about the fund at GuggenheimInvestments.com/mutual-funds/literature. You can also request this information by contacting 800 820 0888 or services@guggenheiminvestments.com.
|
| Additional Information Phone Number |
800 820 0888
|
| Additional Information Email |
<span style="box-sizing: border-box; color: rgb(67, 67, 67); display: inline; flex-wrap: nowrap; font-size: 10.6667px; font-weight: 400; grid-area: auto; line-height: 12.8px; margin: 0px; overflow: visible; text-align: left; text-align-last: auto; white-space-collapse: preserve-breaks;">services@guggenheiminvestments.com</span>
|
| Additional Information Website |
<span style="box-sizing: border-box; color: rgb(67, 67, 67); display: inline; flex-wrap: nowrap; font-size: 10.6667px; font-weight: 400; grid-area: auto; line-height: 12.8px; margin: 0px; overflow: visible; text-align: left; text-align-last: auto; white-space-collapse: preserve-breaks;">GuggenheimInvestments.com/mutual-funds/literature</span>
|
| Expenses [Text Block] |
What were the Fund's costs for the last year? * Based on a hypothetical $10,000 investment Table SummaryClass | Costs of a $10,000 Investment | Costs Paid as a % of a $10,000 Investment |
|---|
Class A | $183 | 1.66% |
|---|
Table Summary* | Excludes expenses of the underlying funds in which the fund invests, if any. |
|---|
|
| Expenses Paid, Amount |
$ 183
|
| Factors Affecting Performance [Text Block] |
What factors materially affected the Fund's performance over the last year? The sectors that contributed the most to the return of the underlying index were industrials, information technology, and energy. No sectors detracted from performance. The holdings that contributed the most to the return of the underlying index were Lumentum Holdings, Inc., Ciena Corp., and Coherent Corp. Those that detracted the most were Nutanix, Inc.—Class A, BellRing Brands, Inc., and Sprouts Farmers Market, Inc. The fund maintained a correlation of over 99% to its benchmark of 150% of the daily price movement of the S&P MidCap 400 Index. |
| Line Graph [Table Text Block] |
Table Summary | Mid-Cap 1.5x Strategy Fund (Class A)‡ | S&P 500 Index | S&P MidCap 400 Index |
|---|
3/31/16 | $9,525 | $10,000 | $10,000 |
|---|
3/31/17 | $12,372 | $11,717 | $12,092 |
|---|
3/31/18 | $14,072 | $13,357 | $13,419 |
|---|
3/31/19 | $14,056 | $14,625 | $13,767 |
|---|
3/31/20 | $8,783 | $13,605 | $10,668 |
|---|
3/31/21 | $20,763 | $21,271 | $19,571 |
|---|
3/31/22 | $21,487 | $24,599 | $20,469 |
|---|
3/31/23 | $18,759 | $22,698 | $19,420 |
|---|
3/31/24 | $24,415 | $29,480 | $23,951 |
|---|
3/31/25 | $22,213 | $31,913 | $23,303 |
|---|
3/31/26 | $26,671 | $37,594 | $27,346 |
|---|
|
| Average Annual Return [Table Text Block] |
Table SummaryAverage Annual Total Returns | One Year | Five Years | Ten Years |
|---|
Class A (without sales charge) | 20.07% | 5.13% | 10.85% |
|---|
Class A (with sales charge) ‡ | 14.38% | 4.12% | 10.31% |
|---|
S&P 500 Index | 17.80% | 12.06% | 14.16% |
|---|
S&P MidCap 400 Index | 17.35% | 6.92% | 10.58% |
|---|
|
| AssetsNet |
$ 12,296,433
|
| Holdings Count | Holding |
409
|
| Advisory Fees Paid, Amount |
$ 95,317
|
| InvestmentCompanyPortfolioTurnover |
15.00%
|
| Additional Fund Statistics [Text Block] |
Fund Statistics as of March 31, 2026 - Net Assets$12,296,433
- Total Number of Portfolio Holdings409
- Portfolio Turnover Rate15%
- Total Advisory Fees Paid$95,317
|
| Holdings [Text Block] |
Holdings DiversificationFootnote Reference1 (% of Net Assets) as of March 31, 2026 Table SummaryValue | Value |
|---|
Other | 11.6% | Technology | 6.5% | Consumer, Cyclical | 9.8% | Consumer, Non-cyclical | 11.0% | Financial | 15.4% | Industrial | 18.6% | OTC Equity Index Swap Agreements | 35.5% | Equity Futures Contracts Purchased | 41.5% | |
| Largest Holdings [Text Block] |
10 Largest HoldingsFootnote Reference2 (% of Net Assets) as of March 31, 2026 Table SummaryGuggenheim Ultra Short Duration Fund — Institutional Class | 7.2% |
|---|
Guggenheim Strategy Fund II | 2.0% |
|---|
TechnipFMC plc | 0.6% |
|---|
Casey's General Stores, Inc. | 0.6% |
|---|
United Therapeutics Corp. | 0.6% |
|---|
Curtiss-Wright Corp. | 0.6% |
|---|
Flex Ltd. | 0.5% |
|---|
XPO, Inc. | 0.5% |
|---|
Woodward, Inc. | 0.5% |
|---|
Royal Gold, Inc. | 0.5% |
|---|
Total | 13.6% |
|---|
|
| Material Fund Change [Text Block] |
|
| C000010313 |
|
| Shareholder Report [Line Items] |
|
| Fund Name |
Mid-Cap 1.5x Strategy Fund
|
| Class Name |
Class C
|
| Trading Symbol |
RYDCX
|
| Annual or Semi-Annual Statement [Text Block] |
This annual shareholder report contains important information about the Mid-Cap 1.5x Strategy Fund for the period from April 1, 2025 to March 31, 2026.
|
| Shareholder Report Annual or Semi-Annual |
Annual Shareholder Report
|
| Additional Information [Text Block] |
You can find additional information about the fund at GuggenheimInvestments.com/mutual-funds/literature. You can also request this information by contacting 800 820 0888 or services@guggenheiminvestments.com.
|
| Additional Information Phone Number |
800 820 0888
|
| Additional Information Email |
<span style="box-sizing: border-box; color: rgb(67, 67, 67); display: inline; flex-wrap: nowrap; font-size: 10.6667px; font-weight: 400; grid-area: auto; line-height: 12.8px; margin: 0px; overflow: visible; text-align: left; text-align-last: auto; white-space-collapse: preserve-breaks;">services@guggenheiminvestments.com</span>
|
| Additional Information Website |
<span style="box-sizing: border-box; color: rgb(67, 67, 67); display: inline; flex-wrap: nowrap; font-size: 10.6667px; font-weight: 400; grid-area: auto; line-height: 12.8px; margin: 0px; overflow: visible; text-align: left; text-align-last: auto; white-space-collapse: preserve-breaks;">GuggenheimInvestments.com/mutual-funds/literature</span>
|
| Expenses [Text Block] |
What were the Fund's costs for the last year? * Based on a hypothetical $10,000 investment Table SummaryClass | Costs of a $10,000 Investment | Costs Paid as a % of a $10,000 Investment |
|---|
Class C | $263 | 2.40% |
|---|
Table Summary* | Excludes expenses of the underlying funds in which the fund invests, if any. |
|---|
|
| Expenses Paid, Amount |
$ 263
|
| Factors Affecting Performance [Text Block] |
What factors materially affected the Fund's performance over the last year? The sectors that contributed the most to the return of the underlying index were industrials, information technology, and energy. No sectors detracted from performance. The holdings that contributed the most to the return of the underlying index were Lumentum Holdings, Inc., Ciena Corp., and Coherent Corp. Those that detracted the most were Nutanix, Inc.—Class A, BellRing Brands, Inc., and Sprouts Farmers Market, Inc. The fund maintained a correlation of over 99% to its benchmark of 150% of the daily price movement of the S&P MidCap 400 Index. |
| Line Graph [Table Text Block] |
Table Summary | Mid-Cap 1.5x Strategy Fund (Class C) | S&P 500 Index | S&P MidCap 400 Index |
|---|
3/31/16 | $10,000 | $10,000 | $10,000 |
|---|
3/31/17 | $12,894 | $11,717 | $12,092 |
|---|
3/31/18 | $14,556 | $13,357 | $13,419 |
|---|
3/31/19 | $14,431 | $14,625 | $13,767 |
|---|
3/31/20 | $8,950 | $13,605 | $10,668 |
|---|
3/31/21 | $21,003 | $21,271 | $19,571 |
|---|
3/31/22 | $21,572 | $24,599 | $20,469 |
|---|
3/31/23 | $18,689 | $22,698 | $19,420 |
|---|
3/31/24 | $24,148 | $29,480 | $23,951 |
|---|
3/31/25 | $21,805 | $31,913 | $23,303 |
|---|
3/31/26 | $25,985 | $37,594 | $27,346 |
|---|
|
| Average Annual Return [Table Text Block] |
Table SummaryAverage Annual Total Returns | One Year | Five Years | Ten Years |
|---|
Class C (without CDSC) | 19.17% | 4.35% | 10.02% |
|---|
Class C (with CDSC) ‡ | 18.17% | 4.35% | 10.02% |
|---|
S&P 500 Index | 17.80% | 12.06% | 14.16% |
|---|
S&P MidCap 400 Index | 17.35% | 6.92% | 10.58% |
|---|
|
| AssetsNet |
$ 12,296,433
|
| Holdings Count | Holding |
409
|
| Advisory Fees Paid, Amount |
$ 95,317
|
| InvestmentCompanyPortfolioTurnover |
15.00%
|
| Additional Fund Statistics [Text Block] |
Fund Statistics as of March 31, 2026 - Net Assets$12,296,433
- Total Number of Portfolio Holdings409
- Portfolio Turnover Rate15%
- Total Advisory Fees Paid$95,317
|
| Holdings [Text Block] |
Holdings DiversificationFootnote Reference1 (% of Net Assets) as of March 31, 2026 Table SummaryValue | Value |
|---|
Other | 11.6% | Technology | 6.5% | Consumer, Cyclical | 9.8% | Consumer, Non-cyclical | 11.0% | Financial | 15.4% | Industrial | 18.6% | OTC Equity Index Swap Agreements | 35.5% | Equity Futures Contracts Purchased | 41.5% | |
| Largest Holdings [Text Block] |
10 Largest HoldingsFootnote Reference2 (% of Net Assets) as of March 31, 2026 Table SummaryGuggenheim Ultra Short Duration Fund — Institutional Class | 7.2% |
|---|
Guggenheim Strategy Fund II | 2.0% |
|---|
TechnipFMC plc | 0.6% |
|---|
Casey's General Stores, Inc. | 0.6% |
|---|
United Therapeutics Corp. | 0.6% |
|---|
Curtiss-Wright Corp. | 0.6% |
|---|
Flex Ltd. | 0.5% |
|---|
XPO, Inc. | 0.5% |
|---|
Woodward, Inc. | 0.5% |
|---|
Royal Gold, Inc. | 0.5% |
|---|
Total | 13.6% |
|---|
|
| Material Fund Change [Text Block] |
|
| C000010311 |
|
| Shareholder Report [Line Items] |
|
| Fund Name |
Mid-Cap 1.5x Strategy Fund
|
| Class Name |
Class H
|
| Trading Symbol |
RYMDX
|
| Annual or Semi-Annual Statement [Text Block] |
This annual shareholder report contains important information about the Mid-Cap 1.5x Strategy Fund for the period from April 1, 2025 to March 31, 2026.
|
| Shareholder Report Annual or Semi-Annual |
Annual Shareholder Report
|
| Additional Information [Text Block] |
You can find additional information about the fund at GuggenheimInvestments.com/mutual-funds/literature. You can also request this information by contacting 800 820 0888 or services@guggenheiminvestments.com.
|
| Additional Information Phone Number |
800 820 0888
|
| Additional Information Email |
<span style="box-sizing: border-box; color: rgb(67, 67, 67); display: inline; flex-wrap: nowrap; font-size: 10.6667px; font-weight: 400; grid-area: auto; line-height: 12.8px; margin: 0px; overflow: visible; text-align: left; text-align-last: auto; white-space-collapse: preserve-breaks;">services@guggenheiminvestments.com</span>
|
| Additional Information Website |
<span style="box-sizing: border-box; color: rgb(67, 67, 67); display: inline; flex-wrap: nowrap; font-size: 10.6667px; font-weight: 400; grid-area: auto; line-height: 12.8px; margin: 0px; overflow: visible; text-align: left; text-align-last: auto; white-space-collapse: preserve-breaks;">GuggenheimInvestments.com/mutual-funds/literature</span>
|
| Expenses [Text Block] |
What were the Fund's costs for the last year? * Based on a hypothetical $10,000 investment Table SummaryClass | Costs of a $10,000 Investment | Costs Paid as a % of a $10,000 Investment |
|---|
Class H | $182 | 1.65% |
|---|
Table Summary* | Excludes expenses of the underlying funds in which the fund invests, if any. |
|---|
|
| Expenses Paid, Amount |
$ 182
|
| Factors Affecting Performance [Text Block] |
What factors materially affected the Fund's performance over the last year? The sectors that contributed the most to the return of the underlying index were industrials, information technology, and energy. No sectors detracted from performance. The holdings that contributed the most to the return of the underlying index were Lumentum Holdings, Inc., Ciena Corp., and Coherent Corp. Those that detracted the most were Nutanix, Inc.—Class A, BellRing Brands, Inc., and Sprouts Farmers Market, Inc. The fund maintained a correlation of over 99% to its benchmark of 150% of the daily price movement of the S&P MidCap 400 Index. |
| Line Graph [Table Text Block] |
Table Summary | Mid-Cap 1.5x Strategy Fund (Class H) | S&P 500 Index | S&P MidCap 400 Index |
|---|
3/31/16 | $10,000 | $10,000 | $10,000 |
|---|
3/31/17 | $12,997 | $11,717 | $12,092 |
|---|
3/31/18 | $14,793 | $13,357 | $13,419 |
|---|
3/31/19 | $14,763 | $14,625 | $13,767 |
|---|
3/31/20 | $9,224 | $13,605 | $10,668 |
|---|
3/31/21 | $21,805 | $21,271 | $19,571 |
|---|
3/31/22 | $22,566 | $24,599 | $20,469 |
|---|
3/31/23 | $19,700 | $22,698 | $19,420 |
|---|
3/31/24 | $25,642 | $29,480 | $23,951 |
|---|
3/31/25 | $23,327 | $31,913 | $23,303 |
|---|
3/31/26 | $28,009 | $37,594 | $27,346 |
|---|
|
| Average Annual Return [Table Text Block] |
Table SummaryAverage Annual Total Returns | One Year | Five Years | Ten Years |
|---|
Class H | 20.07% | 5.13% | 10.85% |
|---|
S&P 500 Index | 17.80% | 12.06% | 14.16% |
|---|
S&P MidCap 400 Index | 17.35% | 6.92% | 10.58% |
|---|
|
| AssetsNet |
$ 12,296,433
|
| Holdings Count | Holding |
409
|
| Advisory Fees Paid, Amount |
$ 95,317
|
| InvestmentCompanyPortfolioTurnover |
15.00%
|
| Additional Fund Statistics [Text Block] |
Fund Statistics as of March 31, 2026 - Net Assets$12,296,433
- Total Number of Portfolio Holdings409
- Portfolio Turnover Rate15%
- Total Advisory Fees Paid$95,317
|
| Holdings [Text Block] |
Holdings DiversificationFootnote Reference1 (% of Net Assets) as of March 31, 2026 Table SummaryValue | Value |
|---|
Other | 11.6% | Technology | 6.5% | Consumer, Cyclical | 9.8% | Consumer, Non-cyclical | 11.0% | Financial | 15.4% | Industrial | 18.6% | OTC Equity Index Swap Agreements | 35.5% | Equity Futures Contracts Purchased | 41.5% | |
| Largest Holdings [Text Block] |
10 Largest HoldingsFootnote Reference2 (% of Net Assets) as of March 31, 2026 Table SummaryGuggenheim Ultra Short Duration Fund — Institutional Class | 7.2% |
|---|
Guggenheim Strategy Fund II | 2.0% |
|---|
TechnipFMC plc | 0.6% |
|---|
Casey's General Stores, Inc. | 0.6% |
|---|
United Therapeutics Corp. | 0.6% |
|---|
Curtiss-Wright Corp. | 0.6% |
|---|
Flex Ltd. | 0.5% |
|---|
XPO, Inc. | 0.5% |
|---|
Woodward, Inc. | 0.5% |
|---|
Royal Gold, Inc. | 0.5% |
|---|
Total | 13.6% |
|---|
|
| Material Fund Change [Text Block] |
|
| C000010455 |
|
| Shareholder Report [Line Items] |
|
| Fund Name |
Inverse Mid-Cap Strategy Fund
|
| Class Name |
Class A
|
| Trading Symbol |
RYAGX
|
| Annual or Semi-Annual Statement [Text Block] |
This annual shareholder report contains important information about the Inverse Mid-Cap Strategy Fund for the period from April 1, 2025 to March 31, 2026.
|
| Shareholder Report Annual or Semi-Annual |
Annual Shareholder Report
|
| Additional Information [Text Block] |
You can find additional information about the fund at GuggenheimInvestments.com/mutual-funds/literature. You can also request this information by contacting 800 820 0888 or services@guggenheiminvestments.com.
|
| Additional Information Phone Number |
800 820 0888
|
| Additional Information Email |
<span style="box-sizing: border-box; color: rgb(67, 67, 67); display: inline; flex-wrap: nowrap; font-size: 10.6667px; font-weight: 400; grid-area: auto; line-height: 12.8px; margin: 0px; overflow: visible; text-align: left; text-align-last: auto; white-space-collapse: preserve-breaks;">services@guggenheiminvestments.com</span>
|
| Additional Information Website |
<span style="box-sizing: border-box; color: rgb(67, 67, 67); display: inline; flex-wrap: nowrap; font-size: 10.6667px; font-weight: 400; grid-area: auto; line-height: 12.8px; margin: 0px; overflow: visible; text-align: left; text-align-last: auto; white-space-collapse: preserve-breaks;">GuggenheimInvestments.com/mutual-funds/literature</span>
|
| Expenses [Text Block] |
What were the Fund's costs for the last year? * Based on a hypothetical $10,000 investment Table SummaryClass | Costs of a $10,000 Investment | Costs Paid as a % of a $10,000 Investment |
|---|
Class A | $170 | 1.80% |
|---|
Table Summary* | Excludes expenses of the underlying funds in which the fund invests, if any. |
|---|
|
| Expenses Paid, Amount |
$ 170
|
| Factors Affecting Performance [Text Block] |
What factors materially affected the Fund's performance over the last year? The sectors that contributed the most to the return of the underlying index were industrials, information technology, and energy. No sectors detracted from performance. The holdings that contributed the most to the return of the underlying index were Lumentum Holdings, Inc., Ciena Corp., and Coherent Corp. Those that detracted the most were Nutanix, Inc.—Class A, BellRing Brands, Inc., and Sprouts Farmers Market, Inc. The fund maintained a daily correlation of 98% to its benchmark of -100% of the daily price movement of the S&P MidCap 400 Index. |
| Line Graph [Table Text Block] |
Table Summary | Inverse Mid-Cap Strategy Fund (Class A)‡ | S&P 500 Index | S&P MidCap 400 Index |
|---|
3/31/16 | $9,525 | $10,000 | $10,000 |
|---|
3/31/17 | $7,726 | $11,717 | $12,092 |
|---|
3/31/18 | $6,920 | $13,357 | $13,419 |
|---|
3/31/19 | $6,768 | $14,625 | $13,767 |
|---|
3/31/20 | $7,995 | $13,605 | $10,668 |
|---|
3/31/21 | $4,002 | $21,271 | $19,571 |
|---|
3/31/22 | $3,622 | $24,599 | $20,469 |
|---|
3/31/23 | $3,737 | $22,698 | $19,420 |
|---|
3/31/24 | $3,240 | $29,480 | $23,951 |
|---|
3/31/25 | $3,536 | $31,913 | $23,303 |
|---|
3/31/26 | $3,132 | $37,594 | $27,346 |
|---|
|
| Average Annual Return [Table Text Block] |
Table SummaryAverage Annual Total Returns | One Year | Five Years | Ten Years |
|---|
Class A (without sales charge) | -11.44% | -4.78% | -10.53% |
|---|
Class A (with sales charge) ‡ | -15.63% | -5.71% | -10.96% |
|---|
S&P 500 Index | 17.80% | 12.06% | 14.16% |
|---|
S&P MidCap 400 Index | 17.35% | 6.92% | 10.58% |
|---|
|
| AssetsNet |
$ 231,901
|
| Holdings Count | Holding |
8
|
| Advisory Fees Paid, Amount |
$ 38,465
|
| InvestmentCompanyPortfolioTurnover |
0.00%
|
| Additional Fund Statistics [Text Block] |
Fund Statistics as of March 31, 2026 - Net Assets$231,901
- Total Number of Portfolio Holdings8
- Portfolio Turnover Rate-%
- Total Advisory Fees Paid$38,465
|
| Holdings [Text Block] |
Holdings DiversificationFootnote Reference1 (% of Net Assets) as of March 31, 2026 Table SummaryValue | Value |
|---|
OTC Equity Index Swap Agreements Sold Short | -100.8% | |
| Largest Holdings [Text Block] |
Largest HoldingsFootnote Reference2 (% of Net Assets) as of March 31, 2026 Table SummaryGuggenheim Strategy Fund II | 15.1% |
|---|
Guggenheim Ultra Short Duration Fund — Institutional Class | 13.6% |
|---|
Total | 28.7% |
|---|
|
| Material Fund Change [Text Block] |
|
| C000010456 |
|
| Shareholder Report [Line Items] |
|
| Fund Name |
Inverse Mid-Cap Strategy Fund
|
| Class Name |
Class C
|
| Trading Symbol |
RYCLX
|
| Annual or Semi-Annual Statement [Text Block] |
This annual shareholder report contains important information about the Inverse Mid-Cap Strategy Fund for the period from April 1, 2025 to March 31, 2026.
|
| Shareholder Report Annual or Semi-Annual |
Annual Shareholder Report
|
| Additional Information [Text Block] |
You can find additional information about the fund at GuggenheimInvestments.com/mutual-funds/literature. You can also request this information by contacting 800 820 0888 or services@guggenheiminvestments.com.
|
| Additional Information Phone Number |
800 820 0888
|
| Additional Information Email |
<span style="box-sizing: border-box; color: rgb(67, 67, 67); display: inline; flex-wrap: nowrap; font-size: 10.6667px; font-weight: 400; grid-area: auto; line-height: 12.8px; margin: 0px; overflow: visible; text-align: left; text-align-last: auto; white-space-collapse: preserve-breaks;">services@guggenheiminvestments.com</span>
|
| Additional Information Website |
<span style="box-sizing: border-box; color: rgb(67, 67, 67); display: inline; flex-wrap: nowrap; font-size: 10.6667px; font-weight: 400; grid-area: auto; line-height: 12.8px; margin: 0px; overflow: visible; text-align: left; text-align-last: auto; white-space-collapse: preserve-breaks;">GuggenheimInvestments.com/mutual-funds/literature</span>
|
| Expenses [Text Block] |
What were the Fund's costs for the last year? * Based on a hypothetical $10,000 investment Table SummaryClass | Costs of a $10,000 Investment | Costs Paid as a % of a $10,000 Investment |
|---|
Class C | $221 | 2.34% |
|---|
Table Summary* | Excludes expenses of the underlying funds in which the fund invests, if any. |
|---|
|
| Expenses Paid, Amount |
$ 221
|
| Factors Affecting Performance [Text Block] |
What factors materially affected the Fund's performance over the last year? The sectors that contributed the most to the return of the underlying index were industrials, information technology, and energy. No sectors detracted from performance. The holdings that contributed the most to the return of the underlying index were Lumentum Holdings, Inc., Ciena Corp., and Coherent Corp. Those that detracted the most were Nutanix, Inc.—Class A, BellRing Brands, Inc., and Sprouts Farmers Market, Inc. The fund maintained a daily correlation of 98% to its benchmark of -100% of the daily price movement of the S&P MidCap 400 Index. |
| Line Graph [Table Text Block] |
Table Summary | Inverse Mid-Cap Strategy Fund (Class C) | S&P 500 Index | S&P MidCap 400 Index |
|---|
3/31/16 | $10,000 | $10,000 | $10,000 |
|---|
3/31/17 | $8,049 | $11,717 | $12,092 |
|---|
3/31/18 | $7,150 | $13,357 | $13,419 |
|---|
3/31/19 | $6,956 | $14,625 | $13,767 |
|---|
3/31/20 | $8,123 | $13,605 | $10,668 |
|---|
3/31/21 | $4,055 | $21,271 | $19,571 |
|---|
3/31/22 | $3,648 | $24,599 | $20,469 |
|---|
3/31/23 | $3,761 | $22,698 | $19,420 |
|---|
3/31/24 | $3,282 | $29,480 | $23,951 |
|---|
3/31/25 | $3,618 | $31,913 | $23,303 |
|---|
3/31/26 | $3,205 | $37,594 | $27,346 |
|---|
|
| Average Annual Return [Table Text Block] |
Table SummaryAverage Annual Total Returns | One Year | Five Years | Ten Years |
|---|
Class C (without CDSC) | -11.43% | -4.60% | -10.76% |
|---|
Class C (with CDSC) ‡ | -12.09% | -4.60% | -10.76% |
|---|
S&P 500 Index | 17.80% | 12.06% | 14.16% |
|---|
S&P MidCap 400 Index | 17.35% | 6.92% | 10.58% |
|---|
|
| AssetsNet |
$ 231,901
|
| Holdings Count | Holding |
8
|
| Advisory Fees Paid, Amount |
$ 38,465
|
| InvestmentCompanyPortfolioTurnover |
0.00%
|
| Additional Fund Statistics [Text Block] |
Fund Statistics as of March 31, 2026 - Net Assets$231,901
- Total Number of Portfolio Holdings8
- Portfolio Turnover Rate-%
- Total Advisory Fees Paid$38,465
|
| Holdings [Text Block] |
Holdings DiversificationFootnote Reference1 (% of Net Assets) as of March 31, 2026 Table SummaryValue | Value |
|---|
OTC Equity Index Swap Agreements Sold Short | -100.8% | |
| Largest Holdings [Text Block] |
Largest HoldingsFootnote Reference2 (% of Net Assets) as of March 31, 2026 Table SummaryGuggenheim Strategy Fund II | 15.1% |
|---|
Guggenheim Ultra Short Duration Fund — Institutional Class | 13.6% |
|---|
Total | 28.7% |
|---|
|
| Material Fund Change [Text Block] |
|
| C000010454 |
|
| Shareholder Report [Line Items] |
|
| Fund Name |
Inverse Mid-Cap Strategy Fund
|
| Class Name |
Class H
|
| Trading Symbol |
RYMHX
|
| Annual or Semi-Annual Statement [Text Block] |
This annual shareholder report contains important information about the Inverse Mid-Cap Strategy Fund for the period from April 1, 2025 to March 31, 2026.
|
| Shareholder Report Annual or Semi-Annual |
Annual Shareholder Report
|
| Additional Information [Text Block] |
You can find additional information about the fund at GuggenheimInvestments.com/mutual-funds/literature. You can also request this information by contacting 800 820 0888 or services@guggenheiminvestments.com.
|
| Additional Information Phone Number |
800 820 0888
|
| Additional Information Email |
<span style="box-sizing: border-box; color: rgb(67, 67, 67); display: inline; flex-wrap: nowrap; font-size: 10.6667px; font-weight: 400; grid-area: auto; line-height: 12.8px; margin: 0px; overflow: visible; text-align: left; text-align-last: auto; white-space-collapse: preserve-breaks;">services@guggenheiminvestments.com</span>
|
| Additional Information Website |
<span style="box-sizing: border-box; color: rgb(67, 67, 67); display: inline; flex-wrap: nowrap; font-size: 10.6667px; font-weight: 400; grid-area: auto; line-height: 12.8px; margin: 0px; overflow: visible; text-align: left; text-align-last: auto; white-space-collapse: preserve-breaks;">GuggenheimInvestments.com/mutual-funds/literature</span>
|
| Expenses [Text Block] |
What were the Fund's costs for the last year? * Based on a hypothetical $10,000 investment Table SummaryClass | Costs of a $10,000 Investment | Costs Paid as a % of a $10,000 Investment |
|---|
Class H | $156 | 1.63% |
|---|
Table Summary* | Excludes expenses of the underlying funds in which the fund invests, if any. |
|---|
|
| Expenses Paid, Amount |
$ 156
|
| Factors Affecting Performance [Text Block] |
What factors materially affected the Fund's performance over the last year? The sectors that contributed the most to the return of the underlying index were industrials, information technology, and energy. No sectors detracted from performance. The holdings that contributed the most to the return of the underlying index were Lumentum Holdings, Inc., Ciena Corp., and Coherent Corp. Those that detracted the most were Nutanix, Inc.—Class A, BellRing Brands, Inc., and Sprouts Farmers Market, Inc. The fund maintained a daily correlation of 98% to its benchmark of -100% of the daily price movement of the S&P MidCap 400 Index. |
| Line Graph [Table Text Block] |
Table Summary | Inverse Mid-Cap Strategy Fund (Class H) | S&P 500 Index | S&P MidCap 400 Index |
|---|
3/31/16 | $10,000 | $10,000 | $10,000 |
|---|
3/31/17 | $8,113 | $11,717 | $12,092 |
|---|
3/31/18 | $7,263 | $13,357 | $13,419 |
|---|
3/31/19 | $7,116 | $14,625 | $13,767 |
|---|
3/31/20 | $8,405 | $13,605 | $10,668 |
|---|
3/31/21 | $4,207 | $21,271 | $19,571 |
|---|
3/31/22 | $3,808 | $24,599 | $20,469 |
|---|
3/31/23 | $3,929 | $22,698 | $19,420 |
|---|
3/31/24 | $3,407 | $29,480 | $23,951 |
|---|
3/31/25 | $3,711 | $31,913 | $23,303 |
|---|
3/31/26 | $3,380 | $37,594 | $27,346 |
|---|
|
| Average Annual Return [Table Text Block] |
Table SummaryAverage Annual Total Returns | One Year | Five Years | Ten Years |
|---|
Class H | -8.93% | -4.29% | -10.28% |
|---|
S&P 500 Index | 17.80% | 12.06% | 14.16% |
|---|
S&P MidCap 400 Index | 17.35% | 6.92% | 10.58% |
|---|
|
| AssetsNet |
$ 231,901
|
| Holdings Count | Holding |
8
|
| Advisory Fees Paid, Amount |
$ 38,465
|
| InvestmentCompanyPortfolioTurnover |
0.00%
|
| Additional Fund Statistics [Text Block] |
Fund Statistics as of March 31, 2026 - Net Assets$231,901
- Total Number of Portfolio Holdings8
- Portfolio Turnover Rate-%
- Total Advisory Fees Paid$38,465
|
| Holdings [Text Block] |
Holdings DiversificationFootnote Reference1 (% of Net Assets) as of March 31, 2026 Table SummaryValue | Value |
|---|
OTC Equity Index Swap Agreements Sold Short | -100.8% | |
| Largest Holdings [Text Block] |
Largest HoldingsFootnote Reference2 (% of Net Assets) as of March 31, 2026 Table SummaryGuggenheim Strategy Fund II | 15.1% |
|---|
Guggenheim Ultra Short Duration Fund — Institutional Class | 13.6% |
|---|
Total | 28.7% |
|---|
|
| Material Fund Change [Text Block] |
|
| C000148763 |
|
| Shareholder Report [Line Items] |
|
| Fund Name |
Monthly Rebalance NASDAQ-100<sup style="inset: 1.5px 0px 4px; box-sizing: border-box; color: rgb(83, 40, 79); display: inline; flex-wrap: nowrap; font-size: 20px; font-weight: 700; grid-area: auto; line-height: 0px; margin: 0px; overflow: visible; position: relative; text-align: left; text-align-last: auto; white-space-collapse: preserve-breaks;">®</sup> 2x Strategy Fund
|
| Class Name |
Class A
|
| Trading Symbol |
RMQAX
|
| Annual or Semi-Annual Statement [Text Block] |
This annual shareholder report contains important information about the Monthly Rebalance NASDAQ-100® 2x Strategy Fund for the period from April 1, 2025 to March 31, 2026.
|
| Shareholder Report Annual or Semi-Annual |
Annual Shareholder Report
|
| Additional Information [Text Block] |
You can find additional information about the fund at GuggenheimInvestments.com/mutual-funds/literature. You can also request this information by contacting 800 820 0888 or services@guggenheiminvestments.com.
|
| Material Fund Change Notice [Text Block] |
This report describes changes to the fund that occurred during the reporting period.
|
| Additional Information Phone Number |
800 820 0888
|
| Additional Information Email |
<span style="box-sizing: border-box; color: rgb(67, 67, 67); display: inline; flex-wrap: nowrap; font-size: 10.6667px; font-weight: 400; grid-area: auto; line-height: 12.8px; margin: 0px; overflow: visible; text-align: left; text-align-last: auto; white-space-collapse: preserve-breaks;">services@guggenheiminvestments.com</span>
|
| Additional Information Website |
<span style="box-sizing: border-box; color: rgb(67, 67, 67); display: inline; flex-wrap: nowrap; font-size: 10.6667px; font-weight: 400; grid-area: auto; line-height: 12.8px; margin: 0px; overflow: visible; text-align: left; text-align-last: auto; white-space-collapse: preserve-breaks;">GuggenheimInvestments.com/mutual-funds/literature</span>
|
| Expenses [Text Block] |
What were the Fund's costs for the last year? * Based on a hypothetical $10,000 investment Table SummaryClass | Costs of a $10,000 Investment | Costs Paid as a % of a $10,000 Investment |
|---|
Class A | $157 | 1.30% |
|---|
Table Summary* | Excludes expenses of the underlying funds in which the fund invests, if any. |
|---|
|
| Expenses Paid, Amount |
$ 157
|
| Factors Affecting Performance [Text Block] |
What factors materially affected the Fund's performance over the last year? The sectors that contributed the most to the return of the underlying index were information technology, communication services, and consumer discretionary. The sectors that detracted the most were industrials, real estate, and financials. The holdings that contributed the most to the return of the underlying index were NVIDIA Corp., Broadcom, Inc., and Alphabet, Inc.—Class A. Those that detracted the most were T-Mobile US, Inc., Adobe, Inc., and Thomson Reuters Corp. The fund maintained a daily correlation of over 99% to its benchmark of 200% of the monthly price movement of the NASDAQ-100 Index. |
| Line Graph [Table Text Block] |
Table Summary | Monthly Rebalance NASDAQ-100® 2x Strategy Fund (Class A)‡ | S&P 500 Index | NASDAQ-100 Index |
|---|
3/31/16 | $9,525 | $10,000 | $10,000 |
|---|
3/31/17 | $13,872 | $11,717 | $12,277 |
|---|
3/31/18 | $19,815 | $13,357 | $15,026 |
|---|
3/31/19 | $23,529 | $14,625 | $17,033 |
|---|
3/31/20 | $24,837 | $13,605 | $18,229 |
|---|
3/31/21 | $65,777 | $21,271 | $30,786 |
|---|
3/31/22 | $81,222 | $24,599 | $35,139 |
|---|
3/31/23 | $56,534 | $22,698 | $31,502 |
|---|
3/31/24 | $99,931 | $29,480 | $43,992 |
|---|
3/31/25 | $103,268 | $31,913 | $46,824 |
|---|
3/31/26 | $145,871 | $37,594 | $58,059 |
|---|
|
| Average Annual Return [Table Text Block] |
Table SummaryAverage Annual Total Returns | One Year | Five Years | Ten Years |
|---|
Class A (without sales charge) | 41.26% | 17.27% | 31.38% |
|---|
Class A (with sales charge) ‡ | 34.54% | 16.13% | 30.74% |
|---|
S&P 500 Index | 17.80% | 12.06% | 14.16% |
|---|
NASDAQ-100 Index | 23.99% | 13.53% | 19.23% |
|---|
|
| AssetsNet |
$ 814,465,779
|
| Holdings Count | Holding |
116
|
| Advisory Fees Paid, Amount |
$ 3,004,184
|
| InvestmentCompanyPortfolioTurnover |
695.00%
|
| Additional Fund Statistics [Text Block] |
Fund Statistics as of March 31, 2026 - Net Assets$814,465,779
- Total Number of Portfolio Holdings116
- Portfolio Turnover Rate695%
- Total Advisory Fees Paid$3,004,184
|
| Holdings [Text Block] |
Holdings DiversificationFootnote Reference1 (% of Net Assets) as of March 31, 2026 Table SummaryValue | Value |
|---|
Other | 4.3% | Consumer, Non-cyclical | 7.1% | Consumer, Cyclical | 9.8% | Communications | 20.4% | Technology | 37.2% | Equity Futures Contracts Purchased | 57.3% | OTC Equity Index Swap Agreements | 64.3% | |
| Largest Holdings [Text Block] |
10 Largest HoldingsFootnote Reference2 (% of Net Assets) as of March 31, 2026 Table SummaryNVIDIA Corp. | 6.9% |
|---|
Apple, Inc. | 6.0% |
|---|
Microsoft Corp. | 4.4% |
|---|
Amazon.com, Inc. | 3.6% |
|---|
Tesla, Inc. | 3.0% |
|---|
Meta Platforms, Inc. — Class A | 2.7% |
|---|
Walmart, Inc. | 2.7% |
|---|
Alphabet, Inc. — Class A | 2.7% |
|---|
Alphabet, Inc. — Class C | 2.5% |
|---|
Broadcom, Inc. | 2.4% |
|---|
Total | 36.9% |
|---|
|
| Material Fund Change [Text Block] |
How has the Fund changed over the reporting period? This is a summary of certain changes to the fund since March 31, 2025. For more complete information, you may review the fund’s next prospectus, which we expect to be available by August 1, 2026 at GuggenheimInvestments.com/services/prospectuses-and-reports or, by contacting 800 820 0888 or services@guggenheiminvestments.com.
Effective December 15, 2025, the fund's (Class A shares) annual expense limit was contractually reduced to 1.34% from 1.35%. |
| C000148764 |
|
| Shareholder Report [Line Items] |
|
| Fund Name |
Monthly Rebalance NASDAQ-100<sup style="inset: 1.5px 0px 4px; box-sizing: border-box; color: rgb(83, 40, 79); display: inline; flex-wrap: nowrap; font-size: 20px; font-weight: 700; grid-area: auto; line-height: 0px; margin: 0px; overflow: visible; position: relative; text-align: left; text-align-last: auto; white-space-collapse: preserve-breaks;">®</sup> 2x Strategy Fund
|
| Class Name |
Class C
|
| Trading Symbol |
RMQCX
|
| Annual or Semi-Annual Statement [Text Block] |
This annual shareholder report contains important information about the Monthly Rebalance NASDAQ-100® 2x Strategy Fund for the period from April 1, 2025 to March 31, 2026.
|
| Shareholder Report Annual or Semi-Annual |
Annual Shareholder Report
|
| Additional Information [Text Block] |
You can find additional information about the fund at GuggenheimInvestments.com/mutual-funds/literature. You can also request this information by contacting 800 820 0888 or services@guggenheiminvestments.com.
|
| Material Fund Change Notice [Text Block] |
This report describes changes to the fund that occurred during the reporting period.
|
| Additional Information Phone Number |
800 820 0888
|
| Additional Information Email |
<span style="box-sizing: border-box; color: rgb(67, 67, 67); display: inline; flex-wrap: nowrap; font-size: 10.6667px; font-weight: 400; grid-area: auto; line-height: 12.8px; margin: 0px; overflow: visible; text-align: left; text-align-last: auto; white-space-collapse: preserve-breaks;">services@guggenheiminvestments.com</span>
|
| Additional Information Website |
<span style="box-sizing: border-box; color: rgb(67, 67, 67); display: inline; flex-wrap: nowrap; font-size: 10.6667px; font-weight: 400; grid-area: auto; line-height: 12.8px; margin: 0px; overflow: visible; text-align: left; text-align-last: auto; white-space-collapse: preserve-breaks;">GuggenheimInvestments.com/mutual-funds/literature</span>
|
| Expenses [Text Block] |
What were the Fund's costs for the last year? * Based on a hypothetical $10,000 investment Table SummaryClass | Costs of a $10,000 Investment | Costs Paid as a % of a $10,000 Investment |
|---|
Class C | $246 | 2.05% |
|---|
Table Summary* | Excludes expenses of the underlying funds in which the fund invests, if any. |
|---|
|
| Expenses Paid, Amount |
$ 246
|
| Factors Affecting Performance [Text Block] |
What factors materially affected the Fund's performance over the last year? The sectors that contributed the most to the return of the underlying index were information technology, communication services, and consumer discretionary. The sectors that detracted the most were industrials, real estate, and financials. The holdings that contributed the most to the return of the underlying index were NVIDIA Corp., Broadcom, Inc., and Alphabet, Inc.—Class A. Those that detracted the most were T-Mobile US, Inc., Adobe, Inc., and Thomson Reuters Corp. The fund maintained a daily correlation of over 99% to its benchmark of 200% of the monthly price movement of the NASDAQ-100 Index. |
| Line Graph [Table Text Block] |
Table Summary | Monthly Rebalance NASDAQ-100® 2x Strategy Fund (Class C) | S&P 500 Index | NASDAQ-100 Index |
|---|
3/31/16 | $10,000 | $10,000 | $10,000 |
|---|
3/31/17 | $14,452 | $11,717 | $12,277 |
|---|
3/31/18 | $20,496 | $13,357 | $15,026 |
|---|
3/31/19 | $24,156 | $14,625 | $17,033 |
|---|
3/31/20 | $25,308 | $13,605 | $18,229 |
|---|
3/31/21 | $66,524 | $21,271 | $30,786 |
|---|
3/31/22 | $81,530 | $24,599 | $35,139 |
|---|
3/31/23 | $56,289 | $22,698 | $31,502 |
|---|
3/31/24 | $98,756 | $29,480 | $43,992 |
|---|
3/31/25 | $101,291 | $31,913 | $46,824 |
|---|
3/31/26 | $142,006 | $37,594 | $58,059 |
|---|
|
| Average Annual Return [Table Text Block] |
Table SummaryAverage Annual Total Returns | One Year | Five Years | Ten Years |
|---|
Class C (without CDSC) | 40.20% | 16.38% | 30.39% |
|---|
Class C (with CDSC) ‡ | 39.22% | 16.38% | 30.39% |
|---|
S&P 500 Index | 17.80% | 12.06% | 14.16% |
|---|
NASDAQ-100 Index | 23.99% | 13.53% | 19.23% |
|---|
|
| AssetsNet |
$ 814,465,779
|
| Holdings Count | Holding |
116
|
| Advisory Fees Paid, Amount |
$ 3,004,184
|
| InvestmentCompanyPortfolioTurnover |
695.00%
|
| Additional Fund Statistics [Text Block] |
Fund Statistics as of March 31, 2026 - Net Assets$814,465,779
- Total Number of Portfolio Holdings116
- Portfolio Turnover Rate695%
- Total Advisory Fees Paid$3,004,184
|
| Holdings [Text Block] |
Holdings DiversificationFootnote Reference1 (% of Net Assets) as of March 31, 2026 Table SummaryValue | Value |
|---|
Other | 4.3% | Consumer, Non-cyclical | 7.1% | Consumer, Cyclical | 9.8% | Communications | 20.4% | Technology | 37.2% | Equity Futures Contracts Purchased | 57.3% | OTC Equity Index Swap Agreements | 64.3% | |
| Largest Holdings [Text Block] |
10 Largest HoldingsFootnote Reference2 (% of Net Assets) as of March 31, 2026 Table SummaryNVIDIA Corp. | 6.9% |
|---|
Apple, Inc. | 6.0% |
|---|
Microsoft Corp. | 4.4% |
|---|
Amazon.com, Inc. | 3.6% |
|---|
Tesla, Inc. | 3.0% |
|---|
Meta Platforms, Inc. — Class A | 2.7% |
|---|
Walmart, Inc. | 2.7% |
|---|
Alphabet, Inc. — Class A | 2.7% |
|---|
Alphabet, Inc. — Class C | 2.5% |
|---|
Broadcom, Inc. | 2.4% |
|---|
Total | 36.9% |
|---|
|
| Material Fund Change [Text Block] |
How has the Fund changed over the reporting period? This is a summary of certain changes to the fund since March 31, 2025. For more complete information, you may review the fund’s next prospectus, which we expect to be available by August 1, 2026 at GuggenheimInvestments.com/services/prospectuses-and-reports or, by contacting 800 820 0888 or services@guggenheiminvestments.com.
Effective December 15, 2025, the fund's (Class C shares) annual expense limit was contractually reduced to 2.09% from 2.10%. |
| C000148762 |
|
| Shareholder Report [Line Items] |
|
| Fund Name |
Monthly Rebalance NASDAQ-100<sup style="inset: 1.5px 0px 4px; box-sizing: border-box; color: rgb(83, 40, 79); display: inline; flex-wrap: nowrap; font-size: 20px; font-weight: 700; grid-area: auto; line-height: 0px; margin: 0px; overflow: visible; position: relative; text-align: left; text-align-last: auto; white-space-collapse: preserve-breaks;">®</sup> 2x Strategy Fund
|
| Class Name |
Class H
|
| Trading Symbol |
RMQHX
|
| Annual or Semi-Annual Statement [Text Block] |
This annual shareholder report contains important information about the Monthly Rebalance NASDAQ-100® 2x Strategy Fund for the period from April 1, 2025 to March 31, 2026.
|
| Shareholder Report Annual or Semi-Annual |
Annual Shareholder Report
|
| Additional Information [Text Block] |
You can find additional information about the fund at GuggenheimInvestments.com/mutual-funds/literature. You can also request this information by contacting 800 820 0888 or services@guggenheiminvestments.com.
|
| Material Fund Change Notice [Text Block] |
This report describes changes to the fund that occurred during the reporting period.
|
| Additional Information Phone Number |
800 820 0888
|
| Additional Information Email |
<span style="box-sizing: border-box; color: rgb(67, 67, 67); display: inline; flex-wrap: nowrap; font-size: 10.6667px; font-weight: 400; grid-area: auto; line-height: 12.8px; margin: 0px; overflow: visible; text-align: left; text-align-last: auto; white-space-collapse: preserve-breaks;">services@guggenheiminvestments.com</span>
|
| Additional Information Website |
<span style="box-sizing: border-box; color: rgb(67, 67, 67); display: inline; flex-wrap: nowrap; font-size: 10.6667px; font-weight: 400; grid-area: auto; line-height: 12.8px; margin: 0px; overflow: visible; text-align: left; text-align-last: auto; white-space-collapse: preserve-breaks;">GuggenheimInvestments.com/mutual-funds/literature</span>
|
| Expenses [Text Block] |
What were the Fund's costs for the last year? * Based on a hypothetical $10,000 investment Table SummaryClass | Costs of a $10,000 Investment | Costs Paid as a % of a $10,000 Investment |
|---|
Class H | $158 | 1.31% |
|---|
Table Summary* | Excludes expenses of the underlying funds in which the fund invests, if any. |
|---|
|
| Expenses Paid, Amount |
$ 158
|
| Factors Affecting Performance [Text Block] |
What factors materially affected the Fund's performance over the last year? The sectors that contributed the most to the return of the underlying index were information technology, communication services, and consumer discretionary. The sectors that detracted the most were industrials, real estate, and financials. The holdings that contributed the most to the return of the underlying index were NVIDIA Corp., Broadcom, Inc., and Alphabet, Inc.—Class A. Those that detracted the most were T-Mobile US, Inc., Adobe, Inc., and Thomson Reuters Corp. The fund maintained a daily correlation of over 99% to its benchmark of 200% of the monthly price movement of the NASDAQ-100 Index. |
| Line Graph [Table Text Block] |
Table Summary | Monthly Rebalance NASDAQ-100® 2x Strategy Fund (Class H) | S&P 500 Index | NASDAQ-100 Index |
|---|
3/31/16 | $10,000 | $10,000 | $10,000 |
|---|
3/31/17 | $14,564 | $11,717 | $12,277 |
|---|
3/31/18 | $20,803 | $13,357 | $15,026 |
|---|
3/31/19 | $24,700 | $14,625 | $17,033 |
|---|
3/31/20 | $26,061 | $13,605 | $18,229 |
|---|
3/31/21 | $69,014 | $21,271 | $30,786 |
|---|
3/31/22 | $85,205 | $24,599 | $35,139 |
|---|
3/31/23 | $59,267 | $22,698 | $31,502 |
|---|
3/31/24 | $104,746 | $29,480 | $43,992 |
|---|
3/31/25 | $108,224 | $31,913 | $46,824 |
|---|
3/31/26 | $152,845 | $37,594 | $58,059 |
|---|
|
| Average Annual Return [Table Text Block] |
Table SummaryAverage Annual Total Returns | One Year | Five Years | Ten Years |
|---|
Class H | 41.23% | 17.24% | 31.35% |
|---|
S&P 500 Index | 17.80% | 12.06% | 14.16% |
|---|
NASDAQ-100 Index | 23.99% | 13.53% | 19.23% |
|---|
|
| AssetsNet |
$ 814,465,779
|
| Holdings Count | Holding |
116
|
| Advisory Fees Paid, Amount |
$ 3,004,184
|
| InvestmentCompanyPortfolioTurnover |
695.00%
|
| Additional Fund Statistics [Text Block] |
Fund Statistics as of March 31, 2026 - Net Assets$814,465,779
- Total Number of Portfolio Holdings116
- Portfolio Turnover Rate695%
- Total Advisory Fees Paid$3,004,184
|
| Holdings [Text Block] |
Holdings DiversificationFootnote Reference1 (% of Net Assets) as of March 31, 2026 Table SummaryValue | Value |
|---|
Other | 4.3% | Consumer, Non-cyclical | 7.1% | Consumer, Cyclical | 9.8% | Communications | 20.4% | Technology | 37.2% | Equity Futures Contracts Purchased | 57.3% | OTC Equity Index Swap Agreements | 64.3% | |
| Largest Holdings [Text Block] |
10 Largest HoldingsFootnote Reference2 (% of Net Assets) as of March 31, 2026 Table SummaryNVIDIA Corp. | 6.9% |
|---|
Apple, Inc. | 6.0% |
|---|
Microsoft Corp. | 4.4% |
|---|
Amazon.com, Inc. | 3.6% |
|---|
Tesla, Inc. | 3.0% |
|---|
Meta Platforms, Inc. — Class A | 2.7% |
|---|
Walmart, Inc. | 2.7% |
|---|
Alphabet, Inc. — Class A | 2.7% |
|---|
Alphabet, Inc. — Class C | 2.5% |
|---|
Broadcom, Inc. | 2.4% |
|---|
Total | 36.9% |
|---|
|
| Material Fund Change [Text Block] |
How has the Fund changed over the reporting period? This is a summary of certain changes to the fund since March 31, 2025. For more complete information, you may review the fund’s next prospectus, which we expect to be available by August 1, 2026 at GuggenheimInvestments.com/services/prospectuses-and-reports or, by contacting 800 820 0888 or services@guggenheiminvestments.com.
Effective December 15, 2025, the fund's (Class H shares) annual expense limit was contractually reduced to 1.34% from 1.35%. |
| C000010338 |
|
| Shareholder Report [Line Items] |
|
| Fund Name |
NASDAQ-100<sup style="inset: 1.5px 0px 4px; box-sizing: border-box; color: rgb(83, 40, 79); display: inline; flex-wrap: nowrap; font-size: 20px; font-weight: 700; grid-area: auto; line-height: 0px; margin: 0px; overflow: visible; position: relative; text-align: left; text-align-last: auto; white-space-collapse: preserve-breaks;">®</sup> Fund
|
| Class Name |
Investor Class
|
| Trading Symbol |
RYOCX
|
| Annual or Semi-Annual Statement [Text Block] |
This annual shareholder report contains important information about the NASDAQ-100® Fund for the period from April 1, 2025 to March 31, 2026.
|
| Shareholder Report Annual or Semi-Annual |
Annual Shareholder Report
|
| Additional Information [Text Block] |
You can find additional information about the fund at GuggenheimInvestments.com/mutual-funds/literature. You can also request this information by contacting 800 820 0888 or services@guggenheiminvestments.com.
|
| Additional Information Phone Number |
800 820 0888
|
| Additional Information Email |
<span style="box-sizing: border-box; color: rgb(67, 67, 67); display: inline; flex-wrap: nowrap; font-size: 10.6667px; font-weight: 400; grid-area: auto; line-height: 12.8px; margin: 0px; overflow: visible; text-align: left; text-align-last: auto; white-space-collapse: preserve-breaks;">services@guggenheiminvestments.com</span>
|
| Additional Information Website |
<span style="box-sizing: border-box; color: rgb(67, 67, 67); display: inline; flex-wrap: nowrap; font-size: 10.6667px; font-weight: 400; grid-area: auto; line-height: 12.8px; margin: 0px; overflow: visible; text-align: left; text-align-last: auto; white-space-collapse: preserve-breaks;">GuggenheimInvestments.com/mutual-funds/literature</span>
|
| Expenses [Text Block] |
What were the Fund's costs for the last year? * Based on a hypothetical $10,000 investment Table SummaryClass | Costs of a $10,000 Investment | Costs Paid as a % of a $10,000 Investment |
|---|
Investor Class | $138 | 1.24% |
|---|
Table Summary* | Excludes expenses of the underlying funds in which the fund invests, if any. |
|---|
|
| Expenses Paid, Amount |
$ 138
|
| Factors Affecting Performance [Text Block] |
What factors materially affected the Fund's performance over the last year? The sectors that contributed the most to the return of the underlying index were information technology, communication services, and consumer discretionary. The sectors that detracted the most were industrials, real estate, and financials. The holdings that contributed the most to the return of the underlying index were NVIDIA Corp., Broadcom, Inc., and Alphabet, Inc.—Class A. Those that detracted the most were T-Mobile US, Inc., Adobe, Inc., and Thomson Reuters Corp. The fund maintained a daily correlation of over 99% to its benchmark of 100% of the daily price movement of the NASDAQ-100 Index. |
| Line Graph [Table Text Block] |
Table Summary | NASDAQ-100® Fund (Investor Class) | S&P 500 Index | NASDAQ-100 Index |
|---|
3/31/16 | $10,000 | $10,000 | $10,000 |
|---|
3/31/17 | $12,121 | $11,717 | $12,277 |
|---|
3/31/18 | $14,637 | $13,357 | $15,026 |
|---|
3/31/19 | $16,362 | $14,625 | $17,033 |
|---|
3/31/20 | $17,246 | $13,605 | $18,229 |
|---|
3/31/21 | $28,763 | $21,271 | $30,786 |
|---|
3/31/22 | $32,413 | $24,599 | $35,139 |
|---|
3/31/23 | $28,666 | $22,698 | $31,502 |
|---|
3/31/24 | $39,562 | $29,480 | $43,992 |
|---|
3/31/25 | $41,598 | $31,913 | $46,824 |
|---|
3/31/26 | $50,936 | $37,594 | $58,059 |
|---|
|
| Average Annual Return [Table Text Block] |
Table SummaryAverage Annual Total Returns | One Year | Five Years | Ten Years |
|---|
Investor Class | 22.45% | 12.11% | 17.68% |
|---|
S&P 500 Index | 17.80% | 12.06% | 14.16% |
|---|
NASDAQ-100 Index | 23.99% | 13.53% | 19.23% |
|---|
|
| AssetsNet |
$ 1,846,169,553
|
| Holdings Count | Holding |
112
|
| Advisory Fees Paid, Amount |
$ 12,805,369
|
| InvestmentCompanyPortfolioTurnover |
29.00%
|
| Additional Fund Statistics [Text Block] |
Fund Statistics as of March 31, 2026 - Net Assets$1,846,169,553
- Total Number of Portfolio Holdings112
- Portfolio Turnover Rate29%
- Total Advisory Fees Paid$12,805,369
|
| Holdings [Text Block] |
Holdings DiversificationFootnote Reference1 (% of Net Assets) as of March 31, 2026 Table SummaryValue | Value |
|---|
Other | 9.9% | Consumer, Non-cyclical | 8.5% | Consumer, Cyclical | 11.9% | Communications | 24.7% | Technology | 45.0% | |
| Largest Holdings [Text Block] |
10 Largest HoldingsFootnote Reference2 (% of Net Assets) as of March 31, 2026 Table SummaryNVIDIA Corp. | 8.3% |
|---|
Apple, Inc. | 7.3% |
|---|
Microsoft Corp. | 5.4% |
|---|
Amazon.com, Inc. | 4.4% |
|---|
Tesla, Inc. | 3.6% |
|---|
Meta Platforms, Inc. — Class A | 3.3% |
|---|
Walmart, Inc. | 3.3% |
|---|
Alphabet, Inc. — Class A | 3.3% |
|---|
Alphabet, Inc. — Class C | 3.1% |
|---|
Broadcom, Inc. | 2.9% |
|---|
Total | 44.9% |
|---|
|
| Material Fund Change [Text Block] |
|
| C000010340 |
|
| Shareholder Report [Line Items] |
|
| Fund Name |
NASDAQ-100<sup style="inset: 1.5px 0px 4px; box-sizing: border-box; color: rgb(83, 40, 79); display: inline; flex-wrap: nowrap; font-size: 20px; font-weight: 700; grid-area: auto; line-height: 0px; margin: 0px; overflow: visible; position: relative; text-align: left; text-align-last: auto; white-space-collapse: preserve-breaks;">®</sup> Fund
|
| Class Name |
Class A
|
| Trading Symbol |
RYATX
|
| Annual or Semi-Annual Statement [Text Block] |
This annual shareholder report contains important information about the NASDAQ-100® Fund for the period from April 1, 2025 to March 31, 2026.
|
| Shareholder Report Annual or Semi-Annual |
Annual Shareholder Report
|
| Additional Information [Text Block] |
You can find additional information about the fund at GuggenheimInvestments.com/mutual-funds/literature. You can also request this information by contacting 800 820 0888 or services@guggenheiminvestments.com.
|
| Additional Information Phone Number |
800 820 0888
|
| Additional Information Email |
<span style="box-sizing: border-box; color: rgb(67, 67, 67); display: inline; flex-wrap: nowrap; font-size: 10.6667px; font-weight: 400; grid-area: auto; line-height: 12.8px; margin: 0px; overflow: visible; text-align: left; text-align-last: auto; white-space-collapse: preserve-breaks;">services@guggenheiminvestments.com</span>
|
| Additional Information Website |
<span style="box-sizing: border-box; color: rgb(67, 67, 67); display: inline; flex-wrap: nowrap; font-size: 10.6667px; font-weight: 400; grid-area: auto; line-height: 12.8px; margin: 0px; overflow: visible; text-align: left; text-align-last: auto; white-space-collapse: preserve-breaks;">GuggenheimInvestments.com/mutual-funds/literature</span>
|
| Expenses [Text Block] |
What were the Fund's costs for the last year? * Based on a hypothetical $10,000 investment Table SummaryClass | Costs of a $10,000 Investment | Costs Paid as a % of a $10,000 Investment |
|---|
Class A | $166 | 1.49% |
|---|
Table Summary* | Excludes expenses of the underlying funds in which the fund invests, if any. |
|---|
|
| Expenses Paid, Amount |
$ 166
|
| Factors Affecting Performance [Text Block] |
What factors materially affected the Fund's performance over the last year? The sectors that contributed the most to the return of the underlying index were information technology, communication services, and consumer discretionary. The sectors that detracted the most were industrials, real estate, and financials. The holdings that contributed the most to the return of the underlying index were NVIDIA Corp., Broadcom, Inc., and Alphabet, Inc.—Class A. Those that detracted the most were T-Mobile US, Inc., Adobe, Inc., and Thomson Reuters Corp. The fund maintained a daily correlation of over 99% to its benchmark of 100% of the daily price movement of the NASDAQ-100 Index. |
| Line Graph [Table Text Block] |
Table Summary | NASDAQ-100® Fund (Class A)‡ | S&P 500 Index | NASDAQ-100 Index |
|---|
3/31/16 | $9,525 | $10,000 | $10,000 |
|---|
3/31/17 | $11,502 | $11,717 | $12,277 |
|---|
3/31/18 | $13,854 | $13,357 | $15,026 |
|---|
3/31/19 | $15,448 | $14,625 | $17,033 |
|---|
3/31/20 | $16,242 | $13,605 | $18,229 |
|---|
3/31/21 | $27,022 | $21,271 | $30,786 |
|---|
3/31/22 | $30,374 | $24,599 | $35,139 |
|---|
3/31/23 | $26,795 | $22,698 | $31,502 |
|---|
3/31/24 | $36,884 | $29,480 | $43,992 |
|---|
3/31/25 | $38,688 | $31,913 | $46,824 |
|---|
3/31/26 | $47,256 | $37,594 | $58,059 |
|---|
|
| Average Annual Return [Table Text Block] |
Table SummaryAverage Annual Total Returns | One Year | Five Years | Ten Years |
|---|
Class A (without sales charge) | 22.15% | 11.83% | 17.37% |
|---|
Class A (with sales charge) ‡ | 16.34% | 10.74% | 16.80% |
|---|
S&P 500 Index | 17.80% | 12.06% | 14.16% |
|---|
NASDAQ-100 Index | 23.99% | 13.53% | 19.23% |
|---|
|
| AssetsNet |
$ 1,846,169,553
|
| Holdings Count | Holding |
112
|
| Advisory Fees Paid, Amount |
$ 12,805,369
|
| InvestmentCompanyPortfolioTurnover |
29.00%
|
| Additional Fund Statistics [Text Block] |
Fund Statistics as of March 31, 2026 - Net Assets$1,846,169,553
- Total Number of Portfolio Holdings112
- Portfolio Turnover Rate29%
- Total Advisory Fees Paid$12,805,369
|
| Holdings [Text Block] |
Holdings DiversificationFootnote Reference1 (% of Net Assets) as of March 31, 2026 Table SummaryValue | Value |
|---|
Other | 9.9% | Consumer, Non-cyclical | 8.5% | Consumer, Cyclical | 11.9% | Communications | 24.7% | Technology | 45.0% | |
| Largest Holdings [Text Block] |
10 Largest HoldingsFootnote Reference2 (% of Net Assets) as of March 31, 2026 Table SummaryNVIDIA Corp. | 8.3% |
|---|
Apple, Inc. | 7.3% |
|---|
Microsoft Corp. | 5.4% |
|---|
Amazon.com, Inc. | 4.4% |
|---|
Tesla, Inc. | 3.6% |
|---|
Meta Platforms, Inc. — Class A | 3.3% |
|---|
Walmart, Inc. | 3.3% |
|---|
Alphabet, Inc. — Class A | 3.3% |
|---|
Alphabet, Inc. — Class C | 3.1% |
|---|
Broadcom, Inc. | 2.9% |
|---|
Total | 44.9% |
|---|
|
| Material Fund Change [Text Block] |
|
| C000010341 |
|
| Shareholder Report [Line Items] |
|
| Fund Name |
NASDAQ-100<sup style="inset: 1.5px 0px 4px; box-sizing: border-box; color: rgb(83, 40, 79); display: inline; flex-wrap: nowrap; font-size: 20px; font-weight: 700; grid-area: auto; line-height: 0px; margin: 0px; overflow: visible; position: relative; text-align: left; text-align-last: auto; white-space-collapse: preserve-breaks;">®</sup> Fund
|
| Class Name |
Class C
|
| Trading Symbol |
RYCOX
|
| Annual or Semi-Annual Statement [Text Block] |
This annual shareholder report contains important information about the NASDAQ-100® Fund for the period from April 1, 2025 to March 31, 2026.
|
| Shareholder Report Annual or Semi-Annual |
Annual Shareholder Report
|
| Additional Information [Text Block] |
You can find additional information about the fund at GuggenheimInvestments.com/mutual-funds/literature. You can also request this information by contacting 800 820 0888 or services@guggenheiminvestments.com.
|
| Additional Information Phone Number |
800 820 0888
|
| Additional Information Email |
<span style="box-sizing: border-box; color: rgb(67, 67, 67); display: inline; flex-wrap: nowrap; font-size: 10.6667px; font-weight: 400; grid-area: auto; line-height: 12.8px; margin: 0px; overflow: visible; text-align: left; text-align-last: auto; white-space-collapse: preserve-breaks;">services@guggenheiminvestments.com</span>
|
| Additional Information Website |
<span style="box-sizing: border-box; color: rgb(67, 67, 67); display: inline; flex-wrap: nowrap; font-size: 10.6667px; font-weight: 400; grid-area: auto; line-height: 12.8px; margin: 0px; overflow: visible; text-align: left; text-align-last: auto; white-space-collapse: preserve-breaks;">GuggenheimInvestments.com/mutual-funds/literature</span>
|
| Expenses [Text Block] |
What were the Fund's costs for the last year? * Based on a hypothetical $10,000 investment Table SummaryClass | Costs of a $10,000 Investment | Costs Paid as a % of a $10,000 Investment |
|---|
Class C | $248 | 2.24% |
|---|
Table Summary* | Excludes expenses of the underlying funds in which the fund invests, if any. |
|---|
|
| Expenses Paid, Amount |
$ 248
|
| Factors Affecting Performance [Text Block] |
What factors materially affected the Fund's performance over the last year? The sectors that contributed the most to the return of the underlying index were information technology, communication services, and consumer discretionary. The sectors that detracted the most were industrials, real estate, and financials. The holdings that contributed the most to the return of the underlying index were NVIDIA Corp., Broadcom, Inc., and Alphabet, Inc.—Class A. Those that detracted the most were T-Mobile US, Inc., Adobe, Inc., and Thomson Reuters Corp. The fund maintained a daily correlation of over 99% to its benchmark of 100% of the daily price movement of the NASDAQ-100 Index. |
| Line Graph [Table Text Block] |
Table Summary | NASDAQ-100® Fund (Class C) | S&P 500 Index | NASDAQ-100 Index |
|---|
3/31/16 | $10,000 | $10,000 | $10,000 |
|---|
3/31/17 | $11,998 | $11,717 | $12,277 |
|---|
3/31/18 | $14,345 | $13,357 | $15,026 |
|---|
3/31/19 | $15,881 | $14,625 | $17,033 |
|---|
3/31/20 | $16,565 | $13,605 | $18,229 |
|---|
3/31/21 | $27,361 | $21,271 | $30,786 |
|---|
3/31/22 | $30,526 | $24,599 | $35,139 |
|---|
3/31/23 | $26,725 | $22,698 | $31,502 |
|---|
3/31/24 | $36,522 | $29,480 | $43,992 |
|---|
3/31/25 | $38,019 | $31,913 | $46,824 |
|---|
3/31/26 | $46,086 | $37,594 | $58,059 |
|---|
|
| Average Annual Return [Table Text Block] |
Table SummaryAverage Annual Total Returns | One Year | Five Years | Ten Years |
|---|
Class C (without CDSC) | 21.22% | 10.99% | 16.51% |
|---|
Class C (with CDSC) ‡ | 20.22% | 10.99% | 16.51% |
|---|
S&P 500 Index | 17.80% | 12.06% | 14.16% |
|---|
NASDAQ-100 Index | 23.99% | 13.53% | 19.23% |
|---|
|
| AssetsNet |
$ 1,846,169,553
|
| Holdings Count | Holding |
112
|
| Advisory Fees Paid, Amount |
$ 12,805,369
|
| InvestmentCompanyPortfolioTurnover |
29.00%
|
| Additional Fund Statistics [Text Block] |
Fund Statistics as of March 31, 2026 - Net Assets$1,846,169,553
- Total Number of Portfolio Holdings112
- Portfolio Turnover Rate29%
- Total Advisory Fees Paid$12,805,369
|
| Holdings [Text Block] |
Holdings DiversificationFootnote Reference1 (% of Net Assets) as of March 31, 2026 Table SummaryValue | Value |
|---|
Other | 9.9% | Consumer, Non-cyclical | 8.5% | Consumer, Cyclical | 11.9% | Communications | 24.7% | Technology | 45.0% | |
| Largest Holdings [Text Block] |
10 Largest HoldingsFootnote Reference2 (% of Net Assets) as of March 31, 2026 Table SummaryNVIDIA Corp. | 8.3% |
|---|
Apple, Inc. | 7.3% |
|---|
Microsoft Corp. | 5.4% |
|---|
Amazon.com, Inc. | 4.4% |
|---|
Tesla, Inc. | 3.6% |
|---|
Meta Platforms, Inc. — Class A | 3.3% |
|---|
Walmart, Inc. | 3.3% |
|---|
Alphabet, Inc. — Class A | 3.3% |
|---|
Alphabet, Inc. — Class C | 3.1% |
|---|
Broadcom, Inc. | 2.9% |
|---|
Total | 44.9% |
|---|
|
| Material Fund Change [Text Block] |
|
| C000149025 |
|
| Shareholder Report [Line Items] |
|
| Fund Name |
NASDAQ-100<sup style="inset: 1.5px 0px 4px; box-sizing: border-box; color: rgb(83, 40, 79); display: inline; flex-wrap: nowrap; font-size: 20px; font-weight: 700; grid-area: auto; line-height: 0px; margin: 0px; overflow: visible; position: relative; text-align: left; text-align-last: auto; white-space-collapse: preserve-breaks;">®</sup> Fund
|
| Class Name |
Class H
|
| Trading Symbol |
RYHOX
|
| Annual or Semi-Annual Statement [Text Block] |
This annual shareholder report contains important information about the NASDAQ-100® Fund for the period from April 1, 2025 to March 31, 2026.
|
| Shareholder Report Annual or Semi-Annual |
Annual Shareholder Report
|
| Additional Information [Text Block] |
You can find additional information about the fund at GuggenheimInvestments.com/mutual-funds/literature. You can also request this information by contacting 800 820 0888 or services@guggenheiminvestments.com.
|
| Additional Information Phone Number |
800 820 0888
|
| Additional Information Email |
<span style="box-sizing: border-box; color: rgb(67, 67, 67); display: inline; flex-wrap: nowrap; font-size: 10.6667px; font-weight: 400; grid-area: auto; line-height: 12.8px; margin: 0px; overflow: visible; text-align: left; text-align-last: auto; white-space-collapse: preserve-breaks;">services@guggenheiminvestments.com</span>
|
| Additional Information Website |
<span style="box-sizing: border-box; color: rgb(67, 67, 67); display: inline; flex-wrap: nowrap; font-size: 10.6667px; font-weight: 400; grid-area: auto; line-height: 12.8px; margin: 0px; overflow: visible; text-align: left; text-align-last: auto; white-space-collapse: preserve-breaks;">GuggenheimInvestments.com/mutual-funds/literature</span>
|
| Expenses [Text Block] |
What were the Fund's costs for the last year? * Based on a hypothetical $10,000 investment Table SummaryClass | Costs of a $10,000 Investment | Costs Paid as a % of a $10,000 Investment |
|---|
Class H | $166 | 1.49% |
|---|
Table Summary* | Excludes expenses of the underlying funds in which the fund invests, if any. |
|---|
|
| Expenses Paid, Amount |
$ 166
|
| Factors Affecting Performance [Text Block] |
What factors materially affected the Fund's performance over the last year? The sectors that contributed the most to the return of the underlying index were information technology, communication services, and consumer discretionary. The sectors that detracted the most were industrials, real estate, and financials. The holdings that contributed the most to the return of the underlying index were NVIDIA Corp., Broadcom, Inc., and Alphabet, Inc.—Class A. Those that detracted the most were T-Mobile US, Inc., Adobe, Inc., and Thomson Reuters Corp. The fund maintained a daily correlation of over 99% to its benchmark of 100% of the daily price movement of the NASDAQ-100 Index. |
| Line Graph [Table Text Block] |
Table Summary | NASDAQ-100® Fund (Class H) | S&P 500 Index | NASDAQ-100 Index |
|---|
3/31/16 | $10,000 | $10,000 | $10,000 |
|---|
3/31/17 | $12,092 | $11,717 | $12,277 |
|---|
3/31/18 | $14,570 | $13,357 | $15,026 |
|---|
3/31/19 | $16,247 | $14,625 | $17,033 |
|---|
3/31/20 | $17,077 | $13,605 | $18,229 |
|---|
3/31/21 | $28,410 | $21,271 | $30,786 |
|---|
3/31/22 | $31,934 | $24,599 | $35,139 |
|---|
3/31/23 | $28,176 | $22,698 | $31,502 |
|---|
3/31/24 | $38,788 | $29,480 | $43,992 |
|---|
3/31/25 | $40,679 | $31,913 | $46,824 |
|---|
3/31/26 | $49,691 | $37,594 | $58,059 |
|---|
|
| Average Annual Return [Table Text Block] |
Table SummaryAverage Annual Total Returns | One Year | Five Years | Ten Years |
|---|
Class H | 22.16% | 11.83% | 17.39% |
|---|
S&P 500 Index | 17.80% | 12.06% | 14.16% |
|---|
NASDAQ-100 Index | 23.99% | 13.53% | 19.23% |
|---|
|
| AssetsNet |
$ 1,846,169,553
|
| Holdings Count | Holding |
112
|
| Advisory Fees Paid, Amount |
$ 12,805,369
|
| InvestmentCompanyPortfolioTurnover |
29.00%
|
| Additional Fund Statistics [Text Block] |
Fund Statistics as of March 31, 2026 - Net Assets$1,846,169,553
- Total Number of Portfolio Holdings112
- Portfolio Turnover Rate29%
- Total Advisory Fees Paid$12,805,369
|
| Holdings [Text Block] |
Holdings DiversificationFootnote Reference1 (% of Net Assets) as of March 31, 2026 Table SummaryValue | Value |
|---|
Other | 9.9% | Consumer, Non-cyclical | 8.5% | Consumer, Cyclical | 11.9% | Communications | 24.7% | Technology | 45.0% | |
| Largest Holdings [Text Block] |
10 Largest HoldingsFootnote Reference2 (% of Net Assets) as of March 31, 2026 Table SummaryNVIDIA Corp. | 8.3% |
|---|
Apple, Inc. | 7.3% |
|---|
Microsoft Corp. | 5.4% |
|---|
Amazon.com, Inc. | 4.4% |
|---|
Tesla, Inc. | 3.6% |
|---|
Meta Platforms, Inc. — Class A | 3.3% |
|---|
Walmart, Inc. | 3.3% |
|---|
Alphabet, Inc. — Class A | 3.3% |
|---|
Alphabet, Inc. — Class C | 3.1% |
|---|
Broadcom, Inc. | 2.9% |
|---|
Total | 44.9% |
|---|
|
| Material Fund Change [Text Block] |
|
| C000010342 |
|
| Shareholder Report [Line Items] |
|
| Fund Name |
Inverse NASDAQ-100<sup style="inset: 1.5px 0px 4px; box-sizing: border-box; color: rgb(83, 40, 79); display: inline; flex-wrap: nowrap; font-size: 20px; font-weight: 700; grid-area: auto; line-height: 0px; margin: 0px; overflow: visible; position: relative; text-align: left; text-align-last: auto; white-space-collapse: preserve-breaks;">®</sup> Strategy Fund
|
| Class Name |
Investor Class
|
| Trading Symbol |
RYAIX
|
| Annual or Semi-Annual Statement [Text Block] |
This annual shareholder report contains important information about the Inverse NASDAQ-100® Strategy Fund for the period from April 1, 2025 to March 31, 2026.
|
| Shareholder Report Annual or Semi-Annual |
Annual Shareholder Report
|
| Additional Information [Text Block] |
You can find additional information about the fund at GuggenheimInvestments.com/mutual-funds/literature. You can also request this information by contacting 800 820 0888 or services@guggenheiminvestments.com.
|
| Additional Information Phone Number |
800 820 0888
|
| Additional Information Email |
<span style="box-sizing: border-box; color: rgb(67, 67, 67); display: inline; flex-wrap: nowrap; font-size: 10.6667px; font-weight: 400; grid-area: auto; line-height: 12.8px; margin: 0px; overflow: visible; text-align: left; text-align-last: auto; white-space-collapse: preserve-breaks;">services@guggenheiminvestments.com</span>
|
| Additional Information Website |
<span style="box-sizing: border-box; color: rgb(67, 67, 67); display: inline; flex-wrap: nowrap; font-size: 10.6667px; font-weight: 400; grid-area: auto; line-height: 12.8px; margin: 0px; overflow: visible; text-align: left; text-align-last: auto; white-space-collapse: preserve-breaks;">GuggenheimInvestments.com/mutual-funds/literature</span>
|
| Expenses [Text Block] |
What were the Fund's costs for the last year? * Based on a hypothetical $10,000 investment Table SummaryClass | Costs of a $10,000 Investment | Costs Paid as a % of a $10,000 Investment |
|---|
Investor Class | $130 | 1.42% |
|---|
Table Summary* | Excludes expenses of the underlying funds in which the fund invests, if any. |
|---|
|
| Expenses Paid, Amount |
$ 130
|
| Factors Affecting Performance [Text Block] |
What factors materially affected the Fund's performance over the last year? The sectors that contributed the most to the return of the underlying index were information technology, communication services, and consumer discretionary. The sectors that detracted the most were industrials, real estate, and financials. The holdings that contributed the most to the return of the underlying index were NVIDIA Corp., Broadcom, Inc., and Alphabet, Inc.—Class A. Those that detracted the most were T-Mobile US, Inc., Adobe, Inc., and Thomson Reuters Corp. The fund maintained a daily correlation of over 99% to its benchmark of -100% of the daily price movement of the NASDAQ-100 Index. |
| Line Graph [Table Text Block] |
Table Summary | Inverse NASDAQ-100® Strategy Fund (Investor Class) | S&P 500 Index | NASDAQ-100 Index |
|---|
3/31/16 | $10,000 | $10,000 | $10,000 |
|---|
3/31/17 | $8,058 | $11,717 | $12,277 |
|---|
3/31/18 | $6,540 | $13,357 | $15,026 |
|---|
3/31/19 | $5,676 | $14,625 | $17,033 |
|---|
3/31/20 | $4,977 | $13,605 | $18,229 |
|---|
3/31/21 | $2,736 | $21,271 | $30,786 |
|---|
3/31/22 | $2,272 | $24,599 | $35,139 |
|---|
3/31/23 | $2,411 | $22,698 | $31,502 |
|---|
3/31/24 | $1,850 | $29,480 | $43,992 |
|---|
3/31/25 | $1,824 | $31,913 | $46,824 |
|---|
3/31/26 | $1,503 | $37,594 | $58,059 |
|---|
|
| Average Annual Return [Table Text Block] |
Table SummaryAverage Annual Total Returns | One Year | Five Years | Ten Years |
|---|
Investor Class | -17.59% | -11.29% | -17.26% |
|---|
S&P 500 Index | 17.80% | 12.06% | 14.16% |
|---|
NASDAQ-100 Index | 23.99% | 13.53% | 19.23% |
|---|
|
| AssetsNet |
$ 33,675,037
|
| Holdings Count | Holding |
17
|
| Advisory Fees Paid, Amount |
$ 167,869
|
| InvestmentCompanyPortfolioTurnover |
0.00%
|
| Additional Fund Statistics [Text Block] |
Fund Statistics as of March 31, 2026 - Net Assets$33,675,037
- Total Number of Portfolio Holdings17
- Portfolio Turnover Rate-%
- Total Advisory Fees Paid$167,869
|
| Holdings [Text Block] |
Holdings DiversificationFootnote Reference1 (% of Net Assets) as of March 31, 2026 Table SummaryValue | Value |
|---|
OTC Equity Index Swap Agreements Sold Short | -60.2% | Equity Futures Contracts Sold Short | -39.8% | |
| Largest Holdings [Text Block] |
Largest HoldingsFootnote Reference2 (% of Net Assets) as of March 31, 2026 Table SummaryGuggenheim Strategy Fund II | 3.6% |
|---|
Guggenheim Ultra Short Duration Fund — Institutional Class | 2.6% |
|---|
Total | 6.2% |
|---|
|
| Material Fund Change [Text Block] |
|
| C000010344 |
|
| Shareholder Report [Line Items] |
|
| Fund Name |
Inverse NASDAQ-100<sup style="inset: 1.5px 0px 4px; box-sizing: border-box; color: rgb(83, 40, 79); display: inline; flex-wrap: nowrap; font-size: 20px; font-weight: 700; grid-area: auto; line-height: 0px; margin: 0px; overflow: visible; position: relative; text-align: left; text-align-last: auto; white-space-collapse: preserve-breaks;">®</sup> Strategy Fund
|
| Class Name |
Class A
|
| Trading Symbol |
RYAPX
|
| Annual or Semi-Annual Statement [Text Block] |
This annual shareholder report contains important information about the Inverse NASDAQ-100® Strategy Fund for the period from April 1, 2025 to March 31, 2026.
|
| Shareholder Report Annual or Semi-Annual |
Annual Shareholder Report
|
| Additional Information [Text Block] |
You can find additional information about the fund at GuggenheimInvestments.com/mutual-funds/literature. You can also request this information by contacting 800 820 0888 or services@guggenheiminvestments.com.
|
| Additional Information Phone Number |
800 820 0888
|
| Additional Information Email |
<span style="box-sizing: border-box; color: rgb(67, 67, 67); display: inline; flex-wrap: nowrap; font-size: 10.6667px; font-weight: 400; grid-area: auto; line-height: 12.8px; margin: 0px; overflow: visible; text-align: left; text-align-last: auto; white-space-collapse: preserve-breaks;">services@guggenheiminvestments.com</span>
|
| Additional Information Website |
<span style="box-sizing: border-box; color: rgb(67, 67, 67); display: inline; flex-wrap: nowrap; font-size: 10.6667px; font-weight: 400; grid-area: auto; line-height: 12.8px; margin: 0px; overflow: visible; text-align: left; text-align-last: auto; white-space-collapse: preserve-breaks;">GuggenheimInvestments.com/mutual-funds/literature</span>
|
| Expenses [Text Block] |
What were the Fund's costs for the last year? * Based on a hypothetical $10,000 investment Table SummaryClass | Costs of a $10,000 Investment | Costs Paid as a % of a $10,000 Investment |
|---|
Class A | $153 | 1.68% |
|---|
Table Summary* | Excludes expenses of the underlying funds in which the fund invests, if any. |
|---|
|
| Expenses Paid, Amount |
$ 153
|
| Factors Affecting Performance [Text Block] |
What factors materially affected the Fund's performance over the last year? The sectors that contributed the most to the return of the underlying index were information technology, communication services, and consumer discretionary. The sectors that detracted the most were industrials, real estate, and financials. The holdings that contributed the most to the return of the underlying index were NVIDIA Corp., Broadcom, Inc., and Alphabet, Inc.—Class A. Those that detracted the most were T-Mobile US, Inc., Adobe, Inc., and Thomson Reuters Corp. The fund maintained a daily correlation of over 99% to its benchmark of -100% of the daily price movement of the NASDAQ-100 Index. |
| Line Graph [Table Text Block] |
Table Summary | Inverse NASDAQ-100® Strategy Fund (Class A)‡ | S&P 500 Index | NASDAQ-100 Index |
|---|
3/31/16 | $9,525 | $10,000 | $10,000 |
|---|
3/31/17 | $7,664 | $11,717 | $12,277 |
|---|
3/31/18 | $6,206 | $13,357 | $15,026 |
|---|
3/31/19 | $5,372 | $14,625 | $17,033 |
|---|
3/31/20 | $4,699 | $13,605 | $18,229 |
|---|
3/31/21 | $2,576 | $21,271 | $30,786 |
|---|
3/31/22 | $2,133 | $24,599 | $35,139 |
|---|
3/31/23 | $2,259 | $22,698 | $31,502 |
|---|
3/31/24 | $1,728 | $29,480 | $43,992 |
|---|
3/31/25 | $1,700 | $31,913 | $46,824 |
|---|
3/31/26 | $1,398 | $37,594 | $58,059 |
|---|
|
| Average Annual Return [Table Text Block] |
Table SummaryAverage Annual Total Returns | One Year | Five Years | Ten Years |
|---|
Class A (without sales charge) | -17.79% | -11.51% | -17.46% |
|---|
Class A (with sales charge) ‡ | -21.69% | -12.37% | -17.86% |
|---|
S&P 500 Index | 17.80% | 12.06% | 14.16% |
|---|
NASDAQ-100 Index | 23.99% | 13.53% | 19.23% |
|---|
|
| AssetsNet |
$ 33,675,037
|
| Holdings Count | Holding |
17
|
| Advisory Fees Paid, Amount |
$ 167,869
|
| InvestmentCompanyPortfolioTurnover |
0.00%
|
| Additional Fund Statistics [Text Block] |
Fund Statistics as of March 31, 2026 - Net Assets$33,675,037
- Total Number of Portfolio Holdings17
- Portfolio Turnover Rate-%
- Total Advisory Fees Paid$167,869
|
| Holdings [Text Block] |
Holdings DiversificationFootnote Reference1 (% of Net Assets) as of March 31, 2026 Table SummaryValue | Value |
|---|
OTC Equity Index Swap Agreements Sold Short | -60.2% | Equity Futures Contracts Sold Short | -39.8% | |
| Largest Holdings [Text Block] |
Largest HoldingsFootnote Reference2 (% of Net Assets) as of March 31, 2026 Table SummaryGuggenheim Strategy Fund II | 3.6% |
|---|
Guggenheim Ultra Short Duration Fund — Institutional Class | 2.6% |
|---|
Total | 6.2% |
|---|
|
| Material Fund Change [Text Block] |
|
| C000010345 |
|
| Shareholder Report [Line Items] |
|
| Fund Name |
Inverse NASDAQ-100<sup style="inset: 1.5px 0px 4px; box-sizing: border-box; color: rgb(83, 40, 79); display: inline; flex-wrap: nowrap; font-size: 20px; font-weight: 700; grid-area: auto; line-height: 0px; margin: 0px; overflow: visible; position: relative; text-align: left; text-align-last: auto; white-space-collapse: preserve-breaks;">®</sup> Strategy Fund
|
| Class Name |
Class C
|
| Trading Symbol |
RYACX
|
| Annual or Semi-Annual Statement [Text Block] |
This annual shareholder report contains important information about the Inverse NASDAQ-100® Strategy Fund for the period from April 1, 2025 to March 31, 2026.
|
| Shareholder Report Annual or Semi-Annual |
Annual Shareholder Report
|
| Additional Information [Text Block] |
You can find additional information about the fund at GuggenheimInvestments.com/mutual-funds/literature. You can also request this information by contacting 800 820 0888 or services@guggenheiminvestments.com.
|
| Additional Information Phone Number |
800 820 0888
|
| Additional Information Email |
<span style="box-sizing: border-box; color: rgb(67, 67, 67); display: inline; flex-wrap: nowrap; font-size: 10.6667px; font-weight: 400; grid-area: auto; line-height: 12.8px; margin: 0px; overflow: visible; text-align: left; text-align-last: auto; white-space-collapse: preserve-breaks;">services@guggenheiminvestments.com</span>
|
| Additional Information Website |
<span style="box-sizing: border-box; color: rgb(67, 67, 67); display: inline; flex-wrap: nowrap; font-size: 10.6667px; font-weight: 400; grid-area: auto; line-height: 12.8px; margin: 0px; overflow: visible; text-align: left; text-align-last: auto; white-space-collapse: preserve-breaks;">GuggenheimInvestments.com/mutual-funds/literature</span>
|
| Expenses [Text Block] |
What were the Fund's costs for the last year? * Based on a hypothetical $10,000 investment Table SummaryClass | Costs of a $10,000 Investment | Costs Paid as a % of a $10,000 Investment |
|---|
Class C | $220 | 2.42% |
|---|
Table Summary* | Excludes expenses of the underlying funds in which the fund invests, if any. |
|---|
|
| Expenses Paid, Amount |
$ 220
|
| Factors Affecting Performance [Text Block] |
What factors materially affected the Fund's performance over the last year? The sectors that contributed the most to the return of the underlying index were information technology, communication services, and consumer discretionary. The sectors that detracted the most were industrials, real estate, and financials. The holdings that contributed the most to the return of the underlying index were NVIDIA Corp., Broadcom, Inc., and Alphabet, Inc.—Class A. Those that detracted the most were T-Mobile US, Inc., Adobe, Inc., and Thomson Reuters Corp. The fund maintained a daily correlation of over 99% to its benchmark of -100% of the daily price movement of the NASDAQ-100 Index. |
| Line Graph [Table Text Block] |
Table Summary | Inverse NASDAQ-100® Strategy Fund (Class C) | S&P 500 Index | NASDAQ-100 Index |
|---|
3/31/16 | $10,000 | $10,000 | $10,000 |
|---|
3/31/17 | $7,974 | $11,717 | $12,277 |
|---|
3/31/18 | $6,410 | $13,357 | $15,026 |
|---|
3/31/19 | $5,505 | $14,625 | $17,033 |
|---|
3/31/20 | $4,779 | $13,605 | $18,229 |
|---|
3/31/21 | $2,601 | $21,271 | $30,786 |
|---|
3/31/22 | $2,136 | $24,599 | $35,139 |
|---|
3/31/23 | $2,246 | $22,698 | $31,502 |
|---|
3/31/24 | $1,706 | $29,480 | $43,992 |
|---|
3/31/25 | $1,666 | $31,913 | $46,824 |
|---|
3/31/26 | $1,359 | $37,594 | $58,059 |
|---|
|
| Average Annual Return [Table Text Block] |
Table SummaryAverage Annual Total Returns | One Year | Five Years | Ten Years |
|---|
Class C (without CDSC) | -18.40% | -12.17% | -18.09% |
|---|
Class C (with CDSC) ‡ | -19.19% | -12.17% | -18.09% |
|---|
S&P 500 Index | 17.80% | 12.06% | 14.16% |
|---|
NASDAQ-100 Index | 23.99% | 13.53% | 19.23% |
|---|
|
| AssetsNet |
$ 33,675,037
|
| Holdings Count | Holding |
17
|
| Advisory Fees Paid, Amount |
$ 167,869
|
| InvestmentCompanyPortfolioTurnover |
0.00%
|
| Additional Fund Statistics [Text Block] |
Fund Statistics as of March 31, 2026 - Net Assets$33,675,037
- Total Number of Portfolio Holdings17
- Portfolio Turnover Rate-%
- Total Advisory Fees Paid$167,869
|
| Holdings [Text Block] |
Holdings DiversificationFootnote Reference1 (% of Net Assets) as of March 31, 2026 Table SummaryValue | Value |
|---|
OTC Equity Index Swap Agreements Sold Short | -60.2% | Equity Futures Contracts Sold Short | -39.8% | |
| Largest Holdings [Text Block] |
Largest HoldingsFootnote Reference2 (% of Net Assets) as of March 31, 2026 Table SummaryGuggenheim Strategy Fund II | 3.6% |
|---|
Guggenheim Ultra Short Duration Fund — Institutional Class | 2.6% |
|---|
Total | 6.2% |
|---|
|
| Material Fund Change [Text Block] |
|
| C000149026 |
|
| Shareholder Report [Line Items] |
|
| Fund Name |
Inverse NASDAQ-100<sup style="inset: 1.5px 0px 4px; box-sizing: border-box; color: rgb(83, 40, 79); display: inline; flex-wrap: nowrap; font-size: 20px; font-weight: 700; grid-area: auto; line-height: 0px; margin: 0px; overflow: visible; position: relative; text-align: left; text-align-last: auto; white-space-collapse: preserve-breaks;">®</sup> Strategy Fund
|
| Class Name |
Class H
|
| Trading Symbol |
RYALX
|
| Annual or Semi-Annual Statement [Text Block] |
This annual shareholder report contains important information about the Inverse NASDAQ-100® Strategy Fund for the period from April 1, 2025 to March 31, 2026.
|
| Shareholder Report Annual or Semi-Annual |
Annual Shareholder Report
|
| Additional Information [Text Block] |
You can find additional information about the fund at GuggenheimInvestments.com/mutual-funds/literature. You can also request this information by contacting 800 820 0888 or services@guggenheiminvestments.com.
|
| Additional Information Phone Number |
800 820 0888
|
| Additional Information Email |
<span style="box-sizing: border-box; color: rgb(67, 67, 67); display: inline; flex-wrap: nowrap; font-size: 10.6667px; font-weight: 400; grid-area: auto; line-height: 12.8px; margin: 0px; overflow: visible; text-align: left; text-align-last: auto; white-space-collapse: preserve-breaks;">services@guggenheiminvestments.com</span>
|
| Additional Information Website |
<span style="box-sizing: border-box; color: rgb(67, 67, 67); display: inline; flex-wrap: nowrap; font-size: 10.6667px; font-weight: 400; grid-area: auto; line-height: 12.8px; margin: 0px; overflow: visible; text-align: left; text-align-last: auto; white-space-collapse: preserve-breaks;">GuggenheimInvestments.com/mutual-funds/literature</span>
|
| Expenses [Text Block] |
What were the Fund's costs for the last year? * Based on a hypothetical $10,000 investment Table SummaryClass | Costs of a $10,000 Investment | Costs Paid as a % of a $10,000 Investment |
|---|
Class H | $154 | 1.69% |
|---|
Table Summary* | Excludes expenses of the underlying funds in which the fund invests, if any. |
|---|
|
| Expenses Paid, Amount |
$ 154
|
| Factors Affecting Performance [Text Block] |
What factors materially affected the Fund's performance over the last year? The sectors that contributed the most to the return of the underlying index were information technology, communication services, and consumer discretionary. The sectors that detracted the most were industrials, real estate, and financials. The holdings that contributed the most to the return of the underlying index were NVIDIA Corp., Broadcom, Inc., and Alphabet, Inc.—Class A. Those that detracted the most were T-Mobile US, Inc., Adobe, Inc., and Thomson Reuters Corp. The fund maintained a daily correlation of over 99% to its benchmark of -100% of the daily price movement of the NASDAQ-100 Index. |
| Line Graph [Table Text Block] |
Table Summary | Inverse NASDAQ-100® Strategy Fund (Class H) | S&P 500 Index | NASDAQ-100 Index |
|---|
3/31/16 | $10,000 | $10,000 | $10,000 |
|---|
3/31/17 | $8,035 | $11,717 | $12,277 |
|---|
3/31/18 | $6,505 | $13,357 | $15,026 |
|---|
3/31/19 | $5,629 | $14,625 | $17,033 |
|---|
3/31/20 | $4,924 | $13,605 | $18,229 |
|---|
3/31/21 | $2,698 | $21,271 | $30,786 |
|---|
3/31/22 | $2,235 | $24,599 | $35,139 |
|---|
3/31/23 | $2,365 | $22,698 | $31,502 |
|---|
3/31/24 | $1,811 | $29,480 | $43,992 |
|---|
3/31/25 | $1,781 | $31,913 | $46,824 |
|---|
3/31/26 | $1,465 | $37,594 | $58,059 |
|---|
|
| Average Annual Return [Table Text Block] |
Table SummaryAverage Annual Total Returns | One Year | Five Years | Ten Years |
|---|
Class H | -17.78% | -11.50% | -17.48% |
|---|
S&P 500 Index | 17.80% | 12.06% | 14.16% |
|---|
NASDAQ-100 Index | 23.99% | 13.53% | 19.23% |
|---|
|
| AssetsNet |
$ 33,675,037
|
| Holdings Count | Holding |
17
|
| Advisory Fees Paid, Amount |
$ 167,869
|
| InvestmentCompanyPortfolioTurnover |
0.00%
|
| Additional Fund Statistics [Text Block] |
Fund Statistics as of March 31, 2026 - Net Assets$33,675,037
- Total Number of Portfolio Holdings17
- Portfolio Turnover Rate-%
- Total Advisory Fees Paid$167,869
|
| Holdings [Text Block] |
Holdings DiversificationFootnote Reference1 (% of Net Assets) as of March 31, 2026 Table SummaryValue | Value |
|---|
OTC Equity Index Swap Agreements Sold Short | -60.2% | Equity Futures Contracts Sold Short | -39.8% | |
| Largest Holdings [Text Block] |
Largest HoldingsFootnote Reference2 (% of Net Assets) as of March 31, 2026 Table SummaryGuggenheim Strategy Fund II | 3.6% |
|---|
Guggenheim Ultra Short Duration Fund — Institutional Class | 2.6% |
|---|
Total | 6.2% |
|---|
|
| Material Fund Change [Text Block] |
|
| C000010353 |
|
| Shareholder Report [Line Items] |
|
| Fund Name |
Russell 2000<sup style="inset: 1.5px 0px 4px; box-sizing: border-box; color: rgb(83, 40, 79); display: inline; flex-wrap: nowrap; font-size: 20px; font-weight: 700; grid-area: auto; line-height: 0px; margin: 0px; overflow: visible; position: relative; text-align: left; text-align-last: auto; white-space-collapse: preserve-breaks;">®</sup> 1.5X Strategy Fund
|
| Class Name |
Class A
|
| Trading Symbol |
RYAKX
|
| Annual or Semi-Annual Statement [Text Block] |
This annual shareholder report contains important information about the Russell 2000® 1.5X Strategy Fund for the period from April 1, 2025 to March 31, 2026.
|
| Shareholder Report Annual or Semi-Annual |
Annual Shareholder Report
|
| Additional Information [Text Block] |
You can find additional information about the fund at GuggenheimInvestments.com/mutual-funds/literature. You can also request this information by contacting 800 820 0888 or services@guggenheiminvestments.com.
|
| Additional Information Phone Number |
800 820 0888
|
| Additional Information Email |
<span style="box-sizing: border-box; color: rgb(67, 67, 67); display: inline; flex-wrap: nowrap; font-size: 10.6667px; font-weight: 400; grid-area: auto; line-height: 12.8px; margin: 0px; overflow: visible; text-align: left; text-align-last: auto; white-space-collapse: preserve-breaks;">services@guggenheiminvestments.com</span>
|
| Additional Information Website |
<span style="box-sizing: border-box; color: rgb(67, 67, 67); display: inline; flex-wrap: nowrap; font-size: 10.6667px; font-weight: 400; grid-area: auto; line-height: 12.8px; margin: 0px; overflow: visible; text-align: left; text-align-last: auto; white-space-collapse: preserve-breaks;">GuggenheimInvestments.com/mutual-funds/literature</span>
|
| Expenses [Text Block] |
What were the Fund's costs for the last year? * Based on a hypothetical $10,000 investment Table SummaryClass | Costs of a $10,000 Investment | Costs Paid as a % of a $10,000 Investment |
|---|
Class A | $195 | 1.68% |
|---|
Table Summary* | Excludes expenses of the underlying funds in which the fund invests, if any. |
|---|
|
| Expenses Paid, Amount |
$ 195
|
| Factors Affecting Performance [Text Block] |
What factors materially affected the Fund's performance over the last year? The sectors that contributed the most to the return of the underlying index were industrials, health care, and information technology. The sector that detracted the most was consumer staples. The holdings that contributed the most to performance were Bloom Energy Corp.—Class A, Fabrinet, EchoStar Corp.—Class A. Those that detracted the most were Corcept Therapeutics, Inc., SPS Commerce, Inc., and Commvault Systems, Inc. The fund maintained a daily correlation of over 99% to its benchmark of 150% of the daily price movement of the Russell 2000 Index. |
| Line Graph [Table Text Block] |
Table Summary | Russell 2000® 1.5X Strategy Fund (Class A)‡ | S&P 500 Index | Russell 2000 Index |
|---|
3/31/16 | $9,525 | $10,000 | $10,000 |
|---|
3/31/17 | $13,147 | $11,717 | $12,622 |
|---|
3/31/18 | $15,142 | $13,357 | $14,110 |
|---|
3/31/19 | $14,938 | $14,625 | $14,399 |
|---|
3/31/20 | $9,195 | $13,605 | $10,945 |
|---|
3/31/21 | $23,838 | $21,271 | $21,326 |
|---|
3/31/22 | $21,014 | $24,599 | $20,092 |
|---|
3/31/23 | $16,478 | $22,698 | $17,760 |
|---|
3/31/24 | $20,444 | $29,480 | $21,260 |
|---|
3/31/25 | $18,143 | $31,913 | $20,409 |
|---|
3/31/26 | $24,055 | $37,594 | $25,659 |
|---|
|
| Average Annual Return [Table Text Block] |
Table SummaryAverage Annual Total Returns | One Year | Five Years | Ten Years |
|---|
Class A (without sales charge) | 32.58% | 0.18% | 9.71% |
|---|
Class A (with sales charge) ‡ | 26.29% | -0.79% | 9.17% |
|---|
S&P 500 Index | 17.80% | 12.06% | 14.16% |
|---|
Russell 2000 Index | 25.73% | 3.77% | 9.88% |
|---|
|
| AssetsNet |
$ 6,039,307
|
| Holdings Count | Holding |
1,938
|
| Advisory Fees Paid, Amount |
$ 52,135
|
| InvestmentCompanyPortfolioTurnover |
10.00%
|
| Additional Fund Statistics [Text Block] |
Fund Statistics as of March 31, 2026 - Net Assets$6,039,307
- Total Number of Portfolio Holdings1,938
- Portfolio Turnover Rate10%
- Total Advisory Fees Paid$52,135
|
| Holdings [Text Block] |
Holdings DiversificationFootnote Reference1 (% of Net Assets) as of March 31, 2026 Table SummaryValue | Value |
|---|
Other | 12.5% | Technology | 5.4% | Consumer, Cyclical | 6.1% | Industrial | 12.2% | Consumer, Non-cyclical | 14.6% | Financial | 14.8% | OTC Equity Index Swap Agreements | 40.3% | Equity Futures Contracts Purchased | 43.7% | |
| Largest Holdings [Text Block] |
10 Largest HoldingsFootnote Reference2 (% of Net Assets) as of March 31, 2026 Table SummaryGuggenheim Strategy Fund II | 10.5% |
|---|
Guggenheim Ultra Short Duration Fund — Institutional Class | 7.0% |
|---|
Bloom Energy Corp. — Class A | 0.7% |
|---|
Coeur Mining, Inc. | 0.4% |
|---|
Fabrinet | 0.4% |
|---|
Nextpower, Inc. — Class A | 0.4% |
|---|
EchoStar Corp. — Class A | 0.4% |
|---|
Credo Technology Group Holding Ltd. | 0.3% |
|---|
Kratos Defense & Security Solutions, Inc. | 0.3% |
|---|
Advanced Energy Industries, Inc. | 0.3% |
|---|
Total | 20.7% |
|---|
|
| Material Fund Change [Text Block] |
|
| C000010354 |
|
| Shareholder Report [Line Items] |
|
| Fund Name |
Russell 2000<sup style="inset: 1.5px 0px 4px; box-sizing: border-box; color: rgb(83, 40, 79); display: inline; flex-wrap: nowrap; font-size: 20px; font-weight: 700; grid-area: auto; line-height: 0px; margin: 0px; overflow: visible; position: relative; text-align: left; text-align-last: auto; white-space-collapse: preserve-breaks;">®</sup> 1.5X Strategy Fund
|
| Class Name |
Class C
|
| Trading Symbol |
RYCMX
|
| Annual or Semi-Annual Statement [Text Block] |
This annual shareholder report contains important information about the Russell 2000® 1.5X Strategy Fund for the period from April 1, 2025 to March 31, 2026.
|
| Shareholder Report Annual or Semi-Annual |
Annual Shareholder Report
|
| Additional Information [Text Block] |
You can find additional information about the fund at GuggenheimInvestments.com/mutual-funds/literature. You can also request this information by contacting 800 820 0888 or services@guggenheiminvestments.com.
|
| Additional Information Phone Number |
800 820 0888
|
| Additional Information Email |
<span style="box-sizing: border-box; color: rgb(67, 67, 67); display: inline; flex-wrap: nowrap; font-size: 10.6667px; font-weight: 400; grid-area: auto; line-height: 12.8px; margin: 0px; overflow: visible; text-align: left; text-align-last: auto; white-space-collapse: preserve-breaks;">services@guggenheiminvestments.com</span>
|
| Additional Information Website |
<span style="box-sizing: border-box; color: rgb(67, 67, 67); display: inline; flex-wrap: nowrap; font-size: 10.6667px; font-weight: 400; grid-area: auto; line-height: 12.8px; margin: 0px; overflow: visible; text-align: left; text-align-last: auto; white-space-collapse: preserve-breaks;">GuggenheimInvestments.com/mutual-funds/literature</span>
|
| Expenses [Text Block] |
What were the Fund's costs for the last year? * Based on a hypothetical $10,000 investment Table SummaryClass | Costs of a $10,000 Investment | Costs Paid as a % of a $10,000 Investment |
|---|
Class C | $279 | 2.41% |
|---|
Table Summary* | Excludes expenses of the underlying funds in which the fund invests, if any. |
|---|
|
| Expenses Paid, Amount |
$ 279
|
| Factors Affecting Performance [Text Block] |
What factors materially affected the Fund's performance over the last year? The sectors that contributed the most to the return of the underlying index were industrials, health care, and information technology. The sector that detracted the most was consumer staples. The holdings that contributed the most to performance were Bloom Energy Corp.—Class A, Fabrinet, EchoStar Corp.—Class A. Those that detracted the most were Corcept Therapeutics, Inc., SPS Commerce, Inc., and Commvault Systems, Inc. The fund maintained a daily correlation of over 99% to its benchmark of 150% of the daily price movement of the Russell 2000 Index. |
| Line Graph [Table Text Block] |
Table Summary | Russell 2000® 1.5X Strategy Fund (Class C) | S&P 500 Index | Russell 2000 Index |
|---|
3/31/16 | $10,000 | $10,000 | $10,000 |
|---|
3/31/17 | $13,698 | $11,717 | $12,622 |
|---|
3/31/18 | $15,661 | $13,357 | $14,110 |
|---|
3/31/19 | $15,337 | $14,625 | $14,399 |
|---|
3/31/20 | $9,367 | $13,605 | $10,945 |
|---|
3/31/21 | $24,108 | $21,271 | $21,326 |
|---|
3/31/22 | $21,089 | $24,599 | $20,092 |
|---|
3/31/23 | $16,414 | $22,698 | $17,760 |
|---|
3/31/24 | $20,212 | $29,480 | $21,260 |
|---|
3/31/25 | $17,798 | $31,913 | $20,409 |
|---|
3/31/26 | $23,424 | $37,594 | $25,659 |
|---|
|
| Average Annual Return [Table Text Block] |
Table SummaryAverage Annual Total Returns | One Year | Five Years | Ten Years |
|---|
Class C (without CDSC) | 31.61% | -0.57% | 8.88% |
|---|
Class C (with CDSC) ‡ | 30.61% | -0.57% | 8.88% |
|---|
S&P 500 Index | 17.80% | 12.06% | 14.16% |
|---|
Russell 2000 Index | 25.73% | 3.77% | 9.88% |
|---|
|
| AssetsNet |
$ 6,039,307
|
| Holdings Count | Holding |
1,938
|
| Advisory Fees Paid, Amount |
$ 52,135
|
| InvestmentCompanyPortfolioTurnover |
10.00%
|
| Additional Fund Statistics [Text Block] |
Fund Statistics as of March 31, 2026 - Net Assets$6,039,307
- Total Number of Portfolio Holdings1,938
- Portfolio Turnover Rate10%
- Total Advisory Fees Paid$52,135
|
| Holdings [Text Block] |
Holdings DiversificationFootnote Reference1 (% of Net Assets) as of March 31, 2026 Table SummaryValue | Value |
|---|
Other | 12.5% | Technology | 5.4% | Consumer, Cyclical | 6.1% | Industrial | 12.2% | Consumer, Non-cyclical | 14.6% | Financial | 14.8% | OTC Equity Index Swap Agreements | 40.3% | Equity Futures Contracts Purchased | 43.7% | |
| Largest Holdings [Text Block] |
10 Largest HoldingsFootnote Reference2 (% of Net Assets) as of March 31, 2026 Table SummaryGuggenheim Strategy Fund II | 10.5% |
|---|
Guggenheim Ultra Short Duration Fund — Institutional Class | 7.0% |
|---|
Bloom Energy Corp. — Class A | 0.7% |
|---|
Coeur Mining, Inc. | 0.4% |
|---|
Fabrinet | 0.4% |
|---|
Nextpower, Inc. — Class A | 0.4% |
|---|
EchoStar Corp. — Class A | 0.4% |
|---|
Credo Technology Group Holding Ltd. | 0.3% |
|---|
Kratos Defense & Security Solutions, Inc. | 0.3% |
|---|
Advanced Energy Industries, Inc. | 0.3% |
|---|
Total | 20.7% |
|---|
|
| Material Fund Change [Text Block] |
|
| C000010352 |
|
| Shareholder Report [Line Items] |
|
| Fund Name |
Russell 2000<sup style="inset: 1.5px 0px 4px; box-sizing: border-box; color: rgb(83, 40, 79); display: inline; flex-wrap: nowrap; font-size: 20px; font-weight: 700; grid-area: auto; line-height: 0px; margin: 0px; overflow: visible; position: relative; text-align: left; text-align-last: auto; white-space-collapse: preserve-breaks;">®</sup> 1.5X Strategy Fund
|
| Class Name |
Class H
|
| Trading Symbol |
RYMKX
|
| Annual or Semi-Annual Statement [Text Block] |
This annual shareholder report contains important information about the Russell 2000® 1.5X Strategy Fund for the period from April 1, 2025 to March 31, 2026.
|
| Shareholder Report Annual or Semi-Annual |
Annual Shareholder Report
|
| Additional Information [Text Block] |
You can find additional information about the fund at GuggenheimInvestments.com/mutual-funds/literature. You can also request this information by contacting 800 820 0888 or services@guggenheiminvestments.com.
|
| Additional Information Phone Number |
800 820 0888
|
| Additional Information Email |
<span style="box-sizing: border-box; color: rgb(67, 67, 67); display: inline; flex-wrap: nowrap; font-size: 10.6667px; font-weight: 400; grid-area: auto; line-height: 12.8px; margin: 0px; overflow: visible; text-align: left; text-align-last: auto; white-space-collapse: preserve-breaks;">services@guggenheiminvestments.com</span>
|
| Additional Information Website |
<span style="box-sizing: border-box; color: rgb(67, 67, 67); display: inline; flex-wrap: nowrap; font-size: 10.6667px; font-weight: 400; grid-area: auto; line-height: 12.8px; margin: 0px; overflow: visible; text-align: left; text-align-last: auto; white-space-collapse: preserve-breaks;">GuggenheimInvestments.com/mutual-funds/literature</span>
|
| Expenses [Text Block] |
What were the Fund's costs for the last year? * Based on a hypothetical $10,000 investment Table SummaryClass | Costs of a $10,000 Investment | Costs Paid as a % of a $10,000 Investment |
|---|
Class H | $195 | 1.68% |
|---|
Table Summary* | Excludes expenses of the underlying funds in which the fund invests, if any. |
|---|
|
| Expenses Paid, Amount |
$ 195
|
| Factors Affecting Performance [Text Block] |
What factors materially affected the Fund's performance over the last year? The sectors that contributed the most to the return of the underlying index were industrials, health care, and information technology. The sector that detracted the most was consumer staples. The holdings that contributed the most to performance were Bloom Energy Corp.—Class A, Fabrinet, EchoStar Corp.—Class A. Those that detracted the most were Corcept Therapeutics, Inc., SPS Commerce, Inc., and Commvault Systems, Inc. The fund maintained a daily correlation of over 99% to its benchmark of 150% of the daily price movement of the Russell 2000 Index. |
| Line Graph [Table Text Block] |
Table Summary | Russell 2000® 1.5X Strategy Fund (Class H) | S&P 500 Index | Russell 2000 Index |
|---|
3/31/16 | $10,000 | $10,000 | $10,000 |
|---|
3/31/17 | $13,780 | $11,717 | $12,622 |
|---|
3/31/18 | $15,843 | $13,357 | $14,110 |
|---|
3/31/19 | $15,633 | $14,625 | $14,399 |
|---|
3/31/20 | $9,621 | $13,605 | $10,945 |
|---|
3/31/21 | $24,944 | $21,271 | $21,326 |
|---|
3/31/22 | $21,986 | $24,599 | $20,092 |
|---|
3/31/23 | $17,241 | $22,698 | $17,760 |
|---|
3/31/24 | $21,390 | $29,480 | $21,260 |
|---|
3/31/25 | $18,982 | $31,913 | $20,409 |
|---|
3/31/26 | $25,169 | $37,594 | $25,659 |
|---|
|
| Average Annual Return [Table Text Block] |
Table SummaryAverage Annual Total Returns | One Year | Five Years | Ten Years |
|---|
Class H | 32.60% | 0.18% | 9.67% |
|---|
S&P 500 Index | 17.80% | 12.06% | 14.16% |
|---|
Russell 2000 Index | 25.73% | 3.77% | 9.88% |
|---|
|
| AssetsNet |
$ 6,039,307
|
| Holdings Count | Holding |
1,938
|
| Advisory Fees Paid, Amount |
$ 52,135
|
| InvestmentCompanyPortfolioTurnover |
10.00%
|
| Additional Fund Statistics [Text Block] |
Fund Statistics as of March 31, 2026 - Net Assets$6,039,307
- Total Number of Portfolio Holdings1,938
- Portfolio Turnover Rate10%
- Total Advisory Fees Paid$52,135
|
| Holdings [Text Block] |
Holdings DiversificationFootnote Reference1 (% of Net Assets) as of March 31, 2026 Table SummaryValue | Value |
|---|
Other | 12.5% | Technology | 5.4% | Consumer, Cyclical | 6.1% | Industrial | 12.2% | Consumer, Non-cyclical | 14.6% | Financial | 14.8% | OTC Equity Index Swap Agreements | 40.3% | Equity Futures Contracts Purchased | 43.7% | |
| Largest Holdings [Text Block] |
10 Largest HoldingsFootnote Reference2 (% of Net Assets) as of March 31, 2026 Table SummaryGuggenheim Strategy Fund II | 10.5% |
|---|
Guggenheim Ultra Short Duration Fund — Institutional Class | 7.0% |
|---|
Bloom Energy Corp. — Class A | 0.7% |
|---|
Coeur Mining, Inc. | 0.4% |
|---|
Fabrinet | 0.4% |
|---|
Nextpower, Inc. — Class A | 0.4% |
|---|
EchoStar Corp. — Class A | 0.4% |
|---|
Credo Technology Group Holding Ltd. | 0.3% |
|---|
Kratos Defense & Security Solutions, Inc. | 0.3% |
|---|
Advanced Energy Industries, Inc. | 0.3% |
|---|
Total | 20.7% |
|---|
|
| Material Fund Change [Text Block] |
|
| C000033371 |
|
| Shareholder Report [Line Items] |
|
| Fund Name |
Russell 2000<sup style="inset: 1.5px 0px 4px; box-sizing: border-box; color: rgb(83, 40, 79); display: inline; flex-wrap: nowrap; font-size: 20px; font-weight: 700; grid-area: auto; line-height: 0px; margin: 0px; overflow: visible; position: relative; text-align: left; text-align-last: auto; white-space-collapse: preserve-breaks;">®</sup> Fund
|
| Class Name |
Class A
|
| Trading Symbol |
RYRRX
|
| Annual or Semi-Annual Statement [Text Block] |
This annual shareholder report contains important information about the Russell 2000® Fund for the period from April 1, 2025 to March 31, 2026.
|
| Shareholder Report Annual or Semi-Annual |
Annual Shareholder Report
|
| Additional Information [Text Block] |
You can find additional information about the fund at GuggenheimInvestments.com/mutual-funds/literature. You can also request this information by contacting 800 820 0888 or services@guggenheiminvestments.com.
|
| Additional Information Phone Number |
800 820 0888
|
| Additional Information Email |
<span style="box-sizing: border-box; color: rgb(67, 67, 67); display: inline; flex-wrap: nowrap; font-size: 10.6667px; font-weight: 400; grid-area: auto; line-height: 12.8px; margin: 0px; overflow: visible; text-align: left; text-align-last: auto; white-space-collapse: preserve-breaks;">services@guggenheiminvestments.com</span>
|
| Additional Information Website |
<span style="box-sizing: border-box; color: rgb(67, 67, 67); display: inline; flex-wrap: nowrap; font-size: 10.6667px; font-weight: 400; grid-area: auto; line-height: 12.8px; margin: 0px; overflow: visible; text-align: left; text-align-last: auto; white-space-collapse: preserve-breaks;">GuggenheimInvestments.com/mutual-funds/literature</span>
|
| Expenses [Text Block] |
What were the Fund's costs for the last year? * Based on a hypothetical $10,000 investment Table SummaryClass | Costs of a $10,000 Investment | Costs Paid as a % of a $10,000 Investment |
|---|
Class A | $181 | 1.62% |
|---|
Table Summary* | Excludes expenses of the underlying funds in which the fund invests, if any. |
|---|
|
| Expenses Paid, Amount |
$ 181
|
| Factors Affecting Performance [Text Block] |
What factors materially affected the Fund's performance over the last year? The sectors that contributed the most to the return of the underlying index were industrials, health care, and information technology. The sector that detracted the most was consumer staples. The holdings that contributed the most to performance were Bloom Energy Corp.—Class A, Fabrinet, EchoStar Corp.—Class A. Those that detracted the most were Corcept Therapeutics, Inc., SPS Commerce, Inc., and Commvault Systems, Inc. The fund maintained a daily correlation of over 99% to its benchmark of 100% of the daily price movement of the Russell 2000 Index. |
| Line Graph [Table Text Block] |
Table Summary | Russell 2000® Fund (Class A)‡ | S&P 500 Index | Russell 2000 Index |
|---|
3/31/16 | $9,525 | $10,000 | $10,000 |
|---|
3/31/17 | $11,808 | $11,717 | $12,622 |
|---|
3/31/18 | $12,992 | $13,357 | $14,110 |
|---|
3/31/19 | $13,034 | $14,625 | $14,399 |
|---|
3/31/20 | $9,733 | $13,605 | $10,945 |
|---|
3/31/21 | $18,664 | $21,271 | $21,326 |
|---|
3/31/22 | $17,302 | $24,599 | $20,092 |
|---|
3/31/23 | $15,055 | $22,698 | $17,760 |
|---|
3/31/24 | $17,731 | $29,480 | $21,260 |
|---|
3/31/25 | $16,743 | $31,913 | $20,409 |
|---|
3/31/26 | $20,658 | $37,594 | $25,659 |
|---|
|
| Average Annual Return [Table Text Block] |
Table SummaryAverage Annual Total Returns | One Year | Five Years | Ten Years |
|---|
Class A (without sales charge) | 23.39% | 2.05% | 8.05% |
|---|
Class A (with sales charge) ‡ | 17.51% | 1.06% | 7.52% |
|---|
S&P 500 Index | 17.80% | 12.06% | 14.16% |
|---|
Russell 2000 Index | 25.73% | 3.77% | 9.88% |
|---|
|
| AssetsNet |
$ 12,817,578
|
| Holdings Count | Holding |
1,943
|
| Advisory Fees Paid, Amount |
$ 93,091
|
| InvestmentCompanyPortfolioTurnover |
9.00%
|
| Additional Fund Statistics [Text Block] |
Fund Statistics as of March 31, 2026 - Net Assets$12,817,578
- Total Number of Portfolio Holdings1,943
- Portfolio Turnover Rate9%
- Total Advisory Fees Paid$93,091
|
| Holdings [Text Block] |
Holdings DiversificationFootnote Reference1 (% of Net Assets) as of March 31, 2026 Table SummaryValue | Value |
|---|
Other | 19.0% | Equity Futures Contracts Purchased | 3.9% | Industrial | 9.6% | Consumer, Non-cyclical | 11.5% | Financial | 11.7% | OTC Equity Index Swap Agreements | 19.7% | Exchange-Traded Funds | 24.6% | |
| Largest Holdings [Text Block] |
10 Largest HoldingsFootnote Reference2 (% of Net Assets) as of March 31, 2026 Table SummaryVanguard Russell 2000 ETF | 12.3% |
|---|
iShares Russell 2000 Index ETF | 12.3% |
|---|
Bloom Energy Corp. — Class A | 0.5% |
|---|
Coeur Mining, Inc. | 0.3% |
|---|
Fabrinet | 0.3% |
|---|
Nextpower, Inc. — Class A | 0.3% |
|---|
EchoStar Corp. — Class A | 0.3% |
|---|
Credo Technology Group Holding Ltd. | 0.3% |
|---|
Kratos Defense & Security Solutions, Inc. | 0.2% |
|---|
Advanced Energy Industries, Inc. | 0.2% |
|---|
Total | 27.0% |
|---|
|
| Material Fund Change [Text Block] |
|
| C000033372 |
|
| Shareholder Report [Line Items] |
|
| Fund Name |
Russell 2000<sup style="inset: 1.5px 0px 4px; box-sizing: border-box; color: rgb(83, 40, 79); display: inline; flex-wrap: nowrap; font-size: 20px; font-weight: 700; grid-area: auto; line-height: 0px; margin: 0px; overflow: visible; position: relative; text-align: left; text-align-last: auto; white-space-collapse: preserve-breaks;">®</sup> Fund
|
| Class Name |
Class C
|
| Trading Symbol |
RYROX
|
| Annual or Semi-Annual Statement [Text Block] |
This annual shareholder report contains important information about the Russell 2000® Fund for the period from April 1, 2025 to March 31, 2026.
|
| Shareholder Report Annual or Semi-Annual |
Annual Shareholder Report
|
| Additional Information [Text Block] |
You can find additional information about the fund at GuggenheimInvestments.com/mutual-funds/literature. You can also request this information by contacting 800 820 0888 or services@guggenheiminvestments.com.
|
| Additional Information Phone Number |
800 820 0888
|
| Additional Information Email |
<span style="box-sizing: border-box; color: rgb(67, 67, 67); display: inline; flex-wrap: nowrap; font-size: 10.6667px; font-weight: 400; grid-area: auto; line-height: 12.8px; margin: 0px; overflow: visible; text-align: left; text-align-last: auto; white-space-collapse: preserve-breaks;">services@guggenheiminvestments.com</span>
|
| Additional Information Website |
<span style="box-sizing: border-box; color: rgb(67, 67, 67); display: inline; flex-wrap: nowrap; font-size: 10.6667px; font-weight: 400; grid-area: auto; line-height: 12.8px; margin: 0px; overflow: visible; text-align: left; text-align-last: auto; white-space-collapse: preserve-breaks;">GuggenheimInvestments.com/mutual-funds/literature</span>
|
| Expenses [Text Block] |
What were the Fund's costs for the last year? * Based on a hypothetical $10,000 investment Table SummaryClass | Costs of a $10,000 Investment | Costs Paid as a % of a $10,000 Investment |
|---|
Class C | $265 | 2.38% |
|---|
Table Summary* | Excludes expenses of the underlying funds in which the fund invests, if any. |
|---|
|
| Expenses Paid, Amount |
$ 265
|
| Factors Affecting Performance [Text Block] |
What factors materially affected the Fund's performance over the last year? The sectors that contributed the most to the return of the underlying index were industrials, health care, and information technology. The sector that detracted the most was consumer staples. The holdings that contributed the most to performance were Bloom Energy Corp.—Class A, Fabrinet, EchoStar Corp.—Class A. Those that detracted the most were Corcept Therapeutics, Inc., SPS Commerce, Inc., and Commvault Systems, Inc. The fund maintained a daily correlation of over 99% to its benchmark of 100% of the daily price movement of the Russell 2000 Index. |
| Line Graph [Table Text Block] |
Table Summary | Russell 2000® Fund (Class C) | S&P 500 Index | Russell 2000 Index |
|---|
3/31/16 | $10,000 | $10,000 | $10,000 |
|---|
3/31/17 | $12,303 | $11,717 | $12,622 |
|---|
3/31/18 | $13,437 | $13,357 | $14,110 |
|---|
3/31/19 | $13,378 | $14,625 | $14,399 |
|---|
3/31/20 | $9,916 | $13,605 | $10,945 |
|---|
3/31/21 | $18,872 | $21,271 | $21,326 |
|---|
3/31/22 | $17,354 | $24,599 | $20,092 |
|---|
3/31/23 | $14,986 | $22,698 | $17,760 |
|---|
3/31/24 | $17,520 | $29,480 | $21,260 |
|---|
3/31/25 | $16,423 | $31,913 | $20,409 |
|---|
3/31/26 | $20,118 | $37,594 | $25,659 |
|---|
|
| Average Annual Return [Table Text Block] |
Table SummaryAverage Annual Total Returns | One Year | Five Years | Ten Years |
|---|
Class C (without CDSC) | 22.50% | 1.29% | 7.24% |
|---|
Class C (with CDSC) ‡ | 21.50% | 1.29% | 7.24% |
|---|
S&P 500 Index | 17.80% | 12.06% | 14.16% |
|---|
Russell 2000 Index | 25.73% | 3.77% | 9.88% |
|---|
|
| AssetsNet |
$ 12,817,578
|
| Holdings Count | Holding |
1,943
|
| Advisory Fees Paid, Amount |
$ 93,091
|
| InvestmentCompanyPortfolioTurnover |
9.00%
|
| Additional Fund Statistics [Text Block] |
Fund Statistics as of March 31, 2026 - Net Assets$12,817,578
- Total Number of Portfolio Holdings1,943
- Portfolio Turnover Rate9%
- Total Advisory Fees Paid$93,091
|
| Holdings [Text Block] |
Holdings DiversificationFootnote Reference1 (% of Net Assets) as of March 31, 2026 Table SummaryValue | Value |
|---|
Other | 19.0% | Equity Futures Contracts Purchased | 3.9% | Industrial | 9.6% | Consumer, Non-cyclical | 11.5% | Financial | 11.7% | OTC Equity Index Swap Agreements | 19.7% | Exchange-Traded Funds | 24.6% | |
| Largest Holdings [Text Block] |
10 Largest HoldingsFootnote Reference2 (% of Net Assets) as of March 31, 2026 Table SummaryVanguard Russell 2000 ETF | 12.3% |
|---|
iShares Russell 2000 Index ETF | 12.3% |
|---|
Bloom Energy Corp. — Class A | 0.5% |
|---|
Coeur Mining, Inc. | 0.3% |
|---|
Fabrinet | 0.3% |
|---|
Nextpower, Inc. — Class A | 0.3% |
|---|
EchoStar Corp. — Class A | 0.3% |
|---|
Credo Technology Group Holding Ltd. | 0.3% |
|---|
Kratos Defense & Security Solutions, Inc. | 0.2% |
|---|
Advanced Energy Industries, Inc. | 0.2% |
|---|
Total | 27.0% |
|---|
|
| Material Fund Change [Text Block] |
|
| C000033373 |
|
| Shareholder Report [Line Items] |
|
| Fund Name |
Russell 2000<sup style="inset: 1.5px 0px 4px; box-sizing: border-box; color: rgb(83, 40, 79); display: inline; flex-wrap: nowrap; font-size: 20px; font-weight: 700; grid-area: auto; line-height: 0px; margin: 0px; overflow: visible; position: relative; text-align: left; text-align-last: auto; white-space-collapse: preserve-breaks;">®</sup> Fund
|
| Class Name |
Class H
|
| Trading Symbol |
RYRHX
|
| Annual or Semi-Annual Statement [Text Block] |
This annual shareholder report contains important information about the Russell 2000® Fund for the period from April 1, 2025 to March 31, 2026.
|
| Shareholder Report Annual or Semi-Annual |
Annual Shareholder Report
|
| Additional Information [Text Block] |
You can find additional information about the fund at GuggenheimInvestments.com/mutual-funds/literature. You can also request this information by contacting 800 820 0888 or services@guggenheiminvestments.com.
|
| Additional Information Phone Number |
800 820 0888
|
| Additional Information Email |
<span style="box-sizing: border-box; color: rgb(67, 67, 67); display: inline; flex-wrap: nowrap; font-size: 10.6667px; font-weight: 400; grid-area: auto; line-height: 12.8px; margin: 0px; overflow: visible; text-align: left; text-align-last: auto; white-space-collapse: preserve-breaks;">services@guggenheiminvestments.com</span>
|
| Additional Information Website |
<span style="box-sizing: border-box; color: rgb(67, 67, 67); display: inline; flex-wrap: nowrap; font-size: 10.6667px; font-weight: 400; grid-area: auto; line-height: 12.8px; margin: 0px; overflow: visible; text-align: left; text-align-last: auto; white-space-collapse: preserve-breaks;">GuggenheimInvestments.com/mutual-funds/literature</span>
|
| Expenses [Text Block] |
What were the Fund's costs for the last year? * Based on a hypothetical $10,000 investment Table SummaryClass | Costs of a $10,000 Investment | Costs Paid as a % of a $10,000 Investment |
|---|
Class H | $181 | 1.62% |
|---|
Table Summary* | Excludes expenses of the underlying funds in which the fund invests, if any. |
|---|
|
| Expenses Paid, Amount |
$ 181
|
| Factors Affecting Performance [Text Block] |
What factors materially affected the Fund's performance over the last year? The sectors that contributed the most to the return of the underlying index were industrials, health care, and information technology. The sector that detracted the most was consumer staples. The holdings that contributed the most to performance were Bloom Energy Corp.—Class A, Fabrinet, EchoStar Corp.—Class A. Those that detracted the most were Corcept Therapeutics, Inc., SPS Commerce, Inc., and Commvault Systems, Inc. The fund maintained a daily correlation of over 99% to its benchmark of 100% of the daily price movement of the Russell 2000 Index. |
| Line Graph [Table Text Block] |
Table Summary | Russell 2000® Fund (Class H) | S&P 500 Index | Russell 2000 Index |
|---|
3/31/16 | $10,000 | $10,000 | $10,000 |
|---|
3/31/17 | $12,395 | $11,717 | $12,622 |
|---|
3/31/18 | $13,639 | $13,357 | $14,110 |
|---|
3/31/19 | $13,682 | $14,625 | $14,399 |
|---|
3/31/20 | $10,221 | $13,605 | $10,945 |
|---|
3/31/21 | $19,598 | $21,271 | $21,326 |
|---|
3/31/22 | $18,168 | $24,599 | $20,092 |
|---|
3/31/23 | $15,809 | $22,698 | $17,760 |
|---|
3/31/24 | $18,619 | $29,480 | $21,260 |
|---|
3/31/25 | $17,583 | $31,913 | $20,409 |
|---|
3/31/26 | $21,705 | $37,594 | $25,659 |
|---|
|
| Average Annual Return [Table Text Block] |
Table SummaryAverage Annual Total Returns | One Year | Five Years | Ten Years |
|---|
Class H | 23.44% | 2.06% | 8.06% |
|---|
S&P 500 Index | 17.80% | 12.06% | 14.16% |
|---|
Russell 2000 Index | 25.73% | 3.77% | 9.88% |
|---|
|
| AssetsNet |
$ 12,817,578
|
| Holdings Count | Holding |
1,943
|
| Advisory Fees Paid, Amount |
$ 93,091
|
| InvestmentCompanyPortfolioTurnover |
9.00%
|
| Additional Fund Statistics [Text Block] |
Fund Statistics as of March 31, 2026 - Net Assets$12,817,578
- Total Number of Portfolio Holdings1,943
- Portfolio Turnover Rate9%
- Total Advisory Fees Paid$93,091
|
| Holdings [Text Block] |
Holdings DiversificationFootnote Reference1 (% of Net Assets) as of March 31, 2026 Table SummaryValue | Value |
|---|
Other | 19.0% | Equity Futures Contracts Purchased | 3.9% | Industrial | 9.6% | Consumer, Non-cyclical | 11.5% | Financial | 11.7% | OTC Equity Index Swap Agreements | 19.7% | Exchange-Traded Funds | 24.6% | |
| Largest Holdings [Text Block] |
10 Largest HoldingsFootnote Reference2 (% of Net Assets) as of March 31, 2026 Table SummaryVanguard Russell 2000 ETF | 12.3% |
|---|
iShares Russell 2000 Index ETF | 12.3% |
|---|
Bloom Energy Corp. — Class A | 0.5% |
|---|
Coeur Mining, Inc. | 0.3% |
|---|
Fabrinet | 0.3% |
|---|
Nextpower, Inc. — Class A | 0.3% |
|---|
EchoStar Corp. — Class A | 0.3% |
|---|
Credo Technology Group Holding Ltd. | 0.3% |
|---|
Kratos Defense & Security Solutions, Inc. | 0.2% |
|---|
Advanced Energy Industries, Inc. | 0.2% |
|---|
Total | 27.0% |
|---|
|
| Material Fund Change [Text Block] |
|
| C000010458 |
|
| Shareholder Report [Line Items] |
|
| Fund Name |
Inverse Russell 2000<sup style="inset: 1.5px 0px 4px; box-sizing: border-box; color: rgb(83, 40, 79); display: inline; flex-wrap: nowrap; font-size: 20px; font-weight: 700; grid-area: auto; line-height: 0px; margin: 0px; overflow: visible; position: relative; text-align: left; text-align-last: auto; white-space-collapse: preserve-breaks;">®</sup> Strategy Fund
|
| Class Name |
Class A
|
| Trading Symbol |
RYAFX
|
| Annual or Semi-Annual Statement [Text Block] |
This annual shareholder report contains important information about the Inverse Russell 2000® Strategy Fund for the period from April 1, 2025 to March 31, 2026.
|
| Shareholder Report Annual or Semi-Annual |
Annual Shareholder Report
|
| Additional Information [Text Block] |
You can find additional information about the fund at GuggenheimInvestments.com/mutual-funds/literature. You can also request this information by contacting 800 820 0888 or services@guggenheiminvestments.com.
|
| Additional Information Phone Number |
800 820 0888
|
| Additional Information Email |
<span style="box-sizing: border-box; color: rgb(67, 67, 67); display: inline; flex-wrap: nowrap; font-size: 10.6667px; font-weight: 400; grid-area: auto; line-height: 12.8px; margin: 0px; overflow: visible; text-align: left; text-align-last: auto; white-space-collapse: preserve-breaks;">services@guggenheiminvestments.com</span>
|
| Additional Information Website |
<span style="box-sizing: border-box; color: rgb(67, 67, 67); display: inline; flex-wrap: nowrap; font-size: 10.6667px; font-weight: 400; grid-area: auto; line-height: 12.8px; margin: 0px; overflow: visible; text-align: left; text-align-last: auto; white-space-collapse: preserve-breaks;">GuggenheimInvestments.com/mutual-funds/literature</span>
|
| Expenses [Text Block] |
What were the Fund's costs for the last year? * Based on a hypothetical $10,000 investment Table SummaryClass | Costs of a $10,000 Investment | Costs Paid as a % of a $10,000 Investment |
|---|
Class A | $147 | 1.63% |
|---|
Table Summary* | Excludes expenses of the underlying funds in which the fund invests, if any. |
|---|
|
| Expenses Paid, Amount |
$ 147
|
| Factors Affecting Performance [Text Block] |
What factors materially affected the Fund's performance over the last year? The sectors that contributed the most to the return of the underlying index were industrials, health care, and information technology. The sector that detracted the most was consumer staples. The holdings that contributed the most to performance were Bloom Energy Corp.—Class A, Fabrinet, EchoStar Corp.—Class A. Those that detracted the most were Corcept Therapeutics, Inc., SPS Commerce, Inc., and Commvault Systems, Inc. The fund maintained a daily correlation of over 99% to its benchmark of -100% of the daily price movement of the Russell 2000 Index. |
| Line Graph [Table Text Block] |
Table Summary | Inverse Russell 2000® Strategy Fund (Class A)‡ | S&P 500 Index | Russell 2000 Index |
|---|
3/31/16 | $9,525 | $10,000 | $10,000 |
|---|
3/31/17 | $7,315 | $11,717 | $12,622 |
|---|
3/31/18 | $6,473 | $13,357 | $14,110 |
|---|
3/31/19 | $6,324 | $14,625 | $14,399 |
|---|
3/31/20 | $7,525 | $13,605 | $10,945 |
|---|
3/31/21 | $3,452 | $21,271 | $21,326 |
|---|
3/31/22 | $3,442 | $24,599 | $20,092 |
|---|
3/31/23 | $3,756 | $22,698 | $17,760 |
|---|
3/31/24 | $3,317 | $29,480 | $21,260 |
|---|
3/31/25 | $3,622 | $31,913 | $20,409 |
|---|
3/31/26 | $2,929 | $37,594 | $25,659 |
|---|
|
| Average Annual Return [Table Text Block] |
Table SummaryAverage Annual Total Returns | One Year | Five Years | Ten Years |
|---|
Class A (without sales charge) | -19.16% | -3.23% | -11.13% |
|---|
Class A (with sales charge) ‡ | -22.98% | -4.17% | -11.56% |
|---|
S&P 500 Index | 17.80% | 12.06% | 14.16% |
|---|
Russell 2000 Index | 25.73% | 3.77% | 9.88% |
|---|
|
| AssetsNet |
$ 3,848,848
|
| Holdings Count | Holding |
9
|
| Advisory Fees Paid, Amount |
$ 41,289
|
| InvestmentCompanyPortfolioTurnover |
0.00%
|
| Additional Fund Statistics [Text Block] |
Fund Statistics as of March 31, 2026 - Net Assets$3,848,848
- Total Number of Portfolio Holdings9
- Portfolio Turnover Rate-%
- Total Advisory Fees Paid$41,289
|
| Holdings [Text Block] |
Holdings DiversificationFootnote Reference1 (% of Net Assets) as of March 31, 2026 Table SummaryValue | Value |
|---|
OTC Equity Index Swap Agreements Sold Short | -64.6% | Equity Futures Contracts Sold Short | -35.9% | |
| Largest Holdings [Text Block] |
Largest HoldingsFootnote Reference2 (% of Net Assets) as of March 31, 2026 Table SummaryGuggenheim Ultra Short Duration Fund — Institutional Class | 9.0% |
|---|
Guggenheim Strategy Fund II | 8.9% |
|---|
Total | 17.9% |
|---|
|
| Material Fund Change [Text Block] |
|
| C000010459 |
|
| Shareholder Report [Line Items] |
|
| Fund Name |
Inverse Russell 2000<sup style="inset: 1.5px 0px 4px; box-sizing: border-box; color: rgb(83, 40, 79); display: inline; flex-wrap: nowrap; font-size: 20px; font-weight: 700; grid-area: auto; line-height: 0px; margin: 0px; overflow: visible; position: relative; text-align: left; text-align-last: auto; white-space-collapse: preserve-breaks;">®</sup> Strategy Fund
|
| Class Name |
Class C
|
| Trading Symbol |
RYCQX
|
| Annual or Semi-Annual Statement [Text Block] |
This annual shareholder report contains important information about the Inverse Russell 2000® Strategy Fund for the period from April 1, 2025 to March 31, 2026.
|
| Shareholder Report Annual or Semi-Annual |
Annual Shareholder Report
|
| Additional Information [Text Block] |
You can find additional information about the fund at GuggenheimInvestments.com/mutual-funds/literature. You can also request this information by contacting 800 820 0888 or services@guggenheiminvestments.com.
|
| Additional Information Phone Number |
800 820 0888
|
| Additional Information Email |
<span style="box-sizing: border-box; color: rgb(67, 67, 67); display: inline; flex-wrap: nowrap; font-size: 10.6667px; font-weight: 400; grid-area: auto; line-height: 12.8px; margin: 0px; overflow: visible; text-align: left; text-align-last: auto; white-space-collapse: preserve-breaks;">services@guggenheiminvestments.com</span>
|
| Additional Information Website |
<span style="box-sizing: border-box; color: rgb(67, 67, 67); display: inline; flex-wrap: nowrap; font-size: 10.6667px; font-weight: 400; grid-area: auto; line-height: 12.8px; margin: 0px; overflow: visible; text-align: left; text-align-last: auto; white-space-collapse: preserve-breaks;">GuggenheimInvestments.com/mutual-funds/literature</span>
|
| Expenses [Text Block] |
What were the Fund's costs for the last year? * Based on a hypothetical $10,000 investment Table SummaryClass | Costs of a $10,000 Investment | Costs Paid as a % of a $10,000 Investment |
|---|
Class C | $220 | 2.43% |
|---|
Table Summary* | Excludes expenses of the underlying funds in which the fund invests, if any. |
|---|
|
| Expenses Paid, Amount |
$ 220
|
| Factors Affecting Performance [Text Block] |
What factors materially affected the Fund's performance over the last year? The sectors that contributed the most to the return of the underlying index were industrials, health care, and information technology. The sector that detracted the most was consumer staples. The holdings that contributed the most to performance were Bloom Energy Corp.—Class A, Fabrinet, EchoStar Corp.—Class A. Those that detracted the most were Corcept Therapeutics, Inc., SPS Commerce, Inc., and Commvault Systems, Inc. The fund maintained a daily correlation of over 99% to its benchmark of -100% of the daily price movement of the Russell 2000 Index. |
| Line Graph [Table Text Block] |
Table Summary | Inverse Russell 2000® Strategy Fund (Class C) | S&P 500 Index | Russell 2000 Index |
|---|
3/31/16 | $10,000 | $10,000 | $10,000 |
|---|
3/31/17 | $7,627 | $11,717 | $12,622 |
|---|
3/31/18 | $6,694 | $13,357 | $14,110 |
|---|
3/31/19 | $6,487 | $14,625 | $14,399 |
|---|
3/31/20 | $7,670 | $13,605 | $10,945 |
|---|
3/31/21 | $3,490 | $21,271 | $21,326 |
|---|
3/31/22 | $3,455 | $24,599 | $20,092 |
|---|
3/31/23 | $3,740 | $22,698 | $17,760 |
|---|
3/31/24 | $3,279 | $29,480 | $21,260 |
|---|
3/31/25 | $3,560 | $31,913 | $20,409 |
|---|
3/31/26 | $2,898 | $37,594 | $25,659 |
|---|
|
| Average Annual Return [Table Text Block] |
Table SummaryAverage Annual Total Returns | One Year | Five Years | Ten Years |
|---|
Class C (without CDSC) | -18.59% | -3.65% | -11.65% |
|---|
Class C (with CDSC) ‡ | -19.34% | -3.65% | -11.65% |
|---|
S&P 500 Index | 17.80% | 12.06% | 14.16% |
|---|
Russell 2000 Index | 25.73% | 3.77% | 9.88% |
|---|
|
| AssetsNet |
$ 3,848,848
|
| Holdings Count | Holding |
9
|
| Advisory Fees Paid, Amount |
$ 41,289
|
| InvestmentCompanyPortfolioTurnover |
0.00%
|
| Additional Fund Statistics [Text Block] |
Fund Statistics as of March 31, 2026 - Net Assets$3,848,848
- Total Number of Portfolio Holdings9
- Portfolio Turnover Rate-%
- Total Advisory Fees Paid$41,289
|
| Holdings [Text Block] |
Holdings DiversificationFootnote Reference1 (% of Net Assets) as of March 31, 2026 Table SummaryValue | Value |
|---|
OTC Equity Index Swap Agreements Sold Short | -64.6% | Equity Futures Contracts Sold Short | -35.9% | |
| Largest Holdings [Text Block] |
Largest HoldingsFootnote Reference2 (% of Net Assets) as of March 31, 2026 Table SummaryGuggenheim Ultra Short Duration Fund — Institutional Class | 9.0% |
|---|
Guggenheim Strategy Fund II | 8.9% |
|---|
Total | 17.9% |
|---|
|
| Material Fund Change [Text Block] |
|
| C000010457 |
|
| Shareholder Report [Line Items] |
|
| Fund Name |
Inverse Russell 2000<sup style="inset: 1.5px 0px 4px; box-sizing: border-box; color: rgb(83, 40, 79); display: inline; flex-wrap: nowrap; font-size: 20px; font-weight: 700; grid-area: auto; line-height: 0px; margin: 0px; overflow: visible; position: relative; text-align: left; text-align-last: auto; white-space-collapse: preserve-breaks;">®</sup> Strategy Fund
|
| Class Name |
Class H
|
| Trading Symbol |
RYSHX
|
| Annual or Semi-Annual Statement [Text Block] |
This annual shareholder report contains important information about the Inverse Russell 2000® Strategy Fund for the period from April 1, 2025 to March 31, 2026.
|
| Shareholder Report Annual or Semi-Annual |
Annual Shareholder Report
|
| Additional Information [Text Block] |
You can find additional information about the fund at GuggenheimInvestments.com/mutual-funds/literature. You can also request this information by contacting 800 820 0888 or services@guggenheiminvestments.com.
|
| Additional Information Phone Number |
800 820 0888
|
| Additional Information Email |
<span style="box-sizing: border-box; color: rgb(67, 67, 67); display: inline; flex-wrap: nowrap; font-size: 10.6667px; font-weight: 400; grid-area: auto; line-height: 12.8px; margin: 0px; overflow: visible; text-align: left; text-align-last: auto; white-space-collapse: preserve-breaks;">services@guggenheiminvestments.com</span>
|
| Additional Information Website |
<span style="box-sizing: border-box; color: rgb(67, 67, 67); display: inline; flex-wrap: nowrap; font-size: 10.6667px; font-weight: 400; grid-area: auto; line-height: 12.8px; margin: 0px; overflow: visible; text-align: left; text-align-last: auto; white-space-collapse: preserve-breaks;">GuggenheimInvestments.com/mutual-funds/literature</span>
|
| Expenses [Text Block] |
What were the Fund's costs for the last year? * Based on a hypothetical $10,000 investment Table SummaryClass | Costs of a $10,000 Investment | Costs Paid as a % of a $10,000 Investment |
|---|
Class H | $150 | 1.66% |
|---|
Table Summary* | Excludes expenses of the underlying funds in which the fund invests, if any. |
|---|
|
| Expenses Paid, Amount |
$ 150
|
| Factors Affecting Performance [Text Block] |
What factors materially affected the Fund's performance over the last year? The sectors that contributed the most to the return of the underlying index were industrials, health care, and information technology. The sector that detracted the most was consumer staples. The holdings that contributed the most to performance were Bloom Energy Corp.—Class A, Fabrinet, EchoStar Corp.—Class A. Those that detracted the most were Corcept Therapeutics, Inc., SPS Commerce, Inc., and Commvault Systems, Inc. The fund maintained a daily correlation of over 99% to its benchmark of -100% of the daily price movement of the Russell 2000 Index. |
| Line Graph [Table Text Block] |
Table Summary | Inverse Russell 2000® Strategy Fund (Class H) | S&P 500 Index | Russell 2000 Index |
|---|
3/31/16 | $10,000 | $10,000 | $10,000 |
|---|
3/31/17 | $7,684 | $11,717 | $12,622 |
|---|
3/31/18 | $6,799 | $13,357 | $14,110 |
|---|
3/31/19 | $6,646 | $14,625 | $14,399 |
|---|
3/31/20 | $7,914 | $13,605 | $10,945 |
|---|
3/31/21 | $3,630 | $21,271 | $21,326 |
|---|
3/31/22 | $3,620 | $24,599 | $20,092 |
|---|
3/31/23 | $3,949 | $22,698 | $17,760 |
|---|
3/31/24 | $3,487 | $29,480 | $21,260 |
|---|
3/31/25 | $3,809 | $31,913 | $20,409 |
|---|
3/31/26 | $3,088 | $37,594 | $25,659 |
|---|
|
| Average Annual Return [Table Text Block] |
Table SummaryAverage Annual Total Returns | One Year | Five Years | Ten Years |
|---|
Class H | -18.92% | -3.18% | -11.09% |
|---|
S&P 500 Index | 17.80% | 12.06% | 14.16% |
|---|
Russell 2000 Index | 25.73% | 3.77% | 9.88% |
|---|
|
| AssetsNet |
$ 3,848,848
|
| Holdings Count | Holding |
9
|
| Advisory Fees Paid, Amount |
$ 41,289
|
| InvestmentCompanyPortfolioTurnover |
0.00%
|
| Additional Fund Statistics [Text Block] |
Fund Statistics as of March 31, 2026 - Net Assets$3,848,848
- Total Number of Portfolio Holdings9
- Portfolio Turnover Rate-%
- Total Advisory Fees Paid$41,289
|
| Holdings [Text Block] |
Holdings DiversificationFootnote Reference1 (% of Net Assets) as of March 31, 2026 Table SummaryValue | Value |
|---|
OTC Equity Index Swap Agreements Sold Short | -64.6% | Equity Futures Contracts Sold Short | -35.9% | |
| Largest Holdings [Text Block] |
Largest HoldingsFootnote Reference2 (% of Net Assets) as of March 31, 2026 Table SummaryGuggenheim Ultra Short Duration Fund — Institutional Class | 9.0% |
|---|
Guggenheim Strategy Fund II | 8.9% |
|---|
Total | 17.9% |
|---|
|
| Material Fund Change [Text Block] |
|
| C000010330 |
|
| Shareholder Report [Line Items] |
|
| Fund Name |
Nova Fund
|
| Class Name |
Investor Class
|
| Trading Symbol |
RYNVX
|
| Annual or Semi-Annual Statement [Text Block] |
This annual shareholder report contains important information about the Nova Fund for the period from April 1, 2025 to March 31, 2026.
|
| Shareholder Report Annual or Semi-Annual |
Annual Shareholder Report
|
| Additional Information [Text Block] |
You can find additional information about the fund at GuggenheimInvestments.com/mutual-funds/literature. You can also request this information by contacting 800 820 0888 or services@guggenheiminvestments.com.
|
| Additional Information Phone Number |
800 820 0888
|
| Additional Information Email |
<span style="box-sizing: border-box; color: rgb(67, 67, 67); display: inline; flex-wrap: nowrap; font-size: 10.6667px; font-weight: 400; grid-area: auto; line-height: 12.8px; margin: 0px; overflow: visible; text-align: left; text-align-last: auto; white-space-collapse: preserve-breaks;">services@guggenheiminvestments.com</span>
|
| Additional Information Website |
<span style="box-sizing: border-box; color: rgb(67, 67, 67); display: inline; flex-wrap: nowrap; font-size: 10.6667px; font-weight: 400; grid-area: auto; line-height: 12.8px; margin: 0px; overflow: visible; text-align: left; text-align-last: auto; white-space-collapse: preserve-breaks;">GuggenheimInvestments.com/mutual-funds/literature</span>
|
| Expenses [Text Block] |
What were the Fund's costs for the last year? * Based on a hypothetical $10,000 investment Table SummaryClass | Costs of a $10,000 Investment | Costs Paid as a % of a $10,000 Investment |
|---|
Investor Class | $146 | 1.32% |
|---|
Table Summary* | Excludes expenses of the underlying funds in which the fund invests, if any. |
|---|
|
| Expenses Paid, Amount |
$ 146
|
| Factors Affecting Performance [Text Block] |
What factors materially affected the Fund's performance over the last year? The sectors that contributed the most to the return of the underlying index were information technology, communication services, and industrials. The sector that detracted the most from performance was health care. The holdings that contributed the most to the return of the underlying index were NVIDIA Corp., Broadcom, Inc., and Alphabet, Inc.—Class A. Those that detracted the most were UnitedHealth Group, Inc., Berkshire Hathaway, Inc.—Class B, and Fiserv, Inc. The fund maintained a daily correlation of over 99% to its benchmark of 150% of the daily price movement of the S&P 500 Index. |
| Line Graph [Table Text Block] |
Table Summary | Nova Fund (Investor Class) | S&P 500 Index |
|---|
3/31/16 | $10,000 | $10,000 |
|---|
3/31/17 | $12,384 | $11,717 |
|---|
3/31/18 | $14,624 | $13,357 |
|---|
3/31/19 | $16,137 | $14,625 |
|---|
3/31/20 | $13,362 | $13,605 |
|---|
3/31/21 | $25,450 | $21,271 |
|---|
3/31/22 | $30,751 | $24,599 |
|---|
3/31/23 | $25,774 | $22,698 |
|---|
3/31/24 | $36,355 | $29,480 |
|---|
3/31/25 | $38,977 | $31,913 |
|---|
3/31/26 | $47,293 | $37,594 |
|---|
|
| Average Annual Return [Table Text Block] |
Table SummaryAverage Annual Total Returns | One Year | Five Years | Ten Years |
|---|
Investor Class | 21.34% | 13.19% | 16.81% |
|---|
S&P 500 Index | 17.80% | 12.06% | 14.16% |
|---|
|
| AssetsNet |
$ 207,430,220
|
| Holdings Count | Holding |
515
|
| Advisory Fees Paid, Amount |
$ 1,510,118
|
| InvestmentCompanyPortfolioTurnover |
583.00%
|
| Additional Fund Statistics [Text Block] |
Fund Statistics as of March 31, 2026 - Net Assets$207,430,220
- Total Number of Portfolio Holdings515
- Portfolio Turnover Rate583%
- Total Advisory Fees Paid$1,510,118
|
| Holdings [Text Block] |
Holdings DiversificationFootnote Reference1 (% of Net Assets) as of March 31, 2026 Table SummaryValue | Value |
|---|
Other | 6.2% | Consumer, Cyclical | 6.3% | Industrial | 6.6% | Financial | 10.5% | Consumer, Non-cyclical | 10.7% | Communications | 12.5% | Equity Futures Contracts Purchased | 23.3% | Technology | 23.5% | OTC Equity Index Swap Agreements | 50.2% | |
| Largest Holdings [Text Block] |
10 Largest HoldingsFootnote Reference2 (% of Net Assets) as of March 31, 2026 Table SummaryNVIDIA Corp. | 5.8% |
|---|
Apple, Inc. | 5.1% |
|---|
Microsoft Corp. | 3.8% |
|---|
Guggenheim Ultra Short Duration Fund — Institutional Class | 3.6% |
|---|
Amazon.com, Inc. | 2.8% |
|---|
Guggenheim Strategy Fund II | 2.7% |
|---|
Alphabet, Inc. — Class A | 2.3% |
|---|
Guggenheim Strategy Fund III | 2.2% |
|---|
Broadcom, Inc. | 2.0% |
|---|
Alphabet, Inc. — Class C | 1.8% |
|---|
Total | 32.1% |
|---|
|
| Material Fund Change [Text Block] |
|
| C000010332 |
|
| Shareholder Report [Line Items] |
|
| Fund Name |
Nova Fund
|
| Class Name |
Class A
|
| Trading Symbol |
RYANX
|
| Annual or Semi-Annual Statement [Text Block] |
This annual shareholder report contains important information about the Nova Fund for the period from April 1, 2025 to March 31, 2026.
|
| Shareholder Report Annual or Semi-Annual |
Annual Shareholder Report
|
| Additional Information [Text Block] |
You can find additional information about the fund at GuggenheimInvestments.com/mutual-funds/literature. You can also request this information by contacting 800 820 0888 or services@guggenheiminvestments.com.
|
| Additional Information Phone Number |
800 820 0888
|
| Additional Information Email |
<span style="box-sizing: border-box; color: rgb(67, 67, 67); display: inline; flex-wrap: nowrap; font-size: 10.6667px; font-weight: 400; grid-area: auto; line-height: 12.8px; margin: 0px; overflow: visible; text-align: left; text-align-last: auto; white-space-collapse: preserve-breaks;">services@guggenheiminvestments.com</span>
|
| Additional Information Website |
<span style="box-sizing: border-box; color: rgb(67, 67, 67); display: inline; flex-wrap: nowrap; font-size: 10.6667px; font-weight: 400; grid-area: auto; line-height: 12.8px; margin: 0px; overflow: visible; text-align: left; text-align-last: auto; white-space-collapse: preserve-breaks;">GuggenheimInvestments.com/mutual-funds/literature</span>
|
| Expenses [Text Block] |
What were the Fund's costs for the last year? * Based on a hypothetical $10,000 investment Table SummaryClass | Costs of a $10,000 Investment | Costs Paid as a % of a $10,000 Investment |
|---|
Class A | $172 | 1.56% |
|---|
Table Summary* | Excludes expenses of the underlying funds in which the fund invests, if any. |
|---|
|
| Expenses Paid, Amount |
$ 172
|
| Factors Affecting Performance [Text Block] |
What factors materially affected the Fund's performance over the last year? The sectors that contributed the most to the return of the underlying index were information technology, communication services, and industrials. The sector that detracted the most from performance was health care. The holdings that contributed the most to the return of the underlying index were NVIDIA Corp., Broadcom, Inc., and Alphabet, Inc.—Class A. Those that detracted the most were UnitedHealth Group, Inc., Berkshire Hathaway, Inc.—Class B, and Fiserv, Inc. The fund maintained a daily correlation of over 99% to its benchmark of 150% of the daily price movement of the S&P 500 Index. |
| Line Graph [Table Text Block] |
Table Summary | Nova Fund (Class A)‡ | S&P 500 Index |
|---|
3/31/16 | $9,525 | $10,000 |
|---|
3/31/17 | $11,770 | $11,717 |
|---|
3/31/18 | $13,850 | $13,357 |
|---|
3/31/19 | $15,254 | $14,625 |
|---|
3/31/20 | $12,603 | $13,605 |
|---|
3/31/21 | $23,945 | $21,271 |
|---|
3/31/22 | $28,863 | $24,599 |
|---|
3/31/23 | $24,124 | $22,698 |
|---|
3/31/24 | $33,956 | $29,480 |
|---|
3/31/25 | $36,315 | $31,913 |
|---|
3/31/26 | $43,943 | $37,594 |
|---|
|
| Average Annual Return [Table Text Block] |
Table SummaryAverage Annual Total Returns | One Year | Five Years | Ten Years |
|---|
Class A (without sales charge) | 21.00% | 12.91% | 16.52% |
|---|
Class A (with sales charge) ‡ | 15.26% | 11.82% | 15.96% |
|---|
S&P 500 Index | 17.80% | 12.06% | 14.16% |
|---|
|
| AssetsNet |
$ 207,430,220
|
| Holdings Count | Holding |
515
|
| Advisory Fees Paid, Amount |
$ 1,510,118
|
| InvestmentCompanyPortfolioTurnover |
583.00%
|
| Additional Fund Statistics [Text Block] |
Fund Statistics as of March 31, 2026 - Net Assets$207,430,220
- Total Number of Portfolio Holdings515
- Portfolio Turnover Rate583%
- Total Advisory Fees Paid$1,510,118
|
| Holdings [Text Block] |
Holdings DiversificationFootnote Reference1 (% of Net Assets) as of March 31, 2026 Table SummaryValue | Value |
|---|
Other | 6.2% | Consumer, Cyclical | 6.3% | Industrial | 6.6% | Financial | 10.5% | Consumer, Non-cyclical | 10.7% | Communications | 12.5% | Equity Futures Contracts Purchased | 23.3% | Technology | 23.5% | OTC Equity Index Swap Agreements | 50.2% | |
| Largest Holdings [Text Block] |
10 Largest HoldingsFootnote Reference2 (% of Net Assets) as of March 31, 2026 Table SummaryNVIDIA Corp. | 5.8% |
|---|
Apple, Inc. | 5.1% |
|---|
Microsoft Corp. | 3.8% |
|---|
Guggenheim Ultra Short Duration Fund — Institutional Class | 3.6% |
|---|
Amazon.com, Inc. | 2.8% |
|---|
Guggenheim Strategy Fund II | 2.7% |
|---|
Alphabet, Inc. — Class A | 2.3% |
|---|
Guggenheim Strategy Fund III | 2.2% |
|---|
Broadcom, Inc. | 2.0% |
|---|
Alphabet, Inc. — Class C | 1.8% |
|---|
Total | 32.1% |
|---|
|
| Material Fund Change [Text Block] |
|
| C000010333 |
|
| Shareholder Report [Line Items] |
|
| Fund Name |
Nova Fund
|
| Class Name |
Class C
|
| Trading Symbol |
RYNCX
|
| Annual or Semi-Annual Statement [Text Block] |
This annual shareholder report contains important information about the Nova Fund for the period from April 1, 2025 to March 31, 2026.
|
| Shareholder Report Annual or Semi-Annual |
Annual Shareholder Report
|
| Additional Information [Text Block] |
You can find additional information about the fund at GuggenheimInvestments.com/mutual-funds/literature. You can also request this information by contacting 800 820 0888 or services@guggenheiminvestments.com.
|
| Additional Information Phone Number |
800 820 0888
|
| Additional Information Email |
<span style="box-sizing: border-box; color: rgb(67, 67, 67); display: inline; flex-wrap: nowrap; font-size: 10.6667px; font-weight: 400; grid-area: auto; line-height: 12.8px; margin: 0px; overflow: visible; text-align: left; text-align-last: auto; white-space-collapse: preserve-breaks;">services@guggenheiminvestments.com</span>
|
| Additional Information Website |
<span style="box-sizing: border-box; color: rgb(67, 67, 67); display: inline; flex-wrap: nowrap; font-size: 10.6667px; font-weight: 400; grid-area: auto; line-height: 12.8px; margin: 0px; overflow: visible; text-align: left; text-align-last: auto; white-space-collapse: preserve-breaks;">GuggenheimInvestments.com/mutual-funds/literature</span>
|
| Expenses [Text Block] |
What were the Fund's costs for the last year? * Based on a hypothetical $10,000 investment Table SummaryClass | Costs of a $10,000 Investment | Costs Paid as a % of a $10,000 Investment |
|---|
Class C | $255 | 2.32% |
|---|
Table Summary* | Excludes expenses of the underlying funds in which the fund invests, if any. |
|---|
|
| Expenses Paid, Amount |
$ 255
|
| Factors Affecting Performance [Text Block] |
What factors materially affected the Fund's performance over the last year? The sectors that contributed the most to the return of the underlying index were information technology, communication services, and industrials. The sector that detracted the most from performance was health care. The holdings that contributed the most to the return of the underlying index were NVIDIA Corp., Broadcom, Inc., and Alphabet, Inc.—Class A. Those that detracted the most were UnitedHealth Group, Inc., Berkshire Hathaway, Inc.—Class B, and Fiserv, Inc. The fund maintained a daily correlation of over 99% to its benchmark of 150% of the daily price movement of the S&P 500 Index. |
| Line Graph [Table Text Block] |
Table Summary | Nova Fund (Class C) | S&P 500 Index |
|---|
3/31/16 | $10,000 | $10,000 |
|---|
3/31/17 | $12,260 | $11,717 |
|---|
3/31/18 | $14,345 | $13,357 |
|---|
3/31/19 | $15,681 | $14,625 |
|---|
3/31/20 | $12,855 | $13,605 |
|---|
3/31/21 | $24,240 | $21,271 |
|---|
3/31/22 | $29,001 | $24,599 |
|---|
3/31/23 | $24,060 | $22,698 |
|---|
3/31/24 | $33,612 | $29,480 |
|---|
3/31/25 | $35,677 | $31,913 |
|---|
3/31/26 | $42,849 | $37,594 |
|---|
|
| Average Annual Return [Table Text Block] |
Table SummaryAverage Annual Total Returns | One Year | Five Years | Ten Years |
|---|
Class C (without CDSC) | 20.10% | 12.07% | 15.66% |
|---|
Class C (with CDSC) ‡ | 19.10% | 12.07% | 15.66% |
|---|
S&P 500 Index | 17.80% | 12.06% | 14.16% |
|---|
|
| AssetsNet |
$ 207,430,220
|
| Holdings Count | Holding |
515
|
| Advisory Fees Paid, Amount |
$ 1,510,118
|
| InvestmentCompanyPortfolioTurnover |
583.00%
|
| Additional Fund Statistics [Text Block] |
Fund Statistics as of March 31, 2026 - Net Assets$207,430,220
- Total Number of Portfolio Holdings515
- Portfolio Turnover Rate583%
- Total Advisory Fees Paid$1,510,118
|
| Holdings [Text Block] |
Holdings DiversificationFootnote Reference1 (% of Net Assets) as of March 31, 2026 Table SummaryValue | Value |
|---|
Other | 6.2% | Consumer, Cyclical | 6.3% | Industrial | 6.6% | Financial | 10.5% | Consumer, Non-cyclical | 10.7% | Communications | 12.5% | Equity Futures Contracts Purchased | 23.3% | Technology | 23.5% | OTC Equity Index Swap Agreements | 50.2% | |
| Largest Holdings [Text Block] |
10 Largest HoldingsFootnote Reference2 (% of Net Assets) as of March 31, 2026 Table SummaryNVIDIA Corp. | 5.8% |
|---|
Apple, Inc. | 5.1% |
|---|
Microsoft Corp. | 3.8% |
|---|
Guggenheim Ultra Short Duration Fund — Institutional Class | 3.6% |
|---|
Amazon.com, Inc. | 2.8% |
|---|
Guggenheim Strategy Fund II | 2.7% |
|---|
Alphabet, Inc. — Class A | 2.3% |
|---|
Guggenheim Strategy Fund III | 2.2% |
|---|
Broadcom, Inc. | 2.0% |
|---|
Alphabet, Inc. — Class C | 1.8% |
|---|
Total | 32.1% |
|---|
|
| Material Fund Change [Text Block] |
|
| C000149023 |
|
| Shareholder Report [Line Items] |
|
| Fund Name |
Nova Fund
|
| Class Name |
Class H
|
| Trading Symbol |
RYNHX
|
| Annual or Semi-Annual Statement [Text Block] |
This annual shareholder report contains important information about the Nova Fund for the period from April 1, 2025 to March 31, 2026.
|
| Shareholder Report Annual or Semi-Annual |
Annual Shareholder Report
|
| Additional Information [Text Block] |
You can find additional information about the fund at GuggenheimInvestments.com/mutual-funds/literature. You can also request this information by contacting 800 820 0888 or services@guggenheiminvestments.com.
|
| Additional Information Phone Number |
800 820 0888
|
| Additional Information Email |
<span style="box-sizing: border-box; color: rgb(67, 67, 67); display: inline; flex-wrap: nowrap; font-size: 10.6667px; font-weight: 400; grid-area: auto; line-height: 12.8px; margin: 0px; overflow: visible; text-align: left; text-align-last: auto; white-space-collapse: preserve-breaks;">services@guggenheiminvestments.com</span>
|
| Additional Information Website |
<span style="box-sizing: border-box; color: rgb(67, 67, 67); display: inline; flex-wrap: nowrap; font-size: 10.6667px; font-weight: 400; grid-area: auto; line-height: 12.8px; margin: 0px; overflow: visible; text-align: left; text-align-last: auto; white-space-collapse: preserve-breaks;">GuggenheimInvestments.com/mutual-funds/literature</span>
|
| Expenses [Text Block] |
What were the Fund's costs for the last year? * Based on a hypothetical $10,000 investment Table SummaryClass | Costs of a $10,000 Investment | Costs Paid as a % of a $10,000 Investment |
|---|
Class H | $173 | 1.57% |
|---|
Table Summary* | Excludes expenses of the underlying funds in which the fund invests, if any. |
|---|
|
| Expenses Paid, Amount |
$ 173
|
| Factors Affecting Performance [Text Block] |
What factors materially affected the Fund's performance over the last year? The sectors that contributed the most to the return of the underlying index were information technology, communication services, and industrials. The sector that detracted the most from performance was health care. The holdings that contributed the most to the return of the underlying index were NVIDIA Corp., Broadcom, Inc., and Alphabet, Inc.—Class A. Those that detracted the most were UnitedHealth Group, Inc., Berkshire Hathaway, Inc.—Class B, and Fiserv, Inc. The fund maintained a daily correlation of over 99% to its benchmark of 150% of the daily price movement of the S&P 500 Index. |
| Line Graph [Table Text Block] |
Table Summary | Nova Fund (Class H) | S&P 500 Index |
|---|
3/31/16 | $10,000 | $10,000 |
|---|
3/31/17 | $12,356 | $11,717 |
|---|
3/31/18 | $14,566 | $13,357 |
|---|
3/31/19 | $16,038 | $14,625 |
|---|
3/31/20 | $13,248 | $13,605 |
|---|
3/31/21 | $25,176 | $21,271 |
|---|
3/31/22 | $30,338 | $24,599 |
|---|
3/31/23 | $25,369 | $22,698 |
|---|
3/31/24 | $35,701 | $29,480 |
|---|
3/31/25 | $38,181 | $31,913 |
|---|
3/31/26 | $46,203 | $37,594 |
|---|
|
| Average Annual Return [Table Text Block] |
Table SummaryAverage Annual Total Returns | One Year | Five Years | Ten Years |
|---|
Class H | 21.01% | 12.91% | 16.54% |
|---|
S&P 500 Index | 17.80% | 12.06% | 14.16% |
|---|
|
| AssetsNet |
$ 207,430,220
|
| Holdings Count | Holding |
515
|
| Advisory Fees Paid, Amount |
$ 1,510,118
|
| InvestmentCompanyPortfolioTurnover |
583.00%
|
| Additional Fund Statistics [Text Block] |
Fund Statistics as of March 31, 2026 - Net Assets$207,430,220
- Total Number of Portfolio Holdings515
- Portfolio Turnover Rate583%
- Total Advisory Fees Paid$1,510,118
|
| Holdings [Text Block] |
Holdings DiversificationFootnote Reference1 (% of Net Assets) as of March 31, 2026 Table SummaryValue | Value |
|---|
Other | 6.2% | Consumer, Cyclical | 6.3% | Industrial | 6.6% | Financial | 10.5% | Consumer, Non-cyclical | 10.7% | Communications | 12.5% | Equity Futures Contracts Purchased | 23.3% | Technology | 23.5% | OTC Equity Index Swap Agreements | 50.2% | |
| Largest Holdings [Text Block] |
10 Largest HoldingsFootnote Reference2 (% of Net Assets) as of March 31, 2026 Table SummaryNVIDIA Corp. | 5.8% |
|---|
Apple, Inc. | 5.1% |
|---|
Microsoft Corp. | 3.8% |
|---|
Guggenheim Ultra Short Duration Fund — Institutional Class | 3.6% |
|---|
Amazon.com, Inc. | 2.8% |
|---|
Guggenheim Strategy Fund II | 2.7% |
|---|
Alphabet, Inc. — Class A | 2.3% |
|---|
Guggenheim Strategy Fund III | 2.2% |
|---|
Broadcom, Inc. | 2.0% |
|---|
Alphabet, Inc. — Class C | 1.8% |
|---|
Total | 32.1% |
|---|
|
| Material Fund Change [Text Block] |
|
| C000033368 |
|
| Shareholder Report [Line Items] |
|
| Fund Name |
S&P 500<sup style="inset: 1.5px 0px 4px; box-sizing: border-box; color: rgb(83, 40, 79); display: inline; flex-wrap: nowrap; font-size: 20px; font-weight: 700; grid-area: auto; line-height: 0px; margin: 0px; overflow: visible; position: relative; text-align: left; text-align-last: auto; white-space-collapse: preserve-breaks;">®</sup> Fund
|
| Class Name |
Class A
|
| Trading Symbol |
RYSOX
|
| Annual or Semi-Annual Statement [Text Block] |
This annual shareholder report contains important information about the S&P 500® Fund for the period from April 1, 2025 to March 31, 2026.
|
| Shareholder Report Annual or Semi-Annual |
Annual Shareholder Report
|
| Additional Information [Text Block] |
You can find additional information about the fund at GuggenheimInvestments.com/mutual-funds/literature. You can also request this information by contacting 800 820 0888 or services@guggenheiminvestments.com.
|
| Additional Information Phone Number |
800 820 0888
|
| Additional Information Email |
<span style="box-sizing: border-box; color: rgb(67, 67, 67); display: inline; flex-wrap: nowrap; font-size: 10.6667px; font-weight: 400; grid-area: auto; line-height: 12.8px; margin: 0px; overflow: visible; text-align: left; text-align-last: auto; white-space-collapse: preserve-breaks;">services@guggenheiminvestments.com</span>
|
| Additional Information Website |
<span style="box-sizing: border-box; color: rgb(67, 67, 67); display: inline; flex-wrap: nowrap; font-size: 10.6667px; font-weight: 400; grid-area: auto; line-height: 12.8px; margin: 0px; overflow: visible; text-align: left; text-align-last: auto; white-space-collapse: preserve-breaks;">GuggenheimInvestments.com/mutual-funds/literature</span>
|
| Expenses [Text Block] |
What were the Fund's costs for the last year? * Based on a hypothetical $10,000 investment Table SummaryClass | Costs of a $10,000 Investment | Costs Paid as a % of a $10,000 Investment |
|---|
Class A | $172 | 1.59% |
|---|
Table Summary* | Excludes expenses of the underlying funds in which the fund invests, if any. |
|---|
|
| Expenses Paid, Amount |
$ 172
|
| Factors Affecting Performance [Text Block] |
What factors materially affected the Fund's performance over the last year? The sectors that contributed the most to the return of the underlying index were information technology, communication services, and industrials. The sector that detracted the most from performance was health care. The holdings that contributed the most to the return of the underlying index were NVIDIA Corp., Broadcom, Inc., and Alphabet, Inc.—Class A. Those that detracted the most were UnitedHealth Group, Inc., Berkshire Hathaway, Inc.—Class B, and Fiserv, Inc. The fund maintained a daily correlation of over 99% to its benchmark of 100% of the daily price movement of the S&P 500 Index. |
| Line Graph [Table Text Block] |
Table Summary | S&P 500® Fund (Class A)‡ | S&P 500 Index |
|---|
3/31/16 | $9,525 | $10,000 |
|---|
3/31/17 | $10,970 | $11,717 |
|---|
3/31/18 | $12,304 | $13,357 |
|---|
3/31/19 | $13,237 | $14,625 |
|---|
3/31/20 | $12,089 | $13,605 |
|---|
3/31/21 | $18,574 | $21,271 |
|---|
3/31/22 | $21,141 | $24,599 |
|---|
3/31/23 | $19,169 | $22,698 |
|---|
3/31/24 | $24,482 | $29,480 |
|---|
3/31/25 | $26,064 | $31,913 |
|---|
3/31/26 | $30,242 | $37,594 |
|---|
|
| Average Annual Return [Table Text Block] |
Table SummaryAverage Annual Total Returns | One Year | Five Years | Ten Years |
|---|
Class A (without sales charge) | 16.02% | 10.24% | 12.25% |
|---|
Class A (with sales charge) ‡ | 10.52% | 9.17% | 11.70% |
|---|
S&P 500 Index | 17.80% | 12.06% | 14.16% |
|---|
|
| AssetsNet |
$ 139,035,484
|
| Holdings Count | Holding |
511
|
| Advisory Fees Paid, Amount |
$ 1,099,417
|
| InvestmentCompanyPortfolioTurnover |
143.00%
|
| Additional Fund Statistics [Text Block] |
Fund Statistics as of March 31, 2026 - Net Assets$139,035,484
- Total Number of Portfolio Holdings511
- Portfolio Turnover Rate143%
- Total Advisory Fees Paid$1,099,417
|
| Holdings [Text Block] |
Holdings DiversificationFootnote Reference1 (% of Net Assets) as of March 31, 2026 Table SummaryValue | Value |
|---|
Other | 8.2% | Consumer, Cyclical | 7.4% | Industrial | 7.7% | OTC Equity Index Swap Agreements | 9.3% | Financial | 12.3% | Consumer, Non-cyclical | 12.6% | Communications | 14.7% | Technology | 27.7% | |
| Largest Holdings [Text Block] |
10 Largest HoldingsFootnote Reference2 (% of Net Assets) as of March 31, 2026 Table SummaryNVIDIA Corp. | 6.8% |
|---|
Apple, Inc. | 6.0% |
|---|
Microsoft Corp. | 4.4% |
|---|
Amazon.com, Inc. | 3.3% |
|---|
Alphabet, Inc. — Class A | 2.7% |
|---|
Broadcom, Inc. | 2.4% |
|---|
Alphabet, Inc. — Class C | 2.2% |
|---|
Meta Platforms, Inc. — Class A | 2.0% |
|---|
Tesla, Inc. | 1.7% |
|---|
Berkshire Hathaway, Inc. — Class B | 1.4% |
|---|
Total | 32.9% |
|---|
|
| Material Fund Change [Text Block] |
|
| C000033369 |
|
| Shareholder Report [Line Items] |
|
| Fund Name |
S&P 500<sup style="inset: 1.5px 0px 4px; box-sizing: border-box; color: rgb(83, 40, 79); display: inline; flex-wrap: nowrap; font-size: 20px; font-weight: 700; grid-area: auto; line-height: 0px; margin: 0px; overflow: visible; position: relative; text-align: left; text-align-last: auto; white-space-collapse: preserve-breaks;">®</sup> Fund
|
| Class Name |
Class C
|
| Trading Symbol |
RYSYX
|
| Annual or Semi-Annual Statement [Text Block] |
This annual shareholder report contains important information about the S&P 500® Fund for the period from April 1, 2025 to March 31, 2026.
|
| Shareholder Report Annual or Semi-Annual |
Annual Shareholder Report
|
| Additional Information [Text Block] |
You can find additional information about the fund at GuggenheimInvestments.com/mutual-funds/literature. You can also request this information by contacting 800 820 0888 or services@guggenheiminvestments.com.
|
| Additional Information Phone Number |
800 820 0888
|
| Additional Information Email |
<span style="box-sizing: border-box; color: rgb(67, 67, 67); display: inline; flex-wrap: nowrap; font-size: 10.6667px; font-weight: 400; grid-area: auto; line-height: 12.8px; margin: 0px; overflow: visible; text-align: left; text-align-last: auto; white-space-collapse: preserve-breaks;">services@guggenheiminvestments.com</span>
|
| Additional Information Website |
<span style="box-sizing: border-box; color: rgb(67, 67, 67); display: inline; flex-wrap: nowrap; font-size: 10.6667px; font-weight: 400; grid-area: auto; line-height: 12.8px; margin: 0px; overflow: visible; text-align: left; text-align-last: auto; white-space-collapse: preserve-breaks;">GuggenheimInvestments.com/mutual-funds/literature</span>
|
| Expenses [Text Block] |
What were the Fund's costs for the last year? * Based on a hypothetical $10,000 investment Table SummaryClass | Costs of a $10,000 Investment | Costs Paid as a % of a $10,000 Investment |
|---|
Class C | $253 | 2.35% |
|---|
Table Summary* | Excludes expenses of the underlying funds in which the fund invests, if any. |
|---|
|
| Expenses Paid, Amount |
$ 253
|
| Factors Affecting Performance [Text Block] |
What factors materially affected the Fund's performance over the last year? The sectors that contributed the most to the return of the underlying index were information technology, communication services, and industrials. The sector that detracted the most from performance was health care. The holdings that contributed the most to the return of the underlying index were NVIDIA Corp., Broadcom, Inc., and Alphabet, Inc.—Class A. Those that detracted the most were UnitedHealth Group, Inc., Berkshire Hathaway, Inc.—Class B, and Fiserv, Inc. The fund maintained a daily correlation of over 99% to its benchmark of 100% of the daily price movement of the S&P 500 Index. |
| Line Graph [Table Text Block] |
Table Summary | S&P 500® Fund (Class C) | S&P 500 Index |
|---|
3/31/16 | $10,000 | $10,000 |
|---|
3/31/17 | $11,433 | $11,717 |
|---|
3/31/18 | $12,724 | $13,357 |
|---|
3/31/19 | $13,587 | $14,625 |
|---|
3/31/20 | $12,317 | $13,605 |
|---|
3/31/21 | $18,783 | $21,271 |
|---|
3/31/22 | $21,224 | $24,599 |
|---|
3/31/23 | $19,097 | $22,698 |
|---|
3/31/24 | $24,211 | $29,480 |
|---|
3/31/25 | $25,582 | $31,913 |
|---|
3/31/26 | $29,462 | $37,594 |
|---|
|
| Average Annual Return [Table Text Block] |
Table SummaryAverage Annual Total Returns | One Year | Five Years | Ten Years |
|---|
Class C (without CDSC) | 15.17% | 9.42% | 11.41% |
|---|
Class C (with CDSC) ‡ | 14.17% | 9.42% | 11.41% |
|---|
S&P 500 Index | 17.80% | 12.06% | 14.16% |
|---|
|
| AssetsNet |
$ 139,035,484
|
| Holdings Count | Holding |
511
|
| Advisory Fees Paid, Amount |
$ 1,099,417
|
| InvestmentCompanyPortfolioTurnover |
143.00%
|
| Additional Fund Statistics [Text Block] |
Fund Statistics as of March 31, 2026 - Net Assets$139,035,484
- Total Number of Portfolio Holdings511
- Portfolio Turnover Rate143%
- Total Advisory Fees Paid$1,099,417
|
| Holdings [Text Block] |
Holdings DiversificationFootnote Reference1 (% of Net Assets) as of March 31, 2026 Table SummaryValue | Value |
|---|
Other | 8.2% | Consumer, Cyclical | 7.4% | Industrial | 7.7% | OTC Equity Index Swap Agreements | 9.3% | Financial | 12.3% | Consumer, Non-cyclical | 12.6% | Communications | 14.7% | Technology | 27.7% | |
| Largest Holdings [Text Block] |
10 Largest HoldingsFootnote Reference2 (% of Net Assets) as of March 31, 2026 Table SummaryNVIDIA Corp. | 6.8% |
|---|
Apple, Inc. | 6.0% |
|---|
Microsoft Corp. | 4.4% |
|---|
Amazon.com, Inc. | 3.3% |
|---|
Alphabet, Inc. — Class A | 2.7% |
|---|
Broadcom, Inc. | 2.4% |
|---|
Alphabet, Inc. — Class C | 2.2% |
|---|
Meta Platforms, Inc. — Class A | 2.0% |
|---|
Tesla, Inc. | 1.7% |
|---|
Berkshire Hathaway, Inc. — Class B | 1.4% |
|---|
Total | 32.9% |
|---|
|
| Material Fund Change [Text Block] |
|
| C000033370 |
|
| Shareholder Report [Line Items] |
|
| Fund Name |
S&P 500<sup style="inset: 1.5px 0px 4px; box-sizing: border-box; color: rgb(83, 40, 79); display: inline; flex-wrap: nowrap; font-size: 20px; font-weight: 700; grid-area: auto; line-height: 0px; margin: 0px; overflow: visible; position: relative; text-align: left; text-align-last: auto; white-space-collapse: preserve-breaks;">®</sup> Fund
|
| Class Name |
Class H
|
| Trading Symbol |
RYSPX
|
| Annual or Semi-Annual Statement [Text Block] |
This annual shareholder report contains important information about the S&P 500® Fund for the period from April 1, 2025 to March 31, 2026.
|
| Shareholder Report Annual or Semi-Annual |
Annual Shareholder Report
|
| Additional Information [Text Block] |
You can find additional information about the fund at GuggenheimInvestments.com/mutual-funds/literature. You can also request this information by contacting 800 820 0888 or services@guggenheiminvestments.com.
|
| Additional Information Phone Number |
800 820 0888
|
| Additional Information Email |
<span style="box-sizing: border-box; color: rgb(67, 67, 67); display: inline; flex-wrap: nowrap; font-size: 10.6667px; font-weight: 400; grid-area: auto; line-height: 12.8px; margin: 0px; overflow: visible; text-align: left; text-align-last: auto; white-space-collapse: preserve-breaks;">services@guggenheiminvestments.com</span>
|
| Additional Information Website |
<span style="box-sizing: border-box; color: rgb(67, 67, 67); display: inline; flex-wrap: nowrap; font-size: 10.6667px; font-weight: 400; grid-area: auto; line-height: 12.8px; margin: 0px; overflow: visible; text-align: left; text-align-last: auto; white-space-collapse: preserve-breaks;">GuggenheimInvestments.com/mutual-funds/literature</span>
|
| Expenses [Text Block] |
What were the Fund's costs for the last year? * Based on a hypothetical $10,000 investment Table SummaryClass | Costs of a $10,000 Investment | Costs Paid as a % of a $10,000 Investment |
|---|
Class H | $172 | 1.59% |
|---|
Table Summary* | Excludes expenses of the underlying funds in which the fund invests, if any. |
|---|
|
| Expenses Paid, Amount |
$ 172
|
| Factors Affecting Performance [Text Block] |
What factors materially affected the Fund's performance over the last year? The sectors that contributed the most to the return of the underlying index were information technology, communication services, and industrials. The sector that detracted the most from performance was health care. The holdings that contributed the most to the return of the underlying index were NVIDIA Corp., Broadcom, Inc., and Alphabet, Inc.—Class A. Those that detracted the most were UnitedHealth Group, Inc., Berkshire Hathaway, Inc.—Class B, and Fiserv, Inc. The fund maintained a daily correlation of over 99% to its benchmark of 100% of the daily price movement of the S&P 500 Index. |
| Line Graph [Table Text Block] |
Table Summary | S&P 500® Fund (Class H) | S&P 500 Index |
|---|
3/31/16 | $10,000 | $10,000 |
|---|
3/31/17 | $11,520 | $11,717 |
|---|
3/31/18 | $12,919 | $13,357 |
|---|
3/31/19 | $13,899 | $14,625 |
|---|
3/31/20 | $12,696 | $13,605 |
|---|
3/31/21 | $19,506 | $21,271 |
|---|
3/31/22 | $22,205 | $24,599 |
|---|
3/31/23 | $20,135 | $22,698 |
|---|
3/31/24 | $25,715 | $29,480 |
|---|
3/31/25 | $27,376 | $31,913 |
|---|
3/31/26 | $31,760 | $37,594 |
|---|
|
| Average Annual Return [Table Text Block] |
Table SummaryAverage Annual Total Returns | One Year | Five Years | Ten Years |
|---|
Class H | 16.01% | 10.24% | 12.25% |
|---|
S&P 500 Index | 17.80% | 12.06% | 14.16% |
|---|
|
| AssetsNet |
$ 139,035,484
|
| Holdings Count | Holding |
511
|
| Advisory Fees Paid, Amount |
$ 1,099,417
|
| InvestmentCompanyPortfolioTurnover |
143.00%
|
| Additional Fund Statistics [Text Block] |
Fund Statistics as of March 31, 2026 - Net Assets$139,035,484
- Total Number of Portfolio Holdings511
- Portfolio Turnover Rate143%
- Total Advisory Fees Paid$1,099,417
|
| Holdings [Text Block] |
Holdings DiversificationFootnote Reference1 (% of Net Assets) as of March 31, 2026 Table SummaryValue | Value |
|---|
Other | 8.2% | Consumer, Cyclical | 7.4% | Industrial | 7.7% | OTC Equity Index Swap Agreements | 9.3% | Financial | 12.3% | Consumer, Non-cyclical | 12.6% | Communications | 14.7% | Technology | 27.7% | |
| Largest Holdings [Text Block] |
10 Largest HoldingsFootnote Reference2 (% of Net Assets) as of March 31, 2026 Table SummaryNVIDIA Corp. | 6.8% |
|---|
Apple, Inc. | 6.0% |
|---|
Microsoft Corp. | 4.4% |
|---|
Amazon.com, Inc. | 3.3% |
|---|
Alphabet, Inc. — Class A | 2.7% |
|---|
Broadcom, Inc. | 2.4% |
|---|
Alphabet, Inc. — Class C | 2.2% |
|---|
Meta Platforms, Inc. — Class A | 2.0% |
|---|
Tesla, Inc. | 1.7% |
|---|
Berkshire Hathaway, Inc. — Class B | 1.4% |
|---|
Total | 32.9% |
|---|
|
| Material Fund Change [Text Block] |
|
| C000010334 |
|
| Shareholder Report [Line Items] |
|
| Fund Name |
Inverse S&P 500<sup style="inset: 1.5px 0px 4px; box-sizing: border-box; color: rgb(83, 40, 79); display: inline; flex-wrap: nowrap; font-size: 20px; font-weight: 700; grid-area: auto; line-height: 0px; margin: 0px; overflow: visible; position: relative; text-align: left; text-align-last: auto; white-space-collapse: preserve-breaks;">®</sup> Strategy Fund
|
| Class Name |
Investor Class
|
| Trading Symbol |
RYURX
|
| Annual or Semi-Annual Statement [Text Block] |
This annual shareholder report contains important information about the Inverse S&P 500® Strategy Fund for the period from April 1, 2025 to March 31, 2026.
|
| Shareholder Report Annual or Semi-Annual |
Annual Shareholder Report
|
| Additional Information [Text Block] |
You can find additional information about the fund at GuggenheimInvestments.com/mutual-funds/literature. You can also request this information by contacting 800 820 0888 or services@guggenheiminvestments.com.
|
| Additional Information Phone Number |
800 820 0888
|
| Additional Information Email |
<span style="box-sizing: border-box; color: rgb(67, 67, 67); display: inline; flex-wrap: nowrap; font-size: 10.6667px; font-weight: 400; grid-area: auto; line-height: 12.8px; margin: 0px; overflow: visible; text-align: left; text-align-last: auto; white-space-collapse: preserve-breaks;">services@guggenheiminvestments.com</span>
|
| Additional Information Website |
<span style="box-sizing: border-box; color: rgb(67, 67, 67); display: inline; flex-wrap: nowrap; font-size: 10.6667px; font-weight: 400; grid-area: auto; line-height: 12.8px; margin: 0px; overflow: visible; text-align: left; text-align-last: auto; white-space-collapse: preserve-breaks;">GuggenheimInvestments.com/mutual-funds/literature</span>
|
| Expenses [Text Block] |
What were the Fund's costs for the last year? * Based on a hypothetical $10,000 investment Table SummaryClass | Costs of a $10,000 Investment | Costs Paid as a % of a $10,000 Investment |
|---|
Investor Class | $131 | 1.39% |
|---|
Table Summary* | Excludes expenses of the underlying funds in which the fund invests, if any. |
|---|
|
| Expenses Paid, Amount |
$ 131
|
| Factors Affecting Performance [Text Block] |
What factors materially affected the Fund's performance over the last year? The sectors that contributed the most to the return of the underlying index were information technology, communication services, and industrials. The sector that detracted the most from performance was health care. The holdings that contributed the most to the return of the underlying index were NVIDIA Corp., Broadcom, Inc., and Alphabet, Inc.—Class A Those that detracted the most were UnitedHealth Group, Inc., Berkshire Hathaway, Inc.—Class B, and Fiserv, Inc. The fund maintained a daily correlation of over 99% to its benchmark of -100% of the daily price movement of the S&P 500 Index. |
| Line Graph [Table Text Block] |
Table Summary | Inverse S&P 500® Strategy Fund (Investor Class) | S&P 500 Index |
|---|
3/31/16 | $10,000 | $10,000 |
|---|
3/31/17 | $8,466 | $11,717 |
|---|
3/31/18 | $7,432 | $13,357 |
|---|
3/31/19 | $6,832 | $14,625 |
|---|
3/31/20 | $6,907 | $13,605 |
|---|
3/31/21 | $4,198 | $21,271 |
|---|
3/31/22 | $3,519 | $24,599 |
|---|
3/31/23 | $3,778 | $22,698 |
|---|
3/31/24 | $3,166 | $29,480 |
|---|
3/31/25 | $3,150 | $31,913 |
|---|
3/31/26 | $2,783 | $37,594 |
|---|
|
| Average Annual Return [Table Text Block] |
Table SummaryAverage Annual Total Returns | One Year | Five Years | Ten Years |
|---|
Investor Class | -11.64% | -7.89% | -12.01% |
|---|
S&P 500 Index | 17.80% | 12.06% | 14.16% |
|---|
|
| AssetsNet |
$ 63,870,998
|
| Holdings Count | Holding |
15
|
| Advisory Fees Paid, Amount |
$ 352,027
|
| InvestmentCompanyPortfolioTurnover |
0.00%
|
| Additional Fund Statistics [Text Block] |
Fund Statistics as of March 31, 2026 - Net Assets$63,870,998
- Total Number of Portfolio Holdings15
- Portfolio Turnover Rate-%
- Total Advisory Fees Paid$352,027
|
| Holdings [Text Block] |
Holdings DiversificationFootnote Reference1 (% of Net Assets) as of March 31, 2026 Table SummaryValue | Value |
|---|
OTC Equity Index Swap Agreements Sold Short | -71.1% | Equity Futures Contracts Sold Short | -28.3% | |
| Largest Holdings [Text Block] |
Largest HoldingsFootnote Reference2 (% of Net Assets) as of March 31, 2026 Table SummaryGuggenheim Strategy Fund II | 10.2% |
|---|
Guggenheim Ultra Short Duration Fund — Institutional Class | 6.7% |
|---|
Total | 16.9% |
|---|
|
| Material Fund Change [Text Block] |
|
| C000010336 |
|
| Shareholder Report [Line Items] |
|
| Fund Name |
Inverse S&P 500<sup style="inset: 1.5px 0px 4px; box-sizing: border-box; color: rgb(83, 40, 79); display: inline; flex-wrap: nowrap; font-size: 20px; font-weight: 700; grid-area: auto; line-height: 0px; margin: 0px; overflow: visible; position: relative; text-align: left; text-align-last: auto; white-space-collapse: preserve-breaks;">®</sup> Strategy Fund
|
| Class Name |
Class A
|
| Trading Symbol |
RYARX
|
| Annual or Semi-Annual Statement [Text Block] |
This annual shareholder report contains important information about the Inverse S&P 500® Strategy Fund for the period from April 1, 2025 to March 31, 2026.
|
| Shareholder Report Annual or Semi-Annual |
Annual Shareholder Report
|
| Additional Information [Text Block] |
You can find additional information about the fund at GuggenheimInvestments.com/mutual-funds/literature. You can also request this information by contacting 800 820 0888 or services@guggenheiminvestments.com.
|
| Additional Information Phone Number |
800 820 0888
|
| Additional Information Email |
<span style="box-sizing: border-box; color: rgb(67, 67, 67); display: inline; flex-wrap: nowrap; font-size: 10.6667px; font-weight: 400; grid-area: auto; line-height: 12.8px; margin: 0px; overflow: visible; text-align: left; text-align-last: auto; white-space-collapse: preserve-breaks;">services@guggenheiminvestments.com</span>
|
| Additional Information Website |
<span style="box-sizing: border-box; color: rgb(67, 67, 67); display: inline; flex-wrap: nowrap; font-size: 10.6667px; font-weight: 400; grid-area: auto; line-height: 12.8px; margin: 0px; overflow: visible; text-align: left; text-align-last: auto; white-space-collapse: preserve-breaks;">GuggenheimInvestments.com/mutual-funds/literature</span>
|
| Expenses [Text Block] |
What were the Fund's costs for the last year? * Based on a hypothetical $10,000 investment Table SummaryClass | Costs of a $10,000 Investment | Costs Paid as a % of a $10,000 Investment |
|---|
Class A | $153 | 1.63% |
|---|
Table Summary* | Excludes expenses of the underlying funds in which the fund invests, if any. |
|---|
|
| Expenses Paid, Amount |
$ 153
|
| Factors Affecting Performance [Text Block] |
What factors materially affected the Fund's performance over the last year? The sectors that contributed the most to the return of the underlying index were information technology, communication services, and industrials. The sector that detracted the most from performance was health care. The holdings that contributed the most to the return of the underlying index were NVIDIA Corp., Broadcom, Inc., and Alphabet, Inc.—Class A Those that detracted the most were UnitedHealth Group, Inc., Berkshire Hathaway, Inc.—Class B, and Fiserv, Inc. The fund maintained a daily correlation of over 99% to its benchmark of -100% of the daily price movement of the S&P 500 Index. |
| Line Graph [Table Text Block] |
Table Summary | Inverse S&P 500® Strategy Fund (Class A)‡ | S&P 500 Index |
|---|
3/31/16 | $9,525 | $10,000 |
|---|
3/31/17 | $8,046 | $11,717 |
|---|
3/31/18 | $7,045 | $13,357 |
|---|
3/31/19 | $6,459 | $14,625 |
|---|
3/31/20 | $6,514 | $13,605 |
|---|
3/31/21 | $3,949 | $21,271 |
|---|
3/31/22 | $3,301 | $24,599 |
|---|
3/31/23 | $3,535 | $22,698 |
|---|
3/31/24 | $2,956 | $29,480 |
|---|
3/31/25 | $2,935 | $31,913 |
|---|
3/31/26 | $2,587 | $37,594 |
|---|
|
| Average Annual Return [Table Text Block] |
Table SummaryAverage Annual Total Returns | One Year | Five Years | Ten Years |
|---|
Class A (without sales charge) | -11.86% | -8.11% | -12.22% |
|---|
Class A (with sales charge) ‡ | -16.05% | -9.00% | -12.65% |
|---|
S&P 500 Index | 17.80% | 12.06% | 14.16% |
|---|
|
| AssetsNet |
$ 63,870,998
|
| Holdings Count | Holding |
15
|
| Advisory Fees Paid, Amount |
$ 352,027
|
| InvestmentCompanyPortfolioTurnover |
0.00%
|
| Additional Fund Statistics [Text Block] |
Fund Statistics as of March 31, 2026 - Net Assets$63,870,998
- Total Number of Portfolio Holdings15
- Portfolio Turnover Rate-%
- Total Advisory Fees Paid$352,027
|
| Holdings [Text Block] |
Holdings DiversificationFootnote Reference1 (% of Net Assets) as of March 31, 2026 Table SummaryValue | Value |
|---|
OTC Equity Index Swap Agreements Sold Short | -71.1% | Equity Futures Contracts Sold Short | -28.3% | |
| Largest Holdings [Text Block] |
Largest HoldingsFootnote Reference2 (% of Net Assets) as of March 31, 2026 Table SummaryGuggenheim Strategy Fund II | 10.2% |
|---|
Guggenheim Ultra Short Duration Fund — Institutional Class | 6.7% |
|---|
Total | 16.9% |
|---|
|
| Material Fund Change [Text Block] |
|
| C000010337 |
|
| Shareholder Report [Line Items] |
|
| Fund Name |
Inverse S&P 500<sup style="inset: 1.5px 0px 4px; box-sizing: border-box; color: rgb(83, 40, 79); display: inline; flex-wrap: nowrap; font-size: 20px; font-weight: 700; grid-area: auto; line-height: 0px; margin: 0px; overflow: visible; position: relative; text-align: left; text-align-last: auto; white-space-collapse: preserve-breaks;">®</sup> Strategy Fund
|
| Class Name |
Class C
|
| Trading Symbol |
RYUCX
|
| Annual or Semi-Annual Statement [Text Block] |
This annual shareholder report contains important information about the Inverse S&P 500® Strategy Fund for the period from April 1, 2025 to March 31, 2026.
|
| Shareholder Report Annual or Semi-Annual |
Annual Shareholder Report
|
| Additional Information [Text Block] |
You can find additional information about the fund at GuggenheimInvestments.com/mutual-funds/literature. You can also request this information by contacting 800 820 0888 or services@guggenheiminvestments.com.
|
| Additional Information Phone Number |
800 820 0888
|
| Additional Information Email |
<span style="box-sizing: border-box; color: rgb(67, 67, 67); display: inline; flex-wrap: nowrap; font-size: 10.6667px; font-weight: 400; grid-area: auto; line-height: 12.8px; margin: 0px; overflow: visible; text-align: left; text-align-last: auto; white-space-collapse: preserve-breaks;">services@guggenheiminvestments.com</span>
|
| Additional Information Website |
<span style="box-sizing: border-box; color: rgb(67, 67, 67); display: inline; flex-wrap: nowrap; font-size: 10.6667px; font-weight: 400; grid-area: auto; line-height: 12.8px; margin: 0px; overflow: visible; text-align: left; text-align-last: auto; white-space-collapse: preserve-breaks;">GuggenheimInvestments.com/mutual-funds/literature</span>
|
| Expenses [Text Block] |
What were the Fund's costs for the last year? * Based on a hypothetical $10,000 investment Table SummaryClass | Costs of a $10,000 Investment | Costs Paid as a % of a $10,000 Investment |
|---|
Class C | $223 | 2.38% |
|---|
Table Summary* | Excludes expenses of the underlying funds in which the fund invests, if any. |
|---|
|
| Expenses Paid, Amount |
$ 223
|
| Factors Affecting Performance [Text Block] |
What factors materially affected the Fund's performance over the last year? The sectors that contributed the most to the return of the underlying index were information technology, communication services, and industrials. The sector that detracted the most from performance was health care. The holdings that contributed the most to the return of the underlying index were NVIDIA Corp., Broadcom, Inc., and Alphabet, Inc.—Class A Those that detracted the most were UnitedHealth Group, Inc., Berkshire Hathaway, Inc.—Class B, and Fiserv, Inc. The fund maintained a daily correlation of over 99% to its benchmark of -100% of the daily price movement of the S&P 500 Index. |
| Line Graph [Table Text Block] |
Table Summary | Inverse S&P 500® Strategy Fund (Class C) | S&P 500 Index |
|---|
3/31/16 | $10,000 | $10,000 |
|---|
3/31/17 | $8,380 | $11,717 |
|---|
3/31/18 | $7,282 | $13,357 |
|---|
3/31/19 | $6,627 | $14,625 |
|---|
3/31/20 | $6,633 | $13,605 |
|---|
3/31/21 | $3,992 | $21,271 |
|---|
3/31/22 | $3,312 | $24,599 |
|---|
3/31/23 | $3,520 | $22,698 |
|---|
3/31/24 | $2,922 | $29,480 |
|---|
3/31/25 | $2,878 | $31,913 |
|---|
3/31/26 | $2,519 | $37,594 |
|---|
|
| Average Annual Return [Table Text Block] |
Table SummaryAverage Annual Total Returns | One Year | Five Years | Ten Years |
|---|
Class C (without CDSC) | -12.50% | -8.80% | -12.88% |
|---|
Class C (with CDSC) ‡ | -13.34% | -8.80% | -12.88% |
|---|
S&P 500 Index | 17.80% | 12.06% | 14.16% |
|---|
|
| AssetsNet |
$ 63,870,998
|
| Holdings Count | Holding |
15
|
| Advisory Fees Paid, Amount |
$ 352,027
|
| InvestmentCompanyPortfolioTurnover |
0.00%
|
| Additional Fund Statistics [Text Block] |
Fund Statistics as of March 31, 2026 - Net Assets$63,870,998
- Total Number of Portfolio Holdings15
- Portfolio Turnover Rate-%
- Total Advisory Fees Paid$352,027
|
| Holdings [Text Block] |
Holdings DiversificationFootnote Reference1 (% of Net Assets) as of March 31, 2026 Table SummaryValue | Value |
|---|
OTC Equity Index Swap Agreements Sold Short | -71.1% | Equity Futures Contracts Sold Short | -28.3% | |
| Largest Holdings [Text Block] |
Largest HoldingsFootnote Reference2 (% of Net Assets) as of March 31, 2026 Table SummaryGuggenheim Strategy Fund II | 10.2% |
|---|
Guggenheim Ultra Short Duration Fund — Institutional Class | 6.7% |
|---|
Total | 16.9% |
|---|
|
| Material Fund Change [Text Block] |
|
| C000149024 |
|
| Shareholder Report [Line Items] |
|
| Fund Name |
Inverse S&P 500<sup style="inset: 1.5px 0px 4px; box-sizing: border-box; color: rgb(83, 40, 79); display: inline; flex-wrap: nowrap; font-size: 20px; font-weight: 700; grid-area: auto; line-height: 0px; margin: 0px; overflow: visible; position: relative; text-align: left; text-align-last: auto; white-space-collapse: preserve-breaks;">®</sup> Strategy Fund
|
| Class Name |
Class H
|
| Trading Symbol |
RYUHX
|
| Annual or Semi-Annual Statement [Text Block] |
This annual shareholder report contains important information about the Inverse S&P 500® Strategy Fund for the period from April 1, 2025 to March 31, 2026.
|
| Shareholder Report Annual or Semi-Annual |
Annual Shareholder Report
|
| Additional Information [Text Block] |
You can find additional information about the fund at GuggenheimInvestments.com/mutual-funds/literature. You can also request this information by contacting 800 820 0888 or services@guggenheiminvestments.com.
|
| Additional Information Phone Number |
800 820 0888
|
| Additional Information Email |
<span style="box-sizing: border-box; color: rgb(67, 67, 67); display: inline; flex-wrap: nowrap; font-size: 10.6667px; font-weight: 400; grid-area: auto; line-height: 12.8px; margin: 0px; overflow: visible; text-align: left; text-align-last: auto; white-space-collapse: preserve-breaks;">services@guggenheiminvestments.com</span>
|
| Additional Information Website |
<span style="box-sizing: border-box; color: rgb(67, 67, 67); display: inline; flex-wrap: nowrap; font-size: 10.6667px; font-weight: 400; grid-area: auto; line-height: 12.8px; margin: 0px; overflow: visible; text-align: left; text-align-last: auto; white-space-collapse: preserve-breaks;">GuggenheimInvestments.com/mutual-funds/literature</span>
|
| Expenses [Text Block] |
What were the Fund's costs for the last year? * Based on a hypothetical $10,000 investment Table SummaryClass | Costs of a $10,000 Investment | Costs Paid as a % of a $10,000 Investment |
|---|
Class H | $153 | 1.63% |
|---|
Table Summary* | Excludes expenses of the underlying funds in which the fund invests, if any. |
|---|
|
| Expenses Paid, Amount |
$ 153
|
| Factors Affecting Performance [Text Block] |
What factors materially affected the Fund's performance over the last year? The sectors that contributed the most to the return of the underlying index were information technology, communication services, and industrials. The sector that detracted the most from performance was health care. The holdings that contributed the most to the return of the underlying index were NVIDIA Corp., Broadcom, Inc., and Alphabet, Inc.—Class A Those that detracted the most were UnitedHealth Group, Inc., Berkshire Hathaway, Inc.—Class B, and Fiserv, Inc. The fund maintained a daily correlation of over 99% to its benchmark of -100% of the daily price movement of the S&P 500 Index. |
| Line Graph [Table Text Block] |
Table Summary | Inverse S&P 500® Strategy Fund (Class H) | S&P 500 Index |
|---|
3/31/16 | $10,000 | $10,000 |
|---|
3/31/17 | $8,453 | $11,717 |
|---|
3/31/18 | $7,402 | $13,357 |
|---|
3/31/19 | $6,785 | $14,625 |
|---|
3/31/20 | $6,842 | $13,605 |
|---|
3/31/21 | $4,148 | $21,271 |
|---|
3/31/22 | $3,469 | $24,599 |
|---|
3/31/23 | $3,717 | $22,698 |
|---|
3/31/24 | $3,109 | $29,480 |
|---|
3/31/25 | $3,087 | $31,913 |
|---|
3/31/26 | $2,721 | $37,594 |
|---|
|
| Average Annual Return [Table Text Block] |
Table SummaryAverage Annual Total Returns | One Year | Five Years | Ten Years |
|---|
Class H | -11.87% | -8.09% | -12.21% |
|---|
S&P 500 Index | 17.80% | 12.06% | 14.16% |
|---|
|
| AssetsNet |
$ 63,870,998
|
| Holdings Count | Holding |
15
|
| Advisory Fees Paid, Amount |
$ 352,027
|
| InvestmentCompanyPortfolioTurnover |
0.00%
|
| Additional Fund Statistics [Text Block] |
Fund Statistics as of March 31, 2026 - Net Assets$63,870,998
- Total Number of Portfolio Holdings15
- Portfolio Turnover Rate-%
- Total Advisory Fees Paid$352,027
|
| Holdings [Text Block] |
Holdings DiversificationFootnote Reference1 (% of Net Assets) as of March 31, 2026 Table SummaryValue | Value |
|---|
OTC Equity Index Swap Agreements Sold Short | -71.1% | Equity Futures Contracts Sold Short | -28.3% | |
| Largest Holdings [Text Block] |
Largest HoldingsFootnote Reference2 (% of Net Assets) as of March 31, 2026 Table SummaryGuggenheim Strategy Fund II | 10.2% |
|---|
Guggenheim Ultra Short Duration Fund — Institutional Class | 6.7% |
|---|
Total | 16.9% |
|---|
|
| Material Fund Change [Text Block] |
|
| C000010324 |
|
| Shareholder Report [Line Items] |
|
| Fund Name |
S&P 500<sup style="inset: 1.5px 0px 4px; box-sizing: border-box; color: rgb(83, 40, 79); display: inline; flex-wrap: nowrap; font-size: 20px; font-weight: 700; grid-area: auto; line-height: 0px; margin: 0px; overflow: visible; position: relative; text-align: left; text-align-last: auto; white-space-collapse: preserve-breaks;">®</sup> Pure Growth Fund
|
| Class Name |
Class A
|
| Trading Symbol |
RYLGX
|
| Annual or Semi-Annual Statement [Text Block] |
This annual shareholder report contains important information about the S&P 500® Pure Growth Fund for the period from April 1, 2025 to March 31, 2026.
|
| Shareholder Report Annual or Semi-Annual |
Annual Shareholder Report
|
| Additional Information [Text Block] |
You can find additional information about the fund at GuggenheimInvestments.com/mutual-funds/literature. You can also request this information by contacting 800 820 0888 or services@guggenheiminvestments.com.
|
| Additional Information Phone Number |
800 820 0888
|
| Additional Information Email |
<span style="box-sizing: border-box; color: rgb(67, 67, 67); display: inline; flex-wrap: nowrap; font-size: 10.6667px; font-weight: 400; grid-area: auto; line-height: 12.8px; margin: 0px; overflow: visible; text-align: left; text-align-last: auto; white-space-collapse: preserve-breaks;">services@guggenheiminvestments.com</span>
|
| Additional Information Website |
<span style="box-sizing: border-box; color: rgb(67, 67, 67); display: inline; flex-wrap: nowrap; font-size: 10.6667px; font-weight: 400; grid-area: auto; line-height: 12.8px; margin: 0px; overflow: visible; text-align: left; text-align-last: auto; white-space-collapse: preserve-breaks;">GuggenheimInvestments.com/mutual-funds/literature</span>
|
| Expenses [Text Block] |
What were the Fund's costs for the last year? * Based on a hypothetical $10,000 investment Table SummaryClass | Costs of a $10,000 Investment | Costs Paid as a % of a $10,000 Investment |
|---|
Class A | $170 | 1.54% |
|---|
Table Summary* | Excludes expenses of the underlying funds in which the fund invests, if any. |
|---|
|
| Expenses Paid, Amount |
$ 170
|
| Factors Affecting Performance [Text Block] |
What factors materially affected the Fund's performance over the last year? The sectors that contributed the most to the return of the underlying index for the reporting period were industrials, information technology, and consumer discretionary. The sectors that detracted were financials, health care, and energy. The holdings that contributed the most to the return of the underlying index for the reporting period were Sandisk Corp., Palantir Technologies, Inc.—Class A, and GE Vernova, Inc. Those that detracted the most were Trade Desk, Inc.—Class A, Robinhood Markets, Inc.—Class A, and AppLovin Corp.—Class A. The fund maintained a daily correlation of over 99% to the S&P 500 Pure Growth Index for the reporting period. |
| Line Graph [Table Text Block] |
Table Summary | S&P 500® Pure Growth Fund (Class A)‡ | S&P 500 Index | S&P 500 Pure Growth Index |
|---|
3/31/16 | $9,525 | $10,000 | $10,000 |
|---|
3/31/17 | $10,653 | $11,717 | $11,370 |
|---|
3/31/18 | $12,932 | $13,357 | $14,035 |
|---|
3/31/19 | $13,562 | $14,625 | $14,949 |
|---|
3/31/20 | $11,696 | $13,605 | $13,110 |
|---|
3/31/21 | $18,937 | $21,271 | $21,622 |
|---|
3/31/22 | $20,932 | $24,599 | $24,263 |
|---|
3/31/23 | $17,259 | $22,698 | $20,300 |
|---|
3/31/24 | $20,915 | $29,480 | $25,013 |
|---|
3/31/25 | $21,582 | $31,913 | $26,233 |
|---|
3/31/26 | $26,086 | $37,594 | $32,248 |
|---|
|
| Average Annual Return [Table Text Block] |
Table SummaryAverage Annual Total Returns | One Year | Five Years | Ten Years |
|---|
Class A (without sales charge) | 20.86% | 6.62% | 10.60% |
|---|
Class A (with sales charge) ‡ | 15.12% | 5.58% | 10.06% |
|---|
S&P 500 Index | 17.80% | 12.06% | 14.16% |
|---|
S&P 500 Pure Growth Index | 22.93% | 8.32% | 12.43% |
|---|
|
| AssetsNet |
$ 29,252,764
|
| Holdings Count | Holding |
66
|
| Advisory Fees Paid, Amount |
$ 250,869
|
| InvestmentCompanyPortfolioTurnover |
1178.00%
|
| Additional Fund Statistics [Text Block] |
Fund Statistics as of March 31, 2026 - Net Assets$29,252,764
- Total Number of Portfolio Holdings66
- Portfolio Turnover Rate1,178%
- Total Advisory Fees Paid$250,869
|
| Holdings [Text Block] |
Holdings DiversificationFootnote Reference1 (% of Net Assets) as of March 31, 2026 Table SummaryValue | Value |
|---|
Other | 4.5% | Financial | 5.6% | Consumer, Non-cyclical | 12.3% | Consumer, Cyclical | 16.4% | Communications | 18.4% | Industrial | 18.5% | Technology | 23.9% | |
| Largest Holdings [Text Block] |
10 Largest HoldingsFootnote Reference2 (% of Net Assets) as of March 31, 2026 Table SummarySandisk Corp. | 4.0% |
|---|
Comfort Systems USA, Inc. | 3.2% |
|---|
Ciena Corp. | 2.6% |
|---|
Berkshire Hathaway, Inc. — Class B | 2.6% |
|---|
Howmet Aerospace, Inc. | 2.3% |
|---|
Monolithic Power Systems, Inc. | 2.3% |
|---|
EchoStar Corp. — Class A | 2.3% |
|---|
Vertiv Holdings Co. — Class A | 2.2% |
|---|
KLA Corp. | 2.1% |
|---|
Amphenol Corp. — Class A | 2.0% |
|---|
Total | 25.6% |
|---|
|
| Material Fund Change [Text Block] |
|
| C000010325 |
|
| Shareholder Report [Line Items] |
|
| Fund Name |
S&P 500<sup style="inset: 1.5px 0px 4px; box-sizing: border-box; color: rgb(83, 40, 79); display: inline; flex-wrap: nowrap; font-size: 20px; font-weight: 700; grid-area: auto; line-height: 0px; margin: 0px; overflow: visible; position: relative; text-align: left; text-align-last: auto; white-space-collapse: preserve-breaks;">®</sup> Pure Growth Fund
|
| Class Name |
Class C
|
| Trading Symbol |
RYGRX
|
| Annual or Semi-Annual Statement [Text Block] |
This annual shareholder report contains important information about the S&P 500® Pure Growth Fund for the period from April 1, 2025 to March 31, 2026.
|
| Shareholder Report Annual or Semi-Annual |
Annual Shareholder Report
|
| Additional Information [Text Block] |
You can find additional information about the fund at GuggenheimInvestments.com/mutual-funds/literature. You can also request this information by contacting 800 820 0888 or services@guggenheiminvestments.com.
|
| Additional Information Phone Number |
800 820 0888
|
| Additional Information Email |
<span style="box-sizing: border-box; color: rgb(67, 67, 67); display: inline; flex-wrap: nowrap; font-size: 10.6667px; font-weight: 400; grid-area: auto; line-height: 12.8px; margin: 0px; overflow: visible; text-align: left; text-align-last: auto; white-space-collapse: preserve-breaks;">services@guggenheiminvestments.com</span>
|
| Additional Information Website |
<span style="box-sizing: border-box; color: rgb(67, 67, 67); display: inline; flex-wrap: nowrap; font-size: 10.6667px; font-weight: 400; grid-area: auto; line-height: 12.8px; margin: 0px; overflow: visible; text-align: left; text-align-last: auto; white-space-collapse: preserve-breaks;">GuggenheimInvestments.com/mutual-funds/literature</span>
|
| Expenses [Text Block] |
What were the Fund's costs for the last year? * Based on a hypothetical $10,000 investment Table SummaryClass | Costs of a $10,000 Investment | Costs Paid as a % of a $10,000 Investment |
|---|
Class C | $252 | 2.29% |
|---|
Table Summary* | Excludes expenses of the underlying funds in which the fund invests, if any. |
|---|
|
| Expenses Paid, Amount |
$ 252
|
| Factors Affecting Performance [Text Block] |
What factors materially affected the Fund's performance over the last year? The sectors that contributed the most to the return of the underlying index for the reporting period were industrials, information technology, and consumer discretionary. The sectors that detracted were financials, health care, and energy. The holdings that contributed the most to the return of the underlying index for the reporting period were Sandisk Corp., Palantir Technologies, Inc.—Class A, and GE Vernova, Inc. Those that detracted the most were Trade Desk, Inc.—Class A, Robinhood Markets, Inc.—Class A, and AppLovin Corp.—Class A. The fund maintained a daily correlation of over 99% to the S&P 500 Pure Growth Index for the reporting period. |
| Line Graph [Table Text Block] |
Table Summary | S&P 500® Pure Growth Fund (Class C) | S&P 500 Index | S&P 500 Pure Growth Index |
|---|
3/31/16 | $10,000 | $10,000 | $10,000 |
|---|
3/31/17 | $11,099 | $11,717 | $11,370 |
|---|
3/31/18 | $13,374 | $13,357 | $14,035 |
|---|
3/31/19 | $13,921 | $14,625 | $14,949 |
|---|
3/31/20 | $11,916 | $13,605 | $13,110 |
|---|
3/31/21 | $19,148 | $21,271 | $21,622 |
|---|
3/31/22 | $21,007 | $24,599 | $24,263 |
|---|
3/31/23 | $17,190 | $22,698 | $20,300 |
|---|
3/31/24 | $20,679 | $29,480 | $25,013 |
|---|
3/31/25 | $21,178 | $31,913 | $26,233 |
|---|
3/31/26 | $25,408 | $37,594 | $32,248 |
|---|
|
| Average Annual Return [Table Text Block] |
Table SummaryAverage Annual Total Returns | One Year | Five Years | Ten Years |
|---|
Class C (without CDSC) | 19.97% | 5.82% | 9.77% |
|---|
Class C (with CDSC) ‡ | 18.97% | 5.82% | 9.77% |
|---|
S&P 500 Index | 17.80% | 12.06% | 14.16% |
|---|
S&P 500 Pure Growth Index | 22.93% | 8.32% | 12.43% |
|---|
|
| AssetsNet |
$ 29,252,764
|
| Holdings Count | Holding |
66
|
| Advisory Fees Paid, Amount |
$ 250,869
|
| InvestmentCompanyPortfolioTurnover |
1178.00%
|
| Additional Fund Statistics [Text Block] |
Fund Statistics as of March 31, 2026 - Net Assets$29,252,764
- Total Number of Portfolio Holdings66
- Portfolio Turnover Rate1,178%
- Total Advisory Fees Paid$250,869
|
| Holdings [Text Block] |
Holdings DiversificationFootnote Reference1 (% of Net Assets) as of March 31, 2026 Table SummaryValue | Value |
|---|
Other | 4.5% | Financial | 5.6% | Consumer, Non-cyclical | 12.3% | Consumer, Cyclical | 16.4% | Communications | 18.4% | Industrial | 18.5% | Technology | 23.9% | |
| Largest Holdings [Text Block] |
10 Largest HoldingsFootnote Reference2 (% of Net Assets) as of March 31, 2026 Table SummarySandisk Corp. | 4.0% |
|---|
Comfort Systems USA, Inc. | 3.2% |
|---|
Ciena Corp. | 2.6% |
|---|
Berkshire Hathaway, Inc. — Class B | 2.6% |
|---|
Howmet Aerospace, Inc. | 2.3% |
|---|
Monolithic Power Systems, Inc. | 2.3% |
|---|
EchoStar Corp. — Class A | 2.3% |
|---|
Vertiv Holdings Co. — Class A | 2.2% |
|---|
KLA Corp. | 2.1% |
|---|
Amphenol Corp. — Class A | 2.0% |
|---|
Total | 25.6% |
|---|
|
| Material Fund Change [Text Block] |
|
| C000010323 |
|
| Shareholder Report [Line Items] |
|
| Fund Name |
S&P 500<sup style="inset: 1.5px 0px 4px; box-sizing: border-box; color: rgb(83, 40, 79); display: inline; flex-wrap: nowrap; font-size: 20px; font-weight: 700; grid-area: auto; line-height: 0px; margin: 0px; overflow: visible; position: relative; text-align: left; text-align-last: auto; white-space-collapse: preserve-breaks;">®</sup> Pure Growth Fund
|
| Class Name |
Class H
|
| Trading Symbol |
RYAWX
|
| Annual or Semi-Annual Statement [Text Block] |
This annual shareholder report contains important information about the S&P 500® Pure Growth Fund for the period from April 1, 2025 to March 31, 2026.
|
| Shareholder Report Annual or Semi-Annual |
Annual Shareholder Report
|
| Additional Information [Text Block] |
You can find additional information about the fund at GuggenheimInvestments.com/mutual-funds/literature. You can also request this information by contacting 800 820 0888 or services@guggenheiminvestments.com.
|
| Additional Information Phone Number |
800 820 0888
|
| Additional Information Email |
<span style="box-sizing: border-box; color: rgb(67, 67, 67); display: inline; flex-wrap: nowrap; font-size: 10.6667px; font-weight: 400; grid-area: auto; line-height: 12.8px; margin: 0px; overflow: visible; text-align: left; text-align-last: auto; white-space-collapse: preserve-breaks;">services@guggenheiminvestments.com</span>
|
| Additional Information Website |
<span style="box-sizing: border-box; color: rgb(67, 67, 67); display: inline; flex-wrap: nowrap; font-size: 10.6667px; font-weight: 400; grid-area: auto; line-height: 12.8px; margin: 0px; overflow: visible; text-align: left; text-align-last: auto; white-space-collapse: preserve-breaks;">GuggenheimInvestments.com/mutual-funds/literature</span>
|
| Expenses [Text Block] |
What were the Fund's costs for the last year? * Based on a hypothetical $10,000 investment Table SummaryClass | Costs of a $10,000 Investment | Costs Paid as a % of a $10,000 Investment |
|---|
Class H | $170 | 1.54% |
|---|
Table Summary* | Excludes expenses of the underlying funds in which the fund invests, if any. |
|---|
|
| Expenses Paid, Amount |
$ 170
|
| Factors Affecting Performance [Text Block] |
What factors materially affected the Fund's performance over the last year? The sectors that contributed the most to the return of the underlying index for the reporting period were industrials, information technology, and consumer discretionary. The sectors that detracted were financials, health care, and energy. The holdings that contributed the most to the return of the underlying index for the reporting period were Sandisk Corp., Palantir Technologies, Inc.—Class A, and GE Vernova, Inc. Those that detracted the most were Trade Desk, Inc.—Class A, Robinhood Markets, Inc.—Class A, and AppLovin Corp.—Class A. The fund maintained a daily correlation of over 99% to the S&P 500 Pure Growth Index for the reporting period. |
| Line Graph [Table Text Block] |
Table Summary | S&P 500® Pure Growth Fund (Class H) | S&P 500 Index | S&P 500 Pure Growth Index |
|---|
3/31/16 | $10,000 | $10,000 | $10,000 |
|---|
3/31/17 | $11,184 | $11,717 | $11,370 |
|---|
3/31/18 | $13,577 | $13,357 | $14,035 |
|---|
3/31/19 | $14,237 | $14,625 | $14,949 |
|---|
3/31/20 | $12,277 | $13,605 | $13,110 |
|---|
3/31/21 | $19,880 | $21,271 | $21,622 |
|---|
3/31/22 | $21,974 | $24,599 | $24,263 |
|---|
3/31/23 | $18,117 | $22,698 | $20,300 |
|---|
3/31/24 | $21,962 | $29,480 | $25,013 |
|---|
3/31/25 | $22,659 | $31,913 | $26,233 |
|---|
3/31/26 | $27,379 | $37,594 | $32,248 |
|---|
|
| Average Annual Return [Table Text Block] |
Table SummaryAverage Annual Total Returns | One Year | Five Years | Ten Years |
|---|
Class H | 20.84% | 6.61% | 10.60% |
|---|
S&P 500 Index | 17.80% | 12.06% | 14.16% |
|---|
S&P 500 Pure Growth Index | 22.93% | 8.32% | 12.43% |
|---|
|
| AssetsNet |
$ 29,252,764
|
| Holdings Count | Holding |
66
|
| Advisory Fees Paid, Amount |
$ 250,869
|
| InvestmentCompanyPortfolioTurnover |
1178.00%
|
| Additional Fund Statistics [Text Block] |
Fund Statistics as of March 31, 2026 - Net Assets$29,252,764
- Total Number of Portfolio Holdings66
- Portfolio Turnover Rate1,178%
- Total Advisory Fees Paid$250,869
|
| Holdings [Text Block] |
Holdings DiversificationFootnote Reference1 (% of Net Assets) as of March 31, 2026 Table SummaryValue | Value |
|---|
Other | 4.5% | Financial | 5.6% | Consumer, Non-cyclical | 12.3% | Consumer, Cyclical | 16.4% | Communications | 18.4% | Industrial | 18.5% | Technology | 23.9% | |
| Largest Holdings [Text Block] |
10 Largest HoldingsFootnote Reference2 (% of Net Assets) as of March 31, 2026 Table SummarySandisk Corp. | 4.0% |
|---|
Comfort Systems USA, Inc. | 3.2% |
|---|
Ciena Corp. | 2.6% |
|---|
Berkshire Hathaway, Inc. — Class B | 2.6% |
|---|
Howmet Aerospace, Inc. | 2.3% |
|---|
Monolithic Power Systems, Inc. | 2.3% |
|---|
EchoStar Corp. — Class A | 2.3% |
|---|
Vertiv Holdings Co. — Class A | 2.2% |
|---|
KLA Corp. | 2.1% |
|---|
Amphenol Corp. — Class A | 2.0% |
|---|
Total | 25.6% |
|---|
|
| Material Fund Change [Text Block] |
|
| C000010321 |
|
| Shareholder Report [Line Items] |
|
| Fund Name |
S&P 500<sup style="inset: 1.5px 0px 4px; box-sizing: border-box; color: rgb(83, 40, 79); display: inline; flex-wrap: nowrap; font-size: 20px; font-weight: 700; grid-area: auto; line-height: 0px; margin: 0px; overflow: visible; position: relative; text-align: left; text-align-last: auto; white-space-collapse: preserve-breaks;">®</sup> Pure Value Fund
|
| Class Name |
Class A
|
| Trading Symbol |
RYLVX
|
| Annual or Semi-Annual Statement [Text Block] |
This annual shareholder report contains important information about the S&P 500® Pure Value Fund for the period from April 1, 2025 to March 31, 2026.
|
| Shareholder Report Annual or Semi-Annual |
Annual Shareholder Report
|
| Additional Information [Text Block] |
You can find additional information about the fund at GuggenheimInvestments.com/mutual-funds/literature. You can also request this information by contacting 800 820 0888 or services@guggenheiminvestments.com.
|
| Additional Information Phone Number |
800 820 0888
|
| Additional Information Email |
<span style="box-sizing: border-box; color: rgb(67, 67, 67); display: inline; flex-wrap: nowrap; font-size: 10.6667px; font-weight: 400; grid-area: auto; line-height: 12.8px; margin: 0px; overflow: visible; text-align: left; text-align-last: auto; white-space-collapse: preserve-breaks;">services@guggenheiminvestments.com</span>
|
| Additional Information Website |
<span style="box-sizing: border-box; color: rgb(67, 67, 67); display: inline; flex-wrap: nowrap; font-size: 10.6667px; font-weight: 400; grid-area: auto; line-height: 12.8px; margin: 0px; overflow: visible; text-align: left; text-align-last: auto; white-space-collapse: preserve-breaks;">GuggenheimInvestments.com/mutual-funds/literature</span>
|
| Expenses [Text Block] |
What were the Fund's costs for the last year? * Based on a hypothetical $10,000 investment Table SummaryClass | Costs of a $10,000 Investment | Costs Paid as a % of a $10,000 Investment |
|---|
Class A | $168 | 1.54% |
|---|
Table Summary* | Excludes expenses of the underlying funds in which the fund invests, if any. |
|---|
|
| Expenses Paid, Amount |
$ 168
|
| Factors Affecting Performance [Text Block] |
What factors materially affected the Fund's performance over the last year? The sectors that contributed the most to the return of the underlying index for the reporting period were energy, financials, and consumer staples. Those that detracted the most were health care and real estate. The holdings that contributed the most to the return of the underlying index for the reporting period were Warner Bros Discovery Inc.—Series A, General Motors Co., and Bunge Global SA. Those that detracted the most were Centene Corp., Molina Healthcare, Inc., and CarMax, Inc. The fund maintained a daily correlation of over 99% to the S&P 500 Pure Value Index for the reporting period. |
| Line Graph [Table Text Block] |
Table Summary | S&P 500® Pure Value Fund (Class A)‡ | S&P 500 Index | S&P 500 Pure Value Index |
|---|
3/31/16 | $9,525 | $10,000 | $10,000 |
|---|
3/31/17 | $11,125 | $11,717 | $11,896 |
|---|
3/31/18 | $12,291 | $13,357 | $13,335 |
|---|
3/31/19 | $12,137 | $14,625 | $13,384 |
|---|
3/31/20 | $7,842 | $13,605 | $8,743 |
|---|
3/31/21 | $14,516 | $21,271 | $16,595 |
|---|
3/31/22 | $16,876 | $24,599 | $19,638 |
|---|
3/31/23 | $15,154 | $22,698 | $17,957 |
|---|
3/31/24 | $17,872 | $29,480 | $21,517 |
|---|
3/31/25 | $18,846 | $31,913 | $23,044 |
|---|
3/31/26 | $22,190 | $37,594 | $27,527 |
|---|
|
| Average Annual Return [Table Text Block] |
Table SummaryAverage Annual Total Returns | One Year | Five Years | Ten Years |
|---|
Class A (without sales charge) | 17.74% | 8.86% | 8.82% |
|---|
Class A (with sales charge) ‡ | 12.15% | 7.80% | 8.30% |
|---|
S&P 500 Index | 17.80% | 12.06% | 14.16% |
|---|
S&P 500 Pure Value Index | 20.43% | 10.49% | 10.66% |
|---|
|
| AssetsNet |
$ 107,754,324
|
| Holdings Count | Holding |
123
|
| Advisory Fees Paid, Amount |
$ 220,755
|
| InvestmentCompanyPortfolioTurnover |
2128.00%
|
| Additional Fund Statistics [Text Block] |
Fund Statistics as of March 31, 2026 - Net Assets$107,754,324
- Total Number of Portfolio Holdings123
- Portfolio Turnover Rate2,128%
- Total Advisory Fees Paid$220,755
|
| Holdings [Text Block] |
Holdings DiversificationFootnote Reference1 (% of Net Assets) as of March 31, 2026 Table SummaryValue | Value |
|---|
Other | 6.2% | Industrial | 5.8% | Communications | 6.2% | Basic Materials | 10.5% | Consumer, Cyclical | 11.4% | Energy | 11.7% | Financial | 18.6% | Consumer, Non-cyclical | 29.2% | |
| Largest Holdings [Text Block] |
10 Largest HoldingsFootnote Reference2 (% of Net Assets) as of March 31, 2026 Table SummaryDow, Inc. | 2.8% |
|---|
Bunge Global S.A. | 2.7% |
|---|
LyondellBasell Industries N.V. — Class A | 2.2% |
|---|
Archer-Daniels-Midland Co. | 2.2% |
|---|
Mosaic Co. | 2.0% |
|---|
Tyson Foods, Inc. — Class A | 1.9% |
|---|
Ford Motor Co. | 1.7% |
|---|
General Motors Co. | 1.7% |
|---|
Cigna Group | 1.7% |
|---|
Target Corp. | 1.6% |
|---|
Total | 20.5% |
|---|
|
| Material Fund Change [Text Block] |
|
| C000010322 |
|
| Shareholder Report [Line Items] |
|
| Fund Name |
S&P 500<sup style="inset: 1.5px 0px 4px; box-sizing: border-box; color: rgb(83, 40, 79); display: inline; flex-wrap: nowrap; font-size: 20px; font-weight: 700; grid-area: auto; line-height: 0px; margin: 0px; overflow: visible; position: relative; text-align: left; text-align-last: auto; white-space-collapse: preserve-breaks;">®</sup> Pure Value Fund
|
| Class Name |
Class C
|
| Trading Symbol |
RYVVX
|
| Annual or Semi-Annual Statement [Text Block] |
This annual shareholder report contains important information about the S&P 500® Pure Value Fund for the period from April 1, 2025 to March 31, 2026.
|
| Shareholder Report Annual or Semi-Annual |
Annual Shareholder Report
|
| Additional Information [Text Block] |
You can find additional information about the fund at GuggenheimInvestments.com/mutual-funds/literature. You can also request this information by contacting 800 820 0888 or services@guggenheiminvestments.com.
|
| Additional Information Phone Number |
800 820 0888
|
| Additional Information Email |
<span style="box-sizing: border-box; color: rgb(67, 67, 67); display: inline; flex-wrap: nowrap; font-size: 10.6667px; font-weight: 400; grid-area: auto; line-height: 12.8px; margin: 0px; overflow: visible; text-align: left; text-align-last: auto; white-space-collapse: preserve-breaks;">services@guggenheiminvestments.com</span>
|
| Additional Information Website |
<span style="box-sizing: border-box; color: rgb(67, 67, 67); display: inline; flex-wrap: nowrap; font-size: 10.6667px; font-weight: 400; grid-area: auto; line-height: 12.8px; margin: 0px; overflow: visible; text-align: left; text-align-last: auto; white-space-collapse: preserve-breaks;">GuggenheimInvestments.com/mutual-funds/literature</span>
|
| Expenses [Text Block] |
What were the Fund's costs for the last year? * Based on a hypothetical $10,000 investment Table SummaryClass | Costs of a $10,000 Investment | Costs Paid as a % of a $10,000 Investment |
|---|
Class C | $248 | 2.29% |
|---|
Table Summary* | Excludes expenses of the underlying funds in which the fund invests, if any. |
|---|
|
| Expenses Paid, Amount |
$ 248
|
| Factors Affecting Performance [Text Block] |
What factors materially affected the Fund's performance over the last year? The sectors that contributed the most to the return of the underlying index for the reporting period were energy, financials, and consumer staples. Those that detracted the most were health care and real estate. The holdings that contributed the most to the return of the underlying index for the reporting period were Warner Bros Discovery Inc.—Series A, General Motors Co., and Bunge Global SA. Those that detracted the most were Centene Corp., Molina Healthcare, Inc., and CarMax, Inc. The fund maintained a daily correlation of over 99% to the S&P 500 Pure Value Index for the reporting period. |
| Line Graph [Table Text Block] |
Table Summary | S&P 500® Pure Value Fund (Class C) | S&P 500 Index | S&P 500 Pure Value Index |
|---|
3/31/16 | $10,000 | $10,000 | $10,000 |
|---|
3/31/17 | $11,594 | $11,717 | $11,896 |
|---|
3/31/18 | $12,713 | $13,357 | $13,335 |
|---|
3/31/19 | $12,460 | $14,625 | $13,384 |
|---|
3/31/20 | $7,991 | $13,605 | $8,743 |
|---|
3/31/21 | $14,681 | $21,271 | $16,595 |
|---|
3/31/22 | $16,942 | $24,599 | $19,638 |
|---|
3/31/23 | $15,097 | $22,698 | $17,957 |
|---|
3/31/24 | $17,673 | $29,480 | $21,517 |
|---|
3/31/25 | $18,498 | $31,913 | $23,044 |
|---|
3/31/26 | $21,618 | $37,594 | $27,527 |
|---|
|
| Average Annual Return [Table Text Block] |
Table SummaryAverage Annual Total Returns | One Year | Five Years | Ten Years |
|---|
Class C (without CDSC) | 16.87% | 8.05% | 8.01% |
|---|
Class C (with CDSC) ‡ | 15.87% | 8.05% | 8.01% |
|---|
S&P 500 Index | 17.80% | 12.06% | 14.16% |
|---|
S&P 500 Pure Value Index | 20.43% | 10.49% | 10.66% |
|---|
|
| AssetsNet |
$ 107,754,324
|
| Holdings Count | Holding |
123
|
| Advisory Fees Paid, Amount |
$ 220,755
|
| InvestmentCompanyPortfolioTurnover |
2128.00%
|
| Additional Fund Statistics [Text Block] |
Fund Statistics as of March 31, 2026 - Net Assets$107,754,324
- Total Number of Portfolio Holdings123
- Portfolio Turnover Rate2,128%
- Total Advisory Fees Paid$220,755
|
| Holdings [Text Block] |
Holdings DiversificationFootnote Reference1 (% of Net Assets) as of March 31, 2026 Table SummaryValue | Value |
|---|
Other | 6.2% | Industrial | 5.8% | Communications | 6.2% | Basic Materials | 10.5% | Consumer, Cyclical | 11.4% | Energy | 11.7% | Financial | 18.6% | Consumer, Non-cyclical | 29.2% | |
| Largest Holdings [Text Block] |
10 Largest HoldingsFootnote Reference2 (% of Net Assets) as of March 31, 2026 Table SummaryDow, Inc. | 2.8% |
|---|
Bunge Global S.A. | 2.7% |
|---|
LyondellBasell Industries N.V. — Class A | 2.2% |
|---|
Archer-Daniels-Midland Co. | 2.2% |
|---|
Mosaic Co. | 2.0% |
|---|
Tyson Foods, Inc. — Class A | 1.9% |
|---|
Ford Motor Co. | 1.7% |
|---|
General Motors Co. | 1.7% |
|---|
Cigna Group | 1.7% |
|---|
Target Corp. | 1.6% |
|---|
Total | 20.5% |
|---|
|
| Material Fund Change [Text Block] |
|
| C000010320 |
|
| Shareholder Report [Line Items] |
|
| Fund Name |
S&P 500<sup style="inset: 1.5px 0px 4px; box-sizing: border-box; color: rgb(83, 40, 79); display: inline; flex-wrap: nowrap; font-size: 20px; font-weight: 700; grid-area: auto; line-height: 0px; margin: 0px; overflow: visible; position: relative; text-align: left; text-align-last: auto; white-space-collapse: preserve-breaks;">®</sup> Pure Value Fund
|
| Class Name |
Class H
|
| Trading Symbol |
RYZAX
|
| Annual or Semi-Annual Statement [Text Block] |
This annual shareholder report contains important information about the S&P 500® Pure Value Fund for the period from April 1, 2025 to March 31, 2026.
|
| Shareholder Report Annual or Semi-Annual |
Annual Shareholder Report
|
| Additional Information [Text Block] |
You can find additional information about the fund at GuggenheimInvestments.com/mutual-funds/literature. You can also request this information by contacting 800 820 0888 or services@guggenheiminvestments.com.
|
| Additional Information Phone Number |
800 820 0888
|
| Additional Information Email |
<span style="box-sizing: border-box; color: rgb(67, 67, 67); display: inline; flex-wrap: nowrap; font-size: 10.6667px; font-weight: 400; grid-area: auto; line-height: 12.8px; margin: 0px; overflow: visible; text-align: left; text-align-last: auto; white-space-collapse: preserve-breaks;">services@guggenheiminvestments.com</span>
|
| Additional Information Website |
<span style="box-sizing: border-box; color: rgb(67, 67, 67); display: inline; flex-wrap: nowrap; font-size: 10.6667px; font-weight: 400; grid-area: auto; line-height: 12.8px; margin: 0px; overflow: visible; text-align: left; text-align-last: auto; white-space-collapse: preserve-breaks;">GuggenheimInvestments.com/mutual-funds/literature</span>
|
| Expenses [Text Block] |
What were the Fund's costs for the last year? * Based on a hypothetical $10,000 investment Table SummaryClass | Costs of a $10,000 Investment | Costs Paid as a % of a $10,000 Investment |
|---|
Class H | $167 | 1.53% |
|---|
Table Summary* | Excludes expenses of the underlying funds in which the fund invests, if any. |
|---|
|
| Expenses Paid, Amount |
$ 167
|
| Factors Affecting Performance [Text Block] |
What factors materially affected the Fund's performance over the last year? The sectors that contributed the most to the return of the underlying index for the reporting period were energy, financials, and consumer staples. Those that detracted the most were health care and real estate. The holdings that contributed the most to the return of the underlying index for the reporting period were Warner Bros Discovery Inc.—Series A, General Motors Co., and Bunge Global SA. Those that detracted the most were Centene Corp., Molina Healthcare, Inc., and CarMax, Inc. The fund maintained a daily correlation of over 99% to the S&P 500 Pure Value Index for the reporting period. |
| Line Graph [Table Text Block] |
Table Summary | S&P 500® Pure Value Fund (Class H) | S&P 500 Index | S&P 500 Pure Value Index |
|---|
3/31/16 | $10,000 | $10,000 | $10,000 |
|---|
3/31/17 | $11,681 | $11,717 | $11,896 |
|---|
3/31/18 | $12,905 | $13,357 | $13,335 |
|---|
3/31/19 | $12,743 | $14,625 | $13,384 |
|---|
3/31/20 | $8,235 | $13,605 | $8,743 |
|---|
3/31/21 | $15,247 | $21,271 | $16,595 |
|---|
3/31/22 | $17,726 | $24,599 | $19,638 |
|---|
3/31/23 | $15,916 | $22,698 | $17,957 |
|---|
3/31/24 | $18,772 | $29,480 | $21,517 |
|---|
3/31/25 | $19,794 | $31,913 | $23,044 |
|---|
3/31/26 | $23,306 | $37,594 | $27,527 |
|---|
|
| Average Annual Return [Table Text Block] |
Table SummaryAverage Annual Total Returns | One Year | Five Years | Ten Years |
|---|
Class H | 17.74% | 8.86% | 8.83% |
|---|
S&P 500 Index | 17.80% | 12.06% | 14.16% |
|---|
S&P 500 Pure Value Index | 20.43% | 10.49% | 10.66% |
|---|
|
| AssetsNet |
$ 107,754,324
|
| Holdings Count | Holding |
123
|
| Advisory Fees Paid, Amount |
$ 220,755
|
| InvestmentCompanyPortfolioTurnover |
2128.00%
|
| Additional Fund Statistics [Text Block] |
Fund Statistics as of March 31, 2026 - Net Assets$107,754,324
- Total Number of Portfolio Holdings123
- Portfolio Turnover Rate2,128%
- Total Advisory Fees Paid$220,755
|
| Holdings [Text Block] |
Holdings DiversificationFootnote Reference1 (% of Net Assets) as of March 31, 2026 Table SummaryValue | Value |
|---|
Other | 6.2% | Industrial | 5.8% | Communications | 6.2% | Basic Materials | 10.5% | Consumer, Cyclical | 11.4% | Energy | 11.7% | Financial | 18.6% | Consumer, Non-cyclical | 29.2% | |
| Largest Holdings [Text Block] |
10 Largest HoldingsFootnote Reference2 (% of Net Assets) as of March 31, 2026 Table SummaryDow, Inc. | 2.8% |
|---|
Bunge Global S.A. | 2.7% |
|---|
LyondellBasell Industries N.V. — Class A | 2.2% |
|---|
Archer-Daniels-Midland Co. | 2.2% |
|---|
Mosaic Co. | 2.0% |
|---|
Tyson Foods, Inc. — Class A | 1.9% |
|---|
Ford Motor Co. | 1.7% |
|---|
General Motors Co. | 1.7% |
|---|
Cigna Group | 1.7% |
|---|
Target Corp. | 1.6% |
|---|
Total | 20.5% |
|---|
|
| Material Fund Change [Text Block] |
|
| C000010452 |
|
| Shareholder Report [Line Items] |
|
| Fund Name |
S&P MidCap 400<sup style="inset: 1.5px 0px 4px; box-sizing: border-box; color: rgb(83, 40, 79); display: inline; flex-wrap: nowrap; font-size: 20px; font-weight: 700; grid-area: auto; line-height: 0px; margin: 0px; overflow: visible; position: relative; text-align: left; text-align-last: auto; white-space-collapse: preserve-breaks;">®</sup> Pure Growth Fund
|
| Class Name |
Class A
|
| Trading Symbol |
RYMGX
|
| Annual or Semi-Annual Statement [Text Block] |
This annual shareholder report contains important information about the S&P MidCap 400® Pure Growth Fund for the period from April 1, 2025 to March 31, 2026.
|
| Shareholder Report Annual or Semi-Annual |
Annual Shareholder Report
|
| Additional Information [Text Block] |
You can find additional information about the fund at GuggenheimInvestments.com/mutual-funds/literature. You can also request this information by contacting 800 820 0888 or services@guggenheiminvestments.com.
|
| Additional Information Phone Number |
800 820 0888
|
| Additional Information Email |
<span style="box-sizing: border-box; color: rgb(67, 67, 67); display: inline; flex-wrap: nowrap; font-size: 10.6667px; font-weight: 400; grid-area: auto; line-height: 12.8px; margin: 0px; overflow: visible; text-align: left; text-align-last: auto; white-space-collapse: preserve-breaks;">services@guggenheiminvestments.com</span>
|
| Additional Information Website |
<span style="box-sizing: border-box; color: rgb(67, 67, 67); display: inline; flex-wrap: nowrap; font-size: 10.6667px; font-weight: 400; grid-area: auto; line-height: 12.8px; margin: 0px; overflow: visible; text-align: left; text-align-last: auto; white-space-collapse: preserve-breaks;">GuggenheimInvestments.com/mutual-funds/literature</span>
|
| Expenses [Text Block] |
What were the Fund's costs for the last year? * Based on a hypothetical $10,000 investment Table SummaryClass | Costs of a $10,000 Investment | Costs Paid as a % of a $10,000 Investment |
|---|
Class A | $172 | 1.54% |
|---|
Table Summary* | Excludes expenses of the underlying funds in which the fund invests, if any. |
|---|
|
| Expenses Paid, Amount |
$ 172
|
| Factors Affecting Performance [Text Block] |
What factors materially affected the Fund's performance over the last year? The sectors that contributed the most to the return of the underlying index for the reporting period were industrials, materials and energy. Those that detracted the most were consumer staples and utilities. The holdings that contributed the most to the return of the underlying index for the reporting period were Comfort Systems USA, Inc. Roivant Sciences Ltd., and Carpenter Technology Corp. Those that detracted the most were Sarepta Therapeutcis, Inc., Doximity, Inc.—Class A, and Sprouts Farmers Market, Inc. The fund maintained a daily correlation of over 99% to the S&P MidCap 400 Pure Growth Index for the reporting period. |
| Line Graph [Table Text Block] |
Table Summary | S&P MidCap 400® Pure Growth Fund (Class A)‡ | S&P 500 Index | S&P MidCap 400 Pure Growth Index |
|---|
3/31/16 | $9,525 | $10,000 | $10,000 |
|---|
3/31/17 | $10,571 | $11,717 | $11,263 |
|---|
3/31/18 | $12,192 | $13,357 | $13,191 |
|---|
3/31/19 | $11,681 | $14,625 | $12,842 |
|---|
3/31/20 | $8,598 | $13,605 | $9,562 |
|---|
3/31/21 | $16,641 | $21,271 | $18,841 |
|---|
3/31/22 | $15,298 | $24,599 | $17,569 |
|---|
3/31/23 | $13,720 | $22,698 | $16,007 |
|---|
3/31/24 | $18,867 | $29,480 | $22,409 |
|---|
3/31/25 | $16,171 | $31,913 | $19,525 |
|---|
3/31/26 | $20,045 | $37,594 | $24,581 |
|---|
|
| Average Annual Return [Table Text Block] |
Table SummaryAverage Annual Total Returns | One Year | Five Years | Ten Years |
|---|
Class A (without sales charge) | 23.96% | 3.79% | 7.72% |
|---|
Class A (with sales charge) ‡ | 18.07% | 2.79% | 7.20% |
|---|
S&P 500 Index | 17.80% | 12.06% | 14.16% |
|---|
S&P MidCap 400 Pure Growth Index | 25.89% | 5.46% | 9.42% |
|---|
|
| AssetsNet |
$ 127,295,935
|
| Holdings Count | Holding |
97
|
| Advisory Fees Paid, Amount |
$ 282,927
|
| InvestmentCompanyPortfolioTurnover |
1337.00%
|
| Additional Fund Statistics [Text Block] |
Fund Statistics as of March 31, 2026 - Net Assets$127,295,935
- Total Number of Portfolio Holdings97
- Portfolio Turnover Rate1,337%
- Total Advisory Fees Paid$282,927
|
| Holdings [Text Block] |
Holdings DiversificationFootnote Reference1 (% of Net Assets) as of March 31, 2026 Table SummaryValue | Value |
|---|
Other | 10.2% | Energy | 5.6% | Basic Materials | 5.7% | Technology | 10.1% | Consumer, Cyclical | 11.1% | Consumer, Non-cyclical | 25.8% | Industrial | 31.0% | |
| Largest Holdings [Text Block] |
10 Largest HoldingsFootnote Reference2 (% of Net Assets) as of March 31, 2026 Table SummaryTechnipFMC plc | 2.4% |
|---|
Valaris Ltd. | 2.4% |
|---|
Arrowhead Pharmaceuticals, Inc. | 2.2% |
|---|
Woodward, Inc. | 2.1% |
|---|
MasTec, Inc. | 2.0% |
|---|
Five Below, Inc. | 2.0% |
|---|
InterDigital, Inc. | 2.0% |
|---|
Carpenter Technology Corp. | 2.0% |
|---|
Halozyme Therapeutics, Inc. | 1.9% |
|---|
Sterling Infrastructure, Inc. | 1.8% |
|---|
Total | 20.8% |
|---|
|
| Material Fund Change [Text Block] |
|
| C000010453 |
|
| Shareholder Report [Line Items] |
|
| Fund Name |
S&P MidCap 400<sup style="inset: 1.5px 0px 4px; box-sizing: border-box; color: rgb(83, 40, 79); display: inline; flex-wrap: nowrap; font-size: 20px; font-weight: 700; grid-area: auto; line-height: 0px; margin: 0px; overflow: visible; position: relative; text-align: left; text-align-last: auto; white-space-collapse: preserve-breaks;">®</sup> Pure Growth Fund
|
| Class Name |
Class C
|
| Trading Symbol |
RYCKX
|
| Annual or Semi-Annual Statement [Text Block] |
This annual shareholder report contains important information about the S&P MidCap 400® Pure Growth Fund for the period from April 1, 2025 to March 31, 2026.
|
| Shareholder Report Annual or Semi-Annual |
Annual Shareholder Report
|
| Additional Information [Text Block] |
You can find additional information about the fund at GuggenheimInvestments.com/mutual-funds/literature. You can also request this information by contacting 800 820 0888 or services@guggenheiminvestments.com.
|
| Additional Information Phone Number |
800 820 0888
|
| Additional Information Email |
<span style="box-sizing: border-box; color: rgb(67, 67, 67); display: inline; flex-wrap: nowrap; font-size: 10.6667px; font-weight: 400; grid-area: auto; line-height: 12.8px; margin: 0px; overflow: visible; text-align: left; text-align-last: auto; white-space-collapse: preserve-breaks;">services@guggenheiminvestments.com</span>
|
| Additional Information Website |
<span style="box-sizing: border-box; color: rgb(67, 67, 67); display: inline; flex-wrap: nowrap; font-size: 10.6667px; font-weight: 400; grid-area: auto; line-height: 12.8px; margin: 0px; overflow: visible; text-align: left; text-align-last: auto; white-space-collapse: preserve-breaks;">GuggenheimInvestments.com/mutual-funds/literature</span>
|
| Expenses [Text Block] |
What were the Fund's costs for the last year? * Based on a hypothetical $10,000 investment Table SummaryClass | Costs of a $10,000 Investment | Costs Paid as a % of a $10,000 Investment |
|---|
Class C | $255 | 2.29% |
|---|
Table Summary* | Excludes expenses of the underlying funds in which the fund invests, if any. |
|---|
|
| Expenses Paid, Amount |
$ 255
|
| Factors Affecting Performance [Text Block] |
What factors materially affected the Fund's performance over the last year? The sectors that contributed the most to the return of the underlying index for the reporting period were industrials, materials and energy. Those that detracted the most were consumer staples and utilities. The holdings that contributed the most to the return of the underlying index for the reporting period were Comfort Systems USA, Inc. Roivant Sciences Ltd., and Carpenter Technology Corp. Those that detracted the most were Sarepta Therapeutcis, Inc., Doximity, Inc.—Class A, and Sprouts Farmers Market, Inc. The fund maintained a daily correlation of over 99% to the S&P MidCap 400 Pure Growth Index for the reporting period. |
| Line Graph [Table Text Block] |
Table Summary | S&P MidCap 400® Pure Growth Fund (Class C) | S&P 500 Index | S&P MidCap 400 Pure Growth Index |
|---|
3/31/16 | $10,000 | $10,000 | $10,000 |
|---|
3/31/17 | $11,016 | $11,717 | $11,263 |
|---|
3/31/18 | $12,610 | $13,357 | $13,191 |
|---|
3/31/19 | $11,991 | $14,625 | $12,842 |
|---|
3/31/20 | $8,760 | $13,605 | $9,562 |
|---|
3/31/21 | $16,830 | $21,271 | $18,841 |
|---|
3/31/22 | $15,355 | $24,599 | $17,569 |
|---|
3/31/23 | $13,666 | $22,698 | $16,007 |
|---|
3/31/24 | $18,654 | $29,480 | $22,409 |
|---|
3/31/25 | $15,872 | $31,913 | $19,525 |
|---|
3/31/26 | $19,528 | $37,594 | $24,581 |
|---|
|
| Average Annual Return [Table Text Block] |
Table SummaryAverage Annual Total Returns | One Year | Five Years | Ten Years |
|---|
Class C (without CDSC) | 23.07% | 3.02% | 6.92% |
|---|
Class C (with CDSC) ‡ | 22.07% | 3.02% | 6.92% |
|---|
S&P 500 Index | 17.80% | 12.06% | 14.16% |
|---|
S&P MidCap 400 Pure Growth Index | 25.89% | 5.46% | 9.42% |
|---|
|
| AssetsNet |
$ 127,295,935
|
| Holdings Count | Holding |
97
|
| Advisory Fees Paid, Amount |
$ 282,927
|
| InvestmentCompanyPortfolioTurnover |
1337.00%
|
| Additional Fund Statistics [Text Block] |
Fund Statistics as of March 31, 2026 - Net Assets$127,295,935
- Total Number of Portfolio Holdings97
- Portfolio Turnover Rate1,337%
- Total Advisory Fees Paid$282,927
|
| Holdings [Text Block] |
Holdings DiversificationFootnote Reference1 (% of Net Assets) as of March 31, 2026 Table SummaryValue | Value |
|---|
Other | 10.2% | Energy | 5.6% | Basic Materials | 5.7% | Technology | 10.1% | Consumer, Cyclical | 11.1% | Consumer, Non-cyclical | 25.8% | Industrial | 31.0% | |
| Largest Holdings [Text Block] |
10 Largest HoldingsFootnote Reference2 (% of Net Assets) as of March 31, 2026 Table SummaryTechnipFMC plc | 2.4% |
|---|
Valaris Ltd. | 2.4% |
|---|
Arrowhead Pharmaceuticals, Inc. | 2.2% |
|---|
Woodward, Inc. | 2.1% |
|---|
MasTec, Inc. | 2.0% |
|---|
Five Below, Inc. | 2.0% |
|---|
InterDigital, Inc. | 2.0% |
|---|
Carpenter Technology Corp. | 2.0% |
|---|
Halozyme Therapeutics, Inc. | 1.9% |
|---|
Sterling Infrastructure, Inc. | 1.8% |
|---|
Total | 20.8% |
|---|
|
| Material Fund Change [Text Block] |
|
| C000010451 |
|
| Shareholder Report [Line Items] |
|
| Fund Name |
S&P MidCap 400<sup style="inset: 1.5px 0px 4px; box-sizing: border-box; color: rgb(83, 40, 79); display: inline; flex-wrap: nowrap; font-size: 20px; font-weight: 700; grid-area: auto; line-height: 0px; margin: 0px; overflow: visible; position: relative; text-align: left; text-align-last: auto; white-space-collapse: preserve-breaks;">®</sup> Pure Growth Fund
|
| Class Name |
Class H
|
| Trading Symbol |
RYBHX
|
| Annual or Semi-Annual Statement [Text Block] |
This annual shareholder report contains important information about the S&P MidCap 400® Pure Growth Fund for the period from April 1, 2025 to March 31, 2026.
|
| Shareholder Report Annual or Semi-Annual |
Annual Shareholder Report
|
| Additional Information [Text Block] |
You can find additional information about the fund at GuggenheimInvestments.com/mutual-funds/literature. You can also request this information by contacting 800 820 0888 or services@guggenheiminvestments.com.
|
| Additional Information Phone Number |
800 820 0888
|
| Additional Information Email |
<span style="box-sizing: border-box; color: rgb(67, 67, 67); display: inline; flex-wrap: nowrap; font-size: 10.6667px; font-weight: 400; grid-area: auto; line-height: 12.8px; margin: 0px; overflow: visible; text-align: left; text-align-last: auto; white-space-collapse: preserve-breaks;">services@guggenheiminvestments.com</span>
|
| Additional Information Website |
<span style="box-sizing: border-box; color: rgb(67, 67, 67); display: inline; flex-wrap: nowrap; font-size: 10.6667px; font-weight: 400; grid-area: auto; line-height: 12.8px; margin: 0px; overflow: visible; text-align: left; text-align-last: auto; white-space-collapse: preserve-breaks;">GuggenheimInvestments.com/mutual-funds/literature</span>
|
| Expenses [Text Block] |
What were the Fund's costs for the last year? * Based on a hypothetical $10,000 investment Table SummaryClass | Costs of a $10,000 Investment | Costs Paid as a % of a $10,000 Investment |
|---|
Class H | $173 | 1.54% |
|---|
Table Summary* | Excludes expenses of the underlying funds in which the fund invests, if any. |
|---|
|
| Expenses Paid, Amount |
$ 173
|
| Factors Affecting Performance [Text Block] |
What factors materially affected the Fund's performance over the last year? The sectors that contributed the most to the return of the underlying index for the reporting period were industrials, materials and energy. Those that detracted the most were consumer staples and utilities. The holdings that contributed the most to the return of the underlying index for the reporting period were Comfort Systems USA, Inc. Roivant Sciences Ltd., and Carpenter Technology Corp. Those that detracted the most were Sarepta Therapeutcis, Inc., Doximity, Inc.—Class A, and Sprouts Farmers Market, Inc. The fund maintained a daily correlation of over 99% to the S&P MidCap 400 Pure Growth Index for the reporting period. |
| Line Graph [Table Text Block] |
Table Summary | S&P MidCap 400® Pure Growth Fund (Class H) | S&P 500 Index | S&P MidCap 400 Pure Growth Index |
|---|
3/31/16 | $10,000 | $10,000 | $10,000 |
|---|
3/31/17 | $11,099 | $11,717 | $11,263 |
|---|
3/31/18 | $12,799 | $13,357 | $13,191 |
|---|
3/31/19 | $12,263 | $14,625 | $12,842 |
|---|
3/31/20 | $9,028 | $13,605 | $9,562 |
|---|
3/31/21 | $17,472 | $21,271 | $18,841 |
|---|
3/31/22 | $16,058 | $24,599 | $17,569 |
|---|
3/31/23 | $14,401 | $22,698 | $16,007 |
|---|
3/31/24 | $19,792 | $29,480 | $22,409 |
|---|
3/31/25 | $16,969 | $31,913 | $19,525 |
|---|
3/31/26 | $21,048 | $37,594 | $24,581 |
|---|
|
| Average Annual Return [Table Text Block] |
Table SummaryAverage Annual Total Returns | One Year | Five Years | Ten Years |
|---|
Class H | 24.04% | 3.79% | 7.73% |
|---|
S&P 500 Index | 17.80% | 12.06% | 14.16% |
|---|
S&P MidCap 400 Pure Growth Index | 25.89% | 5.46% | 9.42% |
|---|
|
| AssetsNet |
$ 127,295,935
|
| Holdings Count | Holding |
97
|
| Advisory Fees Paid, Amount |
$ 282,927
|
| InvestmentCompanyPortfolioTurnover |
1337.00%
|
| Additional Fund Statistics [Text Block] |
Fund Statistics as of March 31, 2026 - Net Assets$127,295,935
- Total Number of Portfolio Holdings97
- Portfolio Turnover Rate1,337%
- Total Advisory Fees Paid$282,927
|
| Holdings [Text Block] |
Holdings DiversificationFootnote Reference1 (% of Net Assets) as of March 31, 2026 Table SummaryValue | Value |
|---|
Other | 10.2% | Energy | 5.6% | Basic Materials | 5.7% | Technology | 10.1% | Consumer, Cyclical | 11.1% | Consumer, Non-cyclical | 25.8% | Industrial | 31.0% | |
| Largest Holdings [Text Block] |
10 Largest HoldingsFootnote Reference2 (% of Net Assets) as of March 31, 2026 Table SummaryTechnipFMC plc | 2.4% |
|---|
Valaris Ltd. | 2.4% |
|---|
Arrowhead Pharmaceuticals, Inc. | 2.2% |
|---|
Woodward, Inc. | 2.1% |
|---|
MasTec, Inc. | 2.0% |
|---|
Five Below, Inc. | 2.0% |
|---|
InterDigital, Inc. | 2.0% |
|---|
Carpenter Technology Corp. | 2.0% |
|---|
Halozyme Therapeutics, Inc. | 1.9% |
|---|
Sterling Infrastructure, Inc. | 1.8% |
|---|
Total | 20.8% |
|---|
|
| Material Fund Change [Text Block] |
|
| C000010449 |
|
| Shareholder Report [Line Items] |
|
| Fund Name |
S&P MidCap 400<sup style="inset: 1.5px 0px 4px; box-sizing: border-box; color: rgb(83, 40, 79); display: inline; flex-wrap: nowrap; font-size: 20px; font-weight: 700; grid-area: auto; line-height: 0px; margin: 0px; overflow: visible; position: relative; text-align: left; text-align-last: auto; white-space-collapse: preserve-breaks;">®</sup> Pure Value Fund
|
| Class Name |
Class A
|
| Trading Symbol |
RYMVX
|
| Annual or Semi-Annual Statement [Text Block] |
This annual shareholder report contains important information about the S&P MidCap 400® Pure Value Fund for the period from April 1, 2025 to March 31, 2026.
|
| Shareholder Report Annual or Semi-Annual |
Annual Shareholder Report
|
| Additional Information [Text Block] |
You can find additional information about the fund at GuggenheimInvestments.com/mutual-funds/literature. You can also request this information by contacting 800 820 0888 or services@guggenheiminvestments.com.
|
| Additional Information Phone Number |
800 820 0888
|
| Additional Information Email |
<span style="box-sizing: border-box; color: rgb(67, 67, 67); display: inline; flex-wrap: nowrap; font-size: 10.6667px; font-weight: 400; grid-area: auto; line-height: 12.8px; margin: 0px; overflow: visible; text-align: left; text-align-last: auto; white-space-collapse: preserve-breaks;">services@guggenheiminvestments.com</span>
|
| Additional Information Website |
<span style="box-sizing: border-box; color: rgb(67, 67, 67); display: inline; flex-wrap: nowrap; font-size: 10.6667px; font-weight: 400; grid-area: auto; line-height: 12.8px; margin: 0px; overflow: visible; text-align: left; text-align-last: auto; white-space-collapse: preserve-breaks;">GuggenheimInvestments.com/mutual-funds/literature</span>
|
| Expenses [Text Block] |
What were the Fund's costs for the last year? * Based on a hypothetical $10,000 investment Table SummaryClass | Costs of a $10,000 Investment | Costs Paid as a % of a $10,000 Investment |
|---|
Class A | $165 | 1.54% |
|---|
Table Summary* | Excludes expenses of the underlying funds in which the fund invests, if any. |
|---|
|
| Expenses Paid, Amount |
$ 165
|
| Factors Affecting Performance [Text Block] |
What factors materially affected the Fund's performance over the last year? The sectors that contributed the most to the return of the underlying index for the reporting period were energy, consumer discretionary, and information technology. Those that detracted the most were health care, industrials, and consumer staples. The holdings that contributed the most to the return of the underlying index for the reporting period were PBF Energy, Inc.—Class A, HF Sinclair Corp., and Macy’s, Inc. Those that detracted the most were Concentrix Corp., ManpowerGroup, Inc., and Perrigo Co, Plc. The fund maintained a daily correlation of over 99% to the S&P MidCap 400 Pure Value Index for the reporting period. |
| Line Graph [Table Text Block] |
Table Summary | S&P MidCap 400® Pure Value Fund (Class A)‡ | S&P 500 Index | S&P MidCap 400 Pure Value Index |
|---|
3/31/16 | $9,525 | $10,000 | $10,000 |
|---|
3/31/17 | $11,557 | $11,717 | $12,400 |
|---|
3/31/18 | $12,208 | $13,357 | $13,320 |
|---|
3/31/19 | $12,188 | $14,625 | $13,557 |
|---|
3/31/20 | $7,209 | $13,605 | $8,199 |
|---|
3/31/21 | $16,573 | $21,271 | $19,383 |
|---|
3/31/22 | $17,678 | $24,599 | $21,063 |
|---|
3/31/23 | $17,445 | $22,698 | $21,227 |
|---|
3/31/24 | $22,069 | $29,480 | $27,346 |
|---|
3/31/25 | $21,099 | $31,913 | $26,649 |
|---|
3/31/26 | $24,244 | $37,594 | $31,146 |
|---|
|
| Average Annual Return [Table Text Block] |
Table SummaryAverage Annual Total Returns | One Year | Five Years | Ten Years |
|---|
Class A (without sales charge) | 14.91% | 7.90% | 9.79% |
|---|
Class A (with sales charge) ‡ | 9.44% | 6.86% | 9.26% |
|---|
S&P 500 Index | 17.80% | 12.06% | 14.16% |
|---|
S&P MidCap 400 Pure Value Index | 16.88% | 9.95% | 12.03% |
|---|
|
| AssetsNet |
$ 6,272,909
|
| Holdings Count | Holding |
100
|
| Advisory Fees Paid, Amount |
$ 80,396
|
| InvestmentCompanyPortfolioTurnover |
2930.00%
|
| Additional Fund Statistics [Text Block] |
Fund Statistics as of March 31, 2026 - Net Assets$6,272,909
- Total Number of Portfolio Holdings100
- Portfolio Turnover Rate2,930%
- Total Advisory Fees Paid$80,396
|
| Holdings [Text Block] |
Holdings DiversificationFootnote Reference1 (% of Net Assets) as of March 31, 2026 Table SummaryValue | Value |
|---|
Other | 3.4% | Basic Materials | 6.9% | Consumer, Non-cyclical | 10.1% | Energy | 13.7% | Industrial | 20.7% | Financial | 20.7% | Consumer, Cyclical | 23.8% | |
| Largest Holdings [Text Block] |
10 Largest HoldingsFootnote Reference2 (% of Net Assets) as of March 31, 2026 Table SummaryPBF Energy, Inc. — Class A | 3.3% |
|---|
Avnet, Inc. | 3.0% |
|---|
Arrow Electronics, Inc. | 2.9% |
|---|
Olin Corp. | 2.4% |
|---|
HF Sinclair Corp. | 2.4% |
|---|
Lear Corp. | 2.2% |
|---|
Brighthouse Financial, Inc. | 2.0% |
|---|
Chord Energy Corp. | 2.0% |
|---|
Concentrix Corp. | 1.9% |
|---|
TD SYNNEX Corp. | 1.9% |
|---|
Total | 24.0% |
|---|
|
| Material Fund Change [Text Block] |
|
| C000010450 |
|
| Shareholder Report [Line Items] |
|
| Fund Name |
S&P MidCap 400<sup style="inset: 1.5px 0px 4px; box-sizing: border-box; color: rgb(83, 40, 79); display: inline; flex-wrap: nowrap; font-size: 20px; font-weight: 700; grid-area: auto; line-height: 0px; margin: 0px; overflow: visible; position: relative; text-align: left; text-align-last: auto; white-space-collapse: preserve-breaks;">®</sup> Pure Value Fund
|
| Class Name |
Class C
|
| Trading Symbol |
RYMMX
|
| Annual or Semi-Annual Statement [Text Block] |
This annual shareholder report contains important information about the S&P MidCap 400® Pure Value Fund for the period from April 1, 2025 to March 31, 2026.
|
| Shareholder Report Annual or Semi-Annual |
Annual Shareholder Report
|
| Additional Information [Text Block] |
You can find additional information about the fund at GuggenheimInvestments.com/mutual-funds/literature. You can also request this information by contacting 800 820 0888 or services@guggenheiminvestments.com.
|
| Additional Information Phone Number |
800 820 0888
|
| Additional Information Email |
<span style="box-sizing: border-box; color: rgb(67, 67, 67); display: inline; flex-wrap: nowrap; font-size: 10.6667px; font-weight: 400; grid-area: auto; line-height: 12.8px; margin: 0px; overflow: visible; text-align: left; text-align-last: auto; white-space-collapse: preserve-breaks;">services@guggenheiminvestments.com</span>
|
| Additional Information Website |
<span style="box-sizing: border-box; color: rgb(67, 67, 67); display: inline; flex-wrap: nowrap; font-size: 10.6667px; font-weight: 400; grid-area: auto; line-height: 12.8px; margin: 0px; overflow: visible; text-align: left; text-align-last: auto; white-space-collapse: preserve-breaks;">GuggenheimInvestments.com/mutual-funds/literature</span>
|
| Expenses [Text Block] |
What were the Fund's costs for the last year? * Based on a hypothetical $10,000 investment Table SummaryClass | Costs of a $10,000 Investment | Costs Paid as a % of a $10,000 Investment |
|---|
Class C | $245 | 2.29% |
|---|
Table Summary* | Excludes expenses of the underlying funds in which the fund invests, if any. |
|---|
|
| Expenses Paid, Amount |
$ 245
|
| Factors Affecting Performance [Text Block] |
What factors materially affected the Fund's performance over the last year? The sectors that contributed the most to the return of the underlying index for the reporting period were energy, consumer discretionary, and information technology. Those that detracted the most were health care, industrials, and consumer staples. The holdings that contributed the most to the return of the underlying index for the reporting period were PBF Energy, Inc.—Class A, HF Sinclair Corp., and Macy’s, Inc. Those that detracted the most were Concentrix Corp., ManpowerGroup, Inc., and Perrigo Co, Plc. The fund maintained a daily correlation of over 99% to the S&P MidCap 400 Pure Value Index for the reporting period. |
| Line Graph [Table Text Block] |
Table Summary | S&P MidCap 400® Pure Value Fund (Class C) | S&P 500 Index | S&P MidCap 400 Pure Value Index |
|---|
3/31/16 | $10,000 | $10,000 | $10,000 |
|---|
3/31/17 | $12,046 | $11,717 | $12,400 |
|---|
3/31/18 | $12,627 | $13,357 | $13,320 |
|---|
3/31/19 | $12,516 | $14,625 | $13,557 |
|---|
3/31/20 | $7,345 | $13,605 | $8,199 |
|---|
3/31/21 | $16,764 | $21,271 | $19,383 |
|---|
3/31/22 | $17,748 | $24,599 | $21,063 |
|---|
3/31/23 | $17,381 | $22,698 | $21,227 |
|---|
3/31/24 | $21,827 | $29,480 | $27,346 |
|---|
3/31/25 | $20,712 | $31,913 | $26,649 |
|---|
3/31/26 | $23,618 | $37,594 | $31,146 |
|---|
|
| Average Annual Return [Table Text Block] |
Table SummaryAverage Annual Total Returns | One Year | Five Years | Ten Years |
|---|
Class C (without CDSC) | 14.04% | 7.09% | 8.97% |
|---|
Class C (with CDSC) ‡ | 13.04% | 7.09% | 8.97% |
|---|
S&P 500 Index | 17.80% | 12.06% | 14.16% |
|---|
S&P MidCap 400 Pure Value Index | 16.88% | 9.95% | 12.03% |
|---|
|
| AssetsNet |
$ 6,272,909
|
| Holdings Count | Holding |
100
|
| Advisory Fees Paid, Amount |
$ 80,396
|
| InvestmentCompanyPortfolioTurnover |
2930.00%
|
| Additional Fund Statistics [Text Block] |
Fund Statistics as of March 31, 2026 - Net Assets$6,272,909
- Total Number of Portfolio Holdings100
- Portfolio Turnover Rate2,930%
- Total Advisory Fees Paid$80,396
|
| Holdings [Text Block] |
Holdings DiversificationFootnote Reference1 (% of Net Assets) as of March 31, 2026 Table SummaryValue | Value |
|---|
Other | 3.4% | Basic Materials | 6.9% | Consumer, Non-cyclical | 10.1% | Energy | 13.7% | Industrial | 20.7% | Financial | 20.7% | Consumer, Cyclical | 23.8% | |
| Largest Holdings [Text Block] |
10 Largest HoldingsFootnote Reference2 (% of Net Assets) as of March 31, 2026 Table SummaryPBF Energy, Inc. — Class A | 3.3% |
|---|
Avnet, Inc. | 3.0% |
|---|
Arrow Electronics, Inc. | 2.9% |
|---|
Olin Corp. | 2.4% |
|---|
HF Sinclair Corp. | 2.4% |
|---|
Lear Corp. | 2.2% |
|---|
Brighthouse Financial, Inc. | 2.0% |
|---|
Chord Energy Corp. | 2.0% |
|---|
Concentrix Corp. | 1.9% |
|---|
TD SYNNEX Corp. | 1.9% |
|---|
Total | 24.0% |
|---|
|
| Material Fund Change [Text Block] |
|
| C000010448 |
|
| Shareholder Report [Line Items] |
|
| Fund Name |
S&P MidCap 400<sup style="inset: 1.5px 0px 4px; box-sizing: border-box; color: rgb(83, 40, 79); display: inline; flex-wrap: nowrap; font-size: 20px; font-weight: 700; grid-area: auto; line-height: 0px; margin: 0px; overflow: visible; position: relative; text-align: left; text-align-last: auto; white-space-collapse: preserve-breaks;">®</sup> Pure Value Fund
|
| Class Name |
Class H
|
| Trading Symbol |
RYAVX
|
| Annual or Semi-Annual Statement [Text Block] |
This annual shareholder report contains important information about the S&P MidCap 400® Pure Value Fund for the period from April 1, 2025 to March 31, 2026.
|
| Shareholder Report Annual or Semi-Annual |
Annual Shareholder Report
|
| Additional Information [Text Block] |
You can find additional information about the fund at GuggenheimInvestments.com/mutual-funds/literature. You can also request this information by contacting 800 820 0888 or services@guggenheiminvestments.com.
|
| Additional Information Phone Number |
800 820 0888
|
| Additional Information Email |
<span style="box-sizing: border-box; color: rgb(67, 67, 67); display: inline; flex-wrap: nowrap; font-size: 10.6667px; font-weight: 400; grid-area: auto; line-height: 12.8px; margin: 0px; overflow: visible; text-align: left; text-align-last: auto; white-space-collapse: preserve-breaks;">services@guggenheiminvestments.com</span>
|
| Additional Information Website |
<span style="box-sizing: border-box; color: rgb(67, 67, 67); display: inline; flex-wrap: nowrap; font-size: 10.6667px; font-weight: 400; grid-area: auto; line-height: 12.8px; margin: 0px; overflow: visible; text-align: left; text-align-last: auto; white-space-collapse: preserve-breaks;">GuggenheimInvestments.com/mutual-funds/literature</span>
|
| Expenses [Text Block] |
What were the Fund's costs for the last year? * Based on a hypothetical $10,000 investment Table SummaryClass | Costs of a $10,000 Investment | Costs Paid as a % of a $10,000 Investment |
|---|
Class H | $165 | 1.54% |
|---|
Table Summary* | Excludes expenses of the underlying funds in which the fund invests, if any. |
|---|
|
| Expenses Paid, Amount |
$ 165
|
| Factors Affecting Performance [Text Block] |
What factors materially affected the Fund's performance over the last year? The sectors that contributed the most to the return of the underlying index for the reporting period were energy, consumer discretionary, and information technology. Those that detracted the most were health care, industrials, and consumer staples. The holdings that contributed the most to the return of the underlying index for the reporting period were PBF Energy, Inc.—Class A, HF Sinclair Corp., and Macy’s, Inc. Those that detracted the most were Concentrix Corp., ManpowerGroup, Inc., and Perrigo Co, Plc. The fund maintained a daily correlation of over 99% to the S&P MidCap 400 Pure Value Index for the reporting period. |
| Line Graph [Table Text Block] |
Table Summary | S&P MidCap 400® Pure Value Fund (Class H) | S&P 500 Index | S&P MidCap 400 Pure Value Index |
|---|
3/31/16 | $10,000 | $10,000 | $10,000 |
|---|
3/31/17 | $12,136 | $11,717 | $12,400 |
|---|
3/31/18 | $12,814 | $13,357 | $13,320 |
|---|
3/31/19 | $12,793 | $14,625 | $13,557 |
|---|
3/31/20 | $7,566 | $13,605 | $8,199 |
|---|
3/31/21 | $17,395 | $21,271 | $19,383 |
|---|
3/31/22 | $18,557 | $24,599 | $21,063 |
|---|
3/31/23 | $18,315 | $22,698 | $21,227 |
|---|
3/31/24 | $23,181 | $29,480 | $27,346 |
|---|
3/31/25 | $22,155 | $31,913 | $26,649 |
|---|
3/31/26 | $25,446 | $37,594 | $31,146 |
|---|
|
| Average Annual Return [Table Text Block] |
Table SummaryAverage Annual Total Returns | One Year | Five Years | Ten Years |
|---|
Class H | 14.86% | 7.90% | 9.79% |
|---|
S&P 500 Index | 17.80% | 12.06% | 14.16% |
|---|
S&P MidCap 400 Pure Value Index | 16.88% | 9.95% | 12.03% |
|---|
|
| AssetsNet |
$ 6,272,909
|
| Holdings Count | Holding |
100
|
| Advisory Fees Paid, Amount |
$ 80,396
|
| InvestmentCompanyPortfolioTurnover |
2930.00%
|
| Additional Fund Statistics [Text Block] |
Fund Statistics as of March 31, 2026 - Net Assets$6,272,909
- Total Number of Portfolio Holdings100
- Portfolio Turnover Rate2,930%
- Total Advisory Fees Paid$80,396
|
| Holdings [Text Block] |
Holdings DiversificationFootnote Reference1 (% of Net Assets) as of March 31, 2026 Table SummaryValue | Value |
|---|
Other | 3.4% | Basic Materials | 6.9% | Consumer, Non-cyclical | 10.1% | Energy | 13.7% | Industrial | 20.7% | Financial | 20.7% | Consumer, Cyclical | 23.8% | |
| Largest Holdings [Text Block] |
10 Largest HoldingsFootnote Reference2 (% of Net Assets) as of March 31, 2026 Table SummaryPBF Energy, Inc. — Class A | 3.3% |
|---|
Avnet, Inc. | 3.0% |
|---|
Arrow Electronics, Inc. | 2.9% |
|---|
Olin Corp. | 2.4% |
|---|
HF Sinclair Corp. | 2.4% |
|---|
Lear Corp. | 2.2% |
|---|
Brighthouse Financial, Inc. | 2.0% |
|---|
Chord Energy Corp. | 2.0% |
|---|
Concentrix Corp. | 1.9% |
|---|
TD SYNNEX Corp. | 1.9% |
|---|
Total | 24.0% |
|---|
|
| Material Fund Change [Text Block] |
|
| C000010446 |
|
| Shareholder Report [Line Items] |
|
| Fund Name |
S&P SmallCap 600<sup style="inset: 1.5px 0px 4px; box-sizing: border-box; color: rgb(83, 40, 79); display: inline; flex-wrap: nowrap; font-size: 20px; font-weight: 700; grid-area: auto; line-height: 0px; margin: 0px; overflow: visible; position: relative; text-align: left; text-align-last: auto; white-space-collapse: preserve-breaks;">®</sup> Pure Growth Fund
|
| Class Name |
Class A
|
| Trading Symbol |
RYSGX
|
| Annual or Semi-Annual Statement [Text Block] |
This annual shareholder report contains important information about the S&P SmallCap 600® Pure Growth Fund for the period from April 1, 2025 to March 31, 2026.
|
| Shareholder Report Annual or Semi-Annual |
Annual Shareholder Report
|
| Additional Information [Text Block] |
You can find additional information about the fund at GuggenheimInvestments.com/mutual-funds/literature. You can also request this information by contacting 800 820 0888 or services@guggenheiminvestments.com.
|
| Additional Information Phone Number |
800 820 0888
|
| Additional Information Email |
<span style="box-sizing: border-box; color: rgb(67, 67, 67); display: inline; flex-wrap: nowrap; font-size: 10.6667px; font-weight: 400; grid-area: auto; line-height: 12.8px; margin: 0px; overflow: visible; text-align: left; text-align-last: auto; white-space-collapse: preserve-breaks;">services@guggenheiminvestments.com</span>
|
| Additional Information Website |
<span style="box-sizing: border-box; color: rgb(67, 67, 67); display: inline; flex-wrap: nowrap; font-size: 10.6667px; font-weight: 400; grid-area: auto; line-height: 12.8px; margin: 0px; overflow: visible; text-align: left; text-align-last: auto; white-space-collapse: preserve-breaks;">GuggenheimInvestments.com/mutual-funds/literature</span>
|
| Expenses [Text Block] |
What were the Fund's costs for the last year? * Based on a hypothetical $10,000 investment Table SummaryClass | Costs of a $10,000 Investment | Costs Paid as a % of a $10,000 Investment |
|---|
Class A | $169 | 1.53% |
|---|
Table Summary* | Excludes expenses of the underlying funds in which the fund invests, if any. |
|---|
|
| Expenses Paid, Amount |
$ 169
|
| Factors Affecting Performance [Text Block] |
What factors materially affected the Fund's performance over the last year? The sectors that contributed the most to the return of the underlying index for the reporting period were industrials, information technology, and financials. The sectors that detracted were consumer staples and communication services. The holdings that contributed the most to the return of the underlying index for the reporting period were Protagonist Therapeutics, Inc., Powell Industries, Inc., and Acadian Asset Management, Inc. Those that detracted the most were Corcept Therapeutics, Inc., Progyny, Inc., and Vital Farms, Inc. The fund maintained a daily correlation of over 99% to the S&P 600 Pure Growth Index for the reporting period. |
| Line Graph [Table Text Block] |
Table Summary | S&P SmallCap 600® Pure Growth Fund (Class A)‡ | S&P 500 Index | S&P SmallCap 600 Pure Growth Index |
|---|
3/31/16 | $9,525 | $10,000 | $10,000 |
|---|
3/31/17 | $11,948 | $11,717 | $12,795 |
|---|
3/31/18 | $13,549 | $13,357 | $14,746 |
|---|
3/31/19 | $13,232 | $14,625 | $14,672 |
|---|
3/31/20 | $8,896 | $13,605 | $10,022 |
|---|
3/31/21 | $18,103 | $21,271 | $20,808 |
|---|
3/31/22 | $16,098 | $24,599 | $18,847 |
|---|
3/31/23 | $13,548 | $22,698 | $16,097 |
|---|
3/31/24 | $16,764 | $29,480 | $20,208 |
|---|
3/31/25 | $15,990 | $31,913 | $19,655 |
|---|
3/31/26 | $19,302 | $37,594 | $24,170 |
|---|
|
| Average Annual Return [Table Text Block] |
Table SummaryAverage Annual Total Returns | One Year | Five Years | Ten Years |
|---|
Class A (without sales charge) | 20.71% | 1.29% | 7.32% |
|---|
Class A (with sales charge) ‡ | 14.98% | 0.31% | 6.80% |
|---|
S&P 500 Index | 17.80% | 12.06% | 14.16% |
|---|
S&P SmallCap 600 Pure Growth Index | 22.97% | 3.04% | 9.23% |
|---|
|
| AssetsNet |
$ 4,973,734
|
| Holdings Count | Holding |
135
|
| Advisory Fees Paid, Amount |
$ 68,302
|
| InvestmentCompanyPortfolioTurnover |
1133.00%
|
| Additional Fund Statistics [Text Block] |
Fund Statistics as of March 31, 2026 - Net Assets$4,973,734
- Total Number of Portfolio Holdings135
- Portfolio Turnover Rate1,133%
- Total Advisory Fees Paid$68,302
|
| Holdings [Text Block] |
Holdings DiversificationFootnote Reference1 (% of Net Assets) as of March 31, 2026 Table SummaryValue | Value |
|---|
Other | 3.1% | Consumer, Cyclical | 8.2% | Communications | 8.3% | Technology | 10.2% | Financial | 19.7% | Industrial | 20.7% | Consumer, Non-cyclical | 28.9% | |
| Largest Holdings [Text Block] |
10 Largest HoldingsFootnote Reference2 (% of Net Assets) as of March 31, 2026 Table SummaryDigitalOcean Holdings, Inc. | 1.7% |
|---|
Argan, Inc. | 1.6% |
|---|
Protagonist Therapeutics, Inc. | 1.6% |
|---|
Clear Secure, Inc. — Class A | 1.6% |
|---|
Powell Industries, Inc. | 1.5% |
|---|
Phibro Animal Health Corp. — Class A | 1.5% |
|---|
Uniti Group, Inc. | 1.4% |
|---|
Primoris Services Corp. | 1.4% |
|---|
PTC Therapeutics, Inc. | 1.4% |
|---|
ACM Research, Inc. — Class A | 1.4% |
|---|
Total | 15.1% |
|---|
|
| Material Fund Change [Text Block] |
|
| C000010447 |
|
| Shareholder Report [Line Items] |
|
| Fund Name |
S&P SmallCap 600<sup style="inset: 1.5px 0px 4px; box-sizing: border-box; color: rgb(83, 40, 79); display: inline; flex-wrap: nowrap; font-size: 20px; font-weight: 700; grid-area: auto; line-height: 0px; margin: 0px; overflow: visible; position: relative; text-align: left; text-align-last: auto; white-space-collapse: preserve-breaks;">®</sup> Pure Growth Fund
|
| Class Name |
Class C
|
| Trading Symbol |
RYWCX
|
| Annual or Semi-Annual Statement [Text Block] |
This annual shareholder report contains important information about the S&P SmallCap 600® Pure Growth Fund for the period from April 1, 2025 to March 31, 2026.
|
| Shareholder Report Annual or Semi-Annual |
Annual Shareholder Report
|
| Additional Information [Text Block] |
You can find additional information about the fund at GuggenheimInvestments.com/mutual-funds/literature. You can also request this information by contacting 800 820 0888 or services@guggenheiminvestments.com.
|
| Additional Information Phone Number |
800 820 0888
|
| Additional Information Email |
<span style="box-sizing: border-box; color: rgb(67, 67, 67); display: inline; flex-wrap: nowrap; font-size: 10.6667px; font-weight: 400; grid-area: auto; line-height: 12.8px; margin: 0px; overflow: visible; text-align: left; text-align-last: auto; white-space-collapse: preserve-breaks;">services@guggenheiminvestments.com</span>
|
| Additional Information Website |
<span style="box-sizing: border-box; color: rgb(67, 67, 67); display: inline; flex-wrap: nowrap; font-size: 10.6667px; font-weight: 400; grid-area: auto; line-height: 12.8px; margin: 0px; overflow: visible; text-align: left; text-align-last: auto; white-space-collapse: preserve-breaks;">GuggenheimInvestments.com/mutual-funds/literature</span>
|
| Expenses [Text Block] |
What were the Fund's costs for the last year? * Based on a hypothetical $10,000 investment Table SummaryClass | Costs of a $10,000 Investment | Costs Paid as a % of a $10,000 Investment |
|---|
Class C | $251 | 2.28% |
|---|
Table Summary* | Excludes expenses of the underlying funds in which the fund invests, if any. |
|---|
|
| Expenses Paid, Amount |
$ 251
|
| Factors Affecting Performance [Text Block] |
What factors materially affected the Fund's performance over the last year? The sectors that contributed the most to the return of the underlying index for the reporting period were industrials, information technology, and financials. The sectors that detracted were consumer staples and communication services. The holdings that contributed the most to the return of the underlying index for the reporting period were Protagonist Therapeutics, Inc., Powell Industries, Inc., and Acadian Asset Management, Inc. Those that detracted the most were Corcept Therapeutics, Inc., Progyny, Inc., and Vital Farms, Inc. The fund maintained a daily correlation of over 99% to the S&P 600 Pure Growth Index for the reporting period. |
| Line Graph [Table Text Block] |
Table Summary | S&P SmallCap 600® Pure Growth Fund (Class C) | S&P 500 Index | S&P SmallCap 600 Pure Growth Index |
|---|
3/31/16 | $10,000 | $10,000 | $10,000 |
|---|
3/31/17 | $12,451 | $11,717 | $12,795 |
|---|
3/31/18 | $14,010 | $13,357 | $14,746 |
|---|
3/31/19 | $13,581 | $14,625 | $14,672 |
|---|
3/31/20 | $9,061 | $13,605 | $10,022 |
|---|
3/31/21 | $18,304 | $21,271 | $20,808 |
|---|
3/31/22 | $16,153 | $24,599 | $18,847 |
|---|
3/31/23 | $13,495 | $22,698 | $16,097 |
|---|
3/31/24 | $16,573 | $29,480 | $20,208 |
|---|
3/31/25 | $15,689 | $31,913 | $19,655 |
|---|
3/31/26 | $18,798 | $37,594 | $24,170 |
|---|
|
| Average Annual Return [Table Text Block] |
Table SummaryAverage Annual Total Returns | One Year | Five Years | Ten Years |
|---|
Class C (without CDSC) | 19.85% | 0.53% | 6.51% |
|---|
Class C (with CDSC) ‡ | 18.85% | 0.53% | 6.51% |
|---|
S&P 500 Index | 17.80% | 12.06% | 14.16% |
|---|
S&P SmallCap 600 Pure Growth Index | 22.97% | 3.04% | 9.23% |
|---|
|
| AssetsNet |
$ 4,973,734
|
| Holdings Count | Holding |
135
|
| Advisory Fees Paid, Amount |
$ 68,302
|
| InvestmentCompanyPortfolioTurnover |
1133.00%
|
| Additional Fund Statistics [Text Block] |
Fund Statistics as of March 31, 2026 - Net Assets$4,973,734
- Total Number of Portfolio Holdings135
- Portfolio Turnover Rate1,133%
- Total Advisory Fees Paid$68,302
|
| Holdings [Text Block] |
Holdings DiversificationFootnote Reference1 (% of Net Assets) as of March 31, 2026 Table SummaryValue | Value |
|---|
Other | 3.1% | Consumer, Cyclical | 8.2% | Communications | 8.3% | Technology | 10.2% | Financial | 19.7% | Industrial | 20.7% | Consumer, Non-cyclical | 28.9% | |
| Largest Holdings [Text Block] |
10 Largest HoldingsFootnote Reference2 (% of Net Assets) as of March 31, 2026 Table SummaryDigitalOcean Holdings, Inc. | 1.7% |
|---|
Argan, Inc. | 1.6% |
|---|
Protagonist Therapeutics, Inc. | 1.6% |
|---|
Clear Secure, Inc. — Class A | 1.6% |
|---|
Powell Industries, Inc. | 1.5% |
|---|
Phibro Animal Health Corp. — Class A | 1.5% |
|---|
Uniti Group, Inc. | 1.4% |
|---|
Primoris Services Corp. | 1.4% |
|---|
PTC Therapeutics, Inc. | 1.4% |
|---|
ACM Research, Inc. — Class A | 1.4% |
|---|
Total | 15.1% |
|---|
|
| Material Fund Change [Text Block] |
|
| C000010445 |
|
| Shareholder Report [Line Items] |
|
| Fund Name |
S&P SmallCap 600<sup style="inset: 1.5px 0px 4px; box-sizing: border-box; color: rgb(83, 40, 79); display: inline; flex-wrap: nowrap; font-size: 20px; font-weight: 700; grid-area: auto; line-height: 0px; margin: 0px; overflow: visible; position: relative; text-align: left; text-align-last: auto; white-space-collapse: preserve-breaks;">®</sup> Pure Growth Fund
|
| Class Name |
Class H
|
| Trading Symbol |
RYWAX
|
| Annual or Semi-Annual Statement [Text Block] |
This annual shareholder report contains important information about the S&P SmallCap 600® Pure Growth Fund for the period from April 1, 2025 to March 31, 2026.
|
| Shareholder Report Annual or Semi-Annual |
Annual Shareholder Report
|
| Additional Information [Text Block] |
You can find additional information about the fund at GuggenheimInvestments.com/mutual-funds/literature. You can also request this information by contacting 800 820 0888 or services@guggenheiminvestments.com.
|
| Additional Information Phone Number |
800 820 0888
|
| Additional Information Email |
<span style="box-sizing: border-box; color: rgb(67, 67, 67); display: inline; flex-wrap: nowrap; font-size: 10.6667px; font-weight: 400; grid-area: auto; line-height: 12.8px; margin: 0px; overflow: visible; text-align: left; text-align-last: auto; white-space-collapse: preserve-breaks;">services@guggenheiminvestments.com</span>
|
| Additional Information Website |
<span style="box-sizing: border-box; color: rgb(67, 67, 67); display: inline; flex-wrap: nowrap; font-size: 10.6667px; font-weight: 400; grid-area: auto; line-height: 12.8px; margin: 0px; overflow: visible; text-align: left; text-align-last: auto; white-space-collapse: preserve-breaks;">GuggenheimInvestments.com/mutual-funds/literature</span>
|
| Expenses [Text Block] |
What were the Fund's costs for the last year? * Based on a hypothetical $10,000 investment Table SummaryClass | Costs of a $10,000 Investment | Costs Paid as a % of a $10,000 Investment |
|---|
Class H | $170 | 1.54% |
|---|
Table Summary* | Excludes expenses of the underlying funds in which the fund invests, if any. |
|---|
|
| Expenses Paid, Amount |
$ 170
|
| Factors Affecting Performance [Text Block] |
What factors materially affected the Fund's performance over the last year? The sectors that contributed the most to the return of the underlying index for the reporting period were industrials, information technology, and financials. The sectors that detracted were consumer staples and communication services. The holdings that contributed the most to the return of the underlying index for the reporting period were Protagonist Therapeutics, Inc., Powell Industries, Inc., and Acadian Asset Management, Inc. Those that detracted the most were Corcept Therapeutics, Inc., Progyny, Inc., and Vital Farms, Inc. The fund maintained a daily correlation of over 99% to the S&P 600 Pure Growth Index for the reporting period. |
| Line Graph [Table Text Block] |
Table Summary | S&P SmallCap 600® Pure Growth Fund (Class H) | S&P 500 Index | S&P SmallCap 600 Pure Growth Index |
|---|
3/31/16 | $10,000 | $10,000 | $10,000 |
|---|
3/31/17 | $12,546 | $11,717 | $12,795 |
|---|
3/31/18 | $14,224 | $13,357 | $14,746 |
|---|
3/31/19 | $13,893 | $14,625 | $14,672 |
|---|
3/31/20 | $9,340 | $13,605 | $10,022 |
|---|
3/31/21 | $19,004 | $21,271 | $20,808 |
|---|
3/31/22 | $16,903 | $24,599 | $18,847 |
|---|
3/31/23 | $14,206 | $22,698 | $16,097 |
|---|
3/31/24 | $17,583 | $29,480 | $20,208 |
|---|
3/31/25 | $16,768 | $31,913 | $19,655 |
|---|
3/31/26 | $20,233 | $37,594 | $24,170 |
|---|
|
| Average Annual Return [Table Text Block] |
Table SummaryAverage Annual Total Returns | One Year | Five Years | Ten Years |
|---|
Class H | 20.66% | 1.26% | 7.30% |
|---|
S&P 500 Index | 17.80% | 12.06% | 14.16% |
|---|
S&P SmallCap 600 Pure Growth Index | 22.97% | 3.04% | 9.23% |
|---|
|
| AssetsNet |
$ 4,973,734
|
| Holdings Count | Holding |
135
|
| Advisory Fees Paid, Amount |
$ 68,302
|
| InvestmentCompanyPortfolioTurnover |
1133.00%
|
| Additional Fund Statistics [Text Block] |
Fund Statistics as of March 31, 2026 - Net Assets$4,973,734
- Total Number of Portfolio Holdings135
- Portfolio Turnover Rate1,133%
- Total Advisory Fees Paid$68,302
|
| Holdings [Text Block] |
Holdings DiversificationFootnote Reference1 (% of Net Assets) as of March 31, 2026 Table SummaryValue | Value |
|---|
Other | 3.1% | Consumer, Cyclical | 8.2% | Communications | 8.3% | Technology | 10.2% | Financial | 19.7% | Industrial | 20.7% | Consumer, Non-cyclical | 28.9% | |
| Largest Holdings [Text Block] |
10 Largest HoldingsFootnote Reference2 (% of Net Assets) as of March 31, 2026 Table SummaryDigitalOcean Holdings, Inc. | 1.7% |
|---|
Argan, Inc. | 1.6% |
|---|
Protagonist Therapeutics, Inc. | 1.6% |
|---|
Clear Secure, Inc. — Class A | 1.6% |
|---|
Powell Industries, Inc. | 1.5% |
|---|
Phibro Animal Health Corp. — Class A | 1.5% |
|---|
Uniti Group, Inc. | 1.4% |
|---|
Primoris Services Corp. | 1.4% |
|---|
PTC Therapeutics, Inc. | 1.4% |
|---|
ACM Research, Inc. — Class A | 1.4% |
|---|
Total | 15.1% |
|---|
|
| Material Fund Change [Text Block] |
|
| C000010430 |
|
| Shareholder Report [Line Items] |
|
| Fund Name |
S&P SmallCap 600<sup style="inset: 1.5px 0px 4px; box-sizing: border-box; color: rgb(83, 40, 79); display: inline; flex-wrap: nowrap; font-size: 20px; font-weight: 700; grid-area: auto; line-height: 0px; margin: 0px; overflow: visible; position: relative; text-align: left; text-align-last: auto; white-space-collapse: preserve-breaks;">®</sup> Pure Value Fund
|
| Class Name |
Class A
|
| Trading Symbol |
RYSVX
|
| Annual or Semi-Annual Statement [Text Block] |
This annual shareholder report contains important information about the S&P SmallCap 600® Pure Value Fund for the period from April 1, 2025 to March 31, 2026.
|
| Shareholder Report Annual or Semi-Annual |
Annual Shareholder Report
|
| Additional Information [Text Block] |
You can find additional information about the fund at GuggenheimInvestments.com/mutual-funds/literature. You can also request this information by contacting 800 820 0888 or services@guggenheiminvestments.com.
|
| Additional Information Phone Number |
800 820 0888
|
| Additional Information Email |
<span style="box-sizing: border-box; color: rgb(67, 67, 67); display: inline; flex-wrap: nowrap; font-size: 10.6667px; font-weight: 400; grid-area: auto; line-height: 12.8px; margin: 0px; overflow: visible; text-align: left; text-align-last: auto; white-space-collapse: preserve-breaks;">services@guggenheiminvestments.com</span>
|
| Additional Information Website |
<span style="box-sizing: border-box; color: rgb(67, 67, 67); display: inline; flex-wrap: nowrap; font-size: 10.6667px; font-weight: 400; grid-area: auto; line-height: 12.8px; margin: 0px; overflow: visible; text-align: left; text-align-last: auto; white-space-collapse: preserve-breaks;">GuggenheimInvestments.com/mutual-funds/literature</span>
|
| Expenses [Text Block] |
What were the Fund's costs for the last year? * Based on a hypothetical $10,000 investment Table SummaryClass | Costs of a $10,000 Investment | Costs Paid as a % of a $10,000 Investment |
|---|
Class A | $172 | 1.53% |
|---|
Table Summary* | Excludes expenses of the underlying funds in which the fund invests, if any. |
|---|
|
| Expenses Paid, Amount |
$ 172
|
| Factors Affecting Performance [Text Block] |
What factors materially affected the Fund's performance over the last year? The sectors that contributed the most to the return of the underlying index for the reporting period were consumer discretionary, energy, and industrials. The health care industry detracted the most. The holdings that contributed the most to the return of the underlying index for the reporting period were ViaSat, Inc., Par Pacific Holdings, Inc., and Enviri Corp. Those that detracted the most were B&G Foods, Inc., AMN Healthcare Services, Inc., and Accendra Health, Inc. The fund maintained a daily correlation of over 99% to the S&P 600 Pure Value Index for the reporting period. |
| Line Graph [Table Text Block] |
Table Summary | S&P SmallCap 600® Pure Value Fund (Class A)‡ | S&P 500 Index | S&P SmallCap 600 Pure Value Index |
|---|
3/31/16 | $9,525 | $10,000 | $10,000 |
|---|
3/31/17 | $11,205 | $11,717 | $12,016 |
|---|
3/31/18 | $11,370 | $13,357 | $12,457 |
|---|
3/31/19 | $10,638 | $14,625 | $11,854 |
|---|
3/31/20 | $5,549 | $13,605 | $6,369 |
|---|
3/31/21 | $13,820 | $21,271 | $16,363 |
|---|
3/31/22 | $15,013 | $24,599 | $18,174 |
|---|
3/31/23 | $14,049 | $22,698 | $17,376 |
|---|
3/31/24 | $16,670 | $29,480 | $20,942 |
|---|
3/31/25 | $15,285 | $31,913 | $19,558 |
|---|
3/31/26 | $19,174 | $37,594 | $25,130 |
|---|
|
| Average Annual Return [Table Text Block] |
Table SummaryAverage Annual Total Returns | One Year | Five Years | Ten Years |
|---|
Class A (without sales charge) | 25.45% | 6.77% | 7.24% |
|---|
Class A (with sales charge) ‡ | 19.50% | 5.73% | 6.73% |
|---|
S&P 500 Index | 17.80% | 12.06% | 14.16% |
|---|
S&P SmallCap 600 Pure Value Index | 28.77% | 8.98% | 9.65% |
|---|
|
| AssetsNet |
$ 5,492,644
|
| Holdings Count | Holding |
161
|
| Advisory Fees Paid, Amount |
$ 76,690
|
| InvestmentCompanyPortfolioTurnover |
3783.00%
|
| Additional Fund Statistics [Text Block] |
Fund Statistics as of March 31, 2026 - Net Assets$5,492,644
- Total Number of Portfolio Holdings161
- Portfolio Turnover Rate3,783%
- Total Advisory Fees Paid$76,690
|
| Holdings [Text Block] |
Holdings DiversificationFootnote Reference1 (% of Net Assets) as of March 31, 2026 Table SummaryValue | Value |
|---|
Other | 8.7% | Basic Materials | 5.1% | Energy | 9.6% | Financial | 11.4% | Industrial | 13.0% | Consumer, Non-cyclical | 21.7% | Consumer, Cyclical | 29.8% | |
| Largest Holdings [Text Block] |
10 Largest HoldingsFootnote Reference2 (% of Net Assets) as of March 31, 2026 Table SummaryAcadia Healthcare Company, Inc. | 1.7% |
|---|
Patterson-UTI Energy, Inc. | 1.6% |
|---|
Ichor Holdings Ltd. | 1.5% |
|---|
Edgewell Personal Care Co. | 1.4% |
|---|
ManpowerGroup, Inc. | 1.3% |
|---|
Koppers Holdings, Inc. | 1.3% |
|---|
SM Energy Co. | 1.3% |
|---|
MarineMax, Inc. | 1.2% |
|---|
AdaptHealth Corp. | 1.2% |
|---|
Crescent Energy Co. — Class A | 1.2% |
|---|
Total | 13.7% |
|---|
|
| Material Fund Change [Text Block] |
|
| C000010431 |
|
| Shareholder Report [Line Items] |
|
| Fund Name |
S&P SmallCap 600<sup style="inset: 1.5px 0px 4px; box-sizing: border-box; color: rgb(83, 40, 79); display: inline; flex-wrap: nowrap; font-size: 20px; font-weight: 700; grid-area: auto; line-height: 0px; margin: 0px; overflow: visible; position: relative; text-align: left; text-align-last: auto; white-space-collapse: preserve-breaks;">®</sup> Pure Value Fund
|
| Class Name |
Class C
|
| Trading Symbol |
RYYCX
|
| Annual or Semi-Annual Statement [Text Block] |
This annual shareholder report contains important information about the S&P SmallCap 600® Pure Value Fund for the period from April 1, 2025 to March 31, 2026.
|
| Shareholder Report Annual or Semi-Annual |
Annual Shareholder Report
|
| Additional Information [Text Block] |
You can find additional information about the fund at GuggenheimInvestments.com/mutual-funds/literature. You can also request this information by contacting 800 820 0888 or services@guggenheiminvestments.com.
|
| Additional Information Phone Number |
800 820 0888
|
| Additional Information Email |
<span style="box-sizing: border-box; color: rgb(67, 67, 67); display: inline; flex-wrap: nowrap; font-size: 10.6667px; font-weight: 400; grid-area: auto; line-height: 12.8px; margin: 0px; overflow: visible; text-align: left; text-align-last: auto; white-space-collapse: preserve-breaks;">services@guggenheiminvestments.com</span>
|
| Additional Information Website |
<span style="box-sizing: border-box; color: rgb(67, 67, 67); display: inline; flex-wrap: nowrap; font-size: 10.6667px; font-weight: 400; grid-area: auto; line-height: 12.8px; margin: 0px; overflow: visible; text-align: left; text-align-last: auto; white-space-collapse: preserve-breaks;">GuggenheimInvestments.com/mutual-funds/literature</span>
|
| Expenses [Text Block] |
What were the Fund's costs for the last year? * Based on a hypothetical $10,000 investment Table SummaryClass | Costs of a $10,000 Investment | Costs Paid as a % of a $10,000 Investment |
|---|
Class C | $254 | 2.26% |
|---|
Table Summary* | Excludes expenses of the underlying funds in which the fund invests, if any. |
|---|
|
| Expenses Paid, Amount |
$ 254
|
| Factors Affecting Performance [Text Block] |
What factors materially affected the Fund's performance over the last year? The sectors that contributed the most to the return of the underlying index for the reporting period were consumer discretionary, energy, and industrials. The health care industry detracted the most. The holdings that contributed the most to the return of the underlying index for the reporting period were ViaSat, Inc., Par Pacific Holdings, Inc., and Enviri Corp. Those that detracted the most were B&G Foods, Inc., AMN Healthcare Services, Inc., and Accendra Health, Inc. The fund maintained a daily correlation of over 99% to the S&P 600 Pure Value Index for the reporting period. |
| Line Graph [Table Text Block] |
Table Summary | S&P SmallCap 600® Pure Value Fund (Class C) | S&P 500 Index | S&P SmallCap 600 Pure Value Index |
|---|
3/31/16 | $10,000 | $10,000 | $10,000 |
|---|
3/31/17 | $11,677 | $11,717 | $12,016 |
|---|
3/31/18 | $11,755 | $13,357 | $12,457 |
|---|
3/31/19 | $10,917 | $14,625 | $11,854 |
|---|
3/31/20 | $5,651 | $13,605 | $6,369 |
|---|
3/31/21 | $13,979 | $21,271 | $16,363 |
|---|
3/31/22 | $15,073 | $24,599 | $18,174 |
|---|
3/31/23 | $13,999 | $22,698 | $17,376 |
|---|
3/31/24 | $16,485 | $29,480 | $20,942 |
|---|
3/31/25 | $15,004 | $31,913 | $19,558 |
|---|
3/31/26 | $18,682 | $37,594 | $25,130 |
|---|
|
| Average Annual Return [Table Text Block] |
Table SummaryAverage Annual Total Returns | One Year | Five Years | Ten Years |
|---|
Class C (without CDSC) | 24.51% | 5.97% | 6.45% |
|---|
Class C (with CDSC) ‡ | 23.51% | 5.97% | 6.45% |
|---|
S&P 500 Index | 17.80% | 12.06% | 14.16% |
|---|
S&P SmallCap 600 Pure Value Index | 28.77% | 8.98% | 9.65% |
|---|
|
| AssetsNet |
$ 5,492,644
|
| Holdings Count | Holding |
161
|
| Advisory Fees Paid, Amount |
$ 76,690
|
| InvestmentCompanyPortfolioTurnover |
3783.00%
|
| Additional Fund Statistics [Text Block] |
Fund Statistics as of March 31, 2026 - Net Assets$5,492,644
- Total Number of Portfolio Holdings161
- Portfolio Turnover Rate3,783%
- Total Advisory Fees Paid$76,690
|
| Holdings [Text Block] |
Holdings DiversificationFootnote Reference1 (% of Net Assets) as of March 31, 2026 Table SummaryValue | Value |
|---|
Other | 8.7% | Basic Materials | 5.1% | Energy | 9.6% | Financial | 11.4% | Industrial | 13.0% | Consumer, Non-cyclical | 21.7% | Consumer, Cyclical | 29.8% | |
| Largest Holdings [Text Block] |
10 Largest HoldingsFootnote Reference2 (% of Net Assets) as of March 31, 2026 Table SummaryAcadia Healthcare Company, Inc. | 1.7% |
|---|
Patterson-UTI Energy, Inc. | 1.6% |
|---|
Ichor Holdings Ltd. | 1.5% |
|---|
Edgewell Personal Care Co. | 1.4% |
|---|
ManpowerGroup, Inc. | 1.3% |
|---|
Koppers Holdings, Inc. | 1.3% |
|---|
SM Energy Co. | 1.3% |
|---|
MarineMax, Inc. | 1.2% |
|---|
AdaptHealth Corp. | 1.2% |
|---|
Crescent Energy Co. — Class A | 1.2% |
|---|
Total | 13.7% |
|---|
|
| Material Fund Change [Text Block] |
|
| C000010429 |
|
| Shareholder Report [Line Items] |
|
| Fund Name |
S&P SmallCap 600<sup style="inset: 1.5px 0px 4px; box-sizing: border-box; color: rgb(83, 40, 79); display: inline; flex-wrap: nowrap; font-size: 20px; font-weight: 700; grid-area: auto; line-height: 0px; margin: 0px; overflow: visible; position: relative; text-align: left; text-align-last: auto; white-space-collapse: preserve-breaks;">®</sup> Pure Value Fund
|
| Class Name |
Class H
|
| Trading Symbol |
RYAZX
|
| Annual or Semi-Annual Statement [Text Block] |
This annual shareholder report contains important information about the S&P SmallCap 600® Pure Value Fund for the period from April 1, 2025 to March 31, 2026.
|
| Shareholder Report Annual or Semi-Annual |
Annual Shareholder Report
|
| Additional Information [Text Block] |
You can find additional information about the fund at GuggenheimInvestments.com/mutual-funds/literature. You can also request this information by contacting 800 820 0888 or services@guggenheiminvestments.com.
|
| Additional Information Phone Number |
800 820 0888
|
| Additional Information Email |
<span style="box-sizing: border-box; color: rgb(67, 67, 67); display: inline; flex-wrap: nowrap; font-size: 10.6667px; font-weight: 400; grid-area: auto; line-height: 12.8px; margin: 0px; overflow: visible; text-align: left; text-align-last: auto; white-space-collapse: preserve-breaks;">services@guggenheiminvestments.com</span>
|
| Additional Information Website |
<span style="box-sizing: border-box; color: rgb(67, 67, 67); display: inline; flex-wrap: nowrap; font-size: 10.6667px; font-weight: 400; grid-area: auto; line-height: 12.8px; margin: 0px; overflow: visible; text-align: left; text-align-last: auto; white-space-collapse: preserve-breaks;">GuggenheimInvestments.com/mutual-funds/literature</span>
|
| Expenses [Text Block] |
What were the Fund's costs for the last year? * Based on a hypothetical $10,000 investment Table SummaryClass | Costs of a $10,000 Investment | Costs Paid as a % of a $10,000 Investment |
|---|
Class H | $171 | 1.52% |
|---|
Table Summary* | Excludes expenses of the underlying funds in which the fund invests, if any. |
|---|
|
| Expenses Paid, Amount |
$ 171
|
| Factors Affecting Performance [Text Block] |
What factors materially affected the Fund's performance over the last year? The sectors that contributed the most to the return of the underlying index for the reporting period were consumer discretionary, energy, and industrials. The health care industry detracted the most. The holdings that contributed the most to the return of the underlying index for the reporting period were ViaSat, Inc., Par Pacific Holdings, Inc., and Enviri Corp. Those that detracted the most were B&G Foods, Inc., AMN Healthcare Services, Inc., and Accendra Health, Inc. The fund maintained a daily correlation of over 99% to the S&P 600 Pure Value Index for the reporting period. |
| Line Graph [Table Text Block] |
Table Summary | S&P SmallCap 600® Pure Value Fund (Class H) | S&P 500 Index | S&P SmallCap 600 Pure Value Index |
|---|
3/31/16 | $10,000 | $10,000 | $10,000 |
|---|
3/31/17 | $11,760 | $11,717 | $12,016 |
|---|
3/31/18 | $11,951 | $13,357 | $12,457 |
|---|
3/31/19 | $11,183 | $14,625 | $11,854 |
|---|
3/31/20 | $5,830 | $13,605 | $6,369 |
|---|
3/31/21 | $14,526 | $21,271 | $16,363 |
|---|
3/31/22 | $15,782 | $24,599 | $18,174 |
|---|
3/31/23 | $14,766 | $22,698 | $17,376 |
|---|
3/31/24 | $17,517 | $29,480 | $20,942 |
|---|
3/31/25 | $16,061 | $31,913 | $19,558 |
|---|
3/31/26 | $20,150 | $37,594 | $25,130 |
|---|
|
| Average Annual Return [Table Text Block] |
Table SummaryAverage Annual Total Returns | One Year | Five Years | Ten Years |
|---|
Class H | 25.45% | 6.76% | 7.26% |
|---|
S&P 500 Index | 17.80% | 12.06% | 14.16% |
|---|
S&P SmallCap 600 Pure Value Index | 28.77% | 8.98% | 9.65% |
|---|
|
| AssetsNet |
$ 5,492,644
|
| Holdings Count | Holding |
161
|
| Advisory Fees Paid, Amount |
$ 76,690
|
| InvestmentCompanyPortfolioTurnover |
3783.00%
|
| Additional Fund Statistics [Text Block] |
Fund Statistics as of March 31, 2026 - Net Assets$5,492,644
- Total Number of Portfolio Holdings161
- Portfolio Turnover Rate3,783%
- Total Advisory Fees Paid$76,690
|
| Holdings [Text Block] |
Holdings DiversificationFootnote Reference1 (% of Net Assets) as of March 31, 2026 Table SummaryValue | Value |
|---|
Other | 8.7% | Basic Materials | 5.1% | Energy | 9.6% | Financial | 11.4% | Industrial | 13.0% | Consumer, Non-cyclical | 21.7% | Consumer, Cyclical | 29.8% | |
| Largest Holdings [Text Block] |
10 Largest HoldingsFootnote Reference2 (% of Net Assets) as of March 31, 2026 Table SummaryAcadia Healthcare Company, Inc. | 1.7% |
|---|
Patterson-UTI Energy, Inc. | 1.6% |
|---|
Ichor Holdings Ltd. | 1.5% |
|---|
Edgewell Personal Care Co. | 1.4% |
|---|
ManpowerGroup, Inc. | 1.3% |
|---|
Koppers Holdings, Inc. | 1.3% |
|---|
SM Energy Co. | 1.3% |
|---|
MarineMax, Inc. | 1.2% |
|---|
AdaptHealth Corp. | 1.2% |
|---|
Crescent Energy Co. — Class A | 1.2% |
|---|
Total | 13.7% |
|---|
|
| Material Fund Change [Text Block] |
|
| C000129378 |
|
| Shareholder Report [Line Items] |
|
| Fund Name |
Emerging Markets Bond Strategy Fund
|
| Class Name |
Class A
|
| Trading Symbol |
RYIEX
|
| Annual or Semi-Annual Statement [Text Block] |
This annual shareholder report contains important information about the Emerging Markets Bond Strategy Fund for the period from April 1, 2025 to March 31, 2026.
|
| Shareholder Report Annual or Semi-Annual |
Annual Shareholder Report
|
| Additional Information [Text Block] |
You can find additional information about the fund at GuggenheimInvestments.com/mutual-funds/literature. You can also request this information by contacting 800 820 0888 or services@guggenheiminvestments.com.
|
| Additional Information Phone Number |
800 820 0888
|
| Additional Information Email |
<span style="box-sizing: border-box; color: rgb(67, 67, 67); display: inline; flex-wrap: nowrap; font-size: 10.6667px; font-weight: 400; grid-area: auto; line-height: 12.8px; margin: 0px; overflow: visible; text-align: left; text-align-last: auto; white-space-collapse: preserve-breaks;">services@guggenheiminvestments.com</span>
|
| Additional Information Website |
<span style="box-sizing: border-box; color: rgb(67, 67, 67); display: inline; flex-wrap: nowrap; font-size: 10.6667px; font-weight: 400; grid-area: auto; line-height: 12.8px; margin: 0px; overflow: visible; text-align: left; text-align-last: auto; white-space-collapse: preserve-breaks;">GuggenheimInvestments.com/mutual-funds/literature</span>
|
| Expenses [Text Block] |
What were the Fund's costs for the last year? * Based on a hypothetical $10,000 investment Table SummaryClass | Costs of a $10,000 Investment | Costs Paid as a % of a $10,000 Investment |
|---|
Class A | $164 | 1.59% |
|---|
Table Summary* | Excludes expenses of the underlying funds in which the fund invests, if any. |
|---|
|
| Expenses Paid, Amount |
$ 164
|
| Factors Affecting Performance [Text Block] |
What factors materially affected the Fund's performance over the last year? Credit default swap spreads were mixed for the emerging market countries that are part of the emerging markets credit default swap, with most experiencing modest moves. Bahrain saw a notable increase in credit default swap spreads due to geopolitical events in the Middle East. Nigeria, Egypt, and Panama experienced some of the larger decreases in credit default swap spreads. Abu Dhabi was removed from the emerging markets credit default swap, while Pakistan, Uruguay, Angola, Costa Rica, Ecuador, El Salvador, Guatemala, Kazakhstan, and Kenya were added. |
| Line Graph [Table Text Block] |
Table Summary | Emerging Markets Bond Strategy Fund (Class A)‡ | Bloomberg Emerging Markets USD Aggregate Bond Index | ICE BofA BBB & Lower Sovereign USD External Debt Index |
|---|
3/31/16 | $9,525 | $10,000 | $10,000 |
|---|
3/31/17 | $9,964 | $10,858 | $10,830 |
|---|
3/31/18 | $10,181 | $11,203 | $11,234 |
|---|
3/31/19 | $10,394 | $11,694 | $11,623 |
|---|
3/31/20 | $9,624 | $11,356 | $10,738 |
|---|
3/31/21 | $10,675 | $12,899 | $12,375 |
|---|
3/31/22 | $9,507 | $11,930 | $11,372 |
|---|
3/31/23 | $8,924 | $11,376 | $10,613 |
|---|
3/31/24 | $9,693 | $12,335 | $11,941 |
|---|
3/31/25 | $10,117 | $13,251 | $12,805 |
|---|
3/31/26 | $10,726 | $14,194 | $14,108 |
|---|
|
| Average Annual Return [Table Text Block] |
Table SummaryAverage Annual Total Returns | One Year | Five Years | Ten Years |
|---|
Class A (without sales charge) | 6.03% | 0.10% | 1.20% |
|---|
Class A (with sales charge) ‡ | 0.99% | -0.87% | 0.70% |
|---|
Bloomberg Emerging Markets USD Aggregate Bond Index | 7.11% | 1.93% | 3.56% |
|---|
ICE BofA BBB & Lower Sovereign USD External Debt Index | 10.17% | 2.66% | 3.50% |
|---|
|
| AssetsNet |
$ 268,904
|
| Holdings Count | Holding |
5
|
| Advisory Fees Paid, Amount |
$ 6,054
|
| InvestmentCompanyPortfolioTurnover |
0.00%
|
| Additional Fund Statistics [Text Block] |
Fund Statistics as of March 31, 2026 - Net Assets$268,904
- Total Number of Portfolio Holdings5
- Portfolio Turnover Rate-%
- Total Advisory Fees Paid$6,054
|
| Holdings [Text Block] |
Holdings DiversificationFootnote Reference1 (% of Net Assets) as of March 31, 2026 Table SummaryValue | Value |
|---|
OTC Credit Index Swap Agreements | 37.5% | Interest Rate Futures Contracts Purchased | 41.3% | Centrally Cleared Credit Default Swap Agreements Protection Sold | 74.4% | |
| Material Fund Change [Text Block] |
|
| C000129379 |
|
| Shareholder Report [Line Items] |
|
| Fund Name |
Emerging Markets Bond Strategy Fund
|
| Class Name |
Class C
|
| Trading Symbol |
RYFTX
|
| Annual or Semi-Annual Statement [Text Block] |
This annual shareholder report contains important information about the Emerging Markets Bond Strategy Fund for the period from April 1, 2025 to March 31, 2026.
|
| Shareholder Report Annual or Semi-Annual |
Annual Shareholder Report
|
| Additional Information [Text Block] |
You can find additional information about the fund at GuggenheimInvestments.com/mutual-funds/literature. You can also request this information by contacting 800 820 0888 or services@guggenheiminvestments.com.
|
| Additional Information Phone Number |
800 820 0888
|
| Additional Information Email |
<span style="box-sizing: border-box; color: rgb(67, 67, 67); display: inline; flex-wrap: nowrap; font-size: 10.6667px; font-weight: 400; grid-area: auto; line-height: 12.8px; margin: 0px; overflow: visible; text-align: left; text-align-last: auto; white-space-collapse: preserve-breaks;">services@guggenheiminvestments.com</span>
|
| Additional Information Website |
<span style="box-sizing: border-box; color: rgb(67, 67, 67); display: inline; flex-wrap: nowrap; font-size: 10.6667px; font-weight: 400; grid-area: auto; line-height: 12.8px; margin: 0px; overflow: visible; text-align: left; text-align-last: auto; white-space-collapse: preserve-breaks;">GuggenheimInvestments.com/mutual-funds/literature</span>
|
| Expenses [Text Block] |
What were the Fund's costs for the last year? * Based on a hypothetical $10,000 investment Table SummaryClass | Costs of a $10,000 Investment | Costs Paid as a % of a $10,000 Investment |
|---|
Class C | $239 | 2.33% |
|---|
Table Summary* | Excludes expenses of the underlying funds in which the fund invests, if any. |
|---|
|
| Expenses Paid, Amount |
$ 239
|
| Factors Affecting Performance [Text Block] |
What factors materially affected the Fund's performance over the last year? Credit default swap spreads were mixed for the emerging market countries that are part of the emerging markets credit default swap, with most experiencing modest moves. Bahrain saw a notable increase in credit default swap spreads due to geopolitical events in the Middle East. Nigeria, Egypt, and Panama experienced some of the larger decreases in credit default swap spreads. Abu Dhabi was removed from the emerging markets credit default swap, while Pakistan, Uruguay, Angola, Costa Rica, Ecuador, El Salvador, Guatemala, Kazakhstan, and Kenya were added. |
| Line Graph [Table Text Block] |
Table Summary | Emerging Markets Bond Strategy Fund (Class C) | Bloomberg Emerging Markets USD Aggregate Bond Index | ICE BofA BBB & Lower Sovereign USD External Debt Index |
|---|
3/31/16 | $10,000 | $10,000 | $10,000 |
|---|
3/31/17 | $10,409 | $10,858 | $10,830 |
|---|
3/31/18 | $10,555 | $11,203 | $11,234 |
|---|
3/31/19 | $10,697 | $11,694 | $11,623 |
|---|
3/31/20 | $9,828 | $11,356 | $10,738 |
|---|
3/31/21 | $10,820 | $12,899 | $12,375 |
|---|
3/31/22 | $9,566 | $11,930 | $11,372 |
|---|
3/31/23 | $8,911 | $11,376 | $10,613 |
|---|
3/31/24 | $9,604 | $12,335 | $11,941 |
|---|
3/31/25 | $9,949 | $13,251 | $12,805 |
|---|
3/31/26 | $10,470 | $14,194 | $14,108 |
|---|
|
| Average Annual Return [Table Text Block] |
Table SummaryAverage Annual Total Returns | One Year | Five Years | Ten Years |
|---|
Class C (without CDSC) | 5.24% | -0.65% | 0.46% |
|---|
Class C (with CDSC) ‡ | 4.24% | -0.65% | 0.46% |
|---|
Bloomberg Emerging Markets USD Aggregate Bond Index | 7.11% | 1.93% | 3.56% |
|---|
ICE BofA BBB & Lower Sovereign USD External Debt Index | 10.17% | 2.66% | 3.50% |
|---|
|
| AssetsNet |
$ 268,904
|
| Holdings Count | Holding |
5
|
| Advisory Fees Paid, Amount |
$ 6,054
|
| InvestmentCompanyPortfolioTurnover |
0.00%
|
| Additional Fund Statistics [Text Block] |
Fund Statistics as of March 31, 2026 - Net Assets$268,904
- Total Number of Portfolio Holdings5
- Portfolio Turnover Rate-%
- Total Advisory Fees Paid$6,054
|
| Holdings [Text Block] |
Holdings DiversificationFootnote Reference1 (% of Net Assets) as of March 31, 2026 Table SummaryValue | Value |
|---|
OTC Credit Index Swap Agreements | 37.5% | Interest Rate Futures Contracts Purchased | 41.3% | Centrally Cleared Credit Default Swap Agreements Protection Sold | 74.4% | |
| Material Fund Change [Text Block] |
|
| C000129380 |
|
| Shareholder Report [Line Items] |
|
| Fund Name |
Emerging Markets Bond Strategy Fund
|
| Class Name |
Class H
|
| Trading Symbol |
RYGTX
|
| Annual or Semi-Annual Statement [Text Block] |
This annual shareholder report contains important information about the Emerging Markets Bond Strategy Fund for the period from April 1, 2025 to March 31, 2026.
|
| Shareholder Report Annual or Semi-Annual |
Annual Shareholder Report
|
| Additional Information [Text Block] |
You can find additional information about the fund at GuggenheimInvestments.com/mutual-funds/literature. You can also request this information by contacting 800 820 0888 or services@guggenheiminvestments.com.
|
| Additional Information Phone Number |
800 820 0888
|
| Additional Information Email |
<span style="box-sizing: border-box; color: rgb(67, 67, 67); display: inline; flex-wrap: nowrap; font-size: 10.6667px; font-weight: 400; grid-area: auto; line-height: 12.8px; margin: 0px; overflow: visible; text-align: left; text-align-last: auto; white-space-collapse: preserve-breaks;">services@guggenheiminvestments.com</span>
|
| Additional Information Website |
<span style="box-sizing: border-box; color: rgb(67, 67, 67); display: inline; flex-wrap: nowrap; font-size: 10.6667px; font-weight: 400; grid-area: auto; line-height: 12.8px; margin: 0px; overflow: visible; text-align: left; text-align-last: auto; white-space-collapse: preserve-breaks;">GuggenheimInvestments.com/mutual-funds/literature</span>
|
| Expenses [Text Block] |
What were the Fund's costs for the last year? * Based on a hypothetical $10,000 investment Table SummaryClass | Costs of a $10,000 Investment | Costs Paid as a % of a $10,000 Investment |
|---|
Class H | $164 | 1.59% |
|---|
Table Summary* | Excludes expenses of the underlying funds in which the fund invests, if any. |
|---|
|
| Expenses Paid, Amount |
$ 164
|
| Factors Affecting Performance [Text Block] |
What factors materially affected the Fund's performance over the last year? Credit default swap spreads were mixed for the emerging market countries that are part of the emerging markets credit default swap, with most experiencing modest moves. Bahrain saw a notable increase in credit default swap spreads due to geopolitical events in the Middle East. Nigeria, Egypt, and Panama experienced some of the larger decreases in credit default swap spreads. Abu Dhabi was removed from the emerging markets credit default swap, while Pakistan, Uruguay, Angola, Costa Rica, Ecuador, El Salvador, Guatemala, Kazakhstan, and Kenya were added. |
| Line Graph [Table Text Block] |
Table Summary | Emerging Markets Bond Strategy Fund (Class H) | Bloomberg Emerging Markets USD Aggregate Bond Index | ICE BofA BBB & Lower Sovereign USD External Debt Index |
|---|
3/31/16 | $10,000 | $10,000 | $10,000 |
|---|
3/31/17 | $10,485 | $10,858 | $10,830 |
|---|
3/31/18 | $10,715 | $11,203 | $11,234 |
|---|
3/31/19 | $10,939 | $11,694 | $11,623 |
|---|
3/31/20 | $10,124 | $11,356 | $10,738 |
|---|
3/31/21 | $11,231 | $12,899 | $12,375 |
|---|
3/31/22 | $10,003 | $11,930 | $11,372 |
|---|
3/31/23 | $9,404 | $11,376 | $10,613 |
|---|
3/31/24 | $10,211 | $12,335 | $11,941 |
|---|
3/31/25 | $10,658 | $13,251 | $12,805 |
|---|
3/31/26 | $11,301 | $14,194 | $14,108 |
|---|
|
| Average Annual Return [Table Text Block] |
Table SummaryAverage Annual Total Returns | One Year | Five Years | Ten Years |
|---|
Class H | 6.03% | 0.12% | 1.23% |
|---|
Bloomberg Emerging Markets USD Aggregate Bond Index | 7.11% | 1.93% | 3.56% |
|---|
ICE BofA BBB & Lower Sovereign USD External Debt Index | 10.17% | 2.66% | 3.50% |
|---|
|
| AssetsNet |
$ 268,904
|
| Holdings Count | Holding |
5
|
| Advisory Fees Paid, Amount |
$ 6,054
|
| InvestmentCompanyPortfolioTurnover |
0.00%
|
| Additional Fund Statistics [Text Block] |
Fund Statistics as of March 31, 2026 - Net Assets$268,904
- Total Number of Portfolio Holdings5
- Portfolio Turnover Rate-%
- Total Advisory Fees Paid$6,054
|
| Holdings [Text Block] |
Holdings DiversificationFootnote Reference1 (% of Net Assets) as of March 31, 2026 Table SummaryValue | Value |
|---|
OTC Credit Index Swap Agreements | 37.5% | Interest Rate Futures Contracts Purchased | 41.3% | Centrally Cleared Credit Default Swap Agreements Protection Sold | 74.4% | |
| Material Fund Change [Text Block] |
|
| C000010307 |
|
| Shareholder Report [Line Items] |
|
| Fund Name |
Government Long Bond 1.2x Strategy Fund
|
| Class Name |
Investor Class
|
| Trading Symbol |
RYGBX
|
| Annual or Semi-Annual Statement [Text Block] |
This annual shareholder report contains important information about the Government Long Bond 1.2x Strategy Fund for the period from April 1, 2025 to March 31, 2026.
|
| Shareholder Report Annual or Semi-Annual |
Annual Shareholder Report
|
| Additional Information [Text Block] |
You can find additional information about the fund at GuggenheimInvestments.com/mutual-funds/literature. You can also request this information by contacting 800 820 0888 or services@guggenheiminvestments.com.
|
| Additional Information Phone Number |
800 820 0888
|
| Additional Information Email |
<span style="box-sizing: border-box; color: rgb(67, 67, 67); display: inline; flex-wrap: nowrap; font-size: 10.6667px; font-weight: 400; grid-area: auto; line-height: 12.8px; margin: 0px; overflow: visible; text-align: left; text-align-last: auto; white-space-collapse: preserve-breaks;">services@guggenheiminvestments.com</span>
|
| Additional Information Website |
<span style="box-sizing: border-box; color: rgb(67, 67, 67); display: inline; flex-wrap: nowrap; font-size: 10.6667px; font-weight: 400; grid-area: auto; line-height: 12.8px; margin: 0px; overflow: visible; text-align: left; text-align-last: auto; white-space-collapse: preserve-breaks;">GuggenheimInvestments.com/mutual-funds/literature</span>
|
| Expenses [Text Block] |
What were the Fund's costs for the last year? * Based on a hypothetical $10,000 investment Table SummaryClass | Costs of a $10,000 Investment | Costs Paid as a % of a $10,000 Investment |
|---|
Investor Class | $98 | 0.99% |
|---|
Table Summary* | Excludes expenses of the underlying funds in which the fund invests, if any. |
|---|
|
| Expenses Paid, Amount |
$ 98
|
| Factors Affecting Performance [Text Block] |
What factors materially affected the Fund's performance over the last year? Long-term U.S. Treasury yields ended the reporting period higher than where they began, reaching their lows in April of 2025 before hitting period highs in May of 2025. Yields fluctuated through the remainder of 2025, driven by mixed or missing economic data and evolving views on monetary policy easing. During the third and fourth quarters of 2025, the Federal Reserve reduced its target rate three times, broadly in line with market expectations, citing employment risks and a desire to support continued economic expansion. Long-term U.S. Treasury yields ended the period near recent highs as geopolitical uncertainty weighed on inflation and growth outlooks. |
| Line Graph [Table Text Block] |
Table Summary | Government Long Bond 1.2x Strategy Fund (Investor Class) | Bloomberg U.S. Aggregate Bond Index | Bloomberg U.S. Treasury Bellwether 30 Year Total Return Index |
|---|
3/31/16 | $10,000 | $10,000 | $10,000 |
|---|
3/31/17 | $9,160 | $10,044 | $9,382 |
|---|
3/31/18 | $9,436 | $10,165 | $9,714 |
|---|
3/31/19 | $9,996 | $10,620 | $10,323 |
|---|
3/31/20 | $14,579 | $11,569 | $14,402 |
|---|
3/31/21 | $10,975 | $11,651 | $11,439 |
|---|
3/31/22 | $10,787 | $11,168 | $11,485 |
|---|
3/31/23 | $8,018 | $10,633 | $9,166 |
|---|
3/31/24 | $7,080 | $10,814 | $8,457 |
|---|
3/31/25 | $6,871 | $11,342 | $8,448 |
|---|
3/31/26 | $6,664 | $11,835 | $8,392 |
|---|
|
| Average Annual Return [Table Text Block] |
Table SummaryAverage Annual Total Returns | One Year | Five Years | Ten Years |
|---|
Investor Class | -3.02% | -9.50% | -3.97% |
|---|
Bloomberg U.S. Aggregate Bond Index | 4.35% | 0.31% | 1.70% |
|---|
Bloomberg U.S. Treasury Bellwether 30 Year Total Return Index | -0.66% | -6.01% | -1.74% |
|---|
|
| AssetsNet |
$ 114,774,558
|
| Holdings Count | Holding |
6
|
| Advisory Fees Paid, Amount |
$ 107,475
|
| InvestmentCompanyPortfolioTurnover |
1438.00%
|
| Additional Fund Statistics [Text Block] |
Fund Statistics as of March 31, 2026 - Net Assets$114,774,558
- Total Number of Portfolio Holdings6
- Portfolio Turnover Rate1,438%
- Total Advisory Fees Paid$107,475
|
| Holdings [Text Block] |
Holdings DiversificationFootnote Reference1 (% of Net Assets) as of March 31, 2026 Table SummaryValue | Value |
|---|
Interest Rate Futures Contracts Purchased | 26.3% | U.S. Government Securities | 94.0% | |
| Largest Holdings [Text Block] |
Largest HoldingsFootnote Reference2 (% of Net Assets) as of March 31, 2026 Table SummaryU.S. Treasury Bonds 4.75% due 02/15/56 | 94.0% |
|---|
Guggenheim Ultra Short Duration Fund — Institutional Class | 0.5% |
|---|
Guggenheim Strategy Fund II | 0.4% |
|---|
Total | 94.9% |
|---|
|
| Material Fund Change [Text Block] |
|
| C000010309 |
|
| Shareholder Report [Line Items] |
|
| Fund Name |
Government Long Bond 1.2x Strategy Fund
|
| Class Name |
Class A
|
| Trading Symbol |
RYABX
|
| Annual or Semi-Annual Statement [Text Block] |
This annual shareholder report contains important information about the Government Long Bond 1.2x Strategy Fund for the period from April 1, 2025 to March 31, 2026.
|
| Shareholder Report Annual or Semi-Annual |
Annual Shareholder Report
|
| Additional Information [Text Block] |
You can find additional information about the fund at GuggenheimInvestments.com/mutual-funds/literature. You can also request this information by contacting 800 820 0888 or services@guggenheiminvestments.com.
|
| Additional Information Phone Number |
800 820 0888
|
| Additional Information Email |
<span style="box-sizing: border-box; color: rgb(67, 67, 67); display: inline; flex-wrap: nowrap; font-size: 10.6667px; font-weight: 400; grid-area: auto; line-height: 12.8px; margin: 0px; overflow: visible; text-align: left; text-align-last: auto; white-space-collapse: preserve-breaks;">services@guggenheiminvestments.com</span>
|
| Additional Information Website |
<span style="box-sizing: border-box; color: rgb(67, 67, 67); display: inline; flex-wrap: nowrap; font-size: 10.6667px; font-weight: 400; grid-area: auto; line-height: 12.8px; margin: 0px; overflow: visible; text-align: left; text-align-last: auto; white-space-collapse: preserve-breaks;">GuggenheimInvestments.com/mutual-funds/literature</span>
|
| Expenses [Text Block] |
What were the Fund's costs for the last year? * Based on a hypothetical $10,000 investment Table SummaryClass | Costs of a $10,000 Investment | Costs Paid as a % of a $10,000 Investment |
|---|
Class A | $123 | 1.25% |
|---|
Table Summary* | Excludes expenses of the underlying funds in which the fund invests, if any. |
|---|
|
| Expenses Paid, Amount |
$ 123
|
| Factors Affecting Performance [Text Block] |
What factors materially affected the Fund's performance over the last year? Long-term U.S. Treasury yields ended the reporting period higher than where they began, reaching their lows in April of 2025 before hitting period highs in May of 2025. Yields fluctuated through the remainder of 2025, driven by mixed or missing economic data and evolving views on monetary policy easing. During the third and fourth quarters of 2025, the Federal Reserve reduced its target rate three times, broadly in line with market expectations, citing employment risks and a desire to support continued economic expansion. Long-term U.S. Treasury yields ended the period near recent highs as geopolitical uncertainty weighed on inflation and growth outlooks. |
| Line Graph [Table Text Block] |
Table Summary | Government Long Bond 1.2x Strategy Fund (Class A)‡ | Bloomberg U.S. Aggregate Bond Index | Bloomberg U.S. Treasury Bellwether 30 Year Total Return Index |
|---|
3/31/16 | $9,525 | $10,000 | $10,000 |
|---|
3/31/17 | $8,711 | $10,044 | $9,382 |
|---|
3/31/18 | $8,954 | $10,165 | $9,714 |
|---|
3/31/19 | $9,458 | $10,620 | $10,323 |
|---|
3/31/20 | $13,760 | $11,569 | $14,402 |
|---|
3/31/21 | $10,324 | $11,651 | $11,439 |
|---|
3/31/22 | $10,122 | $11,168 | $11,485 |
|---|
3/31/23 | $7,501 | $10,633 | $9,166 |
|---|
3/31/24 | $6,599 | $10,814 | $8,457 |
|---|
3/31/25 | $6,393 | $11,342 | $8,448 |
|---|
3/31/26 | $6,186 | $11,835 | $8,392 |
|---|
|
| Average Annual Return [Table Text Block] |
Table SummaryAverage Annual Total Returns | One Year | Five Years | Ten Years |
|---|
Class A (without sales charge) | -3.23% | -9.74% | -4.22% |
|---|
Class A (with sales charge) ‡ | -7.82% | -10.60% | -4.69% |
|---|
Bloomberg U.S. Aggregate Bond Index | 4.35% | 0.31% | 1.70% |
|---|
Bloomberg U.S. Treasury Bellwether 30 Year Total Return Index | -0.66% | -6.01% | -1.74% |
|---|
|
| AssetsNet |
$ 114,774,558
|
| Holdings Count | Holding |
6
|
| Advisory Fees Paid, Amount |
$ 107,475
|
| InvestmentCompanyPortfolioTurnover |
1438.00%
|
| Additional Fund Statistics [Text Block] |
Fund Statistics as of March 31, 2026 - Net Assets$114,774,558
- Total Number of Portfolio Holdings6
- Portfolio Turnover Rate1,438%
- Total Advisory Fees Paid$107,475
|
| Holdings [Text Block] |
Holdings DiversificationFootnote Reference1 (% of Net Assets) as of March 31, 2026 Table SummaryValue | Value |
|---|
Interest Rate Futures Contracts Purchased | 26.3% | U.S. Government Securities | 94.0% | |
| Largest Holdings [Text Block] |
Largest HoldingsFootnote Reference2 (% of Net Assets) as of March 31, 2026 Table SummaryU.S. Treasury Bonds 4.75% due 02/15/56 | 94.0% |
|---|
Guggenheim Ultra Short Duration Fund — Institutional Class | 0.5% |
|---|
Guggenheim Strategy Fund II | 0.4% |
|---|
Total | 94.9% |
|---|
|
| Material Fund Change [Text Block] |
|
| C000010310 |
|
| Shareholder Report [Line Items] |
|
| Fund Name |
Government Long Bond 1.2x Strategy Fund
|
| Class Name |
Class C
|
| Trading Symbol |
RYCGX
|
| Annual or Semi-Annual Statement [Text Block] |
This annual shareholder report contains important information about the Government Long Bond 1.2x Strategy Fund for the period from April 1, 2025 to March 31, 2026.
|
| Shareholder Report Annual or Semi-Annual |
Annual Shareholder Report
|
| Additional Information [Text Block] |
You can find additional information about the fund at GuggenheimInvestments.com/mutual-funds/literature. You can also request this information by contacting 800 820 0888 or services@guggenheiminvestments.com.
|
| Additional Information Phone Number |
800 820 0888
|
| Additional Information Email |
<span style="box-sizing: border-box; color: rgb(67, 67, 67); display: inline; flex-wrap: nowrap; font-size: 10.6667px; font-weight: 400; grid-area: auto; line-height: 12.8px; margin: 0px; overflow: visible; text-align: left; text-align-last: auto; white-space-collapse: preserve-breaks;">services@guggenheiminvestments.com</span>
|
| Additional Information Website |
<span style="box-sizing: border-box; color: rgb(67, 67, 67); display: inline; flex-wrap: nowrap; font-size: 10.6667px; font-weight: 400; grid-area: auto; line-height: 12.8px; margin: 0px; overflow: visible; text-align: left; text-align-last: auto; white-space-collapse: preserve-breaks;">GuggenheimInvestments.com/mutual-funds/literature</span>
|
| Expenses [Text Block] |
What were the Fund's costs for the last year? * Based on a hypothetical $10,000 investment Table SummaryClass | Costs of a $10,000 Investment | Costs Paid as a % of a $10,000 Investment |
|---|
Class C | $195 | 1.99% |
|---|
Table Summary* | Excludes expenses of the underlying funds in which the fund invests, if any. |
|---|
|
| Expenses Paid, Amount |
$ 195
|
| Factors Affecting Performance [Text Block] |
What factors materially affected the Fund's performance over the last year? Long-term U.S. Treasury yields ended the reporting period higher than where they began, reaching their lows in April of 2025 before hitting period highs in May of 2025. Yields fluctuated through the remainder of 2025, driven by mixed or missing economic data and evolving views on monetary policy easing. During the third and fourth quarters of 2025, the Federal Reserve reduced its target rate three times, broadly in line with market expectations, citing employment risks and a desire to support continued economic expansion. Long-term U.S. Treasury yields ended the period near recent highs as geopolitical uncertainty weighed on inflation and growth outlooks. |
| Line Graph [Table Text Block] |
Table Summary | Government Long Bond 1.2x Strategy Fund (Class C) | Bloomberg U.S. Aggregate Bond Index | Bloomberg U.S. Treasury Bellwether 30 Year Total Return Index |
|---|
3/31/16 | $10,000 | $10,000 | $10,000 |
|---|
3/31/17 | $9,076 | $10,044 | $9,382 |
|---|
3/31/18 | $9,255 | $10,165 | $9,714 |
|---|
3/31/19 | $9,710 | $10,620 | $10,323 |
|---|
3/31/20 | $14,023 | $11,569 | $14,402 |
|---|
3/31/21 | $10,440 | $11,651 | $11,439 |
|---|
3/31/22 | $10,157 | $11,168 | $11,485 |
|---|
3/31/23 | $7,471 | $10,633 | $9,166 |
|---|
3/31/24 | $6,525 | $10,814 | $8,457 |
|---|
3/31/25 | $6,271 | $11,342 | $8,448 |
|---|
3/31/26 | $6,023 | $11,835 | $8,392 |
|---|
|
| Average Annual Return [Table Text Block] |
Table SummaryAverage Annual Total Returns | One Year | Five Years | Ten Years |
|---|
Class C (without CDSC) | -3.93% | -10.42% | -4.94% |
|---|
Class C (with CDSC) ‡ | -4.86% | -10.42% | -4.94% |
|---|
Bloomberg U.S. Aggregate Bond Index | 4.35% | 0.31% | 1.70% |
|---|
Bloomberg U.S. Treasury Bellwether 30 Year Total Return Index | -0.66% | -6.01% | -1.74% |
|---|
|
| AssetsNet |
$ 114,774,558
|
| Holdings Count | Holding |
6
|
| Advisory Fees Paid, Amount |
$ 107,475
|
| InvestmentCompanyPortfolioTurnover |
1438.00%
|
| Additional Fund Statistics [Text Block] |
Fund Statistics as of March 31, 2026 - Net Assets$114,774,558
- Total Number of Portfolio Holdings6
- Portfolio Turnover Rate1,438%
- Total Advisory Fees Paid$107,475
|
| Holdings [Text Block] |
Holdings DiversificationFootnote Reference1 (% of Net Assets) as of March 31, 2026 Table SummaryValue | Value |
|---|
Interest Rate Futures Contracts Purchased | 26.3% | U.S. Government Securities | 94.0% | |
| Largest Holdings [Text Block] |
Largest HoldingsFootnote Reference2 (% of Net Assets) as of March 31, 2026 Table SummaryU.S. Treasury Bonds 4.75% due 02/15/56 | 94.0% |
|---|
Guggenheim Ultra Short Duration Fund — Institutional Class | 0.5% |
|---|
Guggenheim Strategy Fund II | 0.4% |
|---|
Total | 94.9% |
|---|
|
| Material Fund Change [Text Block] |
|
| C000149021 |
|
| Shareholder Report [Line Items] |
|
| Fund Name |
Government Long Bond 1.2x Strategy Fund
|
| Class Name |
Class H
|
| Trading Symbol |
RYHBX
|
| Annual or Semi-Annual Statement [Text Block] |
This annual shareholder report contains important information about the Government Long Bond 1.2x Strategy Fund for the period from April 1, 2025 to March 31, 2026.
|
| Shareholder Report Annual or Semi-Annual |
Annual Shareholder Report
|
| Additional Information [Text Block] |
You can find additional information about the fund at GuggenheimInvestments.com/mutual-funds/literature. You can also request this information by contacting 800 820 0888 or services@guggenheiminvestments.com.
|
| Additional Information Phone Number |
800 820 0888
|
| Additional Information Email |
<span style="box-sizing: border-box; color: rgb(67, 67, 67); display: inline; flex-wrap: nowrap; font-size: 10.6667px; font-weight: 400; grid-area: auto; line-height: 12.8px; margin: 0px; overflow: visible; text-align: left; text-align-last: auto; white-space-collapse: preserve-breaks;">services@guggenheiminvestments.com</span>
|
| Additional Information Website |
<span style="box-sizing: border-box; color: rgb(67, 67, 67); display: inline; flex-wrap: nowrap; font-size: 10.6667px; font-weight: 400; grid-area: auto; line-height: 12.8px; margin: 0px; overflow: visible; text-align: left; text-align-last: auto; white-space-collapse: preserve-breaks;">GuggenheimInvestments.com/mutual-funds/literature</span>
|
| Expenses [Text Block] |
What were the Fund's costs for the last year? * Based on a hypothetical $10,000 investment Table SummaryClass | Costs of a $10,000 Investment | Costs Paid as a % of a $10,000 Investment |
|---|
Class H | $125 | 1.27% |
|---|
Table Summary* | Excludes expenses of the underlying funds in which the fund invests, if any. |
|---|
|
| Expenses Paid, Amount |
$ 125
|
| Factors Affecting Performance [Text Block] |
What factors materially affected the Fund's performance over the last year? Long-term U.S. Treasury yields ended the reporting period higher than where they began, reaching their lows in April of 2025 before hitting period highs in May of 2025. Yields fluctuated through the remainder of 2025, driven by mixed or missing economic data and evolving views on monetary policy easing. During the third and fourth quarters of 2025, the Federal Reserve reduced its target rate three times, broadly in line with market expectations, citing employment risks and a desire to support continued economic expansion. Long-term U.S. Treasury yields ended the period near recent highs as geopolitical uncertainty weighed on inflation and growth outlooks. |
| Line Graph [Table Text Block] |
Table Summary | Government Long Bond 1.2x Strategy Fund (Class H) | Bloomberg U.S. Aggregate Bond Index | Bloomberg U.S. Treasury Bellwether 30 Year Total Return Index |
|---|
3/31/16 | $10,000 | $10,000 | $10,000 |
|---|
3/31/17 | $9,145 | $10,044 | $9,382 |
|---|
3/31/18 | $9,396 | $10,165 | $9,714 |
|---|
3/31/19 | $9,925 | $10,620 | $10,323 |
|---|
3/31/20 | $14,445 | $11,569 | $14,402 |
|---|
3/31/21 | $10,836 | $11,651 | $11,439 |
|---|
3/31/22 | $10,625 | $11,168 | $11,485 |
|---|
3/31/23 | $7,875 | $10,633 | $9,166 |
|---|
3/31/24 | $6,941 | $10,814 | $8,457 |
|---|
3/31/25 | $6,723 | $11,342 | $8,448 |
|---|
3/31/26 | $6,503 | $11,835 | $8,392 |
|---|
|
| Average Annual Return [Table Text Block] |
Table SummaryAverage Annual Total Returns | One Year | Five Years | Ten Years |
|---|
Class H | -3.25% | -9.71% | -4.21% |
|---|
Bloomberg U.S. Aggregate Bond Index | 4.35% | 0.31% | 1.70% |
|---|
Bloomberg U.S. Treasury Bellwether 30 Year Total Return Index | -0.66% | -6.01% | -1.74% |
|---|
|
| AssetsNet |
$ 114,774,558
|
| Holdings Count | Holding |
6
|
| Advisory Fees Paid, Amount |
$ 107,475
|
| InvestmentCompanyPortfolioTurnover |
1438.00%
|
| Additional Fund Statistics [Text Block] |
Fund Statistics as of March 31, 2026 - Net Assets$114,774,558
- Total Number of Portfolio Holdings6
- Portfolio Turnover Rate1,438%
- Total Advisory Fees Paid$107,475
|
| Holdings [Text Block] |
Holdings DiversificationFootnote Reference1 (% of Net Assets) as of March 31, 2026 Table SummaryValue | Value |
|---|
Interest Rate Futures Contracts Purchased | 26.3% | U.S. Government Securities | 94.0% | |
| Largest Holdings [Text Block] |
Largest HoldingsFootnote Reference2 (% of Net Assets) as of March 31, 2026 Table SummaryU.S. Treasury Bonds 4.75% due 02/15/56 | 94.0% |
|---|
Guggenheim Ultra Short Duration Fund — Institutional Class | 0.5% |
|---|
Guggenheim Strategy Fund II | 0.4% |
|---|
Total | 94.9% |
|---|
|
| Material Fund Change [Text Block] |
|
| C000010326 |
|
| Shareholder Report [Line Items] |
|
| Fund Name |
Inverse Government Long Bond Strategy Fund
|
| Class Name |
Investor Class
|
| Trading Symbol |
RYJUX
|
| Annual or Semi-Annual Statement [Text Block] |
This annual shareholder report contains important information about the Inverse Government Long Bond Strategy Fund for the period from April 1, 2025 to March 31, 2026.
|
| Shareholder Report Annual or Semi-Annual |
Annual Shareholder Report
|
| Additional Information [Text Block] |
You can find additional information about the fund at GuggenheimInvestments.com/mutual-funds/literature. You can also request this information by contacting 800 820 0888 or services@guggenheiminvestments.com.
|
| Additional Information Phone Number |
800 820 0888
|
| Additional Information Email |
<span style="box-sizing: border-box; color: rgb(67, 67, 67); display: inline; flex-wrap: nowrap; font-size: 10.6667px; font-weight: 400; grid-area: auto; line-height: 12.8px; margin: 0px; overflow: visible; text-align: left; text-align-last: auto; white-space-collapse: preserve-breaks;">services@guggenheiminvestments.com</span>
|
| Additional Information Website |
<span style="box-sizing: border-box; color: rgb(67, 67, 67); display: inline; flex-wrap: nowrap; font-size: 10.6667px; font-weight: 400; grid-area: auto; line-height: 12.8px; margin: 0px; overflow: visible; text-align: left; text-align-last: auto; white-space-collapse: preserve-breaks;">GuggenheimInvestments.com/mutual-funds/literature</span>
|
| Expenses [Text Block] |
What were the Fund's costs for the last year? * Based on a hypothetical $10,000 investment Table SummaryClass | Costs of a $10,000 Investment | Costs Paid as a % of a $10,000 Investment |
|---|
Investor Class | $517 | 5.01% |
|---|
Table Summary* | Excludes expenses of the underlying funds in which the fund invests, if any. |
|---|
|
| Expenses Paid, Amount |
$ 517
|
| Factors Affecting Performance [Text Block] |
What factors materially affected the Fund's performance over the last year? Long-term U.S. Treasury yields ended the reporting period higher than where they began, reaching their lows in April of 2025 before hitting period highs in May of 2025. Yields fluctuated through the remainder of 2025, driven by mixed or missing economic data and evolving views on monetary policy easing. During the third and fourth quarters of 2025, the Federal Reserve reduced its target rate three times, broadly in line with market expectations, citing employment risks and a desire to support continued economic expansion. Long-term U.S. Treasury yields ended the period near recent highs as geopolitical uncertainty weighed on inflation and growth outlooks. |
| Line Graph [Table Text Block] |
Table Summary | Inverse Government Long Bond Strategy Fund (Investor Class) | Bloomberg U.S. Aggregate Bond Index | Bloomberg U.S. Treasury Bellwether 30 Year Total Return Index |
|---|
3/31/16 | $10,000 | $10,000 | $10,000 |
|---|
3/31/17 | $10,508 | $10,044 | $9,382 |
|---|
3/31/18 | $10,108 | $10,165 | $9,714 |
|---|
3/31/19 | $9,656 | $10,620 | $10,323 |
|---|
3/31/20 | $6,688 | $11,569 | $14,402 |
|---|
3/31/21 | $8,172 | $11,651 | $11,439 |
|---|
3/31/22 | $7,807 | $11,168 | $11,485 |
|---|
3/31/23 | $9,772 | $10,633 | $9,166 |
|---|
3/31/24 | $11,406 | $10,814 | $8,457 |
|---|
3/31/25 | $12,298 | $11,342 | $8,448 |
|---|
3/31/26 | $13,084 | $11,835 | $8,392 |
|---|
|
| Average Annual Return [Table Text Block] |
Table SummaryAverage Annual Total Returns | One Year | Five Years | Ten Years |
|---|
Investor Class | 6.40% | 9.87% | 2.72% |
|---|
Bloomberg U.S. Aggregate Bond Index | 4.35% | 0.31% | 1.70% |
|---|
Bloomberg U.S. Treasury Bellwether 30 Year Total Return Index | -0.66% | -6.01% | -1.74% |
|---|
|
| AssetsNet |
$ 17,525,019
|
| Holdings Count | Holding |
8
|
| Advisory Fees Paid, Amount |
$ 120,990
|
| InvestmentCompanyPortfolioTurnover |
561.00%
|
| Additional Fund Statistics [Text Block] |
Fund Statistics as of March 31, 2026 - Net Assets$17,525,019
- Total Number of Portfolio Holdings8
- Portfolio Turnover Rate561%
- Total Advisory Fees Paid$120,990
|
| Holdings [Text Block] |
Holdings DiversificationFootnote Reference1 (% of Net Assets) as of March 31, 2026 Table SummaryValue | Value |
|---|
U.S. Government Securities Sold Short | -82.4% | Interest Rate Futures Contracts Sold Short | -17.9% | |
| Largest Holdings [Text Block] |
Largest HoldingsFootnote Reference2 (% of Net Assets) as of March 31, 2026 Table SummaryGuggenheim Strategy Fund II | 19.4% |
|---|
Guggenheim Ultra Short Duration Fund — Institutional Class | 18.7% |
|---|
Total | 38.1% |
|---|
|
| Material Fund Change [Text Block] |
|
| C000010328 |
|
| Shareholder Report [Line Items] |
|
| Fund Name |
Inverse Government Long Bond Strategy Fund
|
| Class Name |
Class A
|
| Trading Symbol |
RYAQX
|
| Annual or Semi-Annual Statement [Text Block] |
This annual shareholder report contains important information about the Inverse Government Long Bond Strategy Fund for the period from April 1, 2025 to March 31, 2026.
|
| Shareholder Report Annual or Semi-Annual |
Annual Shareholder Report
|
| Additional Information [Text Block] |
You can find additional information about the fund at GuggenheimInvestments.com/mutual-funds/literature. You can also request this information by contacting 800 820 0888 or services@guggenheiminvestments.com.
|
| Additional Information Phone Number |
800 820 0888
|
| Additional Information Email |
<span style="box-sizing: border-box; color: rgb(67, 67, 67); display: inline; flex-wrap: nowrap; font-size: 10.6667px; font-weight: 400; grid-area: auto; line-height: 12.8px; margin: 0px; overflow: visible; text-align: left; text-align-last: auto; white-space-collapse: preserve-breaks;">services@guggenheiminvestments.com</span>
|
| Additional Information Website |
<span style="box-sizing: border-box; color: rgb(67, 67, 67); display: inline; flex-wrap: nowrap; font-size: 10.6667px; font-weight: 400; grid-area: auto; line-height: 12.8px; margin: 0px; overflow: visible; text-align: left; text-align-last: auto; white-space-collapse: preserve-breaks;">GuggenheimInvestments.com/mutual-funds/literature</span>
|
| Expenses [Text Block] |
What were the Fund's costs for the last year? * Based on a hypothetical $10,000 investment Table SummaryClass | Costs of a $10,000 Investment | Costs Paid as a % of a $10,000 Investment |
|---|
Class A | $541 | 5.25% |
|---|
Table Summary* | Excludes expenses of the underlying funds in which the fund invests, if any. |
|---|
|
| Expenses Paid, Amount |
$ 541
|
| Factors Affecting Performance [Text Block] |
What factors materially affected the Fund's performance over the last year? Long-term U.S. Treasury yields ended the reporting period higher than where they began, reaching their lows in April of 2025 before hitting period highs in May of 2025. Yields fluctuated through the remainder of 2025, driven by mixed or missing economic data and evolving views on monetary policy easing. During the third and fourth quarters of 2025, the Federal Reserve reduced its target rate three times, broadly in line with market expectations, citing employment risks and a desire to support continued economic expansion. Long-term U.S. Treasury yields ended the period near recent highs as geopolitical uncertainty weighed on inflation and growth outlooks. |
| Line Graph [Table Text Block] |
Table Summary | Inverse Government Long Bond Strategy Fund (Class A)‡ | Bloomberg U.S. Aggregate Bond Index | Bloomberg U.S. Treasury Bellwether 30 Year Total Return Index |
|---|
3/31/16 | $9,525 | $10,000 | $10,000 |
|---|
3/31/17 | $9,986 | $10,044 | $9,382 |
|---|
3/31/18 | $9,580 | $10,165 | $9,714 |
|---|
3/31/19 | $9,125 | $10,620 | $10,323 |
|---|
3/31/20 | $6,306 | $11,569 | $14,402 |
|---|
3/31/21 | $7,690 | $11,651 | $11,439 |
|---|
3/31/22 | $7,328 | $11,168 | $11,485 |
|---|
3/31/23 | $9,149 | $10,633 | $9,166 |
|---|
3/31/24 | $10,651 | $10,814 | $8,457 |
|---|
3/31/25 | $11,456 | $11,342 | $8,448 |
|---|
3/31/26 | $12,158 | $11,835 | $8,392 |
|---|
|
| Average Annual Return [Table Text Block] |
Table SummaryAverage Annual Total Returns | One Year | Five Years | Ten Years |
|---|
Class A (without sales charge) | 6.12% | 9.59% | 2.47% |
|---|
Class A (with sales charge) ‡ | 1.08% | 8.53% | 1.97% |
|---|
Bloomberg U.S. Aggregate Bond Index | 4.35% | 0.31% | 1.70% |
|---|
Bloomberg U.S. Treasury Bellwether 30 Year Total Return Index | -0.66% | -6.01% | -1.74% |
|---|
|
| AssetsNet |
$ 17,525,019
|
| Holdings Count | Holding |
8
|
| Advisory Fees Paid, Amount |
$ 120,990
|
| InvestmentCompanyPortfolioTurnover |
561.00%
|
| Additional Fund Statistics [Text Block] |
Fund Statistics as of March 31, 2026 - Net Assets$17,525,019
- Total Number of Portfolio Holdings8
- Portfolio Turnover Rate561%
- Total Advisory Fees Paid$120,990
|
| Holdings [Text Block] |
Holdings DiversificationFootnote Reference1 (% of Net Assets) as of March 31, 2026 Table SummaryValue | Value |
|---|
U.S. Government Securities Sold Short | -82.4% | Interest Rate Futures Contracts Sold Short | -17.9% | |
| Largest Holdings [Text Block] |
Largest HoldingsFootnote Reference2 (% of Net Assets) as of March 31, 2026 Table SummaryGuggenheim Strategy Fund II | 19.4% |
|---|
Guggenheim Ultra Short Duration Fund — Institutional Class | 18.7% |
|---|
Total | 38.1% |
|---|
|
| Material Fund Change [Text Block] |
|
| C000010329 |
|
| Shareholder Report [Line Items] |
|
| Fund Name |
Inverse Government Long Bond Strategy Fund
|
| Class Name |
Class C
|
| Trading Symbol |
RYJCX
|
| Annual or Semi-Annual Statement [Text Block] |
This annual shareholder report contains important information about the Inverse Government Long Bond Strategy Fund for the period from April 1, 2025 to March 31, 2026.
|
| Shareholder Report Annual or Semi-Annual |
Annual Shareholder Report
|
| Additional Information [Text Block] |
You can find additional information about the fund at GuggenheimInvestments.com/mutual-funds/literature. You can also request this information by contacting 800 820 0888 or services@guggenheiminvestments.com.
|
| Additional Information Phone Number |
800 820 0888
|
| Additional Information Email |
<span style="box-sizing: border-box; color: rgb(67, 67, 67); display: inline; flex-wrap: nowrap; font-size: 10.6667px; font-weight: 400; grid-area: auto; line-height: 12.8px; margin: 0px; overflow: visible; text-align: left; text-align-last: auto; white-space-collapse: preserve-breaks;">services@guggenheiminvestments.com</span>
|
| Additional Information Website |
<span style="box-sizing: border-box; color: rgb(67, 67, 67); display: inline; flex-wrap: nowrap; font-size: 10.6667px; font-weight: 400; grid-area: auto; line-height: 12.8px; margin: 0px; overflow: visible; text-align: left; text-align-last: auto; white-space-collapse: preserve-breaks;">GuggenheimInvestments.com/mutual-funds/literature</span>
|
| Expenses [Text Block] |
What were the Fund's costs for the last year? * Based on a hypothetical $10,000 investment Table SummaryClass | Costs of a $10,000 Investment | Costs Paid as a % of a $10,000 Investment |
|---|
Class C | $617 | 6.01% |
|---|
Table Summary* | Excludes expenses of the underlying funds in which the fund invests, if any. |
|---|
|
| Expenses Paid, Amount |
$ 617
|
| Factors Affecting Performance [Text Block] |
What factors materially affected the Fund's performance over the last year? Long-term U.S. Treasury yields ended the reporting period higher than where they began, reaching their lows in April of 2025 before hitting period highs in May of 2025. Yields fluctuated through the remainder of 2025, driven by mixed or missing economic data and evolving views on monetary policy easing. During the third and fourth quarters of 2025, the Federal Reserve reduced its target rate three times, broadly in line with market expectations, citing employment risks and a desire to support continued economic expansion. Long-term U.S. Treasury yields ended the period near recent highs as geopolitical uncertainty weighed on inflation and growth outlooks. |
| Line Graph [Table Text Block] |
Table Summary | Inverse Government Long Bond Strategy Fund (Class C) | Bloomberg U.S. Aggregate Bond Index | Bloomberg U.S. Treasury Bellwether 30 Year Total Return Index |
|---|
3/31/16 | $10,000 | $10,000 | $10,000 |
|---|
3/31/17 | $10,404 | $10,044 | $9,382 |
|---|
3/31/18 | $9,908 | $10,165 | $9,714 |
|---|
3/31/19 | $9,369 | $10,620 | $10,323 |
|---|
3/31/20 | $6,426 | $11,569 | $14,402 |
|---|
3/31/21 | $7,775 | $11,651 | $11,439 |
|---|
3/31/22 | $7,355 | $11,168 | $11,485 |
|---|
3/31/23 | $9,113 | $10,633 | $9,166 |
|---|
3/31/24 | $10,531 | $10,814 | $8,457 |
|---|
3/31/25 | $11,242 | $11,342 | $8,448 |
|---|
3/31/26 | $11,841 | $11,835 | $8,392 |
|---|
|
| Average Annual Return [Table Text Block] |
Table SummaryAverage Annual Total Returns | One Year | Five Years | Ten Years |
|---|
Class C (without CDSC) | 5.32% | 8.77% | 1.70% |
|---|
Class C (with CDSC) ‡ | 4.33% | 8.77% | 1.70% |
|---|
Bloomberg U.S. Aggregate Bond Index | 4.35% | 0.31% | 1.70% |
|---|
Bloomberg U.S. Treasury Bellwether 30 Year Total Return Index | -0.66% | -6.01% | -1.74% |
|---|
|
| AssetsNet |
$ 17,525,019
|
| Holdings Count | Holding |
8
|
| Advisory Fees Paid, Amount |
$ 120,990
|
| InvestmentCompanyPortfolioTurnover |
561.00%
|
| Additional Fund Statistics [Text Block] |
Fund Statistics as of March 31, 2026 - Net Assets$17,525,019
- Total Number of Portfolio Holdings8
- Portfolio Turnover Rate561%
- Total Advisory Fees Paid$120,990
|
| Holdings [Text Block] |
Holdings DiversificationFootnote Reference1 (% of Net Assets) as of March 31, 2026 Table SummaryValue | Value |
|---|
U.S. Government Securities Sold Short | -82.4% | Interest Rate Futures Contracts Sold Short | -17.9% | |
| Largest Holdings [Text Block] |
Largest HoldingsFootnote Reference2 (% of Net Assets) as of March 31, 2026 Table SummaryGuggenheim Strategy Fund II | 19.4% |
|---|
Guggenheim Ultra Short Duration Fund — Institutional Class | 18.7% |
|---|
Total | 38.1% |
|---|
|
| Material Fund Change [Text Block] |
|
| C000149022 |
|
| Shareholder Report [Line Items] |
|
| Fund Name |
Inverse Government Long Bond Strategy Fund
|
| Class Name |
Class H
|
| Trading Symbol |
RYHJX
|
| Annual or Semi-Annual Statement [Text Block] |
This annual shareholder report contains important information about the Inverse Government Long Bond Strategy Fund for the period from April 1, 2025 to March 31, 2026.
|
| Shareholder Report Annual or Semi-Annual |
Annual Shareholder Report
|
| Additional Information [Text Block] |
You can find additional information about the fund at GuggenheimInvestments.com/mutual-funds/literature. You can also request this information by contacting 800 820 0888 or services@guggenheiminvestments.com.
|
| Additional Information Phone Number |
800 820 0888
|
| Additional Information Email |
<span style="box-sizing: border-box; color: rgb(67, 67, 67); display: inline; flex-wrap: nowrap; font-size: 10.6667px; font-weight: 400; grid-area: auto; line-height: 12.8px; margin: 0px; overflow: visible; text-align: left; text-align-last: auto; white-space-collapse: preserve-breaks;">services@guggenheiminvestments.com</span>
|
| Additional Information Website |
<span style="box-sizing: border-box; color: rgb(67, 67, 67); display: inline; flex-wrap: nowrap; font-size: 10.6667px; font-weight: 400; grid-area: auto; line-height: 12.8px; margin: 0px; overflow: visible; text-align: left; text-align-last: auto; white-space-collapse: preserve-breaks;">GuggenheimInvestments.com/mutual-funds/literature</span>
|
| Expenses [Text Block] |
What were the Fund's costs for the last year? * Based on a hypothetical $10,000 investment Table SummaryClass | Costs of a $10,000 Investment | Costs Paid as a % of a $10,000 Investment |
|---|
Class H | $540 | 5.24% |
|---|
Table Summary* | Excludes expenses of the underlying funds in which the fund invests, if any. |
|---|
|
| Expenses Paid, Amount |
$ 540
|
| Factors Affecting Performance [Text Block] |
What factors materially affected the Fund's performance over the last year? Long-term U.S. Treasury yields ended the reporting period higher than where they began, reaching their lows in April of 2025 before hitting period highs in May of 2025. Yields fluctuated through the remainder of 2025, driven by mixed or missing economic data and evolving views on monetary policy easing. During the third and fourth quarters of 2025, the Federal Reserve reduced its target rate three times, broadly in line with market expectations, citing employment risks and a desire to support continued economic expansion. Long-term U.S. Treasury yields ended the period near recent highs as geopolitical uncertainty weighed on inflation and growth outlooks. |
| Line Graph [Table Text Block] |
Table Summary | Inverse Government Long Bond Strategy Fund (Class H) | Bloomberg U.S. Aggregate Bond Index | Bloomberg U.S. Treasury Bellwether 30 Year Total Return Index |
|---|
3/31/16 | $10,000 | $10,000 | $10,000 |
|---|
3/31/17 | $10,513 | $10,044 | $9,382 |
|---|
3/31/18 | $10,078 | $10,165 | $9,714 |
|---|
3/31/19 | $9,604 | $10,620 | $10,323 |
|---|
3/31/20 | $6,633 | $11,569 | $14,402 |
|---|
3/31/21 | $8,104 | $11,651 | $11,439 |
|---|
3/31/22 | $7,724 | $11,168 | $11,485 |
|---|
3/31/23 | $9,644 | $10,633 | $9,166 |
|---|
3/31/24 | $11,228 | $10,814 | $8,457 |
|---|
3/31/25 | $12,077 | $11,342 | $8,448 |
|---|
3/31/26 | $12,816 | $11,835 | $8,392 |
|---|
|
| Average Annual Return [Table Text Block] |
Table SummaryAverage Annual Total Returns | One Year | Five Years | Ten Years |
|---|
Class H | 6.11% | 9.60% | 2.51% |
|---|
Bloomberg U.S. Aggregate Bond Index | 4.35% | 0.31% | 1.70% |
|---|
Bloomberg U.S. Treasury Bellwether 30 Year Total Return Index | -0.66% | -6.01% | -1.74% |
|---|
|
| AssetsNet |
$ 17,525,019
|
| Holdings Count | Holding |
8
|
| Advisory Fees Paid, Amount |
$ 120,990
|
| InvestmentCompanyPortfolioTurnover |
561.00%
|
| Additional Fund Statistics [Text Block] |
Fund Statistics as of March 31, 2026 - Net Assets$17,525,019
- Total Number of Portfolio Holdings8
- Portfolio Turnover Rate561%
- Total Advisory Fees Paid$120,990
|
| Holdings [Text Block] |
Holdings DiversificationFootnote Reference1 (% of Net Assets) as of March 31, 2026 Table SummaryValue | Value |
|---|
U.S. Government Securities Sold Short | -82.4% | Interest Rate Futures Contracts Sold Short | -17.9% | |
| Largest Holdings [Text Block] |
Largest HoldingsFootnote Reference2 (% of Net Assets) as of March 31, 2026 Table SummaryGuggenheim Strategy Fund II | 19.4% |
|---|
Guggenheim Ultra Short Duration Fund — Institutional Class | 18.7% |
|---|
Total | 38.1% |
|---|
|
| Material Fund Change [Text Block] |
|
| C000043615 |
|
| Shareholder Report [Line Items] |
|
| Fund Name |
High Yield Strategy Fund
|
| Class Name |
Class A
|
| Trading Symbol |
RYHDX
|
| Annual or Semi-Annual Statement [Text Block] |
This annual shareholder report contains important information about the High Yield Strategy Fund for the period from April 1, 2025 to March 31, 2026.
|
| Shareholder Report Annual or Semi-Annual |
Annual Shareholder Report
|
| Additional Information [Text Block] |
You can find additional information about the fund at GuggenheimInvestments.com/mutual-funds/literature. You can also request this information by contacting 800 820 0888 or services@guggenheiminvestments.com.
|
| Additional Information Phone Number |
800 820 0888
|
| Additional Information Email |
<span style="box-sizing: border-box; color: rgb(67, 67, 67); display: inline; flex-wrap: nowrap; font-size: 10.6667px; font-weight: 400; grid-area: auto; line-height: 12.8px; margin: 0px; overflow: visible; text-align: left; text-align-last: auto; white-space-collapse: preserve-breaks;">services@guggenheiminvestments.com</span>
|
| Additional Information Website |
<span style="box-sizing: border-box; color: rgb(67, 67, 67); display: inline; flex-wrap: nowrap; font-size: 10.6667px; font-weight: 400; grid-area: auto; line-height: 12.8px; margin: 0px; overflow: visible; text-align: left; text-align-last: auto; white-space-collapse: preserve-breaks;">GuggenheimInvestments.com/mutual-funds/literature</span>
|
| Expenses [Text Block] |
What were the Fund's costs for the last year? * Based on a hypothetical $10,000 investment Table SummaryClass | Costs of a $10,000 Investment | Costs Paid as a % of a $10,000 Investment |
|---|
Class A | $157 | 1.52% |
|---|
Table Summary* | Excludes expenses of the underlying funds in which the fund invests, if any. |
|---|
|
| Expenses Paid, Amount |
$ 157
|
| Factors Affecting Performance [Text Block] |
What factors materially affected the Fund's performance over the last year? High yield generated positive returns for the reporting period. At the beginning of the reporting period, risk assets experienced some volatility due to macro-economic factors stemming from trade negotiations and tariffs. After the initial market shock of increased tariffs on trading partners, risk assets rebounded. During the later part of first quarter of 2026 geopolitical events weighed on the high yield market. All sectors contributed positively to the Bloomberg U.S. Corporate High Yield Index with notable positive contribution from communications and consumer discretionary. On the ratings side, BB-rated holdings were a leading contributor to index returns. |
| Line Graph [Table Text Block] |
Table Summary | High Yield Strategy Fund (Class A)‡ | Bloomberg U.S. Aggregate Bond Index | Bloomberg U.S. Corporate High Yield Index |
|---|
3/31/16 | $9,525 | $10,000 | $10,000 |
|---|
3/31/17 | $10,311 | $10,044 | $11,639 |
|---|
3/31/18 | $10,525 | $10,165 | $12,079 |
|---|
3/31/19 | $11,281 | $10,620 | $12,796 |
|---|
3/31/20 | $10,631 | $11,569 | $11,908 |
|---|
3/31/21 | $11,991 | $11,651 | $14,732 |
|---|
3/31/22 | $11,454 | $11,168 | $14,635 |
|---|
3/31/23 | $11,237 | $10,633 | $14,146 |
|---|
3/31/24 | $12,398 | $10,814 | $15,723 |
|---|
3/31/25 | $13,192 | $11,342 | $16,933 |
|---|
3/31/26 | $14,055 | $11,835 | $18,119 |
|---|
|
| Average Annual Return [Table Text Block] |
Table SummaryAverage Annual Total Returns | One Year | Five Years | Ten Years |
|---|
Class A (without sales charge) | 6.54% | 3.23% | 3.97% |
|---|
Class A (with sales charge) ‡ | 1.49% | 2.23% | 3.46% |
|---|
Bloomberg U.S. Aggregate Bond Index | 4.35% | 0.31% | 1.70% |
|---|
Bloomberg U.S. Corporate High Yield Index | 7.01% | 4.23% | 6.12% |
|---|
|
| AssetsNet |
$ 12,360,523
|
| Holdings Count | Holding |
15
|
| Advisory Fees Paid, Amount |
$ 158,948
|
| InvestmentCompanyPortfolioTurnover |
0.00%
|
| Additional Fund Statistics [Text Block] |
Fund Statistics as of March 31, 2026 - Net Assets$12,360,523
- Total Number of Portfolio Holdings15
- Portfolio Turnover Rate-%
- Total Advisory Fees Paid$158,948
|
| Holdings [Text Block] |
Holdings DiversificationFootnote Reference1 (% of Net Assets) as of March 31, 2026 Table SummaryValue | Value |
|---|
OTC Credit Index Swap Agreements | 12.7% | Interest Rate Futures Contracts Purchased | 81.4% | Centrally Cleared Credit Default Swap Agreements Protection Sold | 85.7% | |
| Largest Holdings [Text Block] |
Largest HoldingsFootnote Reference2 (% of Net Assets) as of March 31, 2026 Table SummaryGuggenheim Strategy Fund III | 16.1% |
|---|
Guggenheim Ultra Short Duration Fund — Institutional Class | 10.8% |
|---|
Guggenheim Strategy Fund II | 10.6% |
|---|
Total | 37.5% |
|---|
|
| Material Fund Change [Text Block] |
|
| C000043616 |
|
| Shareholder Report [Line Items] |
|
| Fund Name |
High Yield Strategy Fund
|
| Class Name |
Class C
|
| Trading Symbol |
RYHHX
|
| Annual or Semi-Annual Statement [Text Block] |
This annual shareholder report contains important information about the High Yield Strategy Fund for the period from April 1, 2025 to March 31, 2026.
|
| Shareholder Report Annual or Semi-Annual |
Annual Shareholder Report
|
| Additional Information [Text Block] |
You can find additional information about the fund at GuggenheimInvestments.com/mutual-funds/literature. You can also request this information by contacting 800 820 0888 or services@guggenheiminvestments.com.
|
| Additional Information Phone Number |
800 820 0888
|
| Additional Information Email |
<span style="box-sizing: border-box; color: rgb(67, 67, 67); display: inline; flex-wrap: nowrap; font-size: 10.6667px; font-weight: 400; grid-area: auto; line-height: 12.8px; margin: 0px; overflow: visible; text-align: left; text-align-last: auto; white-space-collapse: preserve-breaks;">services@guggenheiminvestments.com</span>
|
| Additional Information Website |
<span style="box-sizing: border-box; color: rgb(67, 67, 67); display: inline; flex-wrap: nowrap; font-size: 10.6667px; font-weight: 400; grid-area: auto; line-height: 12.8px; margin: 0px; overflow: visible; text-align: left; text-align-last: auto; white-space-collapse: preserve-breaks;">GuggenheimInvestments.com/mutual-funds/literature</span>
|
| Expenses [Text Block] |
What were the Fund's costs for the last year? * Based on a hypothetical $10,000 investment Table SummaryClass | Costs of a $10,000 Investment | Costs Paid as a % of a $10,000 Investment |
|---|
Class C | $234 | 2.27% |
|---|
Table Summary* | Excludes expenses of the underlying funds in which the fund invests, if any. |
|---|
|
| Expenses Paid, Amount |
$ 234
|
| Factors Affecting Performance [Text Block] |
What factors materially affected the Fund's performance over the last year? High yield generated positive returns for the reporting period. At the beginning of the reporting period, risk assets experienced some volatility due to macro-economic factors stemming from trade negotiations and tariffs. After the initial market shock of increased tariffs on trading partners, risk assets rebounded. During the later part of first quarter of 2026 geopolitical events weighed on the high yield market. All sectors contributed positively to the Bloomberg U.S. Corporate High Yield Index with notable positive contribution from communications and consumer discretionary. On the ratings side, BB-rated holdings were a leading contributor to index returns. |
| Line Graph [Table Text Block] |
Table Summary | High Yield Strategy Fund (Class C) | Bloomberg U.S. Aggregate Bond Index | Bloomberg U.S. Corporate High Yield Index |
|---|
3/31/16 | $10,000 | $10,000 | $10,000 |
|---|
3/31/17 | $10,738 | $10,044 | $11,639 |
|---|
3/31/18 | $10,883 | $10,165 | $12,079 |
|---|
3/31/19 | $11,578 | $10,620 | $12,796 |
|---|
3/31/20 | $10,832 | $11,569 | $11,908 |
|---|
3/31/21 | $12,130 | $11,651 | $14,732 |
|---|
3/31/22 | $11,501 | $11,168 | $14,635 |
|---|
3/31/23 | $11,199 | $10,633 | $14,146 |
|---|
3/31/24 | $12,264 | $10,814 | $15,723 |
|---|
3/31/25 | $12,953 | $11,342 | $16,933 |
|---|
3/31/26 | $13,697 | $11,835 | $18,119 |
|---|
|
| Average Annual Return [Table Text Block] |
Table SummaryAverage Annual Total Returns | One Year | Five Years | Ten Years |
|---|
Class C (without CDSC) | 5.74% | 2.46% | 3.20% |
|---|
Class C (with CDSC) ‡ | 4.80% | 2.46% | 3.20% |
|---|
Bloomberg U.S. Aggregate Bond Index | 4.35% | 0.31% | 1.70% |
|---|
Bloomberg U.S. Corporate High Yield Index | 7.01% | 4.23% | 6.12% |
|---|
|
| AssetsNet |
$ 12,360,523
|
| Holdings Count | Holding |
15
|
| Advisory Fees Paid, Amount |
$ 158,948
|
| InvestmentCompanyPortfolioTurnover |
0.00%
|
| Additional Fund Statistics [Text Block] |
Fund Statistics as of March 31, 2026 - Net Assets$12,360,523
- Total Number of Portfolio Holdings15
- Portfolio Turnover Rate-%
- Total Advisory Fees Paid$158,948
|
| Holdings [Text Block] |
Holdings DiversificationFootnote Reference1 (% of Net Assets) as of March 31, 2026 Table SummaryValue | Value |
|---|
OTC Credit Index Swap Agreements | 12.7% | Interest Rate Futures Contracts Purchased | 81.4% | Centrally Cleared Credit Default Swap Agreements Protection Sold | 85.7% | |
| Largest Holdings [Text Block] |
Largest HoldingsFootnote Reference2 (% of Net Assets) as of March 31, 2026 Table SummaryGuggenheim Strategy Fund III | 16.1% |
|---|
Guggenheim Ultra Short Duration Fund — Institutional Class | 10.8% |
|---|
Guggenheim Strategy Fund II | 10.6% |
|---|
Total | 37.5% |
|---|
|
| Material Fund Change [Text Block] |
|
| C000043617 |
|
| Shareholder Report [Line Items] |
|
| Fund Name |
High Yield Strategy Fund
|
| Class Name |
Class H
|
| Trading Symbol |
RYHGX
|
| Annual or Semi-Annual Statement [Text Block] |
This annual shareholder report contains important information about the High Yield Strategy Fund for the period from April 1, 2025 to March 31, 2026.
|
| Shareholder Report Annual or Semi-Annual |
Annual Shareholder Report
|
| Additional Information [Text Block] |
You can find additional information about the fund at GuggenheimInvestments.com/mutual-funds/literature. You can also request this information by contacting 800 820 0888 or services@guggenheiminvestments.com.
|
| Additional Information Phone Number |
800 820 0888
|
| Additional Information Email |
<span style="box-sizing: border-box; color: rgb(67, 67, 67); display: inline; flex-wrap: nowrap; font-size: 10.6667px; font-weight: 400; grid-area: auto; line-height: 12.8px; margin: 0px; overflow: visible; text-align: left; text-align-last: auto; white-space-collapse: preserve-breaks;">services@guggenheiminvestments.com</span>
|
| Additional Information Website |
<span style="box-sizing: border-box; color: rgb(67, 67, 67); display: inline; flex-wrap: nowrap; font-size: 10.6667px; font-weight: 400; grid-area: auto; line-height: 12.8px; margin: 0px; overflow: visible; text-align: left; text-align-last: auto; white-space-collapse: preserve-breaks;">GuggenheimInvestments.com/mutual-funds/literature</span>
|
| Expenses [Text Block] |
What were the Fund's costs for the last year? * Based on a hypothetical $10,000 investment Table SummaryClass | Costs of a $10,000 Investment | Costs Paid as a % of a $10,000 Investment |
|---|
Class H | $157 | 1.52% |
|---|
Table Summary* | Excludes expenses of the underlying funds in which the fund invests, if any. |
|---|
|
| Expenses Paid, Amount |
$ 157
|
| Factors Affecting Performance [Text Block] |
What factors materially affected the Fund's performance over the last year? High yield generated positive returns for the reporting period. At the beginning of the reporting period, risk assets experienced some volatility due to macro-economic factors stemming from trade negotiations and tariffs. After the initial market shock of increased tariffs on trading partners, risk assets rebounded. During the later part of first quarter of 2026 geopolitical events weighed on the high yield market. All sectors contributed positively to the Bloomberg U.S. Corporate High Yield Index with notable positive contribution from communications and consumer discretionary. On the ratings side, BB-rated holdings were a leading contributor to index returns. |
| Line Graph [Table Text Block] |
Table Summary | High Yield Strategy Fund (Class H) | Bloomberg U.S. Aggregate Bond Index | Bloomberg U.S. Corporate High Yield Index |
|---|
3/31/16 | $10,000 | $10,000 | $10,000 |
|---|
3/31/17 | $10,815 | $10,044 | $11,639 |
|---|
3/31/18 | $11,040 | $10,165 | $12,079 |
|---|
3/31/19 | $11,829 | $10,620 | $12,796 |
|---|
3/31/20 | $11,151 | $11,569 | $11,908 |
|---|
3/31/21 | $12,585 | $11,651 | $14,732 |
|---|
3/31/22 | $12,022 | $11,168 | $14,635 |
|---|
3/31/23 | $11,797 | $10,633 | $14,146 |
|---|
3/31/24 | $13,014 | $10,814 | $15,723 |
|---|
3/31/25 | $13,849 | $11,342 | $16,933 |
|---|
3/31/26 | $14,756 | $11,835 | $18,119 |
|---|
|
| Average Annual Return [Table Text Block] |
Table SummaryAverage Annual Total Returns | One Year | Five Years | Ten Years |
|---|
Class H | 6.56% | 3.24% | 3.97% |
|---|
Bloomberg U.S. Aggregate Bond Index | 4.35% | 0.31% | 1.70% |
|---|
Bloomberg U.S. Corporate High Yield Index | 7.01% | 4.23% | 6.12% |
|---|
|
| AssetsNet |
$ 12,360,523
|
| Holdings Count | Holding |
15
|
| Advisory Fees Paid, Amount |
$ 158,948
|
| InvestmentCompanyPortfolioTurnover |
0.00%
|
| Additional Fund Statistics [Text Block] |
Fund Statistics as of March 31, 2026 - Net Assets$12,360,523
- Total Number of Portfolio Holdings15
- Portfolio Turnover Rate-%
- Total Advisory Fees Paid$158,948
|
| Holdings [Text Block] |
Holdings DiversificationFootnote Reference1 (% of Net Assets) as of March 31, 2026 Table SummaryValue | Value |
|---|
OTC Credit Index Swap Agreements | 12.7% | Interest Rate Futures Contracts Purchased | 81.4% | Centrally Cleared Credit Default Swap Agreements Protection Sold | 85.7% | |
| Largest Holdings [Text Block] |
Largest HoldingsFootnote Reference2 (% of Net Assets) as of March 31, 2026 Table SummaryGuggenheim Strategy Fund III | 16.1% |
|---|
Guggenheim Ultra Short Duration Fund — Institutional Class | 10.8% |
|---|
Guggenheim Strategy Fund II | 10.6% |
|---|
Total | 37.5% |
|---|
|
| Material Fund Change [Text Block] |
|
| C000043618 |
|
| Shareholder Report [Line Items] |
|
| Fund Name |
Inverse High Yield Strategy Fund
|
| Class Name |
Class A
|
| Trading Symbol |
RYILX
|
| Annual or Semi-Annual Statement [Text Block] |
This annual shareholder report contains important information about the Inverse High Yield Strategy Fund for the period from April 1, 2025 to March 31, 2026.
|
| Shareholder Report Annual or Semi-Annual |
Annual Shareholder Report
|
| Additional Information [Text Block] |
You can find additional information about the fund at GuggenheimInvestments.com/mutual-funds/literature. You can also request this information by contacting 800 820 0888 or services@guggenheiminvestments.com.
|
| Additional Information Phone Number |
800 820 0888
|
| Additional Information Email |
<span style="box-sizing: border-box; color: rgb(67, 67, 67); display: inline; flex-wrap: nowrap; font-size: 10.6667px; font-weight: 400; grid-area: auto; line-height: 12.8px; margin: 0px; overflow: visible; text-align: left; text-align-last: auto; white-space-collapse: preserve-breaks;">services@guggenheiminvestments.com</span>
|
| Additional Information Website |
<span style="box-sizing: border-box; color: rgb(67, 67, 67); display: inline; flex-wrap: nowrap; font-size: 10.6667px; font-weight: 400; grid-area: auto; line-height: 12.8px; margin: 0px; overflow: visible; text-align: left; text-align-last: auto; white-space-collapse: preserve-breaks;">GuggenheimInvestments.com/mutual-funds/literature</span>
|
| Expenses [Text Block] |
What were the Fund's costs for the last year? * Based on a hypothetical $10,000 investment Table SummaryClass | Costs of a $10,000 Investment | Costs Paid as a % of a $10,000 Investment |
|---|
Class A | $158 | 1.59% |
|---|
Table Summary* | Excludes expenses of the underlying funds in which the fund invests, if any. |
|---|
|
| Expenses Paid, Amount |
$ 158
|
| Factors Affecting Performance [Text Block] |
What factors materially affected the Fund's performance over the last year? High yield generated positive returns for the reporting period. At the beginning of the reporting period, risk assets experienced some volatility due to macro-economic factors stemming from trade negotiations and tariffs. After the initial market shock of increased tariffs on trading partners, risk assets rebounded. During the later part of first quarter of 2026 geopolitical events weighed on the high yield market. All sectors contributed positively to the Bloomberg U.S. Corporate High Yield Index with notable positive contribution from communications and consumer discretionary. On the ratings side, BB-rated holdings were a leading contributor to index returns. |
| Line Graph [Table Text Block] |
Table Summary | Inverse High Yield Strategy Fund (Class A)‡ | Bloomberg U.S. Aggregate Bond Index | Bloomberg U.S. Corporate High Yield Index |
|---|
3/31/16 | $9,525 | $10,000 | $10,000 |
|---|
3/31/17 | $8,740 | $10,044 | $11,639 |
|---|
3/31/18 | $8,542 | $10,165 | $12,079 |
|---|
3/31/19 | $8,037 | $10,620 | $12,796 |
|---|
3/31/20 | $8,242 | $11,569 | $11,908 |
|---|
3/31/21 | $7,180 | $11,651 | $14,732 |
|---|
3/31/22 | $7,214 | $11,168 | $14,635 |
|---|
3/31/23 | $7,303 | $10,633 | $14,146 |
|---|
3/31/24 | $7,110 | $10,814 | $15,723 |
|---|
3/31/25 | $7,148 | $11,342 | $16,933 |
|---|
3/31/26 | $7,029 | $11,835 | $18,119 |
|---|
|
| Average Annual Return [Table Text Block] |
Table SummaryAverage Annual Total Returns | One Year | Five Years | Ten Years |
|---|
Class A (without sales charge) | -1.66% | -0.43% | -2.99% |
|---|
Class A (with sales charge) ‡ | -6.33% | -1.39% | -3.46% |
|---|
Bloomberg U.S. Aggregate Bond Index | 4.35% | 0.31% | 1.70% |
|---|
Bloomberg U.S. Corporate High Yield Index | 7.01% | 4.23% | 6.12% |
|---|
|
| AssetsNet |
$ 1,914,435
|
| Holdings Count | Holding |
6
|
| Advisory Fees Paid, Amount |
$ 12,293
|
| InvestmentCompanyPortfolioTurnover |
0.00%
|
| Additional Fund Statistics [Text Block] |
Fund Statistics as of March 31, 2026 - Net Assets$1,914,435
- Total Number of Portfolio Holdings6
- Portfolio Turnover Rate-%
- Total Advisory Fees Paid$12,293
|
| Holdings [Text Block] |
Holdings DiversificationFootnote Reference1 (% of Net Assets) as of March 31, 2026 Table SummaryValue | Value |
|---|
Interest Rate Futures Contracts Sold Short | -96.0% | Centrally Cleared Credit Default Swap Agreements Protection Purchased | -95.7% | |
| Largest Holdings [Text Block] |
Largest HoldingsFootnote Reference2 (% of Net Assets) as of March 31, 2026 Table SummaryGuggenheim Ultra Short Duration Fund — Institutional Class | 8.8% |
|---|
Guggenheim Strategy Fund II | 8.7% |
|---|
Total | 17.5% |
|---|
|
| Material Fund Change [Text Block] |
|
| C000043619 |
|
| Shareholder Report [Line Items] |
|
| Fund Name |
Inverse High Yield Strategy Fund
|
| Class Name |
Class C
|
| Trading Symbol |
RYIYX
|
| Annual or Semi-Annual Statement [Text Block] |
This annual shareholder report contains important information about the Inverse High Yield Strategy Fund for the period from April 1, 2025 to March 31, 2026.
|
| Shareholder Report Annual or Semi-Annual |
Annual Shareholder Report
|
| Additional Information [Text Block] |
You can find additional information about the fund at GuggenheimInvestments.com/mutual-funds/literature. You can also request this information by contacting 800 820 0888 or services@guggenheiminvestments.com.
|
| Additional Information Phone Number |
800 820 0888
|
| Additional Information Email |
<span style="box-sizing: border-box; color: rgb(67, 67, 67); display: inline; flex-wrap: nowrap; font-size: 10.6667px; font-weight: 400; grid-area: auto; line-height: 12.8px; margin: 0px; overflow: visible; text-align: left; text-align-last: auto; white-space-collapse: preserve-breaks;">services@guggenheiminvestments.com</span>
|
| Additional Information Website |
<span style="box-sizing: border-box; color: rgb(67, 67, 67); display: inline; flex-wrap: nowrap; font-size: 10.6667px; font-weight: 400; grid-area: auto; line-height: 12.8px; margin: 0px; overflow: visible; text-align: left; text-align-last: auto; white-space-collapse: preserve-breaks;">GuggenheimInvestments.com/mutual-funds/literature</span>
|
| Expenses [Text Block] |
What were the Fund's costs for the last year? * Based on a hypothetical $10,000 investment Table SummaryClass | Costs of a $10,000 Investment | Costs Paid as a % of a $10,000 Investment |
|---|
Class C | $206 | 2.08% |
|---|
Table Summary* | Excludes expenses of the underlying funds in which the fund invests, if any. |
|---|
|
| Expenses Paid, Amount |
$ 206
|
| Factors Affecting Performance [Text Block] |
What factors materially affected the Fund's performance over the last year? High yield generated positive returns for the reporting period. At the beginning of the reporting period, risk assets experienced some volatility due to macro-economic factors stemming from trade negotiations and tariffs. After the initial market shock of increased tariffs on trading partners, risk assets rebounded. During the later part of first quarter of 2026 geopolitical events weighed on the high yield market. All sectors contributed positively to the Bloomberg U.S. Corporate High Yield Index with notable positive contribution from communications and consumer discretionary. On the ratings side, BB-rated holdings were a leading contributor to index returns. |
| Line Graph [Table Text Block] |
Table Summary | Inverse High Yield Strategy Fund (Class C) | Bloomberg U.S. Aggregate Bond Index | Bloomberg U.S. Corporate High Yield Index |
|---|
3/31/16 | $10,000 | $10,000 | $10,000 |
|---|
3/31/17 | $9,103 | $10,044 | $11,639 |
|---|
3/31/18 | $8,824 | $10,165 | $12,079 |
|---|
3/31/19 | $8,239 | $10,620 | $12,796 |
|---|
3/31/20 | $8,366 | $11,569 | $11,908 |
|---|
3/31/21 | $7,175 | $11,651 | $14,732 |
|---|
3/31/22 | $7,208 | $11,168 | $14,635 |
|---|
3/31/23 | $7,247 | $10,633 | $14,146 |
|---|
3/31/24 | $7,004 | $10,814 | $15,723 |
|---|
3/31/25 | $6,989 | $11,342 | $16,933 |
|---|
3/31/26 | $6,822 | $11,835 | $18,119 |
|---|
|
| Average Annual Return [Table Text Block] |
Table SummaryAverage Annual Total Returns | One Year | Five Years | Ten Years |
|---|
Class C (without CDSC) | -2.38% | -1.00% | -3.75% |
|---|
Class C (with CDSC) ‡ | -3.36% | -1.00% | -3.75% |
|---|
Bloomberg U.S. Aggregate Bond Index | 4.35% | 0.31% | 1.70% |
|---|
Bloomberg U.S. Corporate High Yield Index | 7.01% | 4.23% | 6.12% |
|---|
|
| AssetsNet |
$ 1,914,435
|
| Holdings Count | Holding |
6
|
| Advisory Fees Paid, Amount |
$ 12,293
|
| InvestmentCompanyPortfolioTurnover |
0.00%
|
| Additional Fund Statistics [Text Block] |
Fund Statistics as of March 31, 2026 - Net Assets$1,914,435
- Total Number of Portfolio Holdings6
- Portfolio Turnover Rate-%
- Total Advisory Fees Paid$12,293
|
| Holdings [Text Block] |
Holdings DiversificationFootnote Reference1 (% of Net Assets) as of March 31, 2026 Table SummaryValue | Value |
|---|
Interest Rate Futures Contracts Sold Short | -96.0% | Centrally Cleared Credit Default Swap Agreements Protection Purchased | -95.7% | |
| Largest Holdings [Text Block] |
Largest HoldingsFootnote Reference2 (% of Net Assets) as of March 31, 2026 Table SummaryGuggenheim Ultra Short Duration Fund — Institutional Class | 8.8% |
|---|
Guggenheim Strategy Fund II | 8.7% |
|---|
Total | 17.5% |
|---|
|
| Material Fund Change [Text Block] |
|
| C000043620 |
|
| Shareholder Report [Line Items] |
|
| Fund Name |
Inverse High Yield Strategy Fund
|
| Class Name |
Class H
|
| Trading Symbol |
RYIHX
|
| Annual or Semi-Annual Statement [Text Block] |
This annual shareholder report contains important information about the Inverse High Yield Strategy Fund for the period from April 1, 2025 to March 31, 2026.
|
| Shareholder Report Annual or Semi-Annual |
Annual Shareholder Report
|
| Additional Information [Text Block] |
You can find additional information about the fund at GuggenheimInvestments.com/mutual-funds/literature. You can also request this information by contacting 800 820 0888 or services@guggenheiminvestments.com.
|
| Additional Information Phone Number |
800 820 0888
|
| Additional Information Email |
<span style="box-sizing: border-box; color: rgb(67, 67, 67); display: inline; flex-wrap: nowrap; font-size: 10.6667px; font-weight: 400; grid-area: auto; line-height: 12.8px; margin: 0px; overflow: visible; text-align: left; text-align-last: auto; white-space-collapse: preserve-breaks;">services@guggenheiminvestments.com</span>
|
| Additional Information Website |
<span style="box-sizing: border-box; color: rgb(67, 67, 67); display: inline; flex-wrap: nowrap; font-size: 10.6667px; font-weight: 400; grid-area: auto; line-height: 12.8px; margin: 0px; overflow: visible; text-align: left; text-align-last: auto; white-space-collapse: preserve-breaks;">GuggenheimInvestments.com/mutual-funds/literature</span>
|
| Expenses [Text Block] |
What were the Fund's costs for the last year? * Based on a hypothetical $10,000 investment Table SummaryClass | Costs of a $10,000 Investment | Costs Paid as a % of a $10,000 Investment |
|---|
Class H | $153 | 1.54% |
|---|
Table Summary* | Excludes expenses of the underlying funds in which the fund invests, if any. |
|---|
|
| Expenses Paid, Amount |
$ 153
|
| Factors Affecting Performance [Text Block] |
What factors materially affected the Fund's performance over the last year? High yield generated positive returns for the reporting period. At the beginning of the reporting period, risk assets experienced some volatility due to macro-economic factors stemming from trade negotiations and tariffs. After the initial market shock of increased tariffs on trading partners, risk assets rebounded. During the later part of first quarter of 2026 geopolitical events weighed on the high yield market. All sectors contributed positively to the Bloomberg U.S. Corporate High Yield Index with notable positive contribution from communications and consumer discretionary. On the ratings side, BB-rated holdings were a leading contributor to index returns. |
| Line Graph [Table Text Block] |
Table Summary | Inverse High Yield Strategy Fund (Class H) | Bloomberg U.S. Aggregate Bond Index | Bloomberg U.S. Corporate High Yield Index |
|---|
3/31/16 | $10,000 | $10,000 | $10,000 |
|---|
3/31/17 | $9,310 | $10,044 | $11,639 |
|---|
3/31/18 | $9,059 | $10,165 | $12,079 |
|---|
3/31/19 | $8,522 | $10,620 | $12,796 |
|---|
3/31/20 | $8,725 | $11,569 | $11,908 |
|---|
3/31/21 | $7,540 | $11,651 | $14,732 |
|---|
3/31/22 | $7,636 | $11,168 | $14,635 |
|---|
3/31/23 | $7,737 | $10,633 | $14,146 |
|---|
3/31/24 | $7,531 | $10,814 | $15,723 |
|---|
3/31/25 | $7,561 | $11,342 | $16,933 |
|---|
3/31/26 | $7,442 | $11,835 | $18,119 |
|---|
|
| Average Annual Return [Table Text Block] |
Table SummaryAverage Annual Total Returns | One Year | Five Years | Ten Years |
|---|
Class H | -1.58% | -0.26% | -2.91% |
|---|
Bloomberg U.S. Aggregate Bond Index | 4.35% | 0.31% | 1.70% |
|---|
Bloomberg U.S. Corporate High Yield Index | 7.01% | 4.23% | 6.12% |
|---|
|
| AssetsNet |
$ 1,914,435
|
| Holdings Count | Holding |
6
|
| Advisory Fees Paid, Amount |
$ 12,293
|
| InvestmentCompanyPortfolioTurnover |
0.00%
|
| Additional Fund Statistics [Text Block] |
Fund Statistics as of March 31, 2026 - Net Assets$1,914,435
- Total Number of Portfolio Holdings6
- Portfolio Turnover Rate-%
- Total Advisory Fees Paid$12,293
|
| Holdings [Text Block] |
Holdings DiversificationFootnote Reference1 (% of Net Assets) as of March 31, 2026 Table SummaryValue | Value |
|---|
Interest Rate Futures Contracts Sold Short | -96.0% | Centrally Cleared Credit Default Swap Agreements Protection Purchased | -95.7% | |
| Largest Holdings [Text Block] |
Largest HoldingsFootnote Reference2 (% of Net Assets) as of March 31, 2026 Table SummaryGuggenheim Ultra Short Duration Fund — Institutional Class | 8.8% |
|---|
Guggenheim Strategy Fund II | 8.7% |
|---|
Total | 17.5% |
|---|
|
| Material Fund Change [Text Block] |
|
| C000050422 |
|
| Shareholder Report [Line Items] |
|
| Fund Name |
Emerging Markets 2x Strategy Fund
|
| Class Name |
Class A
|
| Trading Symbol |
RYWTX
|
| Annual or Semi-Annual Statement [Text Block] |
This annual shareholder report contains important information about the Emerging Markets 2x Strategy Fund for the period from April 1, 2025 to March 31, 2026.
|
| Shareholder Report Annual or Semi-Annual |
Annual Shareholder Report
|
| Additional Information [Text Block] |
You can find additional information about the fund at GuggenheimInvestments.com/mutual-funds/literature. You can also request this information by contacting 800 820 0888 or services@guggenheiminvestments.com.
|
| Additional Information Phone Number |
800 820 0888
|
| Additional Information Email |
<span style="box-sizing: border-box; color: rgb(67, 67, 67); display: inline; flex-wrap: nowrap; font-size: 10.6667px; font-weight: 400; grid-area: auto; line-height: 12.8px; margin: 0px; overflow: visible; text-align: left; text-align-last: auto; white-space-collapse: preserve-breaks;">services@guggenheiminvestments.com</span>
|
| Additional Information Website |
<span style="box-sizing: border-box; color: rgb(67, 67, 67); display: inline; flex-wrap: nowrap; font-size: 10.6667px; font-weight: 400; grid-area: auto; line-height: 12.8px; margin: 0px; overflow: visible; text-align: left; text-align-last: auto; white-space-collapse: preserve-breaks;">GuggenheimInvestments.com/mutual-funds/literature</span>
|
| Expenses [Text Block] |
What were the Fund's costs for the last year? * Based on a hypothetical $10,000 investment Table SummaryClass | Costs of a $10,000 Investment | Costs Paid as a % of a $10,000 Investment |
|---|
Class A | $218 | 1.82% |
|---|
Table Summary* | Excludes expenses of the underlying funds in which the fund invests, if any. |
|---|
|
| Expenses Paid, Amount |
$ 218
|
| Factors Affecting Performance [Text Block] |
What factors materially affected the Fund's performance over the last year? The sectors that contributed the most to the return of the underlying index for the reporting period were semiconductors & semiconductor equipment, metals & mining, and oil, gas & consumable fuels. Those that detracted the most were hotels, restaurants & leisure, IT services, and broadline retail. The holdings that contributed the most to the return of the underlying index were Taiwan Semiconductor Manufacturing Company, Ltd. ADR, ASE Technology Holdings ADR, and Gold Fields Ltd. ADR. Those that detracted the most were Infosys Ltd. ADR, JD.com, Inc. ADR, and HDFC Bank Ltd. ADR. The fund maintained a daily correlation of over 99% to its benchmark of 200% of the daily price movement of the S&P Emerging Markets 50 ADR Index. |
| Line Graph [Table Text Block] |
Table Summary | Emerging Markets 2x Strategy Fund (Class A)‡ | MSCI World ex U.S. Index | S&P Emerging 50 ADR Index |
|---|
3/31/16 | $9,525 | $10,000 | $10,000 |
|---|
3/31/17 | $12,971 | $11,193 | $12,065 |
|---|
3/31/18 | $18,545 | $12,751 | $14,920 |
|---|
3/31/19 | $15,104 | $12,350 | $14,149 |
|---|
3/31/20 | $9,475 | $10,511 | $11,807 |
|---|
3/31/21 | $24,887 | $15,332 | $20,164 |
|---|
3/31/22 | $14,605 | $15,798 | $16,253 |
|---|
3/31/23 | $11,634 | $15,365 | $15,668 |
|---|
3/31/24 | $12,323 | $17,715 | $17,116 |
|---|
3/31/25 | $14,906 | $18,654 | $20,160 |
|---|
3/31/26 | $20,751 | $22,943 | $25,360 |
|---|
|
| Average Annual Return [Table Text Block] |
Table SummaryAverage Annual Total Returns | One Year | Five Years | Ten Years |
|---|
Class A (without sales charge) | 39.22% | -3.57% | 8.10% |
|---|
Class A (with sales charge) ‡ | 32.60% | -4.50% | 7.57% |
|---|
MSCI World ex U.S. Index | 22.99% | 8.40% | 8.66% |
|---|
S&P Emerging 50 ADR Index | 25.79% | 4.69% | 9.75% |
|---|
|
| AssetsNet |
$ 9,487,668
|
| Holdings Count | Holding |
56
|
| Advisory Fees Paid, Amount |
$ 99,268
|
| InvestmentCompanyPortfolioTurnover |
271.00%
|
| Additional Fund Statistics [Text Block] |
Fund Statistics as of March 31, 2026 - Net Assets$9,487,668
- Total Number of Portfolio Holdings56
- Portfolio Turnover Rate271%
- Total Advisory Fees Paid$99,268
|
| Holdings [Text Block] |
Country CompositionFootnote Reference1 (% of Total Investments) as of March 31, 2026 Table SummaryChina | 25.7% |
|---|
United States | 25.2% |
|---|
Taiwan | 18.2% |
|---|
Brazil | 10.4% |
|---|
India | 9.3% |
|---|
South Korea | 4.3% |
|---|
Mexico | 2.9% |
|---|
South Africa | 2.5% |
|---|
Others | 1.5% |
|---|
Total Investments | 100.0% |
|---|
Holdings DiversificationFootnote Reference3 (% of Net Assets) as of March 31, 2026 Table SummaryValue | Value |
|---|
Other | 14.3% | Financial | 11.4% | Technology | 17.2% | Communications | 18.8% | OTC Equity Index Swap Agreements | 138.8% | |
| Largest Holdings [Text Block] |
10 Largest HoldingsFootnote Reference2 (% of Net Assets) as of March 31, 2026 Table SummaryTaiwan Semiconductor Manufacturing Company Ltd., ADR | 12.2% |
|---|
Alibaba Group Holding Ltd., ADR | 10.3% |
|---|
HDFC Bank Ltd., ADR | 3.2% |
|---|
PDD Holdings, Inc., ADR | 2.7% |
|---|
ICICI Bank Ltd., ADR | 2.4% |
|---|
Vale S.A., ADR | 2.0% |
|---|
Infosys Ltd., ADR | 1.6% |
|---|
Itau Unibanco Holding S.A., ADR | 1.6% |
|---|
JD.com, Inc., ADR | 1.5% |
|---|
Petroleo Brasileiro S.A. - Petrobras, ADR | 1.4% |
|---|
Total | 38.9% |
|---|
|
| Material Fund Change [Text Block] |
|
| C000050423 |
|
| Shareholder Report [Line Items] |
|
| Fund Name |
Emerging Markets 2x Strategy Fund
|
| Class Name |
Class C
|
| Trading Symbol |
RYWUX
|
| Annual or Semi-Annual Statement [Text Block] |
This annual shareholder report contains important information about the Emerging Markets 2x Strategy Fund for the period from April 1, 2025 to March 31, 2026.
|
| Shareholder Report Annual or Semi-Annual |
Annual Shareholder Report
|
| Additional Information [Text Block] |
You can find additional information about the fund at GuggenheimInvestments.com/mutual-funds/literature. You can also request this information by contacting 800 820 0888 or services@guggenheiminvestments.com.
|
| Additional Information Phone Number |
800 820 0888
|
| Additional Information Email |
<span style="box-sizing: border-box; color: rgb(67, 67, 67); display: inline; flex-wrap: nowrap; font-size: 10.6667px; font-weight: 400; grid-area: auto; line-height: 12.8px; margin: 0px; overflow: visible; text-align: left; text-align-last: auto; white-space-collapse: preserve-breaks;">services@guggenheiminvestments.com</span>
|
| Additional Information Website |
<span style="box-sizing: border-box; color: rgb(67, 67, 67); display: inline; flex-wrap: nowrap; font-size: 10.6667px; font-weight: 400; grid-area: auto; line-height: 12.8px; margin: 0px; overflow: visible; text-align: left; text-align-last: auto; white-space-collapse: preserve-breaks;">GuggenheimInvestments.com/mutual-funds/literature</span>
|
| Expenses [Text Block] |
What were the Fund's costs for the last year? * Based on a hypothetical $10,000 investment Table SummaryClass | Costs of a $10,000 Investment | Costs Paid as a % of a $10,000 Investment |
|---|
Class C | $308 | 2.59% |
|---|
Table Summary* | Excludes expenses of the underlying funds in which the fund invests, if any. |
|---|
|
| Expenses Paid, Amount |
$ 308
|
| Factors Affecting Performance [Text Block] |
What factors materially affected the Fund's performance over the last year? The sectors that contributed the most to the return of the underlying index for the reporting period were semiconductors & semiconductor equipment, metals & mining, and oil, gas & consumable fuels. Those that detracted the most were hotels, restaurants & leisure, IT services, and broadline retail. The holdings that contributed the most to the return of the underlying index were Taiwan Semiconductor Manufacturing Company, Ltd. ADR, ASE Technology Holdings ADR, and Gold Fields Ltd. ADR. Those that detracted the most were Infosys Ltd. ADR, JD.com, Inc. ADR, and HDFC Bank Ltd. ADR. The fund maintained a daily correlation of over 99% to its benchmark of 200% of the daily price movement of the S&P Emerging Markets 50 ADR Index. |
| Line Graph [Table Text Block] |
Table Summary | Emerging Markets 2x Strategy Fund (Class C) | MSCI World ex U.S. Index | S&P Emerging 50 ADR Index |
|---|
3/31/16 | $10,000 | $10,000 | $10,000 |
|---|
3/31/17 | $13,519 | $11,193 | $12,065 |
|---|
3/31/18 | $19,180 | $12,751 | $14,920 |
|---|
3/31/19 | $15,503 | $12,350 | $14,149 |
|---|
3/31/20 | $9,654 | $10,511 | $11,807 |
|---|
3/31/21 | $25,163 | $15,332 | $20,164 |
|---|
3/31/22 | $14,659 | $15,798 | $16,253 |
|---|
3/31/23 | $11,585 | $15,365 | $15,668 |
|---|
3/31/24 | $12,172 | $17,715 | $17,116 |
|---|
3/31/25 | $14,612 | $18,654 | $20,160 |
|---|
3/31/26 | $20,186 | $22,943 | $25,360 |
|---|
|
| Average Annual Return [Table Text Block] |
Table SummaryAverage Annual Total Returns | One Year | Five Years | Ten Years |
|---|
Class C (without CDSC) | 38.14% | -4.31% | 7.28% |
|---|
Class C (with CDSC) ‡ | 37.14% | -4.31% | 7.28% |
|---|
MSCI World ex U.S. Index | 22.99% | 8.40% | 8.66% |
|---|
S&P Emerging 50 ADR Index | 25.79% | 4.69% | 9.75% |
|---|
|
| AssetsNet |
$ 9,487,668
|
| Holdings Count | Holding |
56
|
| Advisory Fees Paid, Amount |
$ 99,268
|
| InvestmentCompanyPortfolioTurnover |
271.00%
|
| Additional Fund Statistics [Text Block] |
Fund Statistics as of March 31, 2026 - Net Assets$9,487,668
- Total Number of Portfolio Holdings56
- Portfolio Turnover Rate271%
- Total Advisory Fees Paid$99,268
|
| Holdings [Text Block] |
Country CompositionFootnote Reference1 (% of Total Investments) as of March 31, 2026 Table SummaryChina | 25.7% |
|---|
United States | 25.2% |
|---|
Taiwan | 18.2% |
|---|
Brazil | 10.4% |
|---|
India | 9.3% |
|---|
South Korea | 4.3% |
|---|
Mexico | 2.9% |
|---|
South Africa | 2.5% |
|---|
Others | 1.5% |
|---|
Total Investments | 100.0% |
|---|
Holdings DiversificationFootnote Reference3 (% of Net Assets) as of March 31, 2026 Table SummaryValue | Value |
|---|
Other | 14.3% | Financial | 11.4% | Technology | 17.2% | Communications | 18.8% | OTC Equity Index Swap Agreements | 138.8% | |
| Largest Holdings [Text Block] |
10 Largest HoldingsFootnote Reference2 (% of Net Assets) as of March 31, 2026 Table SummaryTaiwan Semiconductor Manufacturing Company Ltd., ADR | 12.2% |
|---|
Alibaba Group Holding Ltd., ADR | 10.3% |
|---|
HDFC Bank Ltd., ADR | 3.2% |
|---|
PDD Holdings, Inc., ADR | 2.7% |
|---|
ICICI Bank Ltd., ADR | 2.4% |
|---|
Vale S.A., ADR | 2.0% |
|---|
Infosys Ltd., ADR | 1.6% |
|---|
Itau Unibanco Holding S.A., ADR | 1.6% |
|---|
JD.com, Inc., ADR | 1.5% |
|---|
Petroleo Brasileiro S.A. - Petrobras, ADR | 1.4% |
|---|
Total | 38.9% |
|---|
|
| Material Fund Change [Text Block] |
|
| C000050424 |
|
| Shareholder Report [Line Items] |
|
| Fund Name |
Emerging Markets 2x Strategy Fund
|
| Class Name |
Class H
|
| Trading Symbol |
RYWVX
|
| Annual or Semi-Annual Statement [Text Block] |
This annual shareholder report contains important information about the Emerging Markets 2x Strategy Fund for the period from April 1, 2025 to March 31, 2026.
|
| Shareholder Report Annual or Semi-Annual |
Annual Shareholder Report
|
| Additional Information [Text Block] |
You can find additional information about the fund at GuggenheimInvestments.com/mutual-funds/literature. You can also request this information by contacting 800 820 0888 or services@guggenheiminvestments.com.
|
| Additional Information Phone Number |
800 820 0888
|
| Additional Information Email |
<span style="box-sizing: border-box; color: rgb(67, 67, 67); display: inline; flex-wrap: nowrap; font-size: 10.6667px; font-weight: 400; grid-area: auto; line-height: 12.8px; margin: 0px; overflow: visible; text-align: left; text-align-last: auto; white-space-collapse: preserve-breaks;">services@guggenheiminvestments.com</span>
|
| Additional Information Website |
<span style="box-sizing: border-box; color: rgb(67, 67, 67); display: inline; flex-wrap: nowrap; font-size: 10.6667px; font-weight: 400; grid-area: auto; line-height: 12.8px; margin: 0px; overflow: visible; text-align: left; text-align-last: auto; white-space-collapse: preserve-breaks;">GuggenheimInvestments.com/mutual-funds/literature</span>
|
| Expenses [Text Block] |
What were the Fund's costs for the last year? * Based on a hypothetical $10,000 investment Table SummaryClass | Costs of a $10,000 Investment | Costs Paid as a % of a $10,000 Investment |
|---|
Class H | $223 | 1.86% |
|---|
Table Summary* | Excludes expenses of the underlying funds in which the fund invests, if any. |
|---|
|
| Expenses Paid, Amount |
$ 223
|
| Factors Affecting Performance [Text Block] |
What factors materially affected the Fund's performance over the last year? The sectors that contributed the most to the return of the underlying index for the reporting period were semiconductors & semiconductor equipment, metals & mining, and oil, gas & consumable fuels. Those that detracted the most were hotels, restaurants & leisure, IT services, and broadline retail. The holdings that contributed the most to the return of the underlying index were Taiwan Semiconductor Manufacturing Company, Ltd. ADR, ASE Technology Holdings ADR, and Gold Fields Ltd. ADR. Those that detracted the most were Infosys Ltd. ADR, JD.com, Inc. ADR, and HDFC Bank Ltd. ADR. The fund maintained a daily correlation of over 99% to its benchmark of 200% of the daily price movement of the S&P Emerging Markets 50 ADR Index. |
| Line Graph [Table Text Block] |
Table Summary | Emerging Markets 2x Strategy Fund (Class H) | MSCI World ex U.S. Index | S&P Emerging 50 ADR Index |
|---|
3/31/16 | $10,000 | $10,000 | $10,000 |
|---|
3/31/17 | $13,604 | $11,193 | $12,065 |
|---|
3/31/18 | $19,447 | $12,751 | $14,920 |
|---|
3/31/19 | $15,839 | $12,350 | $14,149 |
|---|
3/31/20 | $9,936 | $10,511 | $11,807 |
|---|
3/31/21 | $26,090 | $15,332 | $20,164 |
|---|
3/31/22 | $15,313 | $15,798 | $16,253 |
|---|
3/31/23 | $12,188 | $15,365 | $15,668 |
|---|
3/31/24 | $12,893 | $17,715 | $17,116 |
|---|
3/31/25 | $15,569 | $18,654 | $20,160 |
|---|
3/31/26 | $21,685 | $22,943 | $25,360 |
|---|
|
| Average Annual Return [Table Text Block] |
Table SummaryAverage Annual Total Returns | One Year | Five Years | Ten Years |
|---|
Class H | 39.29% | -3.63% | 8.05% |
|---|
MSCI World ex U.S. Index | 22.99% | 8.40% | 8.66% |
|---|
S&P Emerging 50 ADR Index | 25.79% | 4.69% | 9.75% |
|---|
|
| AssetsNet |
$ 9,487,668
|
| Holdings Count | Holding |
56
|
| Advisory Fees Paid, Amount |
$ 99,268
|
| InvestmentCompanyPortfolioTurnover |
271.00%
|
| Additional Fund Statistics [Text Block] |
Fund Statistics as of March 31, 2026 - Net Assets$9,487,668
- Total Number of Portfolio Holdings56
- Portfolio Turnover Rate271%
- Total Advisory Fees Paid$99,268
|
| Holdings [Text Block] |
Country CompositionFootnote Reference1 (% of Total Investments) as of March 31, 2026 Table SummaryChina | 25.7% |
|---|
United States | 25.2% |
|---|
Taiwan | 18.2% |
|---|
Brazil | 10.4% |
|---|
India | 9.3% |
|---|
South Korea | 4.3% |
|---|
Mexico | 2.9% |
|---|
South Africa | 2.5% |
|---|
Others | 1.5% |
|---|
Total Investments | 100.0% |
|---|
Holdings DiversificationFootnote Reference3 (% of Net Assets) as of March 31, 2026 Table SummaryValue | Value |
|---|
Other | 14.3% | Financial | 11.4% | Technology | 17.2% | Communications | 18.8% | OTC Equity Index Swap Agreements | 138.8% | |
| Largest Holdings [Text Block] |
10 Largest HoldingsFootnote Reference2 (% of Net Assets) as of March 31, 2026 Table SummaryTaiwan Semiconductor Manufacturing Company Ltd., ADR | 12.2% |
|---|
Alibaba Group Holding Ltd., ADR | 10.3% |
|---|
HDFC Bank Ltd., ADR | 3.2% |
|---|
PDD Holdings, Inc., ADR | 2.7% |
|---|
ICICI Bank Ltd., ADR | 2.4% |
|---|
Vale S.A., ADR | 2.0% |
|---|
Infosys Ltd., ADR | 1.6% |
|---|
Itau Unibanco Holding S.A., ADR | 1.6% |
|---|
JD.com, Inc., ADR | 1.5% |
|---|
Petroleo Brasileiro S.A. - Petrobras, ADR | 1.4% |
|---|
Total | 38.9% |
|---|
|
| Material Fund Change [Text Block] |
|
| C000050425 |
|
| Shareholder Report [Line Items] |
|
| Fund Name |
Inverse Emerging Markets 2x Strategy Fund
|
| Class Name |
Class A
|
| Trading Symbol |
RYWWX
|
| Annual or Semi-Annual Statement [Text Block] |
This annual shareholder report contains important information about the Inverse Emerging Markets 2x Strategy Fund for the period from April 1, 2025 to March 31, 2026.
|
| Shareholder Report Annual or Semi-Annual |
Annual Shareholder Report
|
| Additional Information [Text Block] |
You can find additional information about the fund at GuggenheimInvestments.com/mutual-funds/literature. You can also request this information by contacting 800 820 0888 or services@guggenheiminvestments.com.
|
| Additional Information Phone Number |
800 820 0888
|
| Additional Information Email |
<span style="box-sizing: border-box; color: rgb(67, 67, 67); display: inline; flex-wrap: nowrap; font-size: 10.6667px; font-weight: 400; grid-area: auto; line-height: 12.8px; margin: 0px; overflow: visible; text-align: left; text-align-last: auto; white-space-collapse: preserve-breaks;">services@guggenheiminvestments.com</span>
|
| Additional Information Website |
<span style="box-sizing: border-box; color: rgb(67, 67, 67); display: inline; flex-wrap: nowrap; font-size: 10.6667px; font-weight: 400; grid-area: auto; line-height: 12.8px; margin: 0px; overflow: visible; text-align: left; text-align-last: auto; white-space-collapse: preserve-breaks;">GuggenheimInvestments.com/mutual-funds/literature</span>
|
| Expenses [Text Block] |
What were the Fund's costs for the last year? * Based on a hypothetical $10,000 investment Table SummaryClass | Costs of a $10,000 Investment | Costs Paid as a % of a $10,000 Investment |
|---|
Class A | $138 | 1.75% |
|---|
Table Summary* | Excludes expenses of the underlying funds in which the fund invests, if any. |
|---|
|
| Expenses Paid, Amount |
$ 138
|
| Factors Affecting Performance [Text Block] |
What factors materially affected the Fund's performance over the last year? The sectors that contributed the most to the return of the underlying index for the reporting period were semiconductors & semiconductor equipment, metals & mining, and oil, gas & consumable fuels. Those that detracted the most were hotels, restaurants & leisure, IT services, and broadline retail. The holdings that contributed the most to the return of the underlying index were Taiwan Semiconductor Manufacturing Company, Ltd. ADR, ASE Technology Holdings ADR, and Gold Fields Ltd. ADR. Those that detracted the most were Infosys Ltd. ADR, JD.com, Inc. ADR, and HDFC Bank Ltd. ADR. The fund maintained a daily correlation of over 99% to its benchmark of -200% of the daily price movement of the S&P Emerging Markets 50 ADR Index. |
| Line Graph [Table Text Block] |
Table Summary | Inverse Emerging Markets 2x Strategy Fund (Class A)‡ | MSCI World ex U.S. Index | S&P Emerging 50 ADR Index |
|---|
3/31/16 | $9,525 | $10,000 | $10,000 |
|---|
3/31/17 | $5,931 | $11,193 | $12,065 |
|---|
3/31/18 | $3,656 | $12,751 | $14,920 |
|---|
3/31/19 | $3,794 | $12,350 | $14,149 |
|---|
3/31/20 | $4,413 | $10,511 | $11,807 |
|---|
3/31/21 | $1,176 | $15,332 | $20,164 |
|---|
3/31/22 | $1,420 | $15,798 | $16,253 |
|---|
3/31/23 | $1,256 | $15,365 | $15,668 |
|---|
3/31/24 | $1,067 | $17,715 | $17,116 |
|---|
3/31/25 | $748 | $18,654 | $20,160 |
|---|
3/31/26 | $430 | $22,943 | $25,360 |
|---|
|
| Average Annual Return [Table Text Block] |
Table SummaryAverage Annual Total Returns | One Year | Five Years | Ten Years |
|---|
Class A (without sales charge) | -42.59% | -18.23% | -26.65% |
|---|
Class A (with sales charge) ‡ | -45.32% | -19.02% | -26.99% |
|---|
MSCI World ex U.S. Index | 22.99% | 8.40% | 8.66% |
|---|
S&P Emerging 50 ADR Index | 25.79% | 4.69% | 9.75% |
|---|
|
| AssetsNet |
$ 301,183
|
| Holdings Count | Holding |
5
|
| Advisory Fees Paid, Amount |
$ 1,608
|
| InvestmentCompanyPortfolioTurnover |
0.00%
|
| Additional Fund Statistics [Text Block] |
Fund Statistics as of March 31, 2026 - Net Assets$301,183
- Total Number of Portfolio Holdings5
- Portfolio Turnover Rate-%
- Total Advisory Fees Paid$1,608
|
| Holdings [Text Block] |
Holdings DiversificationFootnote Reference1 (% of Net Assets) as of March 31, 2026 Table SummaryValue | Value |
|---|
OTC Equity Index Swap Agreements Sold Short | -200.1% | |
| Material Fund Change [Text Block] |
|
| C000050426 |
|
| Shareholder Report [Line Items] |
|
| Fund Name |
Inverse Emerging Markets 2x Strategy Fund
|
| Class Name |
Class C
|
| Trading Symbol |
RYWZX
|
| Annual or Semi-Annual Statement [Text Block] |
This annual shareholder report contains important information about the Inverse Emerging Markets 2x Strategy Fund for the period from April 1, 2025 to March 31, 2026.
|
| Shareholder Report Annual or Semi-Annual |
Annual Shareholder Report
|
| Additional Information [Text Block] |
You can find additional information about the fund at GuggenheimInvestments.com/mutual-funds/literature. You can also request this information by contacting 800 820 0888 or services@guggenheiminvestments.com.
|
| Additional Information Phone Number |
800 820 0888
|
| Additional Information Email |
<span style="box-sizing: border-box; color: rgb(67, 67, 67); display: inline; flex-wrap: nowrap; font-size: 10.6667px; font-weight: 400; grid-area: auto; line-height: 12.8px; margin: 0px; overflow: visible; text-align: left; text-align-last: auto; white-space-collapse: preserve-breaks;">services@guggenheiminvestments.com</span>
|
| Additional Information Website |
<span style="box-sizing: border-box; color: rgb(67, 67, 67); display: inline; flex-wrap: nowrap; font-size: 10.6667px; font-weight: 400; grid-area: auto; line-height: 12.8px; margin: 0px; overflow: visible; text-align: left; text-align-last: auto; white-space-collapse: preserve-breaks;">GuggenheimInvestments.com/mutual-funds/literature</span>
|
| Expenses [Text Block] |
What were the Fund's costs for the last year? * Based on a hypothetical $10,000 investment Table SummaryClass | Costs of a $10,000 Investment | Costs Paid as a % of a $10,000 Investment |
|---|
Class C | $215 | 2.74% |
|---|
Table Summary* | Excludes expenses of the underlying funds in which the fund invests, if any. |
|---|
|
| Expenses Paid, Amount |
$ 215
|
| Factors Affecting Performance [Text Block] |
What factors materially affected the Fund's performance over the last year? The sectors that contributed the most to the return of the underlying index for the reporting period were semiconductors & semiconductor equipment, metals & mining, and oil, gas & consumable fuels. Those that detracted the most were hotels, restaurants & leisure, IT services, and broadline retail. The holdings that contributed the most to the return of the underlying index were Taiwan Semiconductor Manufacturing Company, Ltd. ADR, ASE Technology Holdings ADR, and Gold Fields Ltd. ADR. Those that detracted the most were Infosys Ltd. ADR, JD.com, Inc. ADR, and HDFC Bank Ltd. ADR. The fund maintained a daily correlation of over 99% to its benchmark of -200% of the daily price movement of the S&P Emerging Markets 50 ADR Index. |
| Line Graph [Table Text Block] |
Table Summary | Inverse Emerging Markets 2x Strategy Fund (Class C) | MSCI World ex U.S. Index | S&P Emerging 50 ADR Index |
|---|
3/31/16 | $10,000 | $10,000 | $10,000 |
|---|
3/31/17 | $6,183 | $11,193 | $12,065 |
|---|
3/31/18 | $3,786 | $12,751 | $14,920 |
|---|
3/31/19 | $3,895 | $12,350 | $14,149 |
|---|
3/31/20 | $4,555 | $10,511 | $11,807 |
|---|
3/31/21 | $1,206 | $15,332 | $20,164 |
|---|
3/31/22 | $1,461 | $15,798 | $16,253 |
|---|
3/31/23 | $1,279 | $15,365 | $15,668 |
|---|
3/31/24 | $1,080 | $17,715 | $17,116 |
|---|
3/31/25 | $752 | $18,654 | $20,160 |
|---|
3/31/26 | $428 | $22,943 | $25,360 |
|---|
|
| Average Annual Return [Table Text Block] |
Table SummaryAverage Annual Total Returns | One Year | Five Years | Ten Years |
|---|
Class C (without CDSC) | -43.14% | -18.74% | -27.04% |
|---|
Class C (with CDSC) ‡ | -43.68% | -18.74% | -27.04% |
|---|
MSCI World ex U.S. Index | 22.99% | 8.40% | 8.66% |
|---|
S&P Emerging 50 ADR Index | 25.79% | 4.69% | 9.75% |
|---|
|
| AssetsNet |
$ 301,183
|
| Holdings Count | Holding |
5
|
| Advisory Fees Paid, Amount |
$ 1,608
|
| InvestmentCompanyPortfolioTurnover |
0.00%
|
| Additional Fund Statistics [Text Block] |
Fund Statistics as of March 31, 2026 - Net Assets$301,183
- Total Number of Portfolio Holdings5
- Portfolio Turnover Rate-%
- Total Advisory Fees Paid$1,608
|
| Holdings [Text Block] |
Holdings DiversificationFootnote Reference1 (% of Net Assets) as of March 31, 2026 Table SummaryValue | Value |
|---|
OTC Equity Index Swap Agreements Sold Short | -200.1% | |
| Material Fund Change [Text Block] |
|
| C000050427 |
|
| Shareholder Report [Line Items] |
|
| Fund Name |
Inverse Emerging Markets 2x Strategy Fund
|
| Class Name |
Class H
|
| Trading Symbol |
RYWYX
|
| Annual or Semi-Annual Statement [Text Block] |
This annual shareholder report contains important information about the Inverse Emerging Markets 2x Strategy Fund for the period from April 1, 2025 to March 31, 2026.
|
| Shareholder Report Annual or Semi-Annual |
Annual Shareholder Report
|
| Additional Information [Text Block] |
You can find additional information about the fund at GuggenheimInvestments.com/mutual-funds/literature. You can also request this information by contacting 800 820 0888 or services@guggenheiminvestments.com.
|
| Additional Information Phone Number |
800 820 0888
|
| Additional Information Email |
<span style="box-sizing: border-box; color: rgb(67, 67, 67); display: inline; flex-wrap: nowrap; font-size: 10.6667px; font-weight: 400; grid-area: auto; line-height: 12.8px; margin: 0px; overflow: visible; text-align: left; text-align-last: auto; white-space-collapse: preserve-breaks;">services@guggenheiminvestments.com</span>
|
| Additional Information Website |
<span style="box-sizing: border-box; color: rgb(67, 67, 67); display: inline; flex-wrap: nowrap; font-size: 10.6667px; font-weight: 400; grid-area: auto; line-height: 12.8px; margin: 0px; overflow: visible; text-align: left; text-align-last: auto; white-space-collapse: preserve-breaks;">GuggenheimInvestments.com/mutual-funds/literature</span>
|
| Expenses [Text Block] |
What were the Fund's costs for the last year? * Based on a hypothetical $10,000 investment Table SummaryClass | Costs of a $10,000 Investment | Costs Paid as a % of a $10,000 Investment |
|---|
Class H | $156 | 1.98% |
|---|
Table Summary* | Excludes expenses of the underlying funds in which the fund invests, if any. |
|---|
|
| Expenses Paid, Amount |
$ 156
|
| Factors Affecting Performance [Text Block] |
What factors materially affected the Fund's performance over the last year? The sectors that contributed the most to the return of the underlying index for the reporting period were semiconductors & semiconductor equipment, metals & mining, and oil, gas & consumable fuels. Those that detracted the most were hotels, restaurants & leisure, IT services, and broadline retail. The holdings that contributed the most to the return of the underlying index were Taiwan Semiconductor Manufacturing Company, Ltd. ADR, ASE Technology Holdings ADR, and Gold Fields Ltd. ADR. Those that detracted the most were Infosys Ltd. ADR, JD.com, Inc. ADR, and HDFC Bank Ltd. ADR. The fund maintained a daily correlation of over 99% to its benchmark of -200% of the daily price movement of the S&P Emerging Markets 50 ADR Index. |
| Line Graph [Table Text Block] |
Table Summary | Inverse Emerging Markets 2x Strategy Fund (Class H) | MSCI World ex U.S. Index | S&P Emerging 50 ADR Index |
|---|
3/31/16 | $10,000 | $10,000 | $10,000 |
|---|
3/31/17 | $6,220 | $11,193 | $12,065 |
|---|
3/31/18 | $3,828 | $12,751 | $14,920 |
|---|
3/31/19 | $3,976 | $12,350 | $14,149 |
|---|
3/31/20 | $4,628 | $10,511 | $11,807 |
|---|
3/31/21 | $1,251 | $15,332 | $20,164 |
|---|
3/31/22 | $1,513 | $15,798 | $16,253 |
|---|
3/31/23 | $1,343 | $15,365 | $15,668 |
|---|
3/31/24 | $1,138 | $17,715 | $17,116 |
|---|
3/31/25 | $798 | $18,654 | $20,160 |
|---|
3/31/26 | $461 | $22,943 | $25,360 |
|---|
|
| Average Annual Return [Table Text Block] |
Table SummaryAverage Annual Total Returns | One Year | Five Years | Ten Years |
|---|
Class H | -42.28% | -18.11% | -26.49% |
|---|
MSCI World ex U.S. Index | 22.99% | 8.40% | 8.66% |
|---|
S&P Emerging 50 ADR Index | 25.79% | 4.69% | 9.75% |
|---|
|
| AssetsNet |
$ 301,183
|
| Holdings Count | Holding |
5
|
| Advisory Fees Paid, Amount |
$ 1,608
|
| InvestmentCompanyPortfolioTurnover |
0.00%
|
| Additional Fund Statistics [Text Block] |
Fund Statistics as of March 31, 2026 - Net Assets$301,183
- Total Number of Portfolio Holdings5
- Portfolio Turnover Rate-%
- Total Advisory Fees Paid$1,608
|
| Holdings [Text Block] |
Holdings DiversificationFootnote Reference1 (% of Net Assets) as of March 31, 2026 Table SummaryValue | Value |
|---|
OTC Equity Index Swap Agreements Sold Short | -200.1% | |
| Material Fund Change [Text Block] |
|
| C000010347 |
|
| Shareholder Report [Line Items] |
|
| Fund Name |
Europe 1.25x Strategy Fund
|
| Class Name |
Class A
|
| Trading Symbol |
RYAEX
|
| Annual or Semi-Annual Statement [Text Block] |
This annual shareholder report contains important information about the Europe 1.25x Strategy Fund for the period from April 1, 2025 to March 31, 2026.
|
| Shareholder Report Annual or Semi-Annual |
Annual Shareholder Report
|
| Additional Information [Text Block] |
You can find additional information about the fund at GuggenheimInvestments.com/mutual-funds/literature. You can also request this information by contacting 800 820 0888 or services@guggenheiminvestments.com.
|
| Additional Information Phone Number |
800 820 0888
|
| Additional Information Email |
<span style="box-sizing: border-box; color: rgb(67, 67, 67); display: inline; flex-wrap: nowrap; font-size: 10.6667px; font-weight: 400; grid-area: auto; line-height: 12.8px; margin: 0px; overflow: visible; text-align: left; text-align-last: auto; white-space-collapse: preserve-breaks;">services@guggenheiminvestments.com</span>
|
| Additional Information Website |
<span style="box-sizing: border-box; color: rgb(67, 67, 67); display: inline; flex-wrap: nowrap; font-size: 10.6667px; font-weight: 400; grid-area: auto; line-height: 12.8px; margin: 0px; overflow: visible; text-align: left; text-align-last: auto; white-space-collapse: preserve-breaks;">GuggenheimInvestments.com/mutual-funds/literature</span>
|
| Expenses [Text Block] |
What were the Fund's costs for the last year? * Based on a hypothetical $10,000 investment Table SummaryClass | Costs of a $10,000 Investment | Costs Paid as a % of a $10,000 Investment |
|---|
Class A | $169 | 1.58% |
|---|
Table Summary* | Excludes expenses of the underlying funds in which the fund invests, if any. |
|---|
|
| Expenses Paid, Amount |
$ 169
|
| Factors Affecting Performance [Text Block] |
What factors materially affected the Fund's performance over the last year? The sectors that contributed the most to the return of the underlying index for the reporting period were financials, energy, and information technology. Consumer discretionary was the only sector to detract from performance. The holdings that contributed the most to the return of the underlying index for the reporting period were ASML Holdings NV, HSBC Holdings, PLC, and Novartis AG. Those that detracted the most were Novo Nordisk, Inc.—Class B, SAP, and RELX Plc. The fund maintained a daily correlation of over 98% to its benchmark of 125% of the daily price movement of the STOXX Europe 50 Index. |
| Line Graph [Table Text Block] |
Table Summary | Europe 1.25x Strategy Fund (Class A)‡ | MSCI World ex U.S. Index | STOXX Europe 50 Index |
|---|
3/31/16 | $9,525 | $10,000 | $10,000 |
|---|
3/31/17 | $10,461 | $11,193 | $12,138 |
|---|
3/31/18 | $11,666 | $12,751 | $12,024 |
|---|
3/31/19 | $11,395 | $12,350 | $12,446 |
|---|
3/31/20 | $9,318 | $10,511 | $10,711 |
|---|
3/31/21 | $13,361 | $15,332 | $15,463 |
|---|
3/31/22 | $14,295 | $15,798 | $15,783 |
|---|
3/31/23 | $15,079 | $15,365 | $18,050 |
|---|
3/31/24 | $17,243 | $17,715 | $21,969 |
|---|
3/31/25 | $17,942 | $18,654 | $23,426 |
|---|
3/31/26 | $20,393 | $22,943 | $25,643 |
|---|
|
| Average Annual Return [Table Text Block] |
Table SummaryAverage Annual Total Returns | One Year | Five Years | Ten Years |
|---|
Class A (without sales charge) | 13.66% | 8.83% | 7.91% |
|---|
Class A (with sales charge) ‡ | 8.26% | 7.77% | 7.39% |
|---|
MSCI World ex U.S. Index | 22.99% | 8.40% | 8.66% |
|---|
STOXX Europe 50 Index | 9.46% | 10.65% | 9.87% |
|---|
|
| AssetsNet |
$ 1,640,874
|
| Holdings Count | Holding |
56
|
| Advisory Fees Paid, Amount |
$ 22,893
|
| InvestmentCompanyPortfolioTurnover |
1775.00%
|
| Additional Fund Statistics [Text Block] |
Fund Statistics as of March 31, 2026 - Net Assets$1,640,874
- Total Number of Portfolio Holdings56
- Portfolio Turnover Rate1,775%
- Total Advisory Fees Paid$22,893
|
| Holdings [Text Block] |
Country CompositionFootnote Reference1 (% of Total Investments) as of March 31, 2026 Table SummaryUnited States | 58.1% |
|---|
France | 9.4% |
|---|
United Kingdom | 9.1% |
|---|
Germany | 7.2% |
|---|
Netherlands | 4.6% |
|---|
Spain | 3.4% |
|---|
Switzerland | 3.4% |
|---|
Italy | 2.1% |
|---|
Others | 2.7% |
|---|
Total Investments | 100.0% |
|---|
Holdings DiversificationFootnote Reference3 (% of Net Assets) as of March 31, 2026 Table SummaryValue | Value |
|---|
Other | 14.7% | Industrial | 7.1% | Financial | 9.9% | Consumer, Non-cyclical | 12.8% | Equity Futures Contracts Purchased | 79.2% | Currency Futures Contracts Purchased | 79.5% | |
| Largest Holdings [Text Block] |
10 Largest HoldingsFootnote Reference2 (% of Net Assets) as of March 31, 2026 Table SummaryGuggenheim Ultra Short Duration Fund — Institutional Class | 4.3% |
|---|
Guggenheim Strategy Fund II | 4.2% |
|---|
ASML Holding N.V. — Class G | 3.3% |
|---|
AstraZeneca plc | 1.9% |
|---|
Novartis AG, ADR | 1.8% |
|---|
HSBC Holdings plc, ADR | 1.8% |
|---|
Roche Holding AG, ADR | 1.8% |
|---|
Shell plc, ADR | 1.7% |
|---|
Nestle S.A., ADR | 1.6% |
|---|
TotalEnergies SE, ADR | 1.3% |
|---|
Total | 23.7% |
|---|
|
| Material Fund Change [Text Block] |
|
| C000010348 |
|
| Shareholder Report [Line Items] |
|
| Fund Name |
Europe 1.25x Strategy Fund
|
| Class Name |
Class C
|
| Trading Symbol |
RYCEX
|
| Annual or Semi-Annual Statement [Text Block] |
This annual shareholder report contains important information about the Europe 1.25x Strategy Fund for the period from April 1, 2025 to March 31, 2026.
|
| Shareholder Report Annual or Semi-Annual |
Annual Shareholder Report
|
| Additional Information [Text Block] |
You can find additional information about the fund at GuggenheimInvestments.com/mutual-funds/literature. You can also request this information by contacting 800 820 0888 or services@guggenheiminvestments.com.
|
| Additional Information Phone Number |
800 820 0888
|
| Additional Information Email |
<span style="box-sizing: border-box; color: rgb(67, 67, 67); display: inline; flex-wrap: nowrap; font-size: 10.6667px; font-weight: 400; grid-area: auto; line-height: 12.8px; margin: 0px; overflow: visible; text-align: left; text-align-last: auto; white-space-collapse: preserve-breaks;">services@guggenheiminvestments.com</span>
|
| Additional Information Website |
<span style="box-sizing: border-box; color: rgb(67, 67, 67); display: inline; flex-wrap: nowrap; font-size: 10.6667px; font-weight: 400; grid-area: auto; line-height: 12.8px; margin: 0px; overflow: visible; text-align: left; text-align-last: auto; white-space-collapse: preserve-breaks;">GuggenheimInvestments.com/mutual-funds/literature</span>
|
| Expenses [Text Block] |
What were the Fund's costs for the last year? * Based on a hypothetical $10,000 investment Table SummaryClass | Costs of a $10,000 Investment | Costs Paid as a % of a $10,000 Investment |
|---|
Class C | $251 | 2.36% |
|---|
Table Summary* | Excludes expenses of the underlying funds in which the fund invests, if any. |
|---|
|
| Expenses Paid, Amount |
$ 251
|
| Factors Affecting Performance [Text Block] |
What factors materially affected the Fund's performance over the last year? The sectors that contributed the most to the return of the underlying index for the reporting period were financials, energy, and information technology. Consumer discretionary was the only sector to detract from performance. The holdings that contributed the most to the return of the underlying index for the reporting period were ASML Holdings NV, HSBC Holdings, PLC, and Novartis AG. Those that detracted the most were Novo Nordisk, Inc.—Class B, SAP, and RELX Plc. The fund maintained a daily correlation of over 98% to its benchmark of 125% of the daily price movement of the STOXX Europe 50 Index. |
| Line Graph [Table Text Block] |
Table Summary | Europe 1.25x Strategy Fund (Class C) | MSCI World ex U.S. Index | STOXX Europe 50 Index |
|---|
3/31/16 | $10,000 | $10,000 | $10,000 |
|---|
3/31/17 | $10,909 | $11,193 | $12,138 |
|---|
3/31/18 | $12,076 | $12,751 | $12,024 |
|---|
3/31/19 | $11,709 | $12,350 | $12,446 |
|---|
3/31/20 | $9,511 | $10,511 | $10,711 |
|---|
3/31/21 | $13,499 | $15,332 | $15,463 |
|---|
3/31/22 | $14,338 | $15,798 | $15,783 |
|---|
3/31/23 | $14,943 | $15,365 | $18,050 |
|---|
3/31/24 | $16,958 | $17,715 | $21,969 |
|---|
3/31/25 | $17,511 | $18,654 | $23,426 |
|---|
3/31/26 | $19,759 | $22,943 | $25,643 |
|---|
|
| Average Annual Return [Table Text Block] |
Table SummaryAverage Annual Total Returns | One Year | Five Years | Ten Years |
|---|
Class C (without CDSC) | 12.84% | 7.92% | 7.05% |
|---|
Class C (with CDSC) ‡ | 11.84% | 7.92% | 7.05% |
|---|
MSCI World ex U.S. Index | 22.99% | 8.40% | 8.66% |
|---|
STOXX Europe 50 Index | 9.46% | 10.65% | 9.87% |
|---|
|
| AssetsNet |
$ 1,640,874
|
| Holdings Count | Holding |
56
|
| Advisory Fees Paid, Amount |
$ 22,893
|
| InvestmentCompanyPortfolioTurnover |
1775.00%
|
| Additional Fund Statistics [Text Block] |
Fund Statistics as of March 31, 2026 - Net Assets$1,640,874
- Total Number of Portfolio Holdings56
- Portfolio Turnover Rate1,775%
- Total Advisory Fees Paid$22,893
|
| Holdings [Text Block] |
Country CompositionFootnote Reference1 (% of Total Investments) as of March 31, 2026 Table SummaryUnited States | 58.1% |
|---|
France | 9.4% |
|---|
United Kingdom | 9.1% |
|---|
Germany | 7.2% |
|---|
Netherlands | 4.6% |
|---|
Spain | 3.4% |
|---|
Switzerland | 3.4% |
|---|
Italy | 2.1% |
|---|
Others | 2.7% |
|---|
Total Investments | 100.0% |
|---|
Holdings DiversificationFootnote Reference3 (% of Net Assets) as of March 31, 2026 Table SummaryValue | Value |
|---|
Other | 14.7% | Industrial | 7.1% | Financial | 9.9% | Consumer, Non-cyclical | 12.8% | Equity Futures Contracts Purchased | 79.2% | Currency Futures Contracts Purchased | 79.5% | |
| Largest Holdings [Text Block] |
10 Largest HoldingsFootnote Reference2 (% of Net Assets) as of March 31, 2026 Table SummaryGuggenheim Ultra Short Duration Fund — Institutional Class | 4.3% |
|---|
Guggenheim Strategy Fund II | 4.2% |
|---|
ASML Holding N.V. — Class G | 3.3% |
|---|
AstraZeneca plc | 1.9% |
|---|
Novartis AG, ADR | 1.8% |
|---|
HSBC Holdings plc, ADR | 1.8% |
|---|
Roche Holding AG, ADR | 1.8% |
|---|
Shell plc, ADR | 1.7% |
|---|
Nestle S.A., ADR | 1.6% |
|---|
TotalEnergies SE, ADR | 1.3% |
|---|
Total | 23.7% |
|---|
|
| Material Fund Change [Text Block] |
|
| C000010346 |
|
| Shareholder Report [Line Items] |
|
| Fund Name |
Europe 1.25x Strategy Fund
|
| Class Name |
Class H
|
| Trading Symbol |
RYEUX
|
| Annual or Semi-Annual Statement [Text Block] |
This annual shareholder report contains important information about the Europe 1.25x Strategy Fund for the period from April 1, 2025 to March 31, 2026.
|
| Shareholder Report Annual or Semi-Annual |
Annual Shareholder Report
|
| Additional Information [Text Block] |
You can find additional information about the fund at GuggenheimInvestments.com/mutual-funds/literature. You can also request this information by contacting 800 820 0888 or services@guggenheiminvestments.com.
|
| Additional Information Phone Number |
800 820 0888
|
| Additional Information Email |
<span style="box-sizing: border-box; color: rgb(67, 67, 67); display: inline; flex-wrap: nowrap; font-size: 10.6667px; font-weight: 400; grid-area: auto; line-height: 12.8px; margin: 0px; overflow: visible; text-align: left; text-align-last: auto; white-space-collapse: preserve-breaks;">services@guggenheiminvestments.com</span>
|
| Additional Information Website |
<span style="box-sizing: border-box; color: rgb(67, 67, 67); display: inline; flex-wrap: nowrap; font-size: 10.6667px; font-weight: 400; grid-area: auto; line-height: 12.8px; margin: 0px; overflow: visible; text-align: left; text-align-last: auto; white-space-collapse: preserve-breaks;">GuggenheimInvestments.com/mutual-funds/literature</span>
|
| Expenses [Text Block] |
What were the Fund's costs for the last year? * Based on a hypothetical $10,000 investment Table SummaryClass | Costs of a $10,000 Investment | Costs Paid as a % of a $10,000 Investment |
|---|
Class H | $170 | 1.59% |
|---|
Table Summary* | Excludes expenses of the underlying funds in which the fund invests, if any. |
|---|
|
| Expenses Paid, Amount |
$ 170
|
| Factors Affecting Performance [Text Block] |
What factors materially affected the Fund's performance over the last year? The sectors that contributed the most to the return of the underlying index for the reporting period were financials, energy, and information technology. Consumer discretionary was the only sector to detract from performance. The holdings that contributed the most to the return of the underlying index for the reporting period were ASML Holdings NV, HSBC Holdings, PLC, and Novartis AG. Those that detracted the most were Novo Nordisk, Inc.—Class B, SAP, and RELX Plc. The fund maintained a daily correlation of over 98% to its benchmark of 125% of the daily price movement of the STOXX Europe 50 Index. |
| Line Graph [Table Text Block] |
Table Summary | Europe 1.25x Strategy Fund (Class H) | MSCI World ex U.S. Index | STOXX Europe 50 Index |
|---|
3/31/16 | $10,000 | $10,000 | $10,000 |
|---|
3/31/17 | $11,006 | $11,193 | $12,138 |
|---|
3/31/18 | $12,278 | $12,751 | $12,024 |
|---|
3/31/19 | $11,998 | $12,350 | $12,446 |
|---|
3/31/20 | $9,807 | $10,511 | $10,711 |
|---|
3/31/21 | $14,019 | $15,332 | $15,463 |
|---|
3/31/22 | $15,004 | $15,798 | $15,783 |
|---|
3/31/23 | $15,756 | $15,365 | $18,050 |
|---|
3/31/24 | $18,013 | $17,715 | $21,969 |
|---|
3/31/25 | $18,747 | $18,654 | $23,426 |
|---|
3/31/26 | $21,362 | $22,943 | $25,643 |
|---|
|
| Average Annual Return [Table Text Block] |
Table SummaryAverage Annual Total Returns | One Year | Five Years | Ten Years |
|---|
Class H | 13.94% | 8.79% | 7.89% |
|---|
MSCI World ex U.S. Index | 22.99% | 8.40% | 8.66% |
|---|
STOXX Europe 50 Index | 9.46% | 10.65% | 9.87% |
|---|
|
| AssetsNet |
$ 1,640,874
|
| Holdings Count | Holding |
56
|
| Advisory Fees Paid, Amount |
$ 22,893
|
| InvestmentCompanyPortfolioTurnover |
1775.00%
|
| Additional Fund Statistics [Text Block] |
Fund Statistics as of March 31, 2026 - Net Assets$1,640,874
- Total Number of Portfolio Holdings56
- Portfolio Turnover Rate1,775%
- Total Advisory Fees Paid$22,893
|
| Holdings [Text Block] |
Country CompositionFootnote Reference1 (% of Total Investments) as of March 31, 2026 Table SummaryUnited States | 58.1% |
|---|
France | 9.4% |
|---|
United Kingdom | 9.1% |
|---|
Germany | 7.2% |
|---|
Netherlands | 4.6% |
|---|
Spain | 3.4% |
|---|
Switzerland | 3.4% |
|---|
Italy | 2.1% |
|---|
Others | 2.7% |
|---|
Total Investments | 100.0% |
|---|
Holdings DiversificationFootnote Reference3 (% of Net Assets) as of March 31, 2026 Table SummaryValue | Value |
|---|
Other | 14.7% | Industrial | 7.1% | Financial | 9.9% | Consumer, Non-cyclical | 12.8% | Equity Futures Contracts Purchased | 79.2% | Currency Futures Contracts Purchased | 79.5% | |
| Largest Holdings [Text Block] |
10 Largest HoldingsFootnote Reference2 (% of Net Assets) as of March 31, 2026 Table SummaryGuggenheim Ultra Short Duration Fund — Institutional Class | 4.3% |
|---|
Guggenheim Strategy Fund II | 4.2% |
|---|
ASML Holding N.V. — Class G | 3.3% |
|---|
AstraZeneca plc | 1.9% |
|---|
Novartis AG, ADR | 1.8% |
|---|
HSBC Holdings plc, ADR | 1.8% |
|---|
Roche Holding AG, ADR | 1.8% |
|---|
Shell plc, ADR | 1.7% |
|---|
Nestle S.A., ADR | 1.6% |
|---|
TotalEnergies SE, ADR | 1.3% |
|---|
Total | 23.7% |
|---|
|
| Material Fund Change [Text Block] |
|
| C000050428 |
|
| Shareholder Report [Line Items] |
|
| Fund Name |
Japan 2x Strategy Fund
|
| Class Name |
Class A
|
| Trading Symbol |
RYJSX
|
| Annual or Semi-Annual Statement [Text Block] |
This annual shareholder report contains important information about the Japan 2x Strategy Fund for the period from April 1, 2025 to March 31, 2026.
|
| Shareholder Report Annual or Semi-Annual |
Annual Shareholder Report
|
| Additional Information [Text Block] |
You can find additional information about the fund at GuggenheimInvestments.com/mutual-funds/literature. You can also request this information by contacting 800 820 0888 or services@guggenheiminvestments.com.
|
| Additional Information Phone Number |
800 820 0888
|
| Additional Information Email |
<span style="box-sizing: border-box; color: rgb(67, 67, 67); display: inline; flex-wrap: nowrap; font-size: 10.6667px; font-weight: 400; grid-area: auto; line-height: 12.8px; margin: 0px; overflow: visible; text-align: left; text-align-last: auto; white-space-collapse: preserve-breaks;">services@guggenheiminvestments.com</span>
|
| Additional Information Website |
<span style="box-sizing: border-box; color: rgb(67, 67, 67); display: inline; flex-wrap: nowrap; font-size: 10.6667px; font-weight: 400; grid-area: auto; line-height: 12.8px; margin: 0px; overflow: visible; text-align: left; text-align-last: auto; white-space-collapse: preserve-breaks;">GuggenheimInvestments.com/mutual-funds/literature</span>
|
| Expenses [Text Block] |
What were the Fund's costs for the last year? * Based on a hypothetical $10,000 investment Table SummaryClass | Costs of a $10,000 Investment | Costs Paid as a % of a $10,000 Investment |
|---|
Class A | $209 | 1.54% |
|---|
Table Summary* | Excludes expenses of the underlying funds in which the fund invests, if any. |
|---|
|
| Expenses Paid, Amount |
$ 209
|
| Factors Affecting Performance [Text Block] |
What factors materially affected the Fund's performance over the last year? The sectors that contributed the most to the return of the underlying index for the reporting period were information technology, industrials, and communication services. None detracted from index performance. The holdings that contributed the most to the return of the underlying index were Advantest Corp., SoftBank Group Corp., and Tokyo Electron Ltd. Those that detracted the most were Terumo Corp., Trend Micro, Inc., and Bandai Namco Holdings, Inc. The fund maintained a daily correlation of over 99% to its benchmark of 200% of the daily price movement of the fair value of the Nikkei-225 Stock Average Index. |
| Line Graph [Table Text Block] |
Table Summary | Japan 2x Strategy Fund (Class A)‡ | MSCI World ex U.S. Index | Nikkei-225 Stock Average Index |
|---|
3/31/16 | $9,525 | $10,000 | $10,000 |
|---|
3/31/17 | $12,359 | $11,193 | $11,283 |
|---|
3/31/18 | $17,047 | $12,751 | $12,802 |
|---|
3/31/19 | $15,038 | $12,350 | $12,654 |
|---|
3/31/20 | $12,008 | $10,511 | $11,288 |
|---|
3/31/21 | $25,569 | $15,332 | $17,411 |
|---|
3/31/22 | $18,167 | $15,798 | $16,601 |
|---|
3/31/23 | $14,908 | $15,365 | $16,733 |
|---|
3/31/24 | $21,518 | $17,715 | $24,089 |
|---|
3/31/25 | $15,907 | $18,654 | $21,253 |
|---|
3/31/26 | $27,323 | $22,943 | $30,470 |
|---|
|
| Average Annual Return [Table Text Block] |
Table SummaryAverage Annual Total Returns | One Year | Five Years | Ten Years |
|---|
Class A (without sales charge) | 71.76% | 1.33% | 11.11% |
|---|
Class A (with sales charge) ‡ | 63.62% | 0.36% | 10.57% |
|---|
MSCI World ex U.S. Index | 22.99% | 8.40% | 8.66% |
|---|
Nikkei-225 Stock Average Index | 43.37% | 11.84% | 11.79% |
|---|
|
| AssetsNet |
$ 1,697,494
|
| Holdings Count | Holding |
5
|
| Advisory Fees Paid, Amount |
$ 12,688
|
| InvestmentCompanyPortfolioTurnover |
0.00%
|
| Additional Fund Statistics [Text Block] |
Fund Statistics as of March 31, 2026 - Net Assets$1,697,494
- Total Number of Portfolio Holdings5
- Portfolio Turnover Rate-%
- Total Advisory Fees Paid$12,688
|
| Holdings [Text Block] |
Holdings DiversificationFootnote Reference1 (% of Net Assets) as of March 31, 2026 Table SummaryValue | Value |
|---|
Equity Futures Contracts Purchased | 200.2% | Currency Futures Contracts Purchased | 200.8% | |
| Material Fund Change [Text Block] |
|
| C000050429 |
|
| Shareholder Report [Line Items] |
|
| Fund Name |
Japan 2x Strategy Fund
|
| Class Name |
Class C
|
| Trading Symbol |
RYJTX
|
| Annual or Semi-Annual Statement [Text Block] |
This annual shareholder report contains important information about the Japan 2x Strategy Fund for the period from April 1, 2025 to March 31, 2026.
|
| Shareholder Report Annual or Semi-Annual |
Annual Shareholder Report
|
| Additional Information [Text Block] |
You can find additional information about the fund at GuggenheimInvestments.com/mutual-funds/literature. You can also request this information by contacting 800 820 0888 or services@guggenheiminvestments.com.
|
| Additional Information Phone Number |
800 820 0888
|
| Additional Information Email |
<span style="box-sizing: border-box; color: rgb(67, 67, 67); display: inline; flex-wrap: nowrap; font-size: 10.6667px; font-weight: 400; grid-area: auto; line-height: 12.8px; margin: 0px; overflow: visible; text-align: left; text-align-last: auto; white-space-collapse: preserve-breaks;">services@guggenheiminvestments.com</span>
|
| Additional Information Website |
<span style="box-sizing: border-box; color: rgb(67, 67, 67); display: inline; flex-wrap: nowrap; font-size: 10.6667px; font-weight: 400; grid-area: auto; line-height: 12.8px; margin: 0px; overflow: visible; text-align: left; text-align-last: auto; white-space-collapse: preserve-breaks;">GuggenheimInvestments.com/mutual-funds/literature</span>
|
| Expenses [Text Block] |
What were the Fund's costs for the last year? * Based on a hypothetical $10,000 investment Table SummaryClass | Costs of a $10,000 Investment | Costs Paid as a % of a $10,000 Investment |
|---|
Class C | $304 | 2.25% |
|---|
Table Summary* | Excludes expenses of the underlying funds in which the fund invests, if any. |
|---|
|
| Expenses Paid, Amount |
$ 304
|
| Factors Affecting Performance [Text Block] |
What factors materially affected the Fund's performance over the last year? The sectors that contributed the most to the return of the underlying index for the reporting period were information technology, industrials, and communication services. None detracted from index performance. The holdings that contributed the most to the return of the underlying index were Advantest Corp., SoftBank Group Corp., and Tokyo Electron Ltd. Those that detracted the most were Terumo Corp., Trend Micro, Inc., and Bandai Namco Holdings, Inc. The fund maintained a daily correlation of over 99% to its benchmark of 200% of the daily price movement of the fair value of the Nikkei-225 Stock Average Index. |
| Line Graph [Table Text Block] |
Table Summary | Japan 2x Strategy Fund (Class C) | MSCI World ex U.S. Index | Nikkei-225 Stock Average Index |
|---|
3/31/16 | $10,000 | $10,000 | $10,000 |
|---|
3/31/17 | $12,874 | $11,193 | $11,283 |
|---|
3/31/18 | $17,624 | $12,751 | $12,802 |
|---|
3/31/19 | $15,433 | $12,350 | $12,654 |
|---|
3/31/20 | $12,231 | $10,511 | $11,288 |
|---|
3/31/21 | $25,849 | $15,332 | $17,411 |
|---|
3/31/22 | $18,225 | $15,798 | $16,601 |
|---|
3/31/23 | $14,841 | $15,365 | $16,733 |
|---|
3/31/24 | $21,272 | $17,715 | $24,089 |
|---|
3/31/25 | $15,593 | $18,654 | $21,253 |
|---|
3/31/26 | $26,589 | $22,943 | $30,470 |
|---|
|
| Average Annual Return [Table Text Block] |
Table SummaryAverage Annual Total Returns | One Year | Five Years | Ten Years |
|---|
Class C (without CDSC) | 70.51% | 0.57% | 10.27% |
|---|
Class C (with CDSC) ‡ | 69.51% | 0.57% | 10.27% |
|---|
MSCI World ex U.S. Index | 22.99% | 8.40% | 8.66% |
|---|
Nikkei-225 Stock Average Index | 43.37% | 11.84% | 11.79% |
|---|
|
| AssetsNet |
$ 1,697,494
|
| Holdings Count | Holding |
5
|
| Advisory Fees Paid, Amount |
$ 12,688
|
| InvestmentCompanyPortfolioTurnover |
0.00%
|
| Additional Fund Statistics [Text Block] |
Fund Statistics as of March 31, 2026 - Net Assets$1,697,494
- Total Number of Portfolio Holdings5
- Portfolio Turnover Rate-%
- Total Advisory Fees Paid$12,688
|
| Holdings [Text Block] |
Holdings DiversificationFootnote Reference1 (% of Net Assets) as of March 31, 2026 Table SummaryValue | Value |
|---|
Equity Futures Contracts Purchased | 200.2% | Currency Futures Contracts Purchased | 200.8% | |
| Material Fund Change [Text Block] |
|
| C000050430 |
|
| Shareholder Report [Line Items] |
|
| Fund Name |
Japan 2x Strategy Fund
|
| Class Name |
Class H
|
| Trading Symbol |
RYJHX
|
| Annual or Semi-Annual Statement [Text Block] |
This annual shareholder report contains important information about the Japan 2x Strategy Fund for the period from April 1, 2025 to March 31, 2026.
|
| Shareholder Report Annual or Semi-Annual |
Annual Shareholder Report
|
| Additional Information [Text Block] |
You can find additional information about the fund at GuggenheimInvestments.com/mutual-funds/literature. You can also request this information by contacting 800 820 0888 or services@guggenheiminvestments.com.
|
| Additional Information Phone Number |
800 820 0888
|
| Additional Information Email |
<span style="box-sizing: border-box; color: rgb(67, 67, 67); display: inline; flex-wrap: nowrap; font-size: 10.6667px; font-weight: 400; grid-area: auto; line-height: 12.8px; margin: 0px; overflow: visible; text-align: left; text-align-last: auto; white-space-collapse: preserve-breaks;">services@guggenheiminvestments.com</span>
|
| Additional Information Website |
<span style="box-sizing: border-box; color: rgb(67, 67, 67); display: inline; flex-wrap: nowrap; font-size: 10.6667px; font-weight: 400; grid-area: auto; line-height: 12.8px; margin: 0px; overflow: visible; text-align: left; text-align-last: auto; white-space-collapse: preserve-breaks;">GuggenheimInvestments.com/mutual-funds/literature</span>
|
| Expenses [Text Block] |
What were the Fund's costs for the last year? * Based on a hypothetical $10,000 investment Table SummaryClass | Costs of a $10,000 Investment | Costs Paid as a % of a $10,000 Investment |
|---|
Class H | $208 | 1.53% |
|---|
Table Summary* | Excludes expenses of the underlying funds in which the fund invests, if any. |
|---|
|
| Expenses Paid, Amount |
$ 208
|
| Factors Affecting Performance [Text Block] |
What factors materially affected the Fund's performance over the last year? The sectors that contributed the most to the return of the underlying index for the reporting period were information technology, industrials, and communication services. None detracted from index performance. The holdings that contributed the most to the return of the underlying index were Advantest Corp., SoftBank Group Corp., and Tokyo Electron Ltd. Those that detracted the most were Terumo Corp., Trend Micro, Inc., and Bandai Namco Holdings, Inc. The fund maintained a daily correlation of over 99% to its benchmark of 200% of the daily price movement of the fair value of the Nikkei-225 Stock Average Index. |
| Line Graph [Table Text Block] |
Table Summary | Japan 2x Strategy Fund (Class H) | MSCI World ex U.S. Index | Nikkei-225 Stock Average Index |
|---|
3/31/16 | $10,000 | $10,000 | $10,000 |
|---|
3/31/17 | $13,008 | $11,193 | $11,283 |
|---|
3/31/18 | $17,944 | $12,751 | $12,802 |
|---|
3/31/19 | $15,833 | $12,350 | $12,654 |
|---|
3/31/20 | $12,639 | $10,511 | $11,288 |
|---|
3/31/21 | $26,914 | $15,332 | $17,411 |
|---|
3/31/22 | $19,123 | $15,798 | $16,601 |
|---|
3/31/23 | $15,691 | $15,365 | $16,733 |
|---|
3/31/24 | $22,648 | $17,715 | $24,089 |
|---|
3/31/25 | $16,744 | $18,654 | $21,253 |
|---|
3/31/26 | $28,759 | $22,943 | $30,470 |
|---|
|
| Average Annual Return [Table Text Block] |
Table SummaryAverage Annual Total Returns | One Year | Five Years | Ten Years |
|---|
Class H | 71.76% | 1.33% | 11.14% |
|---|
MSCI World ex U.S. Index | 22.99% | 8.40% | 8.66% |
|---|
Nikkei-225 Stock Average Index | 43.37% | 11.84% | 11.79% |
|---|
|
| AssetsNet |
$ 1,697,494
|
| Holdings Count | Holding |
5
|
| Advisory Fees Paid, Amount |
$ 12,688
|
| InvestmentCompanyPortfolioTurnover |
0.00%
|
| Additional Fund Statistics [Text Block] |
Fund Statistics as of March 31, 2026 - Net Assets$1,697,494
- Total Number of Portfolio Holdings5
- Portfolio Turnover Rate-%
- Total Advisory Fees Paid$12,688
|
| Holdings [Text Block] |
Holdings DiversificationFootnote Reference1 (% of Net Assets) as of March 31, 2026 Table SummaryValue | Value |
|---|
Equity Futures Contracts Purchased | 200.2% | Currency Futures Contracts Purchased | 200.8% | |
| Material Fund Change [Text Block] |
|
| C000010467 |
|
| Shareholder Report [Line Items] |
|
| Fund Name |
Strengthening Dollar 2x Strategy Fund
|
| Class Name |
Class A
|
| Trading Symbol |
RYSDX
|
| Annual or Semi-Annual Statement [Text Block] |
This annual shareholder report contains important information about the Strengthening Dollar 2x Strategy Fund for the period from April 1, 2025 to March 31, 2026.
|
| Shareholder Report Annual or Semi-Annual |
Annual Shareholder Report
|
| Additional Information [Text Block] |
You can find additional information about the fund at GuggenheimInvestments.com/mutual-funds/literature. You can also request this information by contacting 800 820 0888 or services@guggenheiminvestments.com.
|
| Additional Information Phone Number |
800 820 0888
|
| Additional Information Email |
<span style="box-sizing: border-box; color: rgb(67, 67, 67); display: inline; flex-wrap: nowrap; font-size: 10.6667px; font-weight: 400; grid-area: auto; line-height: 12.8px; margin: 0px; overflow: visible; text-align: left; text-align-last: auto; white-space-collapse: preserve-breaks;">services@guggenheiminvestments.com</span>
|
| Additional Information Website |
<span style="box-sizing: border-box; color: rgb(67, 67, 67); display: inline; flex-wrap: nowrap; font-size: 10.6667px; font-weight: 400; grid-area: auto; line-height: 12.8px; margin: 0px; overflow: visible; text-align: left; text-align-last: auto; white-space-collapse: preserve-breaks;">GuggenheimInvestments.com/mutual-funds/literature</span>
|
| Expenses [Text Block] |
What were the Fund's costs for the last year? * Based on a hypothetical $10,000 investment Table SummaryClass | Costs of a $10,000 Investment | Costs Paid as a % of a $10,000 Investment |
|---|
Class A | $189 | 1.94% |
|---|
Table Summary* | Excludes expenses of the underlying funds in which the fund invests, if any. |
|---|
|
| Expenses Paid, Amount |
$ 189
|
| Factors Affecting Performance [Text Block] |
What factors materially affected the Fund's performance over the last year? The Japanese yen contributed the most to the return of the underlying index for the reporting period. The euro, Swiss franc, and Canadian dollar detracted the most from the DXY. The fund maintained a daily correlation of over 98% to its benchmark of 200% of the daily price movement of the U.S. Dollar Index. |
| Line Graph [Table Text Block] |
Table Summary | Strengthening Dollar 2x Strategy Fund (Class A)‡ | Bloomberg U.S. Aggregate Bond Index | U.S. Dollar Index |
|---|
3/31/16 | $9,525 | $10,000 | $10,000 |
|---|
3/31/17 | $10,633 | $10,044 | $10,626 |
|---|
3/31/18 | $8,680 | $10,165 | $9,519 |
|---|
3/31/19 | $10,479 | $10,620 | $10,272 |
|---|
3/31/20 | $11,148 | $11,569 | $10,455 |
|---|
3/31/21 | $9,824 | $11,651 | $9,847 |
|---|
3/31/22 | $10,667 | $11,168 | $10,392 |
|---|
3/31/23 | $11,769 | $10,633 | $10,841 |
|---|
3/31/24 | $12,989 | $10,814 | $11,046 |
|---|
3/31/25 | $13,588 | $11,342 | $11,007 |
|---|
3/31/26 | $12,951 | $11,835 | $10,554 |
|---|
|
| Average Annual Return [Table Text Block] |
Table SummaryAverage Annual Total Returns | One Year | Five Years | Ten Years |
|---|
Class A (without sales charge) | -4.69% | 5.68% | 3.12% |
|---|
Class A (with sales charge) ‡ | -9.22% | 4.66% | 2.62% |
|---|
Bloomberg U.S. Aggregate Bond Index | 4.35% | 0.31% | 1.70% |
|---|
U.S. Dollar Index | -4.12% | 1.40% | 0.54% |
|---|
|
| AssetsNet |
$ 2,132,013
|
| Holdings Count | Holding |
4
|
| Advisory Fees Paid, Amount |
$ 16,942
|
| InvestmentCompanyPortfolioTurnover |
0.00%
|
| Additional Fund Statistics [Text Block] |
Fund Statistics as of March 31, 2026 - Net Assets$2,132,013
- Total Number of Portfolio Holdings4
- Portfolio Turnover Rate-%
- Total Advisory Fees Paid$16,942
|
| Holdings [Text Block] |
Holdings DiversificationFootnote Reference1 (% of Net Assets) as of March 31, 2026 Table SummaryValue | Value |
|---|
OTC Currency Index Swap Agreements | 64.1% | Currency Futures Contracts Purchased | 135.5% | |
| Material Fund Change [Text Block] |
|
| C000010468 |
|
| Shareholder Report [Line Items] |
|
| Fund Name |
Strengthening Dollar 2x Strategy Fund
|
| Class Name |
Class C
|
| Trading Symbol |
RYSJX
|
| Annual or Semi-Annual Statement [Text Block] |
This annual shareholder report contains important information about the Strengthening Dollar 2x Strategy Fund for the period from April 1, 2025 to March 31, 2026.
|
| Shareholder Report Annual or Semi-Annual |
Annual Shareholder Report
|
| Additional Information [Text Block] |
You can find additional information about the fund at GuggenheimInvestments.com/mutual-funds/literature. You can also request this information by contacting 800 820 0888 or services@guggenheiminvestments.com.
|
| Additional Information Phone Number |
800 820 0888
|
| Additional Information Email |
<span style="box-sizing: border-box; color: rgb(67, 67, 67); display: inline; flex-wrap: nowrap; font-size: 10.6667px; font-weight: 400; grid-area: auto; line-height: 12.8px; margin: 0px; overflow: visible; text-align: left; text-align-last: auto; white-space-collapse: preserve-breaks;">services@guggenheiminvestments.com</span>
|
| Additional Information Website |
<span style="box-sizing: border-box; color: rgb(67, 67, 67); display: inline; flex-wrap: nowrap; font-size: 10.6667px; font-weight: 400; grid-area: auto; line-height: 12.8px; margin: 0px; overflow: visible; text-align: left; text-align-last: auto; white-space-collapse: preserve-breaks;">GuggenheimInvestments.com/mutual-funds/literature</span>
|
| Expenses [Text Block] |
What were the Fund's costs for the last year? * Based on a hypothetical $10,000 investment Table SummaryClass | Costs of a $10,000 Investment | Costs Paid as a % of a $10,000 Investment |
|---|
Class C | $261 | 2.68% |
|---|
Table Summary* | Excludes expenses of the underlying funds in which the fund invests, if any. |
|---|
|
| Expenses Paid, Amount |
$ 261
|
| Factors Affecting Performance [Text Block] |
What factors materially affected the Fund's performance over the last year? The Japanese yen contributed the most to the return of the underlying index for the reporting period. The euro, Swiss franc, and Canadian dollar detracted the most from the DXY. The fund maintained a daily correlation of over 98% to its benchmark of 200% of the daily price movement of the U.S. Dollar Index. |
| Line Graph [Table Text Block] |
Table Summary | Strengthening Dollar 2x Strategy Fund (Class C) | Bloomberg U.S. Aggregate Bond Index | U.S. Dollar Index |
|---|
3/31/16 | $10,000 | $10,000 | $10,000 |
|---|
3/31/17 | $11,080 | $10,044 | $10,626 |
|---|
3/31/18 | $8,977 | $10,165 | $9,519 |
|---|
3/31/19 | $10,759 | $10,620 | $10,272 |
|---|
3/31/20 | $11,364 | $11,569 | $10,455 |
|---|
3/31/21 | $9,936 | $11,651 | $9,847 |
|---|
3/31/22 | $10,710 | $11,168 | $10,392 |
|---|
3/31/23 | $11,729 | $10,633 | $10,841 |
|---|
3/31/24 | $12,852 | $10,814 | $11,046 |
|---|
3/31/25 | $13,344 | $11,342 | $11,007 |
|---|
3/31/26 | $12,620 | $11,835 | $10,554 |
|---|
|
| Average Annual Return [Table Text Block] |
Table SummaryAverage Annual Total Returns | One Year | Five Years | Ten Years |
|---|
Class C (without CDSC) | -5.42% | 4.90% | 2.35% |
|---|
Class C (with CDSC) ‡ | -6.31% | 4.90% | 2.35% |
|---|
Bloomberg U.S. Aggregate Bond Index | 4.35% | 0.31% | 1.70% |
|---|
U.S. Dollar Index | -4.12% | 1.40% | 0.54% |
|---|
|
| AssetsNet |
$ 2,132,013
|
| Holdings Count | Holding |
4
|
| Advisory Fees Paid, Amount |
$ 16,942
|
| InvestmentCompanyPortfolioTurnover |
0.00%
|
| Additional Fund Statistics [Text Block] |
Fund Statistics as of March 31, 2026 - Net Assets$2,132,013
- Total Number of Portfolio Holdings4
- Portfolio Turnover Rate-%
- Total Advisory Fees Paid$16,942
|
| Holdings [Text Block] |
Holdings DiversificationFootnote Reference1 (% of Net Assets) as of March 31, 2026 Table SummaryValue | Value |
|---|
OTC Currency Index Swap Agreements | 64.1% | Currency Futures Contracts Purchased | 135.5% | |
| Material Fund Change [Text Block] |
|
| C000010466 |
|
| Shareholder Report [Line Items] |
|
| Fund Name |
Strengthening Dollar 2x Strategy Fund
|
| Class Name |
Class H
|
| Trading Symbol |
RYSBX
|
| Annual or Semi-Annual Statement [Text Block] |
This annual shareholder report contains important information about the Strengthening Dollar 2x Strategy Fund for the period from April 1, 2025 to March 31, 2026.
|
| Shareholder Report Annual or Semi-Annual |
Annual Shareholder Report
|
| Additional Information [Text Block] |
You can find additional information about the fund at GuggenheimInvestments.com/mutual-funds/literature. You can also request this information by contacting 800 820 0888 or services@guggenheiminvestments.com.
|
| Additional Information Phone Number |
800 820 0888
|
| Additional Information Email |
<span style="box-sizing: border-box; color: rgb(67, 67, 67); display: inline; flex-wrap: nowrap; font-size: 10.6667px; font-weight: 400; grid-area: auto; line-height: 12.8px; margin: 0px; overflow: visible; text-align: left; text-align-last: auto; white-space-collapse: preserve-breaks;">services@guggenheiminvestments.com</span>
|
| Additional Information Website |
<span style="box-sizing: border-box; color: rgb(67, 67, 67); display: inline; flex-wrap: nowrap; font-size: 10.6667px; font-weight: 400; grid-area: auto; line-height: 12.8px; margin: 0px; overflow: visible; text-align: left; text-align-last: auto; white-space-collapse: preserve-breaks;">GuggenheimInvestments.com/mutual-funds/literature</span>
|
| Expenses [Text Block] |
What were the Fund's costs for the last year? * Based on a hypothetical $10,000 investment Table SummaryClass | Costs of a $10,000 Investment | Costs Paid as a % of a $10,000 Investment |
|---|
Class H | $188 | 1.93% |
|---|
Table Summary* | Excludes expenses of the underlying funds in which the fund invests, if any. |
|---|
|
| Expenses Paid, Amount |
$ 188
|
| Factors Affecting Performance [Text Block] |
What factors materially affected the Fund's performance over the last year? The Japanese yen contributed the most to the return of the underlying index for the reporting period. The euro, Swiss franc, and Canadian dollar detracted the most from the DXY. The fund maintained a daily correlation of over 98% to its benchmark of 200% of the daily price movement of the U.S. Dollar Index. |
| Line Graph [Table Text Block] |
Table Summary | Strengthening Dollar 2x Strategy Fund (Class H) | Bloomberg U.S. Aggregate Bond Index | U.S. Dollar Index |
|---|
3/31/16 | $10,000 | $10,000 | $10,000 |
|---|
3/31/17 | $11,164 | $10,044 | $10,626 |
|---|
3/31/18 | $9,111 | $10,165 | $9,519 |
|---|
3/31/19 | $11,002 | $10,620 | $10,272 |
|---|
3/31/20 | $11,706 | $11,569 | $10,455 |
|---|
3/31/21 | $10,318 | $11,651 | $9,847 |
|---|
3/31/22 | $11,204 | $11,168 | $10,392 |
|---|
3/31/23 | $12,364 | $10,633 | $10,841 |
|---|
3/31/24 | $13,644 | $10,814 | $11,046 |
|---|
3/31/25 | $14,273 | $11,342 | $11,007 |
|---|
3/31/26 | $13,604 | $11,835 | $10,554 |
|---|
|
| Average Annual Return [Table Text Block] |
Table SummaryAverage Annual Total Returns | One Year | Five Years | Ten Years |
|---|
Class H | -4.69% | 5.69% | 3.13% |
|---|
Bloomberg U.S. Aggregate Bond Index | 4.35% | 0.31% | 1.70% |
|---|
U.S. Dollar Index | -4.12% | 1.40% | 0.54% |
|---|
|
| AssetsNet |
$ 2,132,013
|
| Holdings Count | Holding |
4
|
| Advisory Fees Paid, Amount |
$ 16,942
|
| InvestmentCompanyPortfolioTurnover |
0.00%
|
| Additional Fund Statistics [Text Block] |
Fund Statistics as of March 31, 2026 - Net Assets$2,132,013
- Total Number of Portfolio Holdings4
- Portfolio Turnover Rate-%
- Total Advisory Fees Paid$16,942
|
| Holdings [Text Block] |
Holdings DiversificationFootnote Reference1 (% of Net Assets) as of March 31, 2026 Table SummaryValue | Value |
|---|
OTC Currency Index Swap Agreements | 64.1% | Currency Futures Contracts Purchased | 135.5% | |
| Material Fund Change [Text Block] |
|
| C000010433 |
|
| Shareholder Report [Line Items] |
|
| Fund Name |
Weakening Dollar 2x Strategy Fund
|
| Class Name |
Class A
|
| Trading Symbol |
RYWDX
|
| Annual or Semi-Annual Statement [Text Block] |
This annual shareholder report contains important information about the Weakening Dollar 2x Strategy Fund for the period from April 1, 2025 to March 31, 2026.
|
| Shareholder Report Annual or Semi-Annual |
Annual Shareholder Report
|
| Additional Information [Text Block] |
You can find additional information about the fund at GuggenheimInvestments.com/mutual-funds/literature. You can also request this information by contacting 800 820 0888 or services@guggenheiminvestments.com.
|
| Additional Information Phone Number |
800 820 0888
|
| Additional Information Email |
<span style="box-sizing: border-box; color: rgb(67, 67, 67); display: inline; flex-wrap: nowrap; font-size: 10.6667px; font-weight: 400; grid-area: auto; line-height: 12.8px; margin: 0px; overflow: visible; text-align: left; text-align-last: auto; white-space-collapse: preserve-breaks;">services@guggenheiminvestments.com</span>
|
| Additional Information Website |
<span style="box-sizing: border-box; color: rgb(67, 67, 67); display: inline; flex-wrap: nowrap; font-size: 10.6667px; font-weight: 400; grid-area: auto; line-height: 12.8px; margin: 0px; overflow: visible; text-align: left; text-align-last: auto; white-space-collapse: preserve-breaks;">GuggenheimInvestments.com/mutual-funds/literature</span>
|
| Expenses [Text Block] |
What were the Fund's costs for the last year? * Based on a hypothetical $10,000 investment Table SummaryClass | Costs of a $10,000 Investment | Costs Paid as a % of a $10,000 Investment |
|---|
Class A | $199 | 1.93% |
|---|
Table Summary* | Excludes expenses of the underlying funds in which the fund invests, if any. |
|---|
|
| Expenses Paid, Amount |
$ 199
|
| Factors Affecting Performance [Text Block] |
What factors materially affected the Fund's performance over the last year? The Japanese yen contributed the most to the return of the underlying index for the reporting period. The euro, Swiss franc, and Canadian dollar detracted the most from the DXY. The fund maintained a daily correlation of over 98% to its benchmark of -200% of the daily price movement of the U.S. Dollar Index. |
| Line Graph [Table Text Block] |
Table Summary | Weakening Dollar 2x Strategy Fund (Class A)‡ | Bloomberg U.S. Aggregate Bond Index | U.S. Dollar Index |
|---|
3/31/16 | $9,525 | $10,000 | $10,000 |
|---|
3/31/17 | $8,218 | $10,044 | $10,626 |
|---|
3/31/18 | $9,822 | $10,165 | $9,519 |
|---|
3/31/19 | $8,060 | $10,620 | $10,272 |
|---|
3/31/20 | $7,340 | $11,569 | $10,455 |
|---|
3/31/21 | $8,097 | $11,651 | $9,847 |
|---|
3/31/22 | $7,050 | $11,168 | $10,392 |
|---|
3/31/23 | $6,223 | $10,633 | $10,841 |
|---|
3/31/24 | $5,933 | $10,814 | $11,046 |
|---|
3/31/25 | $5,918 | $11,342 | $11,007 |
|---|
3/31/26 | $6,270 | $11,835 | $10,554 |
|---|
|
| Average Annual Return [Table Text Block] |
Table SummaryAverage Annual Total Returns | One Year | Five Years | Ten Years |
|---|
Class A (without sales charge) | 5.94% | -4.99% | -4.09% |
|---|
Class A (with sales charge) ‡ | 0.91% | -5.91% | -4.56% |
|---|
Bloomberg U.S. Aggregate Bond Index | 4.35% | 0.31% | 1.70% |
|---|
U.S. Dollar Index | -4.12% | 1.40% | 0.54% |
|---|
|
| AssetsNet |
$ 1,008,652
|
| Holdings Count | Holding |
4
|
| Advisory Fees Paid, Amount |
$ 11,396
|
| InvestmentCompanyPortfolioTurnover |
0.00%
|
| Additional Fund Statistics [Text Block] |
Fund Statistics as of March 31, 2026 - Net Assets$1,008,652
- Total Number of Portfolio Holdings4
- Portfolio Turnover Rate-%
- Total Advisory Fees Paid$11,396
|
| Holdings [Text Block] |
Holdings DiversificationFootnote Reference1 (% of Net Assets) as of March 31, 2026 Table SummaryValue | Value |
|---|
Currency Futures Contracts Sold Short | -167.9% | OTC Currency Index Swap Agreements Sold Short | -34.6% | |
| Material Fund Change [Text Block] |
|
| C000010434 |
|
| Shareholder Report [Line Items] |
|
| Fund Name |
Weakening Dollar 2x Strategy Fund
|
| Class Name |
Class C
|
| Trading Symbol |
RYWJX
|
| Annual or Semi-Annual Statement [Text Block] |
This annual shareholder report contains important information about the Weakening Dollar 2x Strategy Fund for the period from April 1, 2025 to March 31, 2026.
|
| Shareholder Report Annual or Semi-Annual |
Annual Shareholder Report
|
| Additional Information [Text Block] |
You can find additional information about the fund at GuggenheimInvestments.com/mutual-funds/literature. You can also request this information by contacting 800 820 0888 or services@guggenheiminvestments.com.
|
| Additional Information Phone Number |
800 820 0888
|
| Additional Information Email |
<span style="box-sizing: border-box; color: rgb(67, 67, 67); display: inline; flex-wrap: nowrap; font-size: 10.6667px; font-weight: 400; grid-area: auto; line-height: 12.8px; margin: 0px; overflow: visible; text-align: left; text-align-last: auto; white-space-collapse: preserve-breaks;">services@guggenheiminvestments.com</span>
|
| Additional Information Website |
<span style="box-sizing: border-box; color: rgb(67, 67, 67); display: inline; flex-wrap: nowrap; font-size: 10.6667px; font-weight: 400; grid-area: auto; line-height: 12.8px; margin: 0px; overflow: visible; text-align: left; text-align-last: auto; white-space-collapse: preserve-breaks;">GuggenheimInvestments.com/mutual-funds/literature</span>
|
| Expenses [Text Block] |
What were the Fund's costs for the last year? * Based on a hypothetical $10,000 investment Table SummaryClass | Costs of a $10,000 Investment | Costs Paid as a % of a $10,000 Investment |
|---|
Class C | $275 | 2.68% |
|---|
Table Summary* | Excludes expenses of the underlying funds in which the fund invests, if any. |
|---|
|
| Expenses Paid, Amount |
$ 275
|
| Factors Affecting Performance [Text Block] |
What factors materially affected the Fund's performance over the last year? The Japanese yen contributed the most to the return of the underlying index for the reporting period. The euro, Swiss franc, and Canadian dollar detracted the most from the DXY. The fund maintained a daily correlation of over 98% to its benchmark of -200% of the daily price movement of the U.S. Dollar Index. |
| Line Graph [Table Text Block] |
Table Summary | Weakening Dollar 2x Strategy Fund (Class C) | Bloomberg U.S. Aggregate Bond Index | U.S. Dollar Index |
|---|
3/31/16 | $10,000 | $10,000 | $10,000 |
|---|
3/31/17 | $8,561 | $10,044 | $10,626 |
|---|
3/31/18 | $10,157 | $10,165 | $9,519 |
|---|
3/31/19 | $8,274 | $10,620 | $10,272 |
|---|
3/31/20 | $7,475 | $11,569 | $10,455 |
|---|
3/31/21 | $8,185 | $11,651 | $9,847 |
|---|
3/31/22 | $7,073 | $11,168 | $10,392 |
|---|
3/31/23 | $6,198 | $10,633 | $10,841 |
|---|
3/31/24 | $5,856 | $10,814 | $11,046 |
|---|
3/31/25 | $5,789 | $11,342 | $11,007 |
|---|
3/31/26 | $6,086 | $11,835 | $10,554 |
|---|
|
| Average Annual Return [Table Text Block] |
Table SummaryAverage Annual Total Returns | One Year | Five Years | Ten Years |
|---|
Class C (without CDSC) | 5.14% | -5.75% | -4.85% |
|---|
Class C (with CDSC) ‡ | 4.14% | -5.75% | -4.85% |
|---|
Bloomberg U.S. Aggregate Bond Index | 4.35% | 0.31% | 1.70% |
|---|
U.S. Dollar Index | -4.12% | 1.40% | 0.54% |
|---|
|
| AssetsNet |
$ 1,008,652
|
| Holdings Count | Holding |
4
|
| Advisory Fees Paid, Amount |
$ 11,396
|
| InvestmentCompanyPortfolioTurnover |
0.00%
|
| Additional Fund Statistics [Text Block] |
Fund Statistics as of March 31, 2026 - Net Assets$1,008,652
- Total Number of Portfolio Holdings4
- Portfolio Turnover Rate-%
- Total Advisory Fees Paid$11,396
|
| Holdings [Text Block] |
Holdings DiversificationFootnote Reference1 (% of Net Assets) as of March 31, 2026 Table SummaryValue | Value |
|---|
Currency Futures Contracts Sold Short | -167.9% | OTC Currency Index Swap Agreements Sold Short | -34.6% | |
| Material Fund Change [Text Block] |
|
| C000010432 |
|
| Shareholder Report [Line Items] |
|
| Fund Name |
Weakening Dollar 2x Strategy Fund
|
| Class Name |
Class H
|
| Trading Symbol |
RYWBX
|
| Annual or Semi-Annual Statement [Text Block] |
This annual shareholder report contains important information about the Weakening Dollar 2x Strategy Fund for the period from April 1, 2025 to March 31, 2026.
|
| Shareholder Report Annual or Semi-Annual |
Annual Shareholder Report
|
| Additional Information [Text Block] |
You can find additional information about the fund at GuggenheimInvestments.com/mutual-funds/literature. You can also request this information by contacting 800 820 0888 or services@guggenheiminvestments.com.
|
| Additional Information Phone Number |
800 820 0888
|
| Additional Information Email |
<span style="box-sizing: border-box; color: rgb(67, 67, 67); display: inline; flex-wrap: nowrap; font-size: 10.6667px; font-weight: 400; grid-area: auto; line-height: 12.8px; margin: 0px; overflow: visible; text-align: left; text-align-last: auto; white-space-collapse: preserve-breaks;">services@guggenheiminvestments.com</span>
|
| Additional Information Website |
<span style="box-sizing: border-box; color: rgb(67, 67, 67); display: inline; flex-wrap: nowrap; font-size: 10.6667px; font-weight: 400; grid-area: auto; line-height: 12.8px; margin: 0px; overflow: visible; text-align: left; text-align-last: auto; white-space-collapse: preserve-breaks;">GuggenheimInvestments.com/mutual-funds/literature</span>
|
| Expenses [Text Block] |
What were the Fund's costs for the last year? * Based on a hypothetical $10,000 investment Table SummaryClass | Costs of a $10,000 Investment | Costs Paid as a % of a $10,000 Investment |
|---|
Class H | $199 | 1.93% |
|---|
Table Summary* | Excludes expenses of the underlying funds in which the fund invests, if any. |
|---|
|
| Expenses Paid, Amount |
$ 199
|
| Factors Affecting Performance [Text Block] |
What factors materially affected the Fund's performance over the last year? The Japanese yen contributed the most to the return of the underlying index for the reporting period. The euro, Swiss franc, and Canadian dollar detracted the most from the DXY. The fund maintained a daily correlation of over 98% to its benchmark of -200% of the daily price movement of the U.S. Dollar Index. |
| Line Graph [Table Text Block] |
Table Summary | Weakening Dollar 2x Strategy Fund (Class H) | Bloomberg U.S. Aggregate Bond Index | U.S. Dollar Index |
|---|
3/31/16 | $10,000 | $10,000 | $10,000 |
|---|
3/31/17 | $8,627 | $10,044 | $10,626 |
|---|
3/31/18 | $10,314 | $10,165 | $9,519 |
|---|
3/31/19 | $8,462 | $10,620 | $10,272 |
|---|
3/31/20 | $7,702 | $11,569 | $10,455 |
|---|
3/31/21 | $8,495 | $11,651 | $9,847 |
|---|
3/31/22 | $7,397 | $11,168 | $10,392 |
|---|
3/31/23 | $6,528 | $10,633 | $10,841 |
|---|
3/31/24 | $6,225 | $10,814 | $11,046 |
|---|
3/31/25 | $6,210 | $11,342 | $11,007 |
|---|
3/31/26 | $6,579 | $11,835 | $10,554 |
|---|
|
| Average Annual Return [Table Text Block] |
Table SummaryAverage Annual Total Returns | One Year | Five Years | Ten Years |
|---|
Class H | 5.93% | -4.98% | -4.10% |
|---|
Bloomberg U.S. Aggregate Bond Index | 4.35% | 0.31% | 1.70% |
|---|
U.S. Dollar Index | -4.12% | 1.40% | 0.54% |
|---|
|
| AssetsNet |
$ 1,008,652
|
| Holdings Count | Holding |
4
|
| Advisory Fees Paid, Amount |
$ 11,396
|
| InvestmentCompanyPortfolioTurnover |
0.00%
|
| Additional Fund Statistics [Text Block] |
Fund Statistics as of March 31, 2026 - Net Assets$1,008,652
- Total Number of Portfolio Holdings4
- Portfolio Turnover Rate-%
- Total Advisory Fees Paid$11,396
|
| Holdings [Text Block] |
Holdings DiversificationFootnote Reference1 (% of Net Assets) as of March 31, 2026 Table SummaryValue | Value |
|---|
Currency Futures Contracts Sold Short | -167.9% | OTC Currency Index Swap Agreements Sold Short | -34.6% | |
| Material Fund Change [Text Block] |
|
| C000113321 |
|
| Shareholder Report [Line Items] |
|
| Fund Name |
U.S. Government Money Market Fund
|
| Class Name |
Money Market Class
|
| Trading Symbol |
RYFXX
|
| Annual or Semi-Annual Statement [Text Block] |
This annual shareholder report contains important information about the U.S. Government Money Market Fund for the period from April 1, 2025 to March 31, 2026.
|
| Shareholder Report Annual or Semi-Annual |
Annual Shareholder Report
|
| Additional Information [Text Block] |
You can find additional information about the fund at GuggenheimInvestments.com/mutual-funds/literature. You can also request this information by contacting 800 820 0888 or services@guggenheiminvestments.com.
|
| Additional Information Phone Number |
800 820 0888
|
| Additional Information Email |
<span style="box-sizing: border-box; color: rgb(67, 67, 67); display: inline; flex-wrap: nowrap; font-size: 10.6667px; font-weight: 400; grid-area: auto; line-height: 12.8px; margin: 0px; overflow: visible; text-align: left; text-align-last: auto; white-space-collapse: preserve-breaks;">services@guggenheiminvestments.com</span>
|
| Additional Information Website |
<span style="box-sizing: border-box; color: rgb(67, 67, 67); display: inline; flex-wrap: nowrap; font-size: 10.6667px; font-weight: 400; grid-area: auto; line-height: 12.8px; margin: 0px; overflow: visible; text-align: left; text-align-last: auto; white-space-collapse: preserve-breaks;">GuggenheimInvestments.com/mutual-funds/literature</span>
|
| Expenses [Text Block] |
What were the Fund's costs for the last year? * Based on a hypothetical $10,000 investment Table SummaryClass | Costs of a $10,000 Investment | Costs Paid as a % of a $10,000 Investment |
|---|
Money Market Class | $107 | 1.05% |
|---|
Table Summary* | Excludes expenses of the underlying funds in which the fund invests, if any. |
|---|
|
| Expenses Paid, Amount |
$ 107
|
| Factors Affecting Performance [Text Block] |
What factors materially affected the Fund's performance over the last year? During the reporting period, the U.S. Federal Open Market Committee ("FOMC") lowered the federal funds target range by 75 basis points as job gains slowed while inflation remained above the Fed’s target. One basis point is equal to 0.01%. In Q3 and Q4 of 2025, downside risks to employment resulted in the FOMC lowering the target range for the federal funds by 25 basis points three times to the 3.5-3.75 percent range. During Q1 2026 the unemployment rate looked to be stabilizing but recent geopolitical events have added some economic uncertainty to the market. By the end of the reporting period, markets were not expecting any further cuts to the Federal Fund’s rate through the remainder of 2026. |
| Average Annual Return [Table Text Block] |
Table SummaryAverage Annual Total Returns | One Year | Five Years | Ten Years |
|---|
Money Market Class | 3.10% | 2.64% | 1.55% |
|---|
|
| AssetsNet |
$ 341,345,973
|
| Holdings Count | Holding |
24
|
| Advisory Fees Paid, Amount |
$ 1,306,036
|
| InvestmentCompanyPortfolioTurnover |
0.00%
|
| Additional Fund Statistics [Text Block] |
Fund Statistics as of March 31, 2026 - Net Assets$341,345,973
- Total Number of Portfolio Holdings24
- Portfolio Turnover Rate-%
- Total Advisory Fees Paid$1,306,036
|
| Holdings [Text Block] |
Holdings DiversificationFootnote Reference1 (% of Net Assets) as of March 31, 2026 Table SummaryValue | Value |
|---|
Freddie Mac - Federal Agency Discount Notes | 1.6% | Farmer Mac - Federal Agency Notes | 2.9% | Federal Farm Credit Bank - Federal Agency Discount Notes | 2.9% | Federal Home Loan Bank - Federal Agency Notes | 5.4% | Federal Farm Credit Bank - Federal Agency Notes | 8.7% | Federal Home Loan Bank - Federal Agency Discount Notes | 20.4% | U.S. Treasury Bills | 23.3% | Repurchase Agreements | 25.6% | |
| Material Fund Change [Text Block] |
|