Shareholder Report
Mar. 31, 2026
USD ($)
$ / shares
WHAT WERE THE FUND COSTS FOR THE PAST YEAR? (based on a hypothetical $10,000 investment)
|
Fund Name
|
Costs of a $10,000 investment
|
Costs paid as a percentage of a $10,000 investment*
|
|
STF Tactical Growth & Income ETF
|
$70
|
0.65%
|
HOW DID THE FUND PERFORM LAST YEAR AND WHAT AFFECTED ITS PERFORMANCE?
During the fiscal year ending March 31, 2026, the STF Tactical Growth ETF (the “Fund”) returned 19.80% (net asset value (“NAV”)) compared to its benchmark index, a blended return of 60% S&P 500 Total Return Index (SPXT) and 40% Bloomberg US Aggregate Bond Index (LBUSTRUU), 12.35%.
The top contributing equity holdings during the reporting period were once again focused on AI and technology growth stories around supply channel. These equities were: Western Digital Corp., Seagate Technology, Micron Technology, Intel Corp, Advanced Micro Devices which all outpaced NVIDIA Corp. Conversely, the largest detractors were Atlassian Corp., Strategy Inc, CoStar Group Inc, Adobe Inc, and PayPal Holdings Inc. The Fund continues to hold these securities as they are reflective of the growth equity profile. The rotational aspect of these names supports a consistent growth profile while offering diversification.
The fund invests in publicly listed equities which exhibit a growth profile, which has enjoyed multiple calendar years of +20% returns since inception. The equity growth profile has been the beneficiary of two dominate themes in global markets: US economic exceptionalism and tech/AI trade dominance. In 2025, just under half of the index’s total gains came from Nvidia and Broadcom, who also happened to have the highest annual returns of any full-time component. Q1 2026, much like Q1 2025, saw a sharp reversal of those trends. This year was the conflict in Iran whereas in 2025 it was uncertainty around US tariff threats. The selloffs in US stocks once again rattled markets despite US listed equities, once again, leading stock gains globally.
TUGN has been fully allocated to growth stocks over the past year as technical analysis has shown levels remained above long-term moving averages.
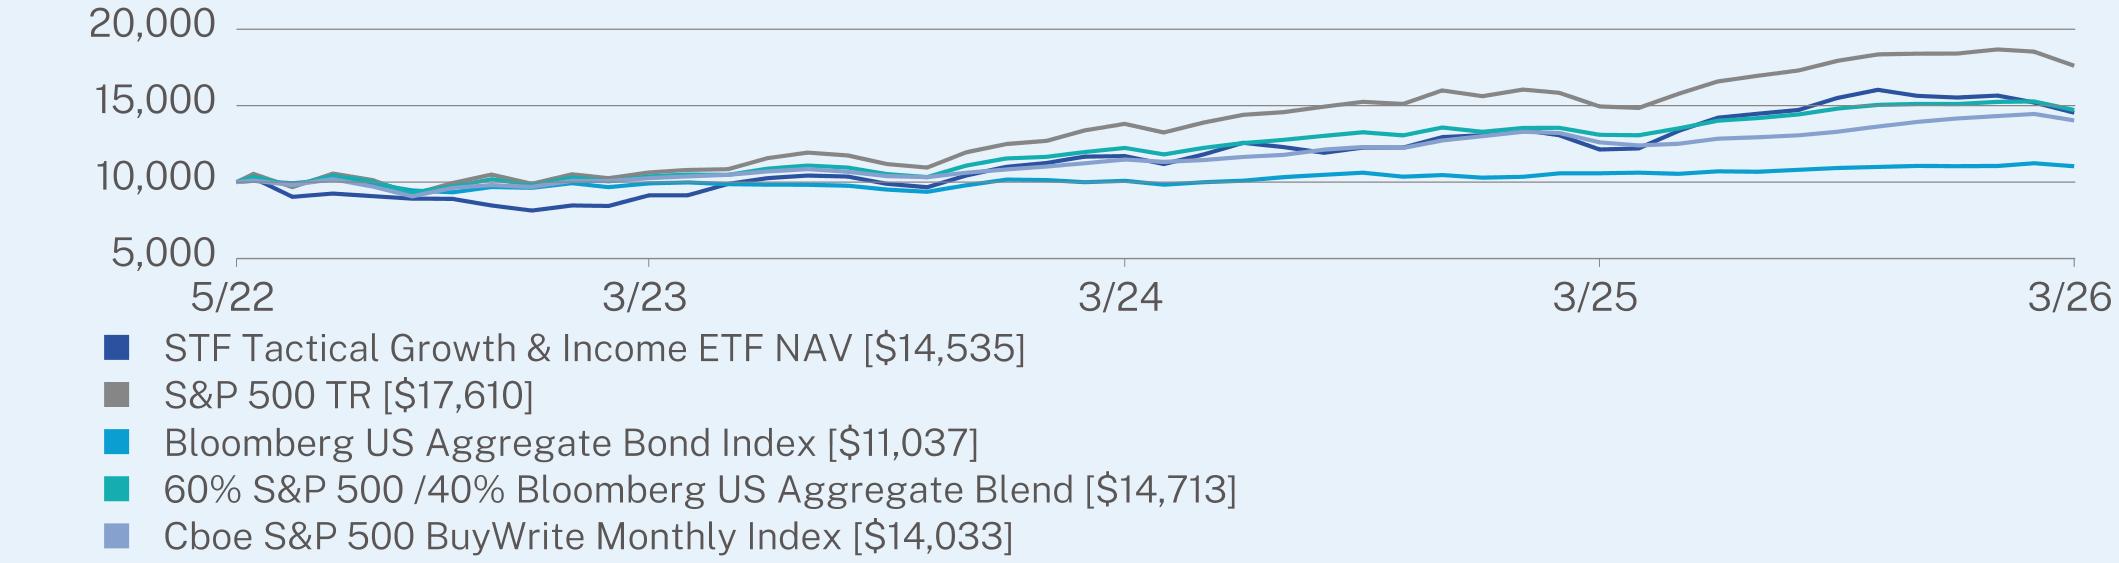
ANNUAL AVERAGE TOTAL RETURN (%)
|
|
1 Year
|
Since Inception
(05/18/2022) |
|
STF Tactical Growth & Income ETF NAV
|
19.80
|
10.15
|
|
S&P 500 TR
|
17.80
|
15.75
|
|
Bloomberg US Aggregate Bond Index
|
4.35
|
2.58
|
|
60% S&P 500 /40% Bloomberg US Aggregate Blend
|
12.35
|
10.50
|
|
Cboe S&P 500 BuyWrite Monthly Index
|
11.35
|
9.15
|
Visit https://www.sheltoncap.com/tugn/ for more recent performance information.
KEY FUND STATISTICS (as of March 31, 2026)
|
Net Assets
|
$60,852,505
|
|
Number of Holdings
|
101
|
|
Net Advisory Fee
|
$414,112
|
|
Portfolio Turnover
|
15%
|
|
30-Day SEC Yield
|
0.05%
|
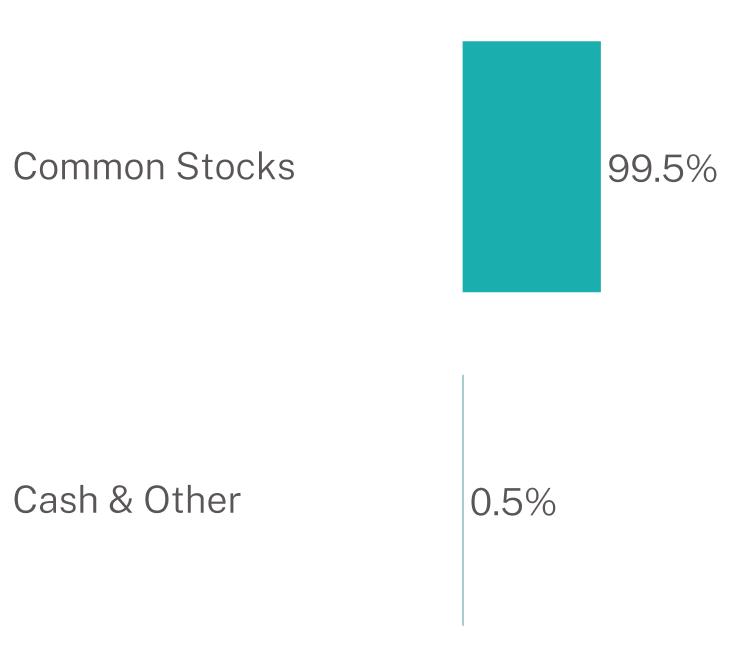
WHAT DID THE FUND INVEST IN? (as of March 31, 2026)
|
Top 10 Issuers
|
(%)
|
|
NVIDIA Corp.
|
8.5%
|
|
Apple, Inc.
|
7.4%
|
|
Alphabet, Inc.
|
6.4%
|
|
Microsoft Corp.
|
5.4%
|
|
Amazon.com, Inc.
|
4.2%
|
|
Meta Platforms, Inc.
|
3.6%
|
|
Tesla, Inc.
|
3.5%
|
|
Walmart, Inc.
|
3.4%
|
|
Broadcom, Inc.
|
3.1%
|
|
Costco Wholesale Corp.
|
2.6%
|
|
Top Sectors
|
(%)
|
|
Manufacturing
|
51.0%
|
|
Information
|
21.0%
|
|
Retail Trade
|
11.9%
|
|
Professional, Scientific, and Technical Services
|
9.3%
|
|
Administrative and Support and Waste Management and Remediation Services
|
1.8%
|
|
Utilities
|
1.5%
|
|
Accommodation and Food Services
|
1.1%
|
|
Transportation and Warehousing
|
0.7%
|
|
Wholesale Trade
|
0.5%
|
|
Cash & Other
|
1.2%
|
Security Type Breakdown (%)
Changes to Fund’s Investment Adviser:
Shelton Capital Management became the investment advisor of STF Tactical Growth ETF (TUG) and the STF Tactical Growth & Income ETF (TUGN) on March 30, 2026.
MANAGED DISTRIBUTIONS
TUGN seeks to distribute 1% of its net asset value (NAV) on a monthly basis. As a result of these monthly distributions, a portion may be classified as return of capital at fiscal year end.
WHAT WERE THE FUND COSTS FOR THE PAST YEAR? (based on a hypothetical $10,000 investment)
|
Fund Name
|
Costs of a $10,000 investment
|
Costs paid as a percentage of a $10,000 investment*
|
|
STF Tactical Growth ETF
|
$71
|
0.65%
|
HOW DID THE FUND PERFORM LAST YEAR AND WHAT AFFECTED ITS PERFORMANCE?
During the fiscal year ending March 31, 2026, the STF Tactical Growth ETF (the “Fund”) returned 22.24% (net asset value (“NAV”)) compared to its benchmark index, a blended return of 60% S&P 500 Total Return Index (SPXT) and 40% Bloomberg US Aggregate Bond Index (LBUSTRUU), 12.35%.
The top contributing equity holdings during the reporting period were once again focused on AI and technology growth stories around supply channel. These equities were: Western Digital Corp., Seagate Technology, Micron Technology, Intel Corp, and Advanced Micro Devices which all outpaced NVIDIA Corp. Conversely, the largest detractors were Atlassian Corp., Strategy Inc, CoStar Group Inc, Adobe Inc, and PayPal Holdings Inc. The Fund continues to hold these securities as they are reflective of the growth equity profile. The rotational aspect of these names supports a consistent growth profile while offering diversification.
The fund invests in publicly listed equities which exhibit a growth profile, which has enjoyed multiple calendar years of +20% returns since inception. The equity growth profile has been the beneficiary of two dominate themes in global markets: US economic exceptionalism and tech/AI trade dominance. In 2025, just under half of the index’s total gains came from Nvidia and Broadcom, who also happened to have the highest annual returns of any full-time component. Q1 2026, much like Q1 2025, saw a sharp reversal of those trends. This year was the conflict in Iran whereas in 2025 it was uncertainty around US tariff threats. The selloffs in US stocks once again rattled markets despite US listed equities, once again, leading stock gains globally.
TUG has been fully allocated to growth stocks over the past year as technical analysis has shown levels remained above long-term moving averages.
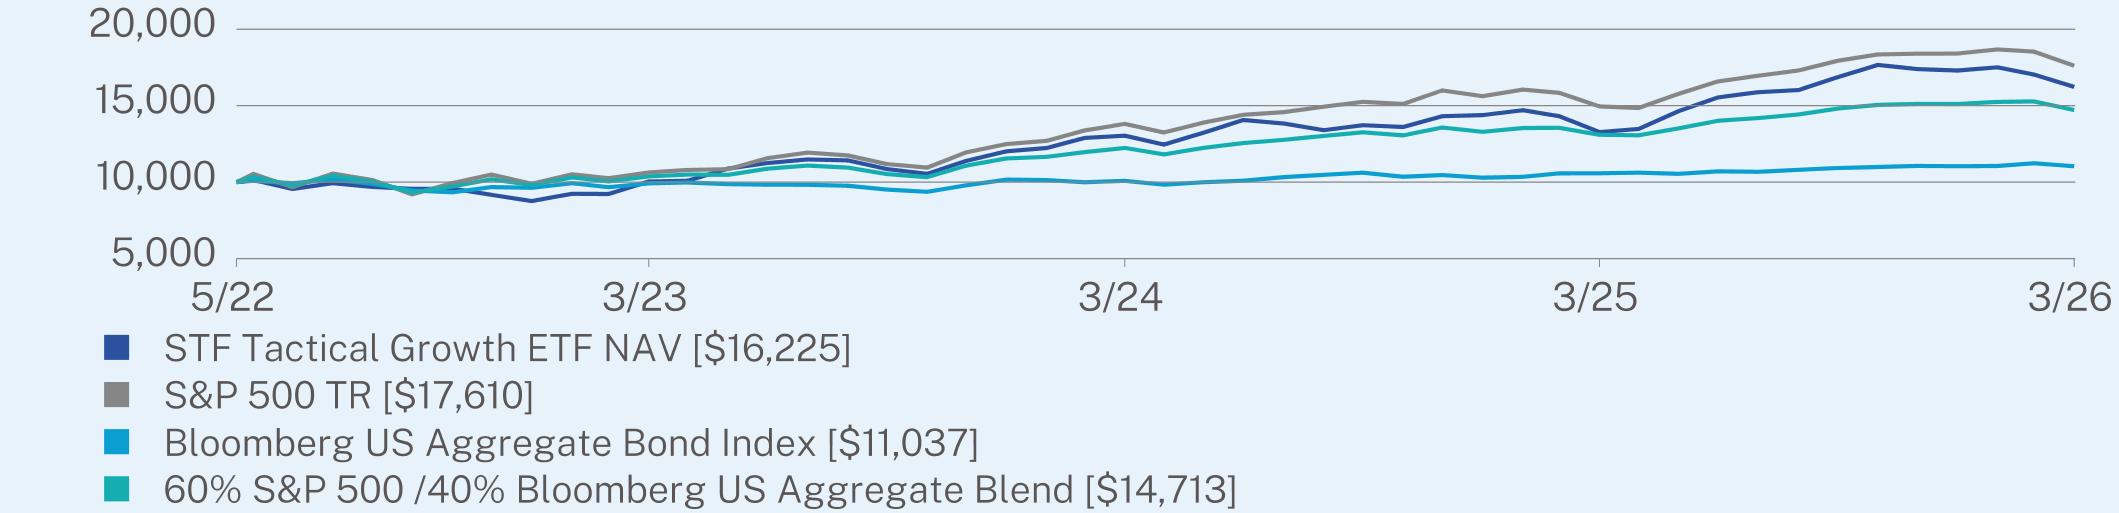
ANNUAL AVERAGE TOTAL RETURN (%)
|
|
1 Year
|
Since Inception
(05/18/2022) |
|
STF Tactical Growth ETF NAV
|
22.24
|
13.33
|
|
S&P 500 TR
|
17.80
|
15.75
|
|
Bloomberg US Aggregate Bond Index
|
4.35
|
2.58
|
|
60% S&P 500 /40% Bloomberg US Aggregate Blend
|
12.35
|
10.50
|
Visit https://www.sheltoncap.com/tug/ for more recent performance information.
KEY FUND STATISTICS (as of March 31, 2026)
|
Net Assets
|
$29,774,718
|
|
Number of Holdings
|
101
|
|
Net Advisory Fee
|
$784,930
|
|
Portfolio Turnover
|
4%
|
|
30-Day SEC Yield
|
-0.01%
|
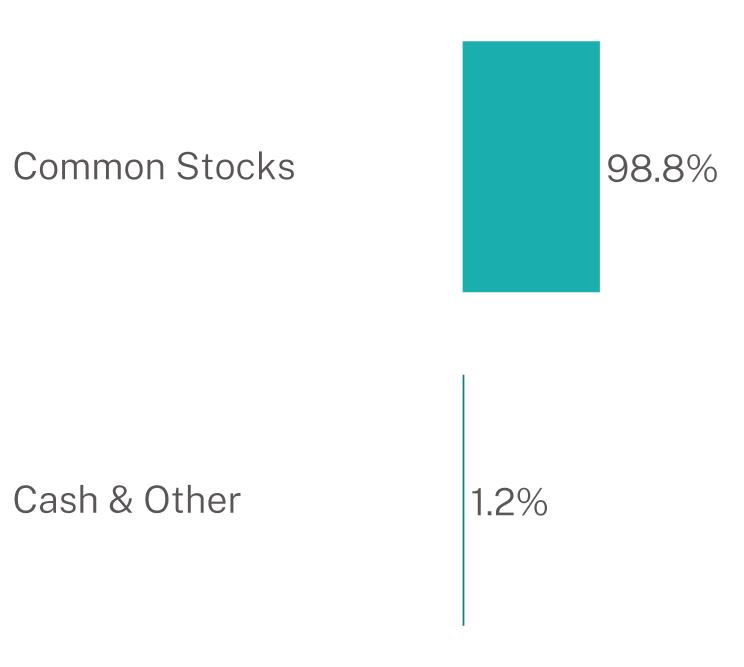
WHAT DID THE FUND INVEST IN? (as of March 31, 2026)
|
Top 10 Issuers
|
(%)
|
|
NVIDIA Corp.
|
8.8%
|
|
Apple, Inc.
|
8.1%
|
|
Alphabet, Inc.
|
6.9%
|
|
Microsoft Corp.
|
5.9%
|
|
Amazon.com, Inc.
|
4.7%
|
|
Walmart, Inc.
|
3.4%
|
|
Broadcom, Inc.
|
3.1%
|
|
Tesla, Inc.
|
3.1%
|
|
Meta Platforms, Inc.
|
2.7%
|
|
Netflix, Inc.
|
2.4%
|
|
Top Sectors
|
(%)
|
|
Manufacturing
|
50.4%
|
|
Information
|
20.0%
|
|
Retail Trade
|
12.3%
|
|
Professional, Scientific, and Technical Services
|
9.9%
|
|
Administrative and Support and Waste Management and Remediation Services
|
1.8%
|
|
Utilities
|
1.6%
|
|
Accommodation and Food Services
|
0.9%
|
|
Transportation and Warehousing
|
0.7%
|
|
Wholesale Trade
|
0.5%
|
|
Cash & Other
|
1.9%
|
Security Type Breakdown (%)
Changes to Fund’s Investment Adviser:
Shelton Capital Management became the investment advisor of STF Tactical Growth ETF (TUG) and the STF Tactical Growth & Income ETF (TUGN) on March 30, 2026.
| [1] |
|
||
| [2] |
|