Shareholder Report
Mar. 31, 2026
USD ($)
Holding
This report describes changes to the Fund that occurred during the reporting period.
What were the Fund costs for the last year?
(based on a hypothetical $10,000 investment)
| Fund name | Costs of a $10,000 investment |
Costs paid as a percentage of a $10,000 investment |
| $0(a) | 0.00%(b) |
| Rounds to less than $1. |
| Rounds to less than 0.01%. |
How did the Fund perform last year?
- For the reporting period ended March 31, 2026, the Fund returned 5.06%.
- For the same period, the Fund's benchmark, the Bloomberg U.S. Aggregate Bond Index returned 4.35% and the Bloomberg U.S. Credit Index returned 4.84%.
What contributed to performance?
The Fund’s allocation to the banking was the largest contributor to the performance, followed by utilities and capital securities.
What detracted from performance?
The Fund’s allocation to retailers was the largest detractor, followed by other financials and integrated energy.
The views expressed reflect the opinions of BlackRock as of the date of this report and are subject to change based on changes in market, economic or other conditions. These views are not intended to be a forecast of future events and are no guarantee of future results.
Fund performance
Cumulative performance: April 1, 2016 through March 31, 2026
Initial investment of $10,000

See “Average annual total returns” for additional information on fund performance.
Average annual total returns
| 1 Year | 5 Years | 10 Years | |||
| 5.06 | % | 1.09 | % | 3.11 | % |
| 4.35 | 0.31 | 1.70 | |||
| 4.84 | 0.77 | 2.70 |
Key Fund statistics
| $503,463,738 |
| 867 |
| $0 |
| 158% |
What did the Fund invest in?
(as of March 31, 2026)
Portfolio composition
| Investment Type | Percent of Total Investments(a) |
|
| 88.0 | % | |
| 4.7 | ||
| 3.4 | ||
| 2.5 | ||
| 0.8 | ||
| 0.6 |
Credit quality allocation
| Credit Rating(b) | Percent of Total Investments(a) |
|
| 2.7 | % | |
| 6.8 | ||
| 32.4 | ||
| 55.8 | ||
| 1.1 | ||
| 1.2 |
| Excludes short-term securities, short investments and options, if any. |
| For purposes of this report, credit quality ratings shown above reflect the highest rating assigned by either S&P Global Ratings or Moody’s Investors Service, Inc. if ratings differ. These rating agencies are independent, nationally recognized statistical rating organizations and are widely used. Investment grade ratings are credit ratings of BBB/Baa or higher. Below investment grade ratings are credit ratings of BB/Ba or lower. Investments designated N/R are not rated by either rating agency. Unrated investments do not necessarily indicate low credit quality. Credit quality ratings are subject to change. |
| The investment adviser evaluates the credit quality of unrated investments based upon certain factors including, but not limited to, credit ratings for similar investments and financial analysis of sectors, individual investments and/or issuers. Using this approach, the investment adviser has deemed unrated U.S. Government Sponsored Agency Securities and/or U.S. Treasury Obligations to be of similar credit quality as investments rated AAA/Aaa. |
Material fund changes
This is a summary of certain changes to the Fund since March 31, 2025. For more complete information, you may review the Fund’s next prospectus, which we expect to be available approximately 120 days after March 31, 2026 at blackrock.com/fundreports or upon request by contacting us at (800) 441-7762.
On June 6, 2025, the Fund’s Board approved a change in the name of BATS: Series C Portfolio to BATS: Corporate Credit Total Return Series. The Fund's Board also approved related changes to the Fund's strategies to under normal circumstances, invest at least 80% of its total assets in corporate fixed-income instruments and derivatives that provide investment exposure to such instruments or to one or more market risk factors associated with such instruments. These changes became effective on October 1, 2025.
This is a summary of certain changes to the Fund since March 31, 2025. For more complete information, you may review the Fund’s next prospectus, which we expect to be available approximately 120 days after March 31, 2026 at blackrock.com/fundreports or upon request by contacting us at (800) 441-7762.
This report describes changes to the Fund that occurred during the reporting period.
What were the Fund costs for the last year?
(based on a hypothetical $10,000 investment)
| Fund name | Costs of a $10,000 investment |
Costs paid as a percentage of a $10,000 investment |
| $0(a) | 0.00%(b) |
| Rounds to less than $1. |
| Rounds to less than 0.01%. |
How did the Fund perform last year?
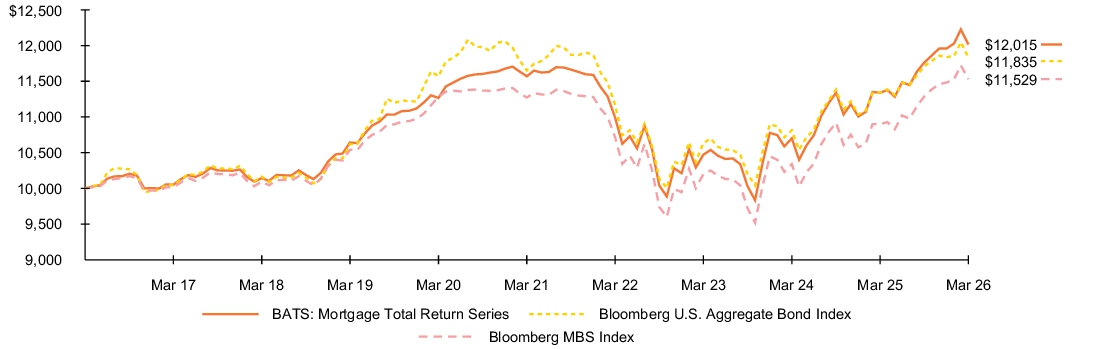
- For the reporting period ended March 31, 2026, the Fund returned 5.97%.
- For the same period, the Fund's benchmark, the Bloomberg U.S. Aggregate Bond Index returned 4.35% and the Bloomberg MBS Index returned 5.79%.
What contributed to performance?
Out-of-benchmark allocations to commercial mortgage-backed securities (“CMBS”) were a leading contributor to performance, specifically single-asset, single-borrower CMBS and last cash flow CMBS. Both fixed-rate collateralized mortgage obligations (“CMOs”) and less interest rate-sensitive CMO floaters also contributed positively. Within agency mortgage-backed securities, the Fund’s active benchmark strategy, which implements relative value decisions between specified pools and to-be-announced securities, contributed positively to performance, along with coupon swap strategies.
What detracted from performance?
The Fund’s active management of duration and corresponding sensitivity to changes in interest rates detracted from performance over the period, along with a tactical overweight in conventional 5.5% coupon mortgage-backed securities.
The views expressed reflect the opinions of BlackRock as of the date of this report and are subject to change based on changes in market, economic or other conditions. These views are not intended to be a forecast of future events and are no guarantee of future results.
Fund performance
Cumulative performance: April 1, 2016 through March 31, 2026
Initial investment of $10,000
See “Average annual total returns” for additional information on fund performance.
Average annual total returns
| 1 Year | 5 Years | 10 Years | |||
| 5.97 | % | 0.76 | % | 1.85 | % |
| 4.35 | 0.31 | 1.70 | |||
| 5.79 | 0.45 | 1.43 |
Key Fund statistics
| $1,496,334,940 |
| 1,244 |
| $0 |
| 931% |
What did the Fund invest in?
(as of March 31, 2026)
Portfolio composition
| Investment Type | Percent of Total Investments(a) |
|
| 92.7 | % | |
| 7.3 | ||
| (b) |
Credit quality allocation
| Credit Rating(c) | Percent of Total Investments(a) |
|
| 95.6 | % | |
| 0.3 | ||
| 0.1 | ||
| 0.1 | ||
| 3.9 |
| Excludes short-term securities, short investments and options, if any. |
| Rounds to less than 0.1%. |
| For purposes of this report, credit quality ratings shown above reflect the highest rating assigned by either S&P Global Ratings or Moody’s Investors Service, Inc. if ratings differ. These rating agencies are independent, nationally recognized statistical rating organizations and are widely used. Investment grade ratings are credit ratings of BBB/Baa or higher. Below investment grade ratings are credit ratings of BB/Ba or lower. Investments designated N/R are not rated by either rating agency. Unrated investments do not necessarily indicate low credit quality. Credit quality ratings are subject to change. |
| The investment adviser evaluates the credit quality of unrated investments based upon certain factors including, but not limited to, credit ratings for similar investments and financial analysis of sectors, individual investments and/or issuers. Using this approach, the investment adviser has deemed unrated U.S. Government Sponsored Agency Securities and/or U.S. Treasury Obligations to be of similar credit quality as investments rated AAA/Aaa. |
Material fund changes
This is a summary of certain changes to the Fund since March 31, 2025. For more complete information, you may review the Fund’s next prospectus, which we expect to be available approximately 120 days after March 31, 2026 at blackrock.com/fundreports or upon request by contacting us at (800) 441-7762.
On June 6, 2025, the Fund’s Board approved a change in the name of BATS: Series M Portfolio to BATS: Mortgage Total Return Series. The Fund's Board also approved related changes to the Fund's strategies to under normal circumstances, invest at least 80% of its net assets, plus the amount of any borrowings for investment purposes, in mortgage-related securities and derivatives that provide investment exposure to such securities or to one or more market risk factors associated with such securities. These changes became effective on October 1, 2025.
This is a summary of certain changes to the Fund since March 31, 2025. For more complete information, you may review the Fund’s next prospectus, which we expect to be available approximately 120 days after March 31, 2026 at blackrock.com/fundreports or upon request by contacting us at (800) 441-7762.
This report describes changes to the Fund that occurred during the reporting period.
What were the Fund costs for the last year?
(based on a hypothetical $10,000 investment)
| Fund name | Costs of a $10,000 investment |
Costs paid as a percentage of a $10,000 investment |
| $0(a) | 0.00%(b) |
| Rounds to less than $1. |
| Rounds to less than 0.01%. |
How did the Fund perform last year?
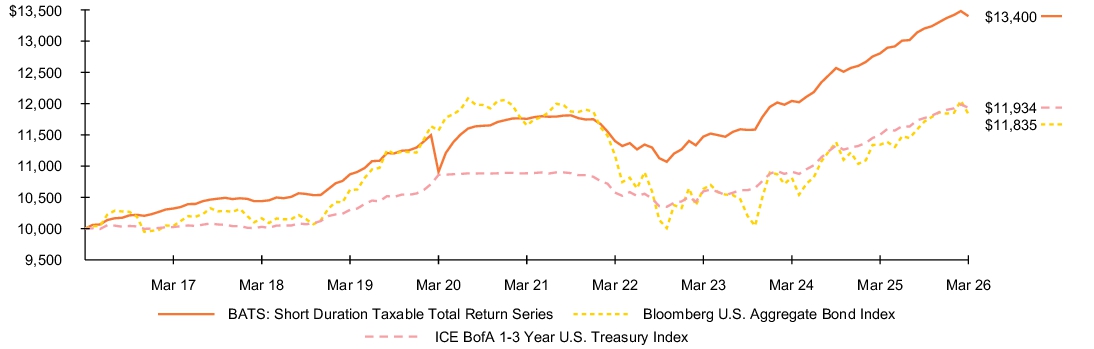
- For the reporting period ended March 31, 2026, the Fund returned 4.67%.
- For the same period, the Fund's benchmark, the Bloomberg U.S. Aggregate Bond Index returned 4.35% and the ICE BofA 1-3 Year U.S. Treasury Index returned 3.75%.
What contributed to performance?
The Fund’s duration and yield curve positioning contributed to absolute returns. (Duration is a measure of interest rate sensitivity). Allocations to U.S. investment grade corporates, asset-backed securities, commercial mortgage-backed securities, non-agency residential mortgage-backed securities (RMBS), agency RMBS, non-U.S. corporates, collateralized loan obligations, and agency debentures, all of which posted gains, further contributed to results.
What detracted from performance?
The Fund used derivatives, including U.S. Treasury futures and fed funds futures to manage duration and yield curve positioning, as well as foreign exchange swaps to manage currency risk. The use of derivatives detracted from performance in the aggregate.
The views expressed reflect the opinions of BlackRock as of the date of this report and are subject to change based on changes in market, economic or other conditions. These views are not intended to be a forecast of future events and are no guarantee of future results.
Fund performance
Cumulative performance: April 1, 2016 through March 31, 2026
Initial investment of $10,000
See “Average annual total returns” for additional information on fund performance.
Average annual total returns
| 1 Year | 5 Years | 10 Years | |||
| 4.67 | % | 2.65 | % | 2.97 | % |
| 4.35 | 0.31 | 1.70 | |||
| 3.75 | 1.86 | 1.79 |
An index that is a subset of ICE BofA US Treasury Index including all securities with a remaining term to final maturity less than 3 years. On December 1, 2023, the Fund began to compare its performance to the standard pricing time of the ICE BofA 1-3 Year U.S. Treasury Index (the “Index”). Index data prior to March 1, 2021 is for the Index’s standard pricing time of 3pm. Index data from March 1, 2021 through November 30, 2023 is for a custom 4pm pricing variant of the Index. Index returns beginning on December 1, 2023 reflect the Index’s new standard pricing time of 4pm. The change of the Index’s standard pricing time from 3pm to 4pm resulted in the discontinuation of the custom 4pm pricing variant used from March 1, 2021 through November 30, 2023.
Key Fund statistics
| $397,907,143 |
| 749 |
| $0 |
| 88% |
What did the Fund invest in?
(as of March 31, 2026)
Portfolio composition
| Investment Type | Percent of Total Investments(a) |
|
| 34.8 | % | |
| 21.7 | ||
| 20.4 | ||
| 14.7 | ||
| 7.9 | ||
| 0.4 | ||
| 0.1 |
Credit quality allocation
| Credit Rating(b) | Percent of Total Investments |
|
| 56.3 | % | |
| 2.5 | ||
| 14.6 | ||
| 18.9 | ||
| 0.1 | ||
| 7.6 |
| Excludes short-term securities, short investments and options, if any. |
| For purposes of this report, credit quality ratings shown above reflect the highest rating assigned by either S&P Global Ratings or Moody’s Investors Service, Inc. if ratings differ. These rating agencies are independent, nationally recognized statistical rating organizations and are widely used. Investment grade ratings are credit ratings of BBB/Baa or higher. Below investment grade ratings are credit ratings of BB/Ba or lower. Investments designated N/R are not rated by either rating agency. Unrated investments do not necessarily indicate low credit quality. Credit quality ratings are subject to change. |
| The investment adviser evaluates the credit quality of unrated investments based upon certain factors including, but not limited to, credit ratings for similar investments and financial analysis of sectors, individual investments and/or issuers. Using this approach, the investment adviser has deemed unrated U.S. Government Sponsored Agency Securities and/or U.S. Treasury Obligations to be of similar credit quality as investments rated AAA/Aaa. |
Material fund changes
This is a summary of certain changes to the Fund since March 31, 2025. For more complete information, you may review the Fund’s next prospectus, which we expect to be available approximately 120 days after March 31, 2026 at blackrock.com/fundreports or upon request by contacting us at (800) 441-7762.
On June 6, 2025, the Fund’s Board approved a change in the name of BATS: Series S Portfolio to BATS: Short Duration Taxable Total Return Series. This change became effective on October 1, 2025.
On June 6, 2025, the Fund’s Board approved a change in the name of BATS: Series S Portfolio to BATS: Short Duration Taxable Total Return Series. This change became effective on October 1, 2025.
This is a summary of certain changes to the Fund since March 31, 2025. For more complete information, you may review the Fund’s next prospectus, which we expect to be available approximately 120 days after March 31, 2026 at blackrock.com/fundreports or upon request by contacting us at (800) 441-7762.
This report describes changes to the Fund that occurred during the reporting period.
What were the Fund costs for the last year?
(based on a hypothetical $10,000 investment)
| Fund name | Costs of a $10,000 investment |
Costs paid as a percentage of a $10,000 investment |
| $0(a) | 0.00%(b) |
| Rounds to less than $1. |
| Rounds to less than 0.01%. |
How did the Fund perform last year?
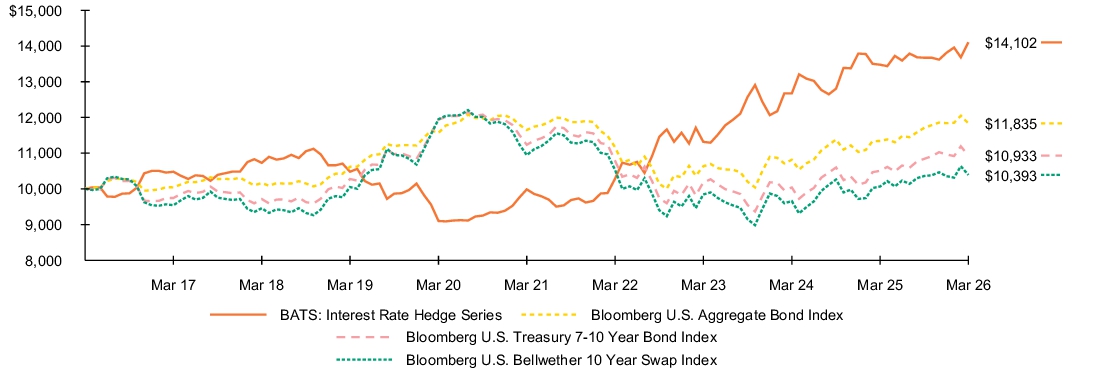
- For the reporting period ended March 31, 2026, the Fund returned 4.64%.
- For the same period, the Fund's benchmark, the Bloomberg U.S. Aggregate Bond Index returned 4.35% and the Bloomberg U.S. Treasury 7-10 Year Bond Index returned 4.05%.
What contributed to performance?
The Fund’s duration and yield curve positioning contributed to absolute returns. (Duration is a measure of interest rate sensitivity). Holdings in cash, U.S. interest rate and U.S. Treasury derivatives, and the BATS: Short Duration Taxable Total Return Series further contributed.
The use and cost of derivatives will result in a negative contribution to returns when interest rates fall; however, the Fund’s strategy is designed to offset these costs by holding shares of BATS: Short Duration Taxable Total return Series a short-term proprietary fund. The use of derivatives is necessary to achieve the Fund’s objective and should therefore be evaluated in a portfolio context and not as a standalone strategy. The Fund's cash position had no material impact on performance.
The Fund’s weighting in cash exceeded 5% throughout the period due to the use of interest rate derivatives that facilitate inverse exposure to the 7- to 10- year part of the U.S. Treasury yield curve.
What detracted from performance?
At the time of positive returns for the Fund, no aspects of its positioning stood out as meaningful detractors.
The views expressed reflect the opinions of BlackRock as of the date of this report and are subject to change based on changes in market, economic or other conditions. These views are not intended to be a forecast of future events and are no guarantee of future results.
Fund performance
Cumulative performance: April 1, 2016 through March 31, 2026
Initial investment of $10,000
See “Average annual total returns” for additional information on fund performance.
Average annual total returns
| 1 Year | 5 Years | 10 Years | |||
| 4.64 | % | 7.14 | % | 3.50 | % |
| 4.35 | 0.31 | 1.70 | |||
| 4.05 | (0.55 | ) | 0.90 | ||
| 3.22 | (1.03 | ) | 0.39 |
Key Fund statistics
| $2,569,778 |
| 13 |
| $0 |
| 0% |
What did the Fund invest in?
(as of March 31, 2026)
Portfolio composition
| Investment Type | Percent of Total Investments |
|
| 27.9 | % | |
| 72.1 |
Material fund changes
This is a summary of certain changes to the Fund since March 31, 2025. For more complete information, you may review the Fund’s next prospectus, which we expect to be available approximately 120 days after March 31, 2026 at blackrock.com/fundreports or upon request by contacting us at (800) 441-7762.
On June 6, 2025, the Fund’s Board approved a change in the name of BATS: Series P Portfolio to BATS: Interest Rate Hedge Series. This change became effective on October 1, 2025.
On June 6, 2025, the Fund’s Board approved a change in the name of BATS: Series P Portfolio to BATS: Interest Rate Hedge Series. This change became effective on October 1, 2025.
This is a summary of certain changes to the Fund since March 31, 2025. For more complete information, you may review the Fund’s next prospectus, which we expect to be available approximately 120 days after March 31, 2026 at blackrock.com/fundreports or upon request by contacting us at (800) 441-7762.
This report describes changes to the Fund that occurred during the reporting period.
What were the Fund costs for the last year?
(based on a hypothetical $10,000 investment)
| Fund name | Costs of a $10,000 investment |
Costs paid as a percentage of a $10,000 investment |
| $0(a) | 0.18% |
| Rounds to less than $1. |
How did the Fund perform last year?
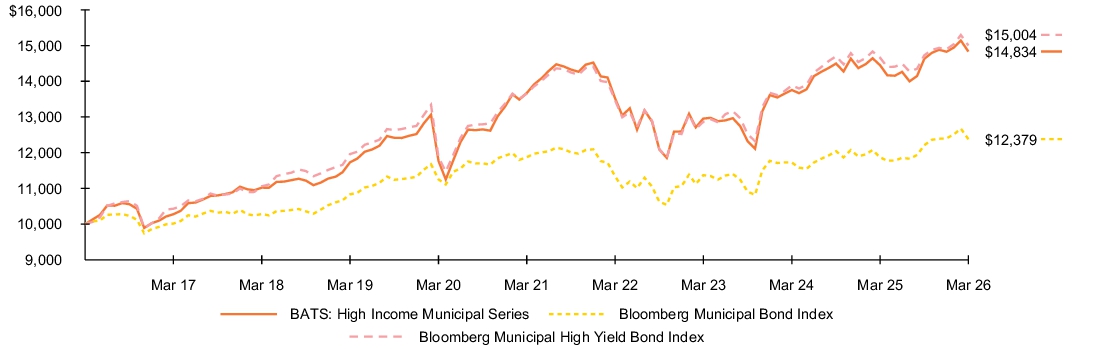
- For the reporting period ended March 31, 2026, the Fund returned 2.66%.
- For the same period, the Fund's benchmark, the Bloomberg Municipal Bond Index returned 4.29% and the Bloomberg Municipal High Yield Bond Index returned 2.35%.
What contributed to performance?
Fund performance benefited from strength across several sectors, including other industries, utilities, corporate-backed, and tax-backed state. Results were further supported by holdings in longer-dated bonds, particularly those with maturities of 20 years and above, as well as positions in non rated, AA, BB, and BBB rated securities. Higher-coupon bonds also contributed meaningfully. The Fund's cash position had no material impact on performance.
What detracted from performance?
Transportation was the largest detractor at the sector level, due in part to weakness in Brightline, a project finance, transportation-related holding. Underperformance for short-dated issues, particularly bonds with maturities of less than three years, also pressured results. Positions in lower-coupon bonds detracted, as well.
The views expressed reflect the opinions of BlackRock as of the date of this report and are subject to change based on changes in market, economic or other conditions. These views are not intended to be a forecast of future events and are no guarantee of future results.
Fund performance
Cumulative performance: April 1, 2016 through March 31, 2026
Initial investment of $10,000
See “Average annual total returns” for additional information on fund performance.
Average annual total returns
| 1 Year | 5 Years | 10 Years | |||
| 2.66 | % | 1.65 | % | 4.02 | % |
| 4.29 | 0.84 | 2.16 | |||
| 2.35 | 1.90 | 4.14 | |||
| 3.06 | 1.57 |
Key Fund statistics
| $622,658,741 |
| 761 |
| $0 |
| 36% |
What did the Fund invest in?
(as of March 31, 2026)
Sector allocation
| Sector | Percent of Total Investments |
|
| 41.7 | % | |
| 16.9 | ||
| 13.5 | ||
| 10.3 | ||
| 9.4 | ||
| 4.6 | ||
| 3.6 | ||
| (a) |
Credit quality allocation
| Credit Rating(b) | Percent of Total Investments |
|
| 3.4 | % | |
| 19.3 | ||
| 9.2 | ||
| 9.0 | ||
| 6.3 | ||
| 1.6 | ||
| 0.3 | ||
| 50.9 |
| Rounds to less than 0.1%. |
| For purposes of this report, credit quality ratings shown above reflect the highest rating assigned by either S&P Global Ratings or Moody’s Investors Service, Inc. if ratings differ. These rating agencies are independent, nationally recognized statistical rating organizations and are widely used. Investment grade ratings are credit ratings of BBB/Baa or higher. Below investment grade ratings are credit ratings of BB/Ba or lower. Investments designated N/R are not rated by either rating agency. Unrated investments do not necessarily indicate low credit quality. Credit quality ratings are subject to change. |
Material fund changes
This is a summary of certain changes to the Fund since March 31, 2025. For more complete information, you may review the Fund’s next prospectus, which we expect to be available approximately 120 days after March 31, 2026 at blackrock.com/fundreports or upon request by contacting us at (800) 441-7762.
On June 6, 2025, the Fund’s Board approved a change in the name of BATS: Series E Portfolio to BATS: High Income Municipal Series. The Fund's Board also approved related changes to the Fund's strategies to under normal circumstances, invest at least 80% of its net assets, plus the amount of any borrowings for investment purposes, in investments the income of which is free from federal income tax and derivatives that provide investment exposure to such securities or to one or more market risk factors associated with such securities. These changes became effective on October 1, 2025.
The net expense ratio increased from the prior fiscal year end primarily due to an increase in expenses related to financing activities.
The net expense ratio increased from the prior fiscal year end primarily due to an increase in expenses related to financing activities.
This is a summary of certain changes to the Fund since March 31, 2025. For more complete information, you may review the Fund’s next prospectus, which we expect to be available approximately 120 days after March 31, 2026 at blackrock.com/fundreports or upon request by contacting us at (800) 441-7762.
This report describes changes to the Fund that occurred during the reporting period.
What were the Fund costs for the last year?
(based on a hypothetical $10,000 investment)
| Fund name | Costs of a $10,000 investment |
Costs paid as a percentage of a $10,000 investment |
| $0(a) | 0.00%(b) |
| Rounds to less than $1. |
| Rounds to less than 0.01%. |
How did the Fund perform last year?
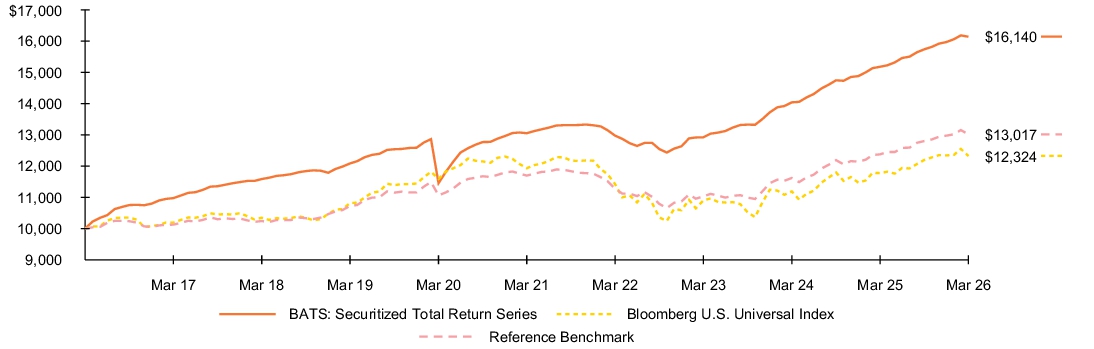
- For the reporting period ended March 31, 2026, the Fund returned 6.34%.
- For the same period, the Fund's benchmark, the Bloomberg U.S. Universal Index returned 4.64% and the Reference Benchmark returned 5.19%.
What contributed to performance?
All securitized asset classes contributed positively to the Fund’s performance, with contributions led by exposure to AAA-rated collateralized loan obligations. This was followed by holdings of single asset/single borrower senior tranches within commercial mortgage-backed securities and non-qualifying loans within residential mortgage-backed securities (“RMBS”). Exposure to non-performing/re-performing loans as well as legacy (pre-2008 financial crisis) loans within RMBS contributed as well. Finally, holdings of asset-backed securities with private student loans as underlying collateral proved additive. The Fund's cash position had no material impact on performance.
The Fund held some private whole loan securities including commercial mortgage loans and consumer whole loans. These private holdings also produced positive returns.
What detracted from absolute performance?
There were no detractors from the Fund’s performance over the reporting period.
The views expressed reflect the opinions of BlackRock as of the date of this report and are subject to change based on changes in market, economic or other conditions. These views are not intended to be a forecast of future events and are no guarantee of future results.
Fund performance
Cumulative performance: April 1, 2016 through March 31, 2026
Initial investment of $10,000
See “Average annual total returns” for additional information on fund performance.
Average annual total returns
| 1 Year | 5 Years | 10 Years | |||
| 6.34 | % | 4.34 | % | 4.90 | % |
| 4.64 | 0.65 | 2.11 | |||
| 5.19 | 2.17 | 2.67 |
Key Fund statistics
| $5,097,940,616 |
| 2,026 |
| $0 |
| 59% |
What did the Fund invest in?
(as of March 31, 2026)
Portfolio composition
| Investment Type | Percent of Total Investments(a) |
|
| 52.7 | % | |
| 46.5 | ||
| 0.4 | ||
| 0.4 | ||
| (b) |
Credit quality allocation
| Credit Rating(c) | Percent of Total Investments(a) |
|
| 36.6 | % | |
| 3.5 | ||
| 3.1 | ||
| 2.9 | ||
| 1.8 | ||
| 0.9 | ||
| 2.2 | ||
| 0.4 | ||
| 0.1 | ||
| 48.5 |
| Excludes short-term securities, short investments and options, if any. |
| Rounds to less than 0.1%. |
| For purposes of this report, credit quality ratings shown above reflect the highest rating assigned by either S&P Global Ratings or Moody’s Investors Service, Inc. if ratings differ. These rating agencies are independent, nationally recognized statistical rating organizations and are widely used. Investment grade ratings are credit ratings of BBB/Baa or higher. Below investment grade ratings are credit ratings of BB/Ba or lower. Investments designated N/R are not rated by either rating agency. Unrated investments do not necessarily indicate low credit quality. Credit quality ratings are subject to change. |
| The investment adviser evaluates the credit quality of unrated investments based upon certain factors including, but not limited to, credit ratings for similar investments and financial analysis of sectors, individual investments and/or issuers. Using this approach, the investment adviser has deemed unrated U.S. Government Sponsored Agency Securities and/or U.S. Treasury Obligations to be of similar credit quality as investments rated AAA/Aaa. |
Material fund changes
This is a summary of certain changes to the Fund since March 31, 2025. For more complete information, you may review the Fund’s next prospectus, which we expect to be available approximately 120 days after March 31, 2026 at blackrock.com/fundreports or upon request by contacting us at (800) 441-7762.
On June 6, 2025, the Fund’s Board approved a change in the name of BATS: Series A Portfolio to BATS: Securitized Total Return Series. The Fund's Board also approved related changes to the Fund's strategies to under normal circumstances, invest at least 80% of its net assets, plus the amount of any borrowings for investment purposes, in securitized assets and derivatives that provide investment exposure to such assets or to one or more market risk factors associated with such assets. These changes became effective on October 1, 2025.
This is a summary of certain changes to the Fund since March 31, 2025. For more complete information, you may review the Fund’s next prospectus, which we expect to be available approximately 120 days after March 31, 2026 at blackrock.com/fundreports or upon request by contacting us at (800) 441-7762.
This report describes changes to the Fund that occurred during the reporting period.
What were the Fund costs for the last year?
(based on a hypothetical $10,000 investment)
| Fund name | Costs of a $10,000 investment |
Costs paid as a percentage of a $10,000 investment |
| $0(a) | 0.00%(b) |
| Rounds to less than $1. |
| Rounds to less than 0.01%. |
How did the Fund perform last year?
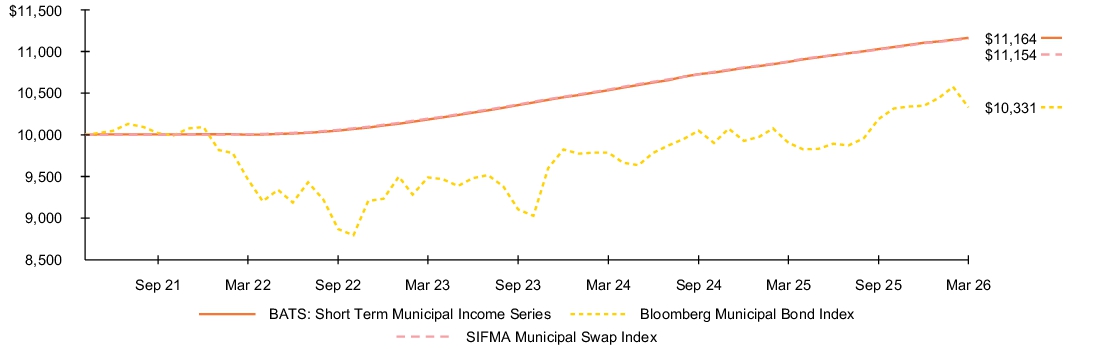
- For the reporting period ended March 31, 2026, the Fund returned 2.65%.
- For the same period, the Fund's benchmark, the Bloomberg Municipal Bond Index returned 4.29% and the SIFMA Municipal Swap Index returned 2.51%.
What contributed to performance?
The Fund maintained high levels of liquidity while providing an attractive yield primarily through its holdings of one- and seven-day variable rate demand notes (“VRDNs”). The Fund also opportunistically laddered maturities between 30 and 120 days in municipal commercial paper and select fixed-rate, tax-backed local credits, through both municipal notes and bonds. Additionally, fixed-rate bonds in the school district, utility and housing sectors added durable yield. In credit quality terms, AA-rated bonds provided the greatest return, followed by non-rated notes and then AAA-rated bonds. From a maturity perspective, return contributions were led by holdings of municipal cash securities including VRDNs, commercial paper and municipal notes, followed by bonds with maturities of one year or less and then bonds with maturities between one and two years. The Fund's cash position had no material impact on performance.
The Fund’s weighted average maturity (“WAM”) of 51 days remained longer than the benchmark WAM of 7 days as the Fund continued to remain opportunistic given the attractive rate environment, taking advantage of select purchases when fixed-rate yields appeared attractive relative to expected VRDN yields.
What detracted from performance?
There were no material detractors from the Fund’s performance over the period.
The views expressed reflect the opinions of BlackRock as of the date of this report and are subject to change based on changes in market, economic or other conditions. These views are not intended to be a forecast of future events and are no guarantee of future results.
Fund performance
Cumulative performance: May 5, 2021 through March 31, 2026
Initial investment of $10,000
See “Average annual total returns” for additional information on fund performance.
Average annual total returns
| 1 Year | Since Fund Inception |
||
| 2.65 | % | 2.27 | % |
| 4.29 | 0.67 | ||
| 2.51 | 2.25 |
Key Fund statistics
| $95,087,225 |
| 95 |
| $0 |
| 34% |
What did the Fund invest in?
(as of March 31, 2026)
Sector allocation
| Sector | Percent of Total Investments |
|
| 28.5 | % | |
| 26.1 | ||
| 18.0 | ||
| 17.0 | ||
| 7.7 | ||
| 2.7 |
Material fund changes
This is a summary of certain changes to the Fund since March 31, 2025. For more complete information, you may review the Fund’s next prospectus, which we expect to be available approximately 120 days after March 31, 2026 at blackrock.com/fundreports or upon request by contacting us at (800) 441-7762.
On June 6, 2025, the Fund’s Board approved a change in the name of BATS: Series V Portfolio to BATS: Short Term Municipal Income Series. The Fund's Board also approved related changes to the Fund's strategies to under normal circumstances, invest at least 80% of its net assets, plus the amount of any borrowings for investment purposes, in investments the income of which is free from federal income tax and derivatives that provide investment exposure to such securities or to one or more market risk factors associated with such securities. These changes became effective on October 1, 2025.
This is a summary of certain changes to the Fund since March 31, 2025. For more complete information, you may review the Fund’s next prospectus, which we expect to be available approximately 120 days after March 31, 2026 at blackrock.com/fundreports or upon request by contacting us at (800) 441-7762.
| [1] | Rounds to less than $1. |
| [2] | Rounds to less than 0.01%. |
| [3] | Rounds to less than $1. |
| [4] | Rounds to less than 0.01%. |
| [5] | Rounds to less than $1. |
| [6] | Rounds to less than 0.01%. |
| [7] | Rounds to less than $1. |
| [8] | Rounds to less than 0.01%. |
| [9] | Rounds to less than $1. |
| [10] | Rounds to less than $1. |
| [11] | Rounds to less than 0.01%. |
| [12] | Rounds to less than $1. |
| [13] | Rounds to less than 0.01%. |