Shareholder Report
|
12 Months Ended |
|
Mar. 31, 2026
USD ($)
Holding
|
|---|
| Shareholder Report [Line Items] |
|
| Document Type |
N-CSR
|
| Amendment Flag |
false
|
| Registrant Name |
POPULAR TOTAL RETURN FUND INC
|
| Entity Central Index Key |
0001137184
|
| Entity Investment Company Type |
N-1A
|
| Document Period End Date |
Mar. 31, 2026
|
| C000232082 |
|
| Shareholder Report [Line Items] |
|
| Fund Name |
POPULAR TOTAL RETURN FUND, INC.
|
| Class Name |
CLASS A
|
| Trading Symbol |
TRAFX
|
| Annual or Semi-Annual Statement [Text Block] |
This annual shareholder report contains important information about Popular Total Return Fund, Inc. - Class A Shares for the period of April 1, 2025 to March 31, 2026.
|
| Shareholder Report Annual or Semi-Annual |
annual shareholder report
|
| Additional Information [Text Block] |
You can find additional information about the Fund at https://www.popularfunds.com/total-return-fund. You can also request this information by contacting us at 787-758-7400.
|
| Additional Information Phone Number |
787-758-7400
|
| Additional Information Website |
<span style="box-sizing: border-box; color: rgb(99, 101, 102); display: inline; flex-wrap: nowrap; font-size: 12px; font-weight: 400; grid-area: auto; line-height: 12px; margin: 0px; overflow: visible; text-align: left; text-align-last: auto; white-space-collapse: preserve-breaks;">https://www.popularfunds.com/total-return-fund</span>
|
| Expenses [Text Block] |
What were the Fund’s costs for the last year? (based on a hypothetical $10,000 investment) Table SummaryClass Name | Cost of a $10,000 Investment | Cost Paid as a percentage of a $10,000 Investment (annualized) |
|---|
Class A Shares | $164 | 1.64% |
|---|
|
| Expenses Paid, Amount |
$ 164
|
| Expense Ratio, Percent |
1.64%
|
| Performance Past Does Not Indicate Future [Text] |
Performance data quoted represents past performance and does not guarantee future results.
|
| Performance Inception Date |
May 21, 2021
|
| No Deduction of Taxes [Text Block] |
The table and graph presented above do not reflect the deduction of taxes a shareholder would pay on fund distributions or the redemption of fund shares.
|
| AssetsNet |
$ 68,177,969
|
| Holdings Count | Holding |
44
|
| Advisory Fees Paid, Amount |
$ 348,250
|
| InvestmentCompanyPortfolioTurnover |
18.00%
|
| Additional Fund Statistics [Text Block] |
Fund Statistics as of March 31, 2026- Total Net Assets$68,177,969
- # of Portfolio Holdings44
- Portfolio Turnover Rate18%
- Advisory Fees Paid$348,250
|
| Holdings [Text Block] |
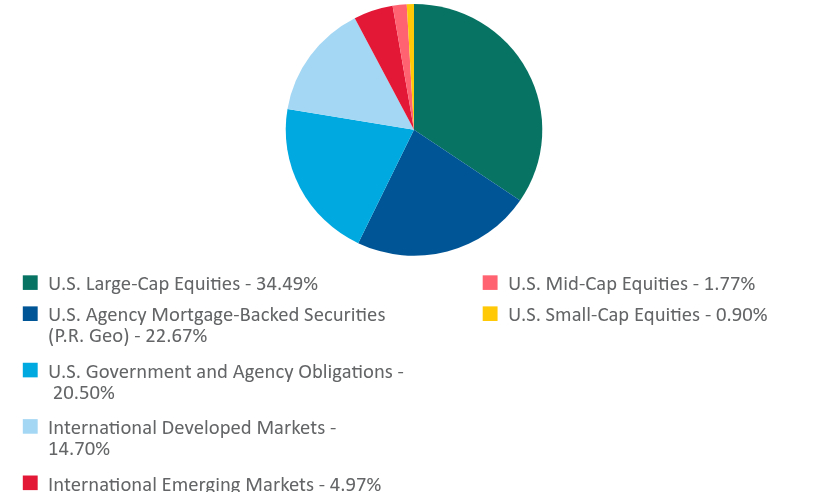
Portfolio Weightings(% of Total Investments) Table SummaryValue | Value |
|---|
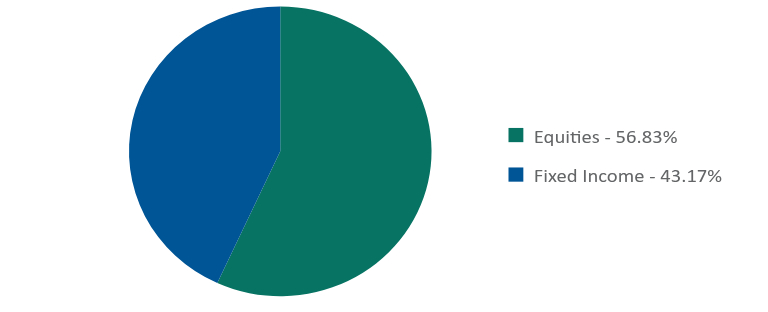
U.S. Large-Cap Equities - | 34.49% | U.S. Agency Mortgage-Backed Securities (P.R. Geo) - | 22.67% | U.S. Government and Agency Obligations - | 20.50% | International Developed Markets - | 14.70% | International Emerging Markets - | 4.97% | U.S. Mid-Cap Equities - | 1.77% | U.S. Small-Cap Equities - | 0.90% | Asset Class Weightings(% of Total Investments) Table SummaryValue | Value |
|---|
Equities - | 56.83% | Fixed Income - | 43.17% | |
| Largest Holdings [Text Block] |
Top Ten Holdings(% of Net Assets)Table SummaryTop 10 | Top 10 |
|---|
Vanguard S&P 500 ETF | 34.60% | Vanguard FTSE Developed Markets ETF | 14.75% | Vanguard FTSE Emerging Markets ETF | 4.99% | United States Treasury Bill 04/23/2026 | 4.93% | U.S. Treasury Note 11/30/2028 | 2.64% | Fannie Mae Pool CB1152 07/01/2051 | 2.47% | U.S. Treasury Note 07/31/2026 | 2.04% | Ginnie Mae II Pool BQ2093 04/20/2051 | 1.87% | U.S. Treasury Note 08/31/2026 | 1.83% | U.S. Treasury Bond 08/15/2034 | 1.79% | |
| C000232083 |
|
| Shareholder Report [Line Items] |
|
| Fund Name |
POPULAR TOTAL RETURN FUND, INC.
|
| Class Name |
CLASS C
|
| Trading Symbol |
TRCFX
|
| Annual or Semi-Annual Statement [Text Block] |
This annual shareholder report contains important information about Popular Total Return Fund, Inc. - Class C Shares for the period of April 1, 2025 to March 31, 2026.
|
| Shareholder Report Annual or Semi-Annual |
annual shareholder report
|
| Additional Information [Text Block] |
You can find additional information about the Fund at https://www.popularfunds.com/total-return-fund. You can also request this information by contacting us at 787-758-7400.
|
| Additional Information Phone Number |
787-758-7400
|
| Additional Information Website |
<span style="box-sizing: border-box; color: rgb(99, 101, 102); display: inline; flex-wrap: nowrap; font-size: 12px; font-weight: 400; grid-area: auto; line-height: 12px; margin: 0px; overflow: visible; text-align: left; text-align-last: auto; white-space-collapse: preserve-breaks;">https://www.popularfunds.com/total-return-fund</span>
|
| Expenses [Text Block] |
What were the Fund’s costs for the last year? (based on a hypothetical $10,000 investment) Table SummaryClass Name | Cost of a $10,000 Investment | Cost Paid as a percentage of a $10,000 Investment (annualized) |
|---|
Class C Shares | $240 | 2.40% |
|---|
|
| Expenses Paid, Amount |
$ 240
|
| Expense Ratio, Percent |
2.40%
|
| Performance Past Does Not Indicate Future [Text] |
Performance data quoted represents past performance and does not guarantee future results.
|
| Performance Inception Date |
May 21, 2021
|
| No Deduction of Taxes [Text Block] |
The table and graph presented above do not reflect the deduction of taxes a shareholder would pay on fund distributions or the redemption of fund shares.
|
| AssetsNet |
$ 68,177,969
|
| Holdings Count | Holding |
44
|
| Advisory Fees Paid, Amount |
$ 348,250
|
| InvestmentCompanyPortfolioTurnover |
18.00%
|
| Additional Fund Statistics [Text Block] |
Fund Statistics as of March 31, 2026- Total Net Assets$68,177,969
- # of Portfolio Holdings44
- Portfolio Turnover Rate18%
- Advisory Fees Paid$348,250
|
| Holdings [Text Block] |
Portfolio Weightings(% of Total Investments) Table SummaryValue | Value |
|---|
U.S. Large-Cap Equities - | 34.49% | U.S. Agency Mortgage-Backed Securities (P.R. Geo) - | 22.67% | U.S. Government and Agency Obligations - | 20.50% | International Developed Markets - | 14.70% | International Emerging Markets - | 4.97% | U.S. Mid-Cap Equities - | 1.77% | U.S. Small-Cap Equities - | 0.90% | Asset Class Weightings(% of Total Investments) Table SummaryValue | Value |
|---|
Equities - | 56.83% | Fixed Income - | 43.17% | |
| Largest Holdings [Text Block] |
Top Ten Holdings(% of Net Assets)Table SummaryTop 10 | Top 10 |
|---|
Vanguard S&P 500 ETF | 34.60% | Vanguard FTSE Developed Markets ETF | 14.75% | Vanguard FTSE Emerging Markets ETF | 4.99% | United States Treasury Bill 04/23/2026 | 4.93% | U.S. Treasury Note 11/30/2028 | 2.64% | Fannie Mae Pool CB1152 07/01/2051 | 2.47% | U.S. Treasury Note 07/31/2026 | 2.04% | Ginnie Mae II Pool BQ2093 04/20/2051 | 1.87% | U.S. Treasury Note 08/31/2026 | 1.83% | U.S. Treasury Bond 08/15/2034 | 1.79% | |